


Introduction
Tropical peatlands are the world’s most carbon-dense terrestrial ecosystems (Temmink et al. Reference Temmink, Lamers, Angelini, Bouma, Fritz, van de Koppel, Lexmond, Rietkerk, Silliman, Joosten and van der Heide2022). Peats in tropical peat forests are derived from woody plant material, which makes them distinct from more familiar temperate peat derived from Sphagnum moss (Rydin & Jeglum, Reference Rydin and Jeglum2006). Tropical peatlands are characterized by waterlogged conditions that slow the decomposition of wood, leaf, and root litter, leading to the accumulation of organic material over thousands of years into carbon-rich deposits that may be up to 20 m thick (Anderson, Reference Anderson and Gore1983). An estimated 105 Gt of organic carbon, equivalent to 30% of the carbon that is held in tropical rainforests globally (Page et al. Reference Page, Mishra, Agus, Anshari, Dargie, Evers and Evans2022), is stored in tropical peatlands, even though tropical peatlands only occupy less than 1% of the global land surface area (Page et al. Reference Page, Rieley and Banks2011, Page et al. Reference Page, Mishra, Agus, Anshari, Dargie, Evers and Evans2022, Temmink et al. Reference Temmink, Lamers, Angelini, Bouma, Fritz, van de Koppel, Lexmond, Rietkerk, Silliman, Joosten and van der Heide2022). Tropical peatlands are therefore substantive long-term stores of carbon that play an important role in the global carbon cycle (Ribeiro et al. Reference Ribeiro, Pacheco, Ferreira, de Sousa-Neto, Hastie, Krieger Filho and Ometto2021). However, in Southeast Asia, which is believed to host roughly half of the world’s tropical peatlands (Page et al. Reference Page, Rieley and Banks2011, Crezee et al. Reference Crezee, Dargie, Ewango, Mitchard, Emba, Kanyama, Bola, Ndjango, Girkin, Bocko, Ifo, Hubau, Seidensticker, Batumike, Imani, Cuní-Sanchez, Kiahtipes, Lebamba, Wotzka and Lewis2022, Hastie et al. Reference Hastie, Honorio Coronado, Reyna, Mitchard, Åkesson, Baker, Cole, Oroche, Dargie, Dávila, De Grandi, Del Águila, Del Castillo Torres, De La Cruz Paiva, Draper, Flores, Grández, Hergoualc’h, Householder and Lawson2022, Page et al. Reference Page, Mishra, Agus, Anshari, Dargie, Evers and Evans2022), there has been extensive deforestation, drainage, and fires in tropical peatlands over the past 30 years, and across Peninsular Malaysia, Sumatra, and Borneo less than 30% of the region’s original peat forest remains (Miettinen et al. Reference Miettinen, Shi and Liew2016). These changes are converting these ecosystems from carbon sinks to greenhouse gas emitters (Murdiyarso et al. Reference Murdiyarso, Hergoualc’h and Verchot2010, Hooijer et al. Reference Hooijer, Page, Jauhiainen, Lee, Lu, Idris and Anshari2012, Mishra et al. Reference Mishra, Page, Cobb, Lee, Jovani-Sancho, Sjögersten and Wardle2021).
Despite the pivotal role of tropical peat forests in carbon sequestration, the biological implications arising from peat accumulation and the near-continual waterlogging of peatland soils for community and ecosystem properties in these forests are not well understood either aboveground or belowground. Adaptations to prolonged waterlogging have been observed for some plant species. For instance, in a peat forest in Malaysia, plants growing in waterlogged sites exhibit an increased presence of stilt roots, pneumatophores, and knee roots, along with thicker roots, than do the same species in drier sites (Pahang Forestry Department 2005). In southern Thailand, waterlogged peat forests were found to have a diverse microbial community capable of versatile metabolic processes (Kanokratana et al. Reference Kanokratana, Uengwetwanit, Rattanachomsri, Bunterngsook, Nimchua, Tangphatsornruang and Eurwilaichitr2011). In Indonesia, near-intact peat swamps had a significantly greater microbial biomass than degraded and drained peatland, with water drainage profoundly impacting CO2 flux rates (Könönen et al. Reference Könönen, Jauhiainen, Straková, Heinonsalo, Laiho, Kusin and Vasander2018; Jauhiainen et al. Reference Jauhiainen, Limin, Silvennoinen and Vasander2008). However, our understanding of how tropical peat forests function, particularly in comparison to other well-drained tropical forests in the same region, is limited (Miyamoto et al. Reference Miyamoto, Kohyama, Rahajoe, Mirmanto, Simbolon, Osaki and Tsuji2016). The shortage of comparative studies between peat and adjacent non-peat forests hinders our ability to understand the dynamics and functioning of tropical peat ecosystems within a broader ecological context.
Brunei features extensive areas of both intact and semi-pristine forests, which unlike the forests elsewhere in Southeast Asia, have not been heavily cleared or degraded. The forested areas consist of a mosaic of forest types, including both peatlands and kerangas forests, the latter being a term from the local Iban language for the heath forests in Borneo with soils that are too infertile for rice cultivation (Brunig Reference Brunig1974). Brunei peat forests are established on waterlogged accumulated organic matter that can be 8–15 m thick (Kobayashi Reference Kobayashi, Osaki and Tsuji2016). In contrast, kerangas forests are established on free-draining white-sand soils, overlaid with a layer of humus that is up to 0.7 m thick (Brunig Reference Brunig1974, Katagiri et al. Reference Katagiri, Yamakura and Lee1991, Din et al. Reference Din, Metali and Sukri2015). The plant families within each of these two forest types have evolved distinct adaptations to cope with their specific environments. Many trees in peatlands are tall growing and develop buttresses for stability as well as knee roots and pneumatophores for gas exchange in waterlogged conditions (Yule Reference Yule2010). Trees in kerangas forests are typically shorter, unbuttressed, and exhibit sclerophylly, which is characterized by small, thick leaves with low nitrogen content, as an adaptation to water stress and nutrient-poor conditions (Becker et al. Reference Becker, Davies, Moksin, Ismail and Simanjuntak1999, Turner et al. Reference Turner, Lucas, Becker, Wong, Yong, Choong and Tyree2000, Whitmore Reference Whitmore1984). In Southeast Asia, this includes the Dipterocarpaceae (a dominant family in both forest types of our study), which has previously been shown to exhibit significant adaptability by varying growth characteristics and traits among habitats (Chan Reference Chan2016). While these individual adaptations are recognized, a more comprehensive understanding of the functional differences between peat and kerangas forests is lacking.
In this study, we set up a paired plot experiment to assess above-ground and below-ground properties in adjacent patches of peat and kerangas forest. Our aim was to unravel how contrasting environmental conditions of peat and kerangas influence their floristic composition, leaf traits, and soil nutrient characteristics. We tested the following three hypotheses to accomplish this aim: (H1) Total nutrients will be higher in peat soil compared to kerangas soil because the former has more organic matter whereas available nutrients will be higher in kerangas due to impaired mineralization in the anoxic environment of the peat. (H2) The nutrient-poor conditions and additional adaptations needed for plants to survive in the waterlogged environment of peat forest will promote a greater diversity of trees (as a result of greater coexistence through reduced competition; Grime Reference Grime1979), a higher frequency of trees with larger diameters (due to their better anchorage and mechanical stability in deep peat), and more taxa with nutrient strategies needed to cope with lower levels of available nutrients (such as nitrogen-fixing and ectomycorrhizal associations), when compared to kerangas forest. (H3) Due to differences in nutrient availability, leaf economic traits and nutrient resorption will differ between peat and kerangas plots. Specifically, plants from peat plots will demonstrate more resource-conservative economic traits and higher resorption since they are in a more nutrient-limited environment.
We address these hypotheses by measuring soil and floristic characteristics in peat and kerangas forests. By testing these hypotheses in combination, we aim to better understand how differences in environmental conditions between coexisting forest types on waterlogged and free-draining soils impact both aboveground and belowground components in tropical forests.
Materials and methods
Study system, plots, and soil sampling
The plots were established in the Badas and Labi Hills Forest Reserves, Belait District, Brunei Darussalam, Northwest Borneo. These forest reserves provide an ideal system for direct comparison of two forest types (peat and kerangas) as they consist of a mosaic of both ecosystem types. While there are areas of the Badas Forest Reserve that have been severely disturbed by anthropogenic drainage and fire, our study is limited to areas that have been subjected to minimal human disturbance. We established nine pairs of plots, each pair consisting of a plot in kerangas forest and one in peat forest, for a total of 18 plots. Within a pair, the typical distance between peat and kerangas plots was 100 m, while the distance between each pair and the next nearest pair was always at least 300 m. A total of 12 plots (i.e., six pairs) were established in the Badas Forest Reserve while six plots (i.e., three pairs) were established in the Labi Forest Reserve (Figure S1). The peat forest plots were classified as “Padang forest (mixed species)” or “Mixed swamp forest” in the last Brunei forest inventory in 1984 (Anderson & Marsden (Forestry Consultants) Ltd, 1984). The Brunei Forestry Department identified patches of peat and kerangas forests suitable for study. Soil cores were taken to ensure that peat plots had waterlogged peat soil and kerangas plots had a top humus layer and bottom sand layer. We marked the centre of each plot with a centre pole, and using a range finder, we flagged trees of at least 5 cm diameter at breast height (DBH) within 11.3 m from the centre pole to set up a 400 m2 circular plot, and selected trees of at least 1 cm DBH within 5.65 m from the centre pole to set up a 100 m2 circular sub-plot. Plots were set up between 18 and 30 September 2022, and all measurements and sampling were performed over the following three months.
Within each peat plot, one composite soil sample was collected at 15 cm depth. Within each kerangas plot, two composite soil samples were collected; the first was collected to the depth of the humus layer (the typical depth was 6 cm), and the second was collected in the sand layer from immediately below the humus layer to 15 cm deeper. For all plots, composite samples were collected by selecting eight points (two in each quadrant of the plot) and sampling soil at each point. All eight soil samples within each plot were bulked and homogenized manually by thorough mixing in a sealed plastic bag, forming a composite. Peat samples and the sand samples from the kerangas were sampled using a Russian peat corer while the humus from the kerangas was collected as cubes of 715 cm3 at each point using a hand spade. All samples were packaged in the field in double zip-loc bags and kept cool until analyses were performed. At Universiti Brunei Darussalam (UBD), samples were weighed to measure wet weight, oven-dried at 60°C for 3 days, then weighed again to record dry weight. Bulk density was determined using the oven dry weights and the known volume of each sample. Potassium chloride (KCl) extraction (Gianello & Bremner, Reference Gianello and Bremner1986; Øien & Selmer-Olsen, Reference Øien and Selmer-Olsen1980) was performed on fresh subsamples of each composite sample (10 g with 50 ml 1M solution KCl) for subsequent analysis of mineral nutrients. All samples were sent by courier to Singapore for nutrient analysis.
Soil properties
A subsample of each plot’s fresh soil composite was measured for available nutrients. KCl extractions were used to measure nitrate (NO3-) and ammonia (NH3) using a SEAL AutoAnalyzer (SEAL Analytical, USA, model AA500). Total dissolved nitrogen (TN) and total dissolved organic carbon (TOC) were measured in the KCl extracts using a Total Organic Carbon analyzer (Shimadzu Scientific Instruments, Japan, model TOC-LCPH).
An oven-dried subsample of each soil composite was measured for total nutrients. Total N and total C concentrations were measured using the Dumas method determined by the CHNS elemental analyzer (Elementar, Germany, model Vario El Cube). Total P was determined using the molybdenum blue method with ascorbic acid (Murphy and Riley Reference Murphy and Riley1962). This involved sample ignition (550°C for 1 hr) and extraction in 1 mol-1 H2SO4 (1:50 soil/solution ratio, 16 hr), with PO4 detection by automated molybdate colorimetry using a Tecan Spark Multimode Microplate Reader (Tecan Group, Switzerland). Soil C to N, C to P and N to P ratios were determined from these values.
Floristic variables
For each plot, the DBH of each stem with a DBH greater than 5 cm was measured and identified to at least the family level. For each sub-plot, each stem with a DBH greater than 1 cm was measured and identified to at least the family level. Plants were identified in the field by a botanist from The Brunei National Herbarium, using taxonomic references, including plant identification guides and books, to assist in the identification process. We aimed for species-level identification; however, when this was not possible, identification was made at the genus level or, at least, the family level. Due to logistical constraints resulting from restrictions due to the COVID-19 pandemic (when much of this work was performed), voucher specimens were not collected for further identification at the herbarium.
We identified ∼65% of trees at the species level, ∼78% at the genus level, and ∼95% at the family level. Given this level of taxonomic clarity, we compared diversity between the two forest types at the family level, as this provided the most consistent taxonomic resolution for analysis.
The stem diameter and frequency data were used to determine tree abundance and stand basal area, as well as the Shannon–Weiner diversity index (family level), Simpson’s diversity index (family level) and total family richness.
For each sub-plot, we visually estimated the gross percentage of ground cover contributed by vegetation on the forest floor. Ground cover vegetation was identified using the same approach described above. Additionally, we visually estimated the total percentage of ground cover by each plant family present, with all plants identified to at least the family level. Estimating ground cover was necessary to assess plant community composition and potential differences in understory vegetation across forest types. We conducted foliar trait analyses at the family level to better understand the broad nutrient strategies and trait adaptations of plant families across the two tropical forest types. This family-level approach provided a practical unit for comparing differences in foliar traits between the two forest types, given that most species or genera were present in only a small subset of the plots. Notably, we did not observe any tree species or genera that were found in all peat and kerangas plots, or that were exclusively present in all peat plots and absent from all kerangas plots, or vice versa. For these reasons, we compared trees at the family level between the two forest types. For each plot, a list was compiled to identify taxa that occur in all peat and kerangas plots, and in doing this we found six tree families (Dipterocarpaceae, Euphorbiaceae, Fabaceae, Lauraceae, Myrtaceae and Rubiaceae) and three ground cover families (Arecaceae, Pandanaceae, Zingiberaceae) that occurred in all peat and kerangas plots. From this, five tree families (excluding Rubiaceae) and the three ground cover plant families were selected based on their abundance across all peat and kerangas plots to ensure a sufficient sample size of leaf material for collection.
For each family in each plot, we randomly sampled among all the plant individuals present to collect an average of 12 fully expanded live leaves from the lowest branches, and this was done similarly for all plants sampled to avoid biases. Additionally, we collected at least eight recently senesced dead leaves from the top of the litter layer. Photographs were captured of each live leaf with a ruler as a scale, and the area of that leaf was calculated using the image analysis software ImageJ (Schneider et al. Reference Schneider, Rasband and Eliceiri2012). For each family in each plot, leaf samples were weighed while fresh to determine the mean wet weight per live leaf and per dead leaf. Leaf samples were then oven-dried at 60°C for three days and then weighed to determine the mean oven-dry weight per live leaf and per dead leaf for each family in each plot. Using these values, for each family in each plot, leaf mass area (LMA) was calculated as LMA = dry weight/ leaf area and leaf dry matter content (LDMC) was calculated as LDMC = (wet weight – dry weight)/dry weight.
For each family in each plot, the total N and total C concentrations of both the live and senesced leaves were measured as described above for total nutrients in the soils. Although we measured total P in the same way as for soils, we performed an extraction in 1 M HNO3 instead of H2SO4. Foliar and litter C to N, C to P, and N to P ratios were determined from these values. Percent resorption for both foliar and litter N and P was calculated as:
percent resorption = 100 × ((CL − CD)/CL)
where CL is the concentration of N or P in live leaves and CD is the concentration of N or P in dead leaves.
Data analysis
All soil variables were analysed using one-way ANOVA with plot pairs as replicate blocks (nine blocks in total) to test for differences between peat soil, kerangas sandy soil, and kerangas humus. When significant differences were found at P = 0.05, Tukey’s post hoc test was conducted for pairwise comparisons. Data were transformed if needed to conform to ANOVA assumptions. Further, differences in soil variables between peat soil, kerangas humus, and kerangas sand were assessed using principal component analysis (PCA).
All forest structure and diversity variables were analyzed using paired t-tests with each plot pair as a replicate block to test for differences between peat and kerangas forest; data were transformed if needed to conform to t-test assumptions. To examine differences in tree abundance, stand basal area, and nutrient strategies between peat and kerangas forests, we selected 14 focal families for detailed comparison. These included the nine core families that were consistently present across both forest types (six families found in all 18 plots and three families found in 16 out of 18 plots). Additionally, we selected five families that exhibited the largest differences in tree abundance between peat and kerangas plots. This approach allowed us to highlight both the most widespread families and those showing the most pronounced variation in abundance across forest types. Further, overall differences between peat and kerangas plots in community composition of the nine core tree families occurring most frequently across all plots were analyzed using PCA.
We also conducted non-metric multidimensional scaling (NMDS) analysis to explore the dissimilarity patterns in our plots based on the tree abundances of shared families across the 18 plots. For this analysis, “shared families” refers to tree families that were present in both peat and kerangas forests. Families were included in the NMDS if they occurred in at least 5 out of 18 plots (∼30% of plots), with representation in both forest types, to ensure a meaningful comparison of regularly occurring families while minimizing the influence of rare families. This threshold was chosen to minimize the influence of rare families and improve NMDS performance. The inclusion of families that occurred in only one or two out of the 18 plots would have introduced a large number of zeros into the dataset, which can increase data sparsity and reduce the effectiveness of dissimilarity calculations in the NMDS ordination. Excessive zeros can lead to higher ordination stress values and less meaningful distance relationships. Restricting our selection of families to those present in a minimum of five plots reduces this problem while still allowing us to capture key compositional patterns. A Bray–Curtis dissimilarity matrix was calculated to quantify the dissimilarity between samples, and the stress value was calculated to evaluate the goodness-of-fit of the NMDS solution. PERMANOVA was then carried out to test the significance of the difference between the peat and kerangas plots in the NMDS plot. The PERMANOVA analysis was conducted with the dissimilarity matrix as the response variable and the forest type as the predictor variable.
To test how habitat type and family affected foliar and litter traits, we used linear mixed models (LMM) with habitat type, family, and their interaction as fixed factors. Plot nested within the block was included as a random factor, with N = 18 plots and N = 9 blocks to control for non-independence of the five observations within each plot, as well as the non-independence of observations within each block of paired plots. Further, NMDS was used to explore dissimilarity patterns in leaf and litter nutrient traits, LMA, LDMC, nutrient resorption, and nutrient strategies among the eight families present in all plots. A Euclidean dissimilarity matrix was used to quantify trait-based differences, and the stress value was calculated to assess the NMDS solution’s fit. A PERMANOVA was then conducted to determine whether functional traits, assessed at the family level, differed significantly between forest types. Statistical analyses were performed in the R programming language (R Core Team, 2021) using the lme4 package for mixed models (Bates et al. Reference Bates, Mächler, Bolker and Walker2015), FactoMineR package for PCAs (Lê et al. Reference Lê, Josse and Husson2008), vegan package for NMDS (Oksanen et al. Reference Oksanen, Blanchet, Friendly, Kindt, Legendre, McGlinn and Wagner2020), and emmeans package for mean comparison (Lenth Reference Lenth2021).
Results
Differences in soil variables
Soil variables differed significantly among the three soil types (Table 1). Peat had the highest concentrations of total C, total N, and total P, and the highest C:P ratio. Meanwhile, kerangas humus had the highest N:P ratio and highest concentrations of NH4, TN, along with TOC whereas kerangas sand had the highest bulk density.
Soil characteristics of nine peatland and nine kerangas sites in Belait District, Brunei Darussalam. Values given are for the top 15 cm of peat in the peat sites, humus layer to full depth at the kerangas sites (“Kerangas-Humus”), and top 15 cm of underlying sand at the kerangas sites (“Kerangas-Sand”). Values are means ± SE (N = 9). Different superscript letters and values in boldface indicate significantly different means at P < 0.05 (Tukey’s post hoc test)
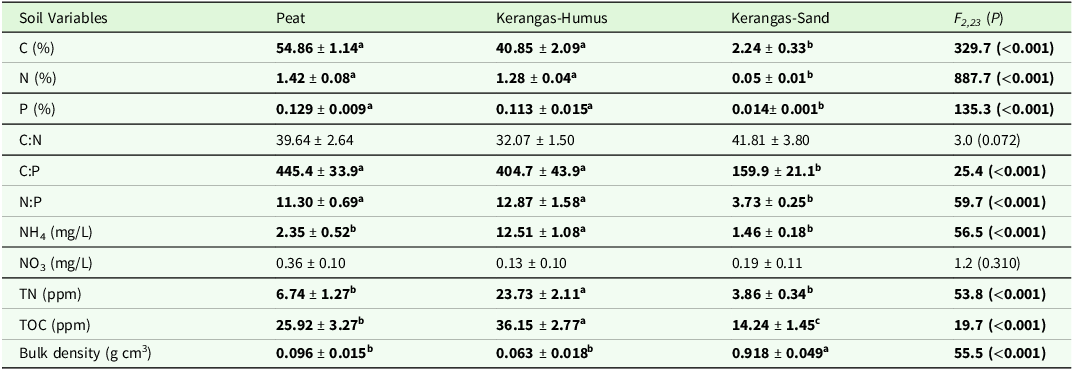
Notes: Total dissolved nitrogen (TN) and total dissolved organic carbon (TOC) were measured in KCl extracts.
Together, the first two axes of the PCA accounted for 80.6% of the total variation in soil nutrients (Figure S2). The primary ordination axis (PC1) explained 58.1% of the variation and represented increasing values of total N, TOC, and total C concentrations while the secondary ordination axis (PC2) accounted for 22.5% of the variation and represented a gradient of increasing NH4, total mineral N, and total P. Kerangas humus and peat soils were separated along PC2. Kerangas humus was represented by a large cluster and was associated with higher TOC, total mineral N and NH4. Peat was represented by a slightly smaller cluster and was associated with higher total N, total C, and total P. Kerangas sand was represented by a small cluster and is well-separated from the other two soil types along PC1.
Variation in forest structure and family diversity
None of the forest structural characteristics (tree abundance, stand basal area and ground cover) and none of the measures of family-level diversity (family, Simpson, Shannon) differed between peat and kerangas (Table S1).
Differences in family-level composition
We identified 38 tree families across all peat plots and 41 tree families across all kerangas plots. Thirty-six families were shared between the two forest types. Two families (Centroplacaceae and Rutaceae) were found only in peat plots, while five families (Anisophylleaceae, Casuarinaceae, Dracaenaceae, Flacourtiaceae, and Simaroubaceae) were found only in kerangas plots. From the 36 shared families, we selected 14 focal families for detailed analysis based on their consistent presence and variation in abundance across forest types. Significant differences between peat and kerangas were found for three of the 14 focal families when tree abundance was considered, and one of the 14 families when tree basal area was considered (Table 2). Specifically, stem density of Dipterocarpaceae which has an ectomycorrhizal strategy, was 2.7 times higher in kerangas than in peat, while Sapotaceae and Clusiaceae, which both have arbuscular mycorrhizal strategies, were respectively 3.2 and 4.0 times higher in peat than in kerangas. Stand basal area of Myrtaceae which has both arbuscular and ectomycorrhizal strategies was 3.0 times higher in kerangas than peat.
Family nutrient strategies, tree abundance (number/ha), and stand basal area (m2/ha) in peat and kerangas paired plots in Badas and Labi Forest Reserves, Brunei Darussalam. Means are shown ± SE. Values in boldface indicate statistically significantly different means at (P < 0.05) determined by paired t-tests (N = 9)

Notes: AMF = arbuscular mycorrhizal fungi, ECM = ectomycorrhizal fungi, N-fixing = nitrogen fixing.
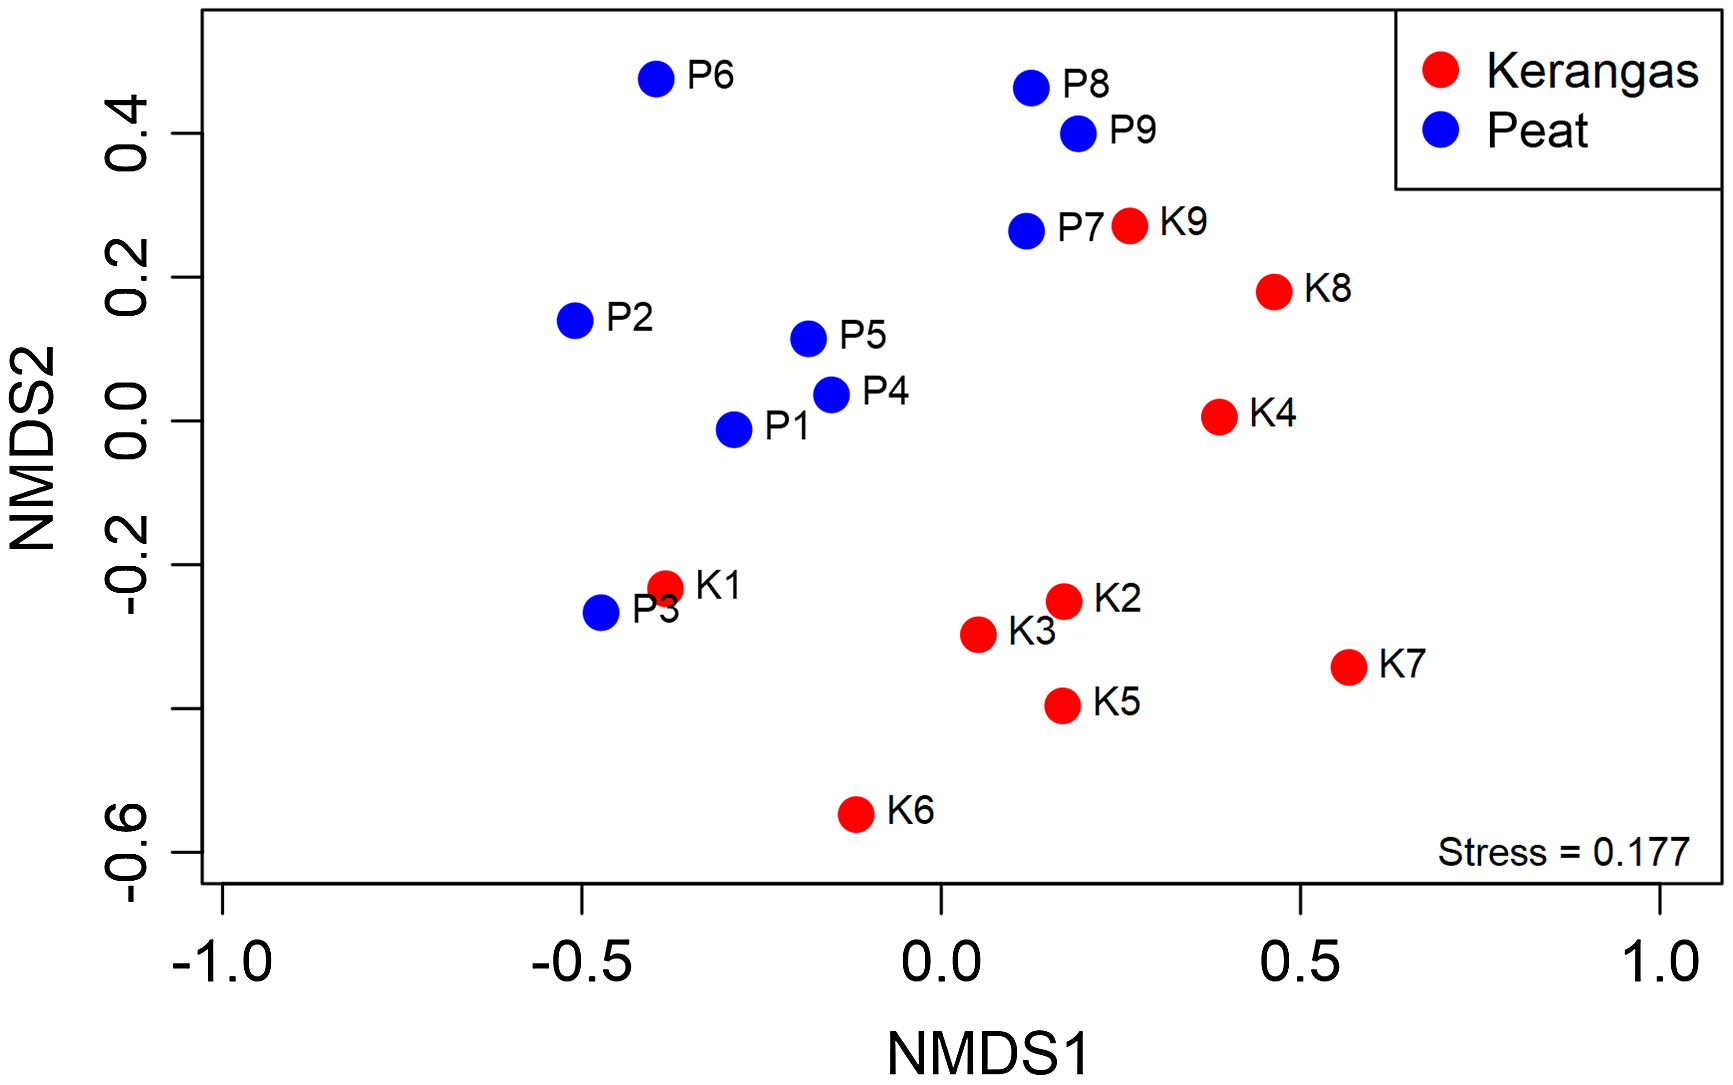
Of the 36 shared families, 28 met the ≥5 plot threshold and were included in the NMDS analysis. For an NMDS analysis of the 28 families in the peat and kerangas plots (Figure 1), we found a stress value of 0.177, indicating an acceptable fit of the data in the reduced-dimensional space. The NMDS plot showed a clear separation between the peat and kerangas plots, with each forest type forming a distinct cluster. The PERMANOVA confirmed a statistically significant dissimilarity between peat and kerangas in the composition of the tree families (F = 3.0, P = 0.003).
Nonmetric multidimensional scaling (NMDS) of plot dissimilarity (Bray-Curtis, stress = 0.177) based on abundance of 28 tree families of 18 paired plots (kerangas N = 9, peat N = 9). Plots located in different habitat types are represented by different colors: red (kerangas) and blue (peat). PERMANOVA analysis indicates a significant effect of ‘habitat type’ (F = 3.0, P = 0.003) on the dissimilarity observed.
For a PCA of the nine most frequent families (Figure S3), the first two axes accounted for 50.7% of the total variation (PC1 = 30.1%, PC2 = 20.6%). The clusters representing the peat and kerangas plots had similar spreads and overlapped predominantly in the middle of the ordination biplot, suggesting considerable similarity in the relative abundance of the nine most frequently occurring tree families between the two forest types.
Effect of habitat and family on foliar and litter traits
For the eight plant families examined, no significant differences between peat and kerangas were observed for foliar nitrogen content (%N), phosphorus content (%P) or foliar N to P ratio (Table S2, Figure 3A-B). Similarly, no significant differences between the two forest types were observed for foliar carbon content (%C), carbon-to-nitrogen ratio (C:N), and carbon-to-phosphorus ratio (C:P) (Table S2). However, there were large differences among the eight families for both %N and %P. Overall the highest foliar N and P concentrations occurred for Fabaceae and Euphorbiaceae while the lowest N and P concentrations were for Myrtaceae and Pandanaceae. Significant differences were observed among families for C:N and C:P ratios but not for the N to P ratio (Table S2).
There were also no significant differences between peat and kerangas for foliar LMA or LDMC (Table S2, Figure SA, B), but the 8 families differed for both traits. Overall, the highest foliar LMA occurred for Myrtaceae while the lowest LMA was for Zingiberaceae. Furthermore, the highest foliar LDMC occurred for Dipterocarpaceae and Arecaceae while the lowest LDMC were for Zingiberaceae and Pandanaceae.
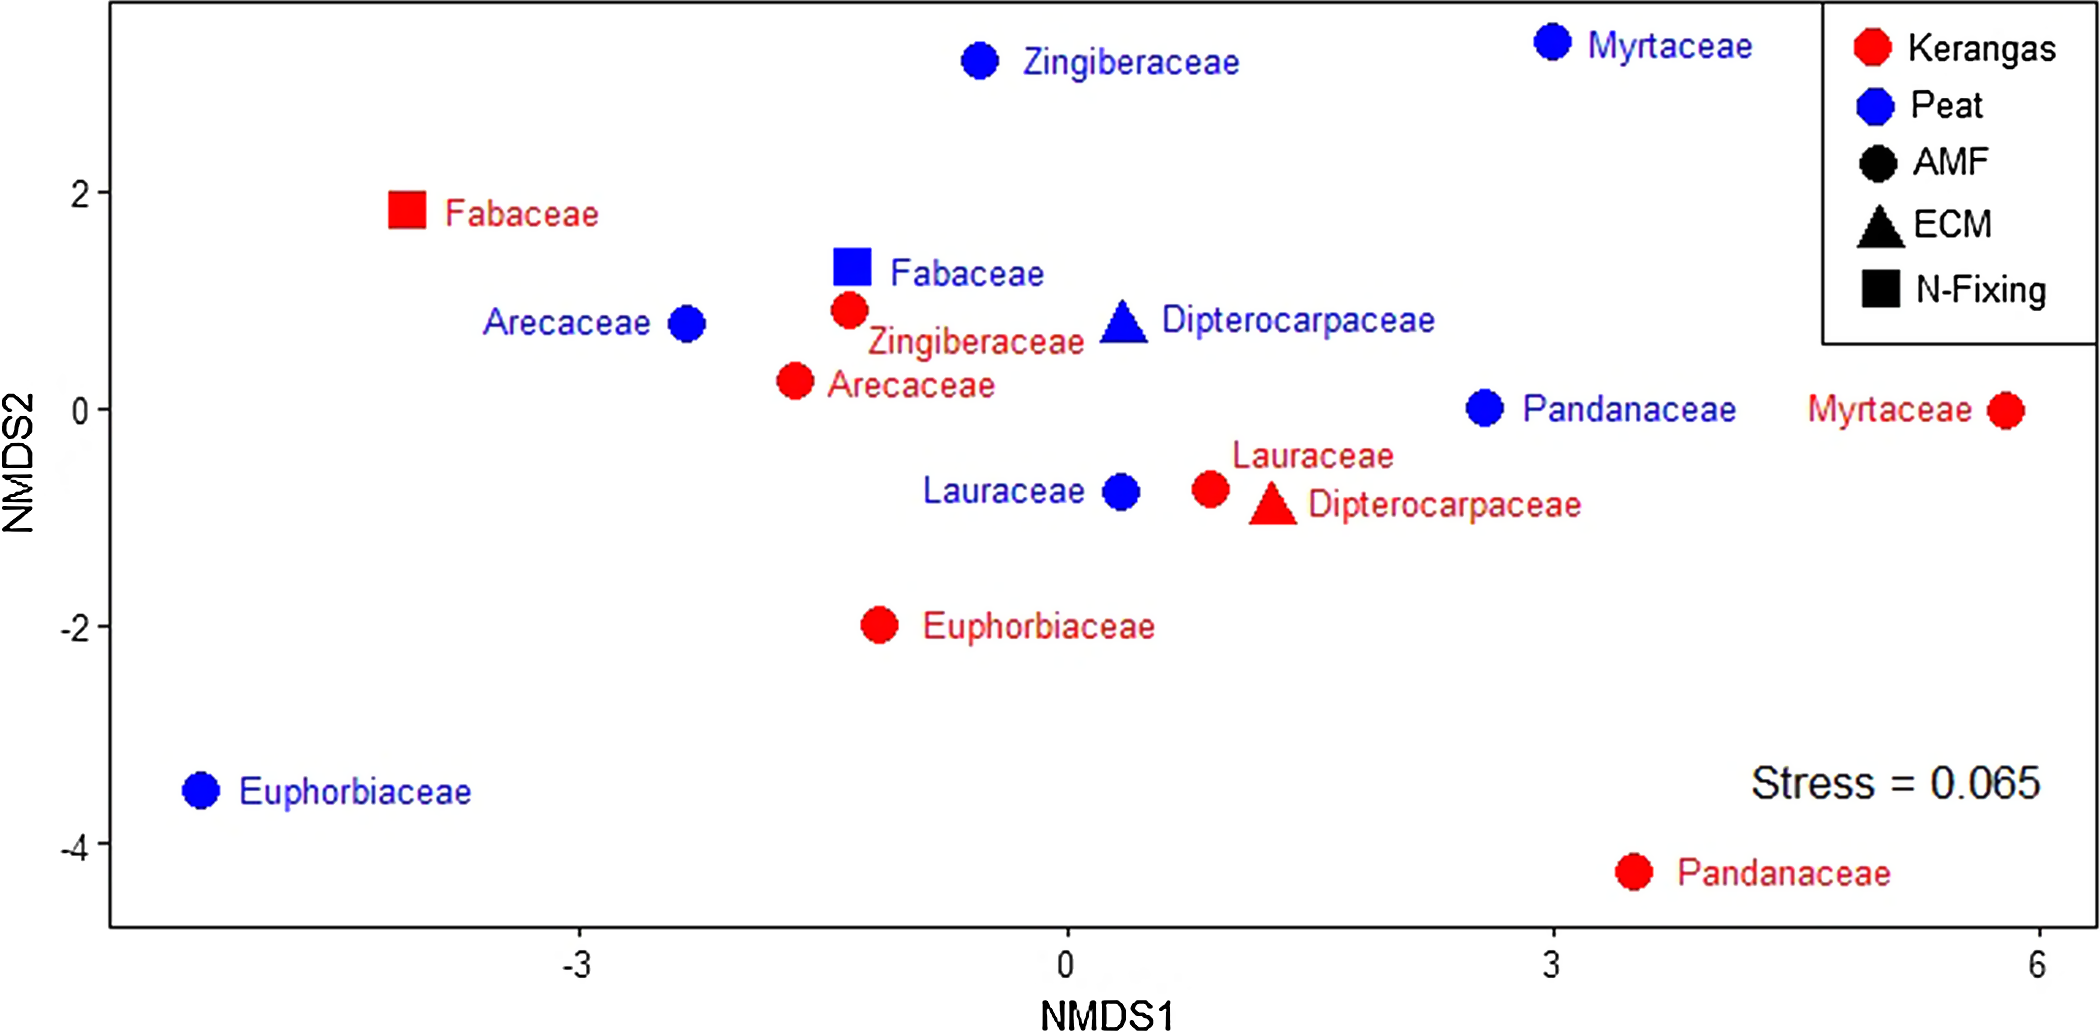
For the eight plant families examined, no significant differences between peat and kerangas were observed in litter %N, %P or N:P ratio (Table S2, Figure S5). Similarly, no significant differences between the two forest types were observed for litter carbon content (%C), carbon to nitrogen ratio (C:N), and carbon to phosphorus ratio (C:P), (Table S2). According to the LMM, there were significant differences among the eight families for litter %N, but the posthoc test did not indicate significant differences for %N. Further, litter %P did not differ among families (Table S2) No significant interaction was detected. Differences were observed among the eight families for both litter N:P. and C:N (Table S2). Overall, the highest litter N:P occurred for Euphorbiaceae and Arecaceae while the lowest N:P were for Myrtaceae and Pandanaceae (Figure S5). For the NMDS analysis of leaf economic traits and family nutrient strategies of the eight families found in all peat and kerangas plots (Figure 2), we found a stress value of 0.065, indicating a very good fit of the data in the reduced-dimensional space, with minimal distortion in the representation of trait-based dissimilarities. The NMDS plot showed no distinct separation between peat and kerangas plots, as the two forest types did not form distinct and separate clusters. The PERMANOVA results showed no significant differences in these traits at the family level between forest types (F = 0.572, P = 0.699).
Nonmetric multidimensional scaling (NMDS) of plot dissimilarity (Euclidean, stress = 0.065) based on leaf and litter nutrient concentrations, leaf mass per area (LMA), leaf dry matter content (LDMC), nutrient resorption, and nutrient strategies among the eight families present in all 18 paired plots (kerangas N = 9, peat N = 9). Plots located in different habitat types are represented by different colors: red (kerangas) and blue (peat). Family nutrient strategies are represented by different shapes: circle (AMF = arbuscular mycorrhizal fungi), triangle (ECM = ectomycorrhizal fungi), and square (N-fixing = nitrogen fixing). PERMANOVA analysis indicates a non-significant effect of ‘habitat type’, i.e., kerangas versus peat (F = 0.572, P = 0.699), on the dissimilarity observed.
Mean ± SE foliar (A) nitrogen (%), (B) phosphorus (%), and (C) N:P ratio for live foliage from each family in peat and kerangas (N = 9). Bars topped by the same letter are not significantly different at P < 0.05 (Tukey’s post hoc test). Peat is represented by gray bars while kerangas is represented by white bars. Family abbreviation: Euphorbiaceae (Eup), Lauraceae (Lau), Fabaceae (Fab), Dipterocarpaceae (Dip), Myrtaceae (Myr), Arecaceae (Are), Pandanaceae (Pan), and Zingiberaceae (Zin).

Resorption
For the eight plant families examined, no significant differences between peat and kerangas were observed in nitrogen resorption (Table S2, Figure S6A). According to the LMM, there were significant differences among the eight families for phosphorus resorption (Table S2). However, the posthoc test did not indicate significant differences for phosphorus resorption (Figure S6B), and no significant interaction was detected.
Discussion
We found that total nutrients were more concentrated in peat and in kerangas humus than in kerangas sand, while available nutrients were highest in kerangas humus soil. We also found significant compositional differences among families that regularly occur in both peat and kerangas plots. Despite this, we found no difference in tree family diversity or in families with specific nutrient strategies between the forest types. Furthermore, while leaf economic traits and nutrient resorption varied among plant families, they showed no significant differences between peat and kerangas forests. These findings are now discussed to enhance our understanding of the structural and functional differences between adjacent peatland and kerangas ecosystems.
Soil nutrient differences
Contrary to our first hypothesis, we found that the total nutrient content, and nutrient ratios, of the kerangas humus layer was comparable to that of peat, although the kerangas sand had lower total nutrients than either humus or peat. However, our first hypothesis was partly supported in that amounts of labile forms of N (i.e., NH4 and total dissolved N) were less in the peat than in kerangas humus. This is most likely a consequence of the anoxic conditions of the peat (Hoyos-Santillan et al. Reference Hoyos-Santillan, Lomax, Large, Turner, Lopez, Boom and Sjögersten2019) limiting microbial activity, thus slowing down the decomposition process and impairing N mineralization (Jauhiainen et al. Reference Jauhiainen, Takahashi, Heikkinen, Martikainen and Vasander2005). Our findings are consistent with Leng et al. (Reference Leng, Ahmed and Jalloh2019) and Mishra et al. (Reference Mishra, Page, Cobb, Lee, Jovani-Sancho, Sjögersten and Wardle2021), which underscores the critical role of oxygen availability and hydrological factors in soil nutrient dynamics in tropical peatlands. The similarity in total nutrient concentrations between peat and kerangas humus aligns with the fact that nutrient concentrations in the litter inputs from the eight plant families did not differ between these two habitats. However, impeded mineralization due to anoxia causes large amounts of organic matter to accumulate in peat but not kerangas forest, leading to higher (but less available) nutrient capital in the former. This is also consistent with faster decomposition rates previously observed in kerangas than in peat (Rahajoe and Kohyama Reference Rahajoe and Kohyama2003). This similarity in total nutrient concentrations in peat and kerangas humus suggests that, despite their distinct hydrological conditions, both ecosystems may exhibit convergent nutrient dynamics, potentially driven by comparable sources or compositions of organic matter.
Diversity and structure
Contrary to our second hypothesis, we observed no significant differences at the family level in the diversity of trees, their frequency, or stand basal area between the two forest types, despite there being some compositional differences between the two forest types. Despite the waterlogged and nutrient-poor conditions of peat forests that encourage plant adaptations like buttress roots, stilt roots, and pneumatophores (Pahang Forestry Department 2005), these factors did not lead to increased tree diversity through mechanisms of coexistence or reduced competition in the manner that may be expected in stressed environments (Grime Reference Grime1979). The relative similarity in tree family diversity and forest structure between the two forest types, coupled with dominance by the same dominant plant families in both, suggests the existence of a shared taxa pool adapted to diverse environmental conditions. This shared taxa pool is likely maintained through species dispersal and edge-to-edge contact between these forests, facilitating the persistence of core plant families across both forest types.
However, our NMDS analysis revealed significant compositional differences among those families that occur frequently in both peat and kerangas plots. This indicates that while many families are shared, their relative abundances and community composition differ between forest types. Given the similar elevation, climate, soil nutrients, and high degree of connectivity between forest types, the compositional differences among families are likely driven by variations in soil moisture. In a seedling transplant experiment in Singapore, both soil characteristics and hydrology were found to play a role in the exclusion of several species, representing different families, from swampy areas (Chong et al. Reference Chong, Hung, Koh, Lim, Loh, Neo and Tan2021). That experiment, which tested seedling survival in both waterlogged and dry soils, supports the idea that variations in soil moisture can act as an ecological filter, influencing the relative abundance and composition of families across different forest types, as observed in our NMDS analysis.
Despite this shared family pool, waterlogging in peat forests may act as an ecological filter that prevents certain species from establishing. Consistent with this, no single species or genus was found across all (or even most) of the peat and kerangas plots, aligning with a meta-analysis of peat and kerangas forests across Southeast Asia which reported a low species overlap, likely less than 3.7%, between these ecosystem types (Giesen et al. Reference Giesen, Wijedasa and Page2018). This suggests that while families may be shared, species-level composition remains distinct due to habitat specialization and microenvironmental differences. However, given that species-level identification in this study was relatively low, future studies would benefit from deeper taxonomic resolution to better capture fine-scale compositional differences between these forests. Since no genus was shared across all plots, it is highly unlikely that any species would have been, but a more complete species inventory could further clarify the extent of species turnover between peat and kerangas forests.
Taxa that occur across contrasting environments (such as kerangas versus peat) often exhibit significant phenotypic plasticity (West-Eberhard Reference West-Eberhard1989). In Southeast Asia, this includes the Dipterocarpaceae (a dominant family in both forest types of our study) which has previously been shown to exhibit significant adaptability by varying growth characteristics and traits among habitats (Chan Reference Chan2016). This adaptability is reflected in this study, with Dipterocarpaceae exhibiting lower abundance but a larger average basal area (i.e., fewer but larger and more robust trees with more extensive buttresses, suitable for waterlogged conditions) in peat forests. This aligns with previous work in the region by Nishimura and Suzuki (Reference Nishimura and Suzuki2001), which shows that the dipterocarp species Shorea teysmanniana Dyer ex Brandis, adapts its growth patterns and resource allocation to thrive in both peat and kerangas forest, with deeper roots and smaller leaves in kerangas, and more lateral root growth in peat forest (Nishimura and Suzuki Reference Nishimura and Suzuki2001).
We did not find evidence to support our hypothesized higher prevalence of taxa with specialized nutrient strategies, such as ECM and nitrogen-fixing associations, in peat than in kerangas forests This could be attributed to the phenotypic plasticity observed in shared taxa across the two forest types, allowing them to adapt their nutrient acquisition strategies to diverse environmental conditions, as has previously been observed with N uptake in tropical forest (Andersen et al. Reference Andersen, Mayor and Turner2017). Contrary to our predictions, the Dipterocarpaceae and Myrtaceae, both of which have ECM associations (Corrales et al. Reference Corrales, Henkel and Smith2018), were more abundant and had a greater stand basal area, respectively, in the kerangas forests despite labile forms of soil N being higher. ECM fungi are likely to be more adversely affected by waterlogging and anoxia compared to AM fungi (Wang et al. Reference Wang, Qiu, Yang, Hu, Tam and Xin2010, Usman et al. Reference Usman, Ho-Plágaro, Frank, Calvo-Polanco, Gaillard, Garcia and Zimmermann2021), so despite less labile N in peat, ECM fungi are likely to have reduced success in these conditions which could explain the lack of a clear advantage for ECM species in waterlogged peat soils.
Leaf traits and nutrient resorption
In contrast to our third hypothesis, at the family level, leaf economic traits and nutrient resorption did not differ between peat and kerangas forests. Despite greater nitrogen availability and less anoxia in kerangas, leaf traits and resorption processes that are known to respond to environmental stress and nutrient limitation (Chapin et al. Reference Chapin III, Vitousek and Van Cleve1986, Brant and Chen Reference Brant and Chen2015) were relatively invariant across the two forest types. This suggests that the adaptations enabling plants to access unavailable nutrients and tolerate anoxia in peat forest enable them to exhibit similar trait and resorption values in that environment as they do in kerangas. Furthermore, the similarity in nutrient resorption across the significantly different environmental conditions of peat and kerangas suggests that plants in both habitats perceive similar levels of nutrient availability (Chen et al. Reference Chen, Reed, Lü, Xiao, Wang and Li2021). Efficient nutrient uptake facilitated by AM fungi, which are associated with most plant taxa in both environments (Table 2), may account for the observed invariance in economic traits and resorption in both habitats despite peat having lower concentrations of labile forms of N.
Conclusions
This study enables direct comparisons of tropical peatland forests and kerangas forests by showing that they have considerable similarity in forest stand characteristics, and foliar and litter traits, despite differences in family-level composition and belowground environments. The invariance within families in functional traits and nutrient resorption among forest types, despite large differences among families, points to a remarkably low level of plasticity in these characteristics across vastly contrasting environments. The lack of large differences at the family level in plant communities and leaf and litter characteristics between peat and kerangas means that it is unlikely that the massive C accumulation in peat is due to plant community factors but rather is driven by soil-related processes, such as the retardation of decomposer activity. Further research is needed to determine if these findings apply to other tropical forests, particularly for forests that are in close proximity and share the same species pool, as this would enhance our understanding of the factors influencing the local-scale aboveground ecology of forest ecosystems. Tropical peat forest plays a major role in global carbon sequestration and our findings indicate that differences in leaf mass and elemental composition between peat and kerangas forests are unlikely to drive C storage in peat forest; there is therefore a research need to instead focus on other drivers that may impact C storage such as what happens in the decomposer subsystem.
Supplementary material
The supplementary material for this article can be found at https://doi.org/10.1017/S0266467425000112
Acknowledgements
The authors thank the Brunei Forestry Department for permission to conduct research. They thank Jeffery Muli anak Incham and Ramasamy anak Zulkiflee of Singapore-MIT Alliance for Research and Technology for help with field data collection. They also thank Sylvia Tan of Asian School of the Environment, Nanyang Technological University for assistance in the field. They thank Salwana Jaafar, Kenny Png Guochen, Chung Wing, and Lu Chuansen Leon for assistance with processing lab samples.
Financial support
This research was supported by the National Research Foundation Singapore through grant no. NRF2019-ITC001-001.
Competing interests
The authors declare no conflict of interest.


 Open access