


Introduction
In 2018, Japan ranked eighth among bottled wine-importing countries (approximately $1.0 billion) and was the third leading market for U.S. bottled wine exports ($68 million) (United Nations 2019; U.S. Department of Agriculture 2019). In addition to the United States, major wine exporters to Japan include Australia, Chile, France, Germany, Italy, and Spain. However, these countries have bilateral trade agreements with Japan and face zero (or significantly lower) tariffs (Zeller and Cole Reference Zeller and Cole2014; Paulson and Kurai Reference Paulson and Kurai2018). Until recently, the United States was the only major supplier to face the 15 percent tariff that Japan imposes on World Trade Organization (WTO) members, making U.S. wine relatively less competitive when compared with major competing countries.
On October 7, 2019, the United States and Japan signed the U.S.-Japan Trade Agreement (USJTA), which entered into force January 1, 2020 (Cimino-Isaacs and Williams Reference Cimino-Isaacs and Williams2020). Under the agreement, Japanese tariffs on U.S. agricultural goods covering over $7.0 billion are significantly reduced or eliminated on approximately 600 agricultural tariff lines (Williams, Cimino-Isaacs, and Regmi Reference Williams, Cimino-Isaacs and Regmi2019). Specific to U.S. wine, the agreement resulted in an immediate tariff reduction (15–8.5 percent), which is followed by successive annual reductions until the tariff is fully eliminated by the seventh year (Office of the U.S. Trade Representative 2019; Kurai and Satake Reference Kurai and Satake2020). This is similar to the tariff elimination schedule in the Economic Partnership Agreements (EPAs) between Japan and Chile (entered into force September 2007) and Australia (entered into force January 2015) but different from the Japan-EU EPA, where the tariff was immediately eliminated upon enforcement in February 2019 (Table 1).
Japanese Free Trade Agreements and Wine Tariff Policy
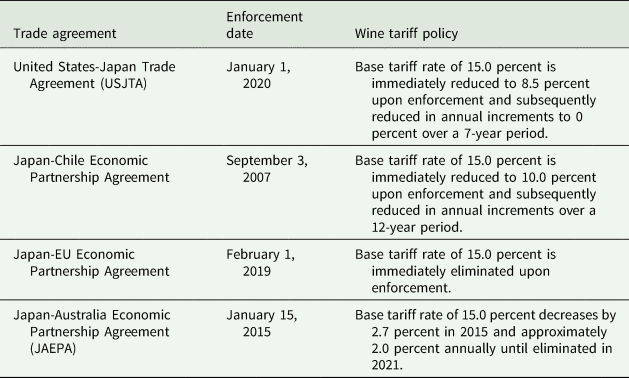
Sources: USJTA, Office of the United States Trade Representative; Chile and EU EPA, Ministry of Foreign Affairs of Japan; and JAEPA, Australian Government FTA Portal.
With the U.S. withdrawal from the Trans-Pacific Partnership (TPP) in 2017, and the recent enactment of the Comprehensive and Progressive Agreement for Trans-Pacific Partnership (CPTPP) (TPP minus the United States) and EU-Japan Economic Partnership Agreement in 2018 and 2019, respectively, U.S. agricultural exports were at a disadvantage in the Japanese market relative to exports from the EU and CPTPP member countries like Australia (Williams, Cimino-Isaacs, and Regmi Reference Williams, Cimino-Isaacs and Regmi2019). Since Japan is a leading market for U.S. agricultural exports, industry organizations and producer groups were particularly concerned about the competitiveness of their products in Japan. Although this study focuses specifically on U.S. wine, the importance of USJTA in counterbalancing the effects of competing trade agreements clearly extends to other U.S. agricultural and food sectors (Muhammad and Griffith Reference Muhammad and Griffith2018; Gaesser, Kobayashi, and Wilson Reference Gaesser, Kobayashi and Wilson2020).
Japan's importance in global wine trade raises the question about the impact of tariff eliminations on major suppliers. Do tariffs significantly impact the competitiveness of wine-exporting countries in the Japanese market? Put differently, do tariff eliminations significantly benefit an exporting country and disadvantage competing countries? The United States was the last major supplier to negotiate a bilateral agreement with Japan. It could be argued that U.S. wine exports to Japan have suffered as a result. If so, can this recent agreement make up for any past losses?
To address these questions, we examine how bilateral trade agreements affect Japanese wine demand across exporting countries. The overall goal is to assess how tariffs affect the competitiveness of U.S. wine relative to wine from other supplying countries. We limit the analysis to the following Harmonized System Classification (HS) 2204.21: wine of fresh grapes (other than sparkling wine) in containers not exceeding 2 liters (bottled wine), which accounts for over 90 percent of all still wine imports in Japan (United Nations 2019).Footnote 1 We employ a system-wide approach to estimate Japan's demand for source-differentiated bottled wine. In this framework, wine from a particular country (e.g., Chilean wine) is treated as an individual good that competes with wine from other exporting countries. The generalized dynamic Rotterdam model developed by Bushehri (Reference Bushehri2003) is used in estimation, which can account for dynamic behavior such as habit formation and demand adjustment costs. This is particularly important because a product like wine is more likely to exhibit habit persistence and lags in consumer behavior. Using the model estimates, we derive short-run and long-run import demand elasticities and conduct policy simulations based on bilateral tariff eliminations.
This research contributes to a broader literature on the implications of free trade agreements and specific agricultural sectors (Lee, Seale, and Jierwiriyapant Reference Lee, Seale and Jierwiriyapant1990; Muhammad, Amponsah, and Dennis Reference Muhammad, Amponsah and Dennis2010; Cardamone Reference Cardamone2011; Muhammad, Countryman, and Heerman Reference Muhammad, Countryman and Heerman2018). Muhammad, Countryman, and Heerman (Reference Muhammad, Countryman and Heerman2018) examined Japanese beef demand by source and the implications of tariff reforms in the Japan-Australia Economic Partnership Agreement. Cardamone (Reference Cardamone2011) examined the impact of preferential trade agreements on monthly exports of specific fruits to the EU and found that agreement effects varied by commodity. Muhammad, Amponsah, and Dennis (Reference Muhammad, Amponsah and Dennis2010) analyzed the impacts of preferential arrangements for developing countries on EU demand for imported cut flowers. Lee, Seale, and Jierwiriyapant (Reference Lee, Seale and Jierwiriyapant1990) examined Japanese import demand for citrus and how more liberal trade could impact U.S. citrus exports relative to exports from competing countries like Brazil and Israel.
This analysis also builds upon extensive literature that focuses on global wine trade and source-based competition. Past studies of source-differentiated wine demand include Muhammad et al. (Reference Muhammad, Leister, McPhail and Chen2014), Muhammad (Reference Muhammad2011), Carew, Florkowski, and He (Reference Carew, Florkowski and He2004), and Seale, Marchant, and Basso (Reference Seale, Marchant and Basso2003). Muhammad et al. (Reference Muhammad, Leister, McPhail and Chen2014) used the absolute price version of the Rotterdam demand system to estimate foreign wine demand in China differentiated by source. Muhammad (Reference Muhammad2011) used the Rotterdam model to analyze the wine market in the United Kingdom and the competitive relationship between 12 exporting countries. Carew, Florkowski, and He (Reference Carew, Florkowski and He2004) used a source-differentiated Almost Ideal Demand System (AIDS) model to analyze domestic and import demand for table wine in British Colombia. Seale, Marchant, and Basso (Reference Seale, Marchant and Basso2003) used the first-difference AIDS model to estimate U.S. demand for imported and domestic red wine demand. Although Japan is a major destination for global wine exports, studies of Japanese wine demand are curiously absent from the literature.
Studies specific to wine trade and policy include Anderson and Wittwer (Reference Anderson and Wittwer2018), Rickard et al. (Reference Rickard, Gergaud, Ho and Livat2018), Dal Bianco et al. (Reference Dal Bianco, Boatto, Caracciolo and Santeramo2015), and Heien and Sims (Reference Heien and Sims2000). Anderson and Wittwer (Reference Anderson and Wittwer2018) examined the effects of Brexit and found that a hard exit from the EU would be costly to UK wine consumers. Rickard et al. (Reference Rickard, Gergaud, Ho and Livat2018) analyzed the Transatlantic Trade and Investment Partnership and found that wine tariffs were of limited interest in the negotiations. Dal Bianco et al. (Reference Dal Bianco, Boatto, Caracciolo and Santeramo2015) examined the impact of trade barriers on global wine trade and found that decreasing tariffs have largely been replaced with more stringent technical barriers. Heien and Sims (Reference Heien and Sims2000) examined the effect of the Canada-U.S. Free Trade Agreement on U.S. wine exports and found that non-tariff trade barriers were more important than tariffs. The primary takeaway from past research is that while tariffs are important to global wine trade, they may be subordinate to other determining factors.
Background
Japan does not have a long history of wine consumption. Traditionally, the Japanese have predominately consumed sake (Holden Reference Holden1995). However, with the rise in income and westernization of diets, wine has become increasingly more popular in Japan over the last four decades. Japanese wine preferences are influenced by demographics with differences due to age, income, region, consumption frequency, and total expenditures (Bruwer and Buller Reference Bruwer and Buller2013). Rod and Beal (Reference Rod and Beal2014) note that wine is viewed as an iconic symbol of globalization in Japan and consumers tend to favor French wine due to its global standing. The same associations and preferences for French wine are apparent among Chinese wine consumers (Muhammad et al. Reference Muhammad, Leister, McPhail and Chen2014). Economic growth in Japan has led to an increasing number of consumers who have traveled and studied abroad. These experiences have opened doors to Western cultures and food, specifically wine (Lee Reference Lee2009). Although wine consumption in Japan has significantly increased, per-capita wine consumption in Japan continues to be relatively low when compared to Western countries. In 2006, Japanese wine consumption was 1.9 liters per capita but rose to 2.6 liters per capita in 2018. In Italy, for instance, consumption is 45 liters per capita (Rod and Beal Reference Rod and Beal2014; Aoki and Negishi Reference Aoki and Negishi2019).
Figure 1 shows Japanese wine imports over the last 26 years (1994–2019), in both value and volume. In 1994, Japanese wine imports were 66 million liters, valued at $272 million. By 2014, the volume increased to over 180 million liters (approximately $1.1 billion), which is a 175 percent increase in volume and a 288 percent increase in value. During this time, there was a spike in imports in 1998 linked to a boom in red wine demand after a series of studies alluded to the health benefits of consumption (Rod and Beal Reference Rod and Beal2014; Aoki and Negishi Reference Aoki and Negishi2019). The subsequent fall was due to the Asian financial crisis (Corsi, Marinelli, and Sottini Reference Corsi, Marinelli and Sottini2013).
Japanese Wine Imports by Value and Volume: 1994–2019
(Source: Global Trade Atlas, IHS Markit®)
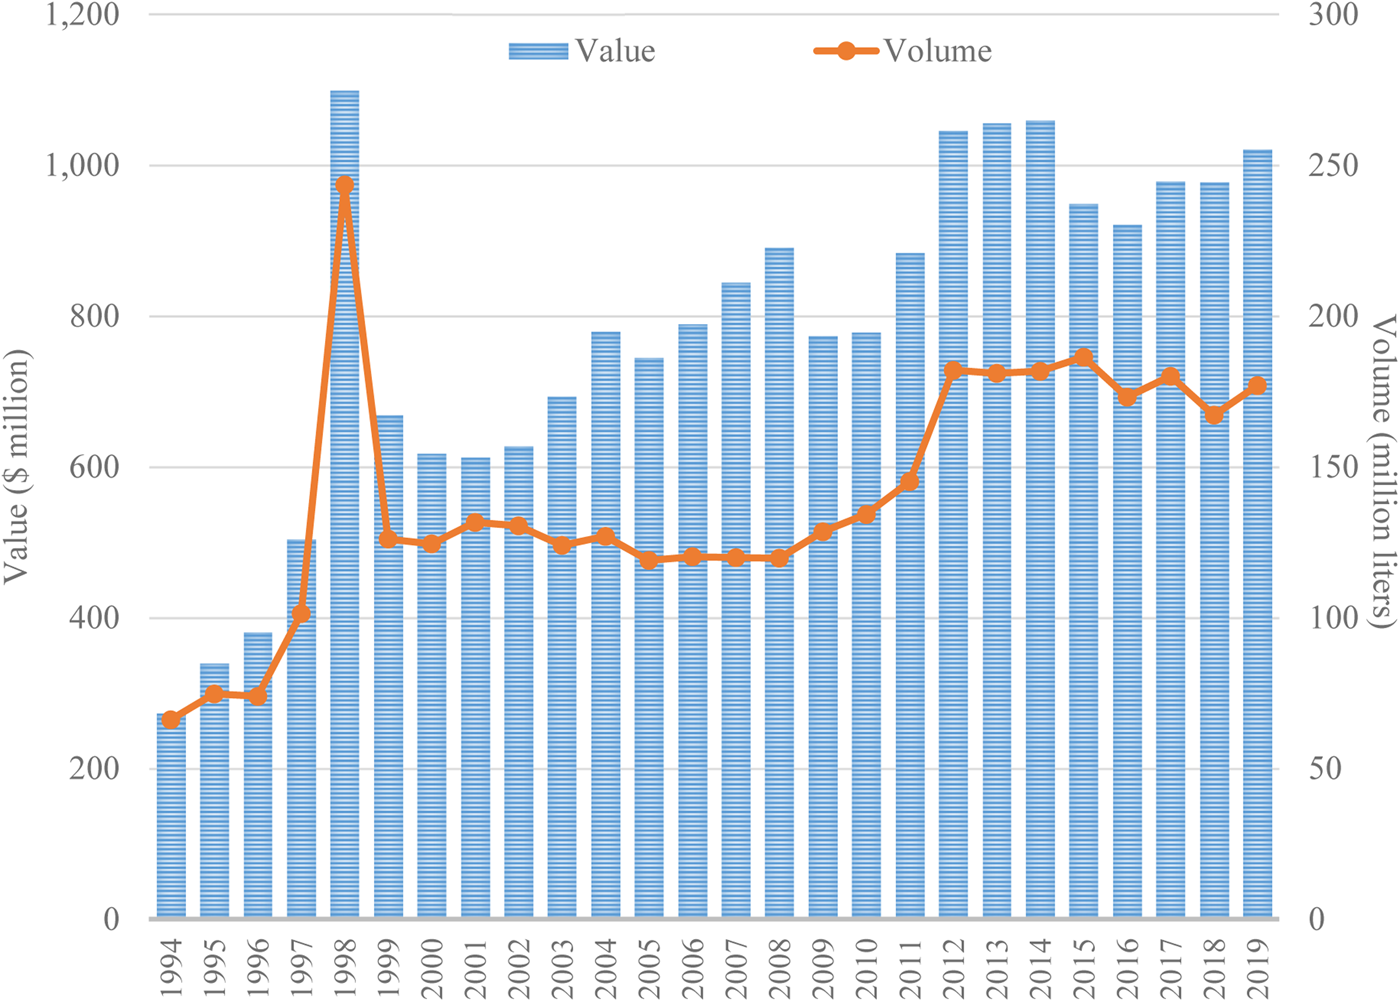
Table 2 shows Japanese wine imports and exporter market share from 1994 to 2019. France has consistently dominated the market (54 percent), followed by Italy (15 percent), and more recently Chile. Note that Chilean wine accounted for less than half percent of all imported wine in Japan in 1994, but increased to 16 percent by 2017. In terms of the volume, Chile was actually the leading supplier in 2018. The average market shares for all other suppliers are 3.1 percent (Australia), 4.9 percent (Germany), 4.2 percent (Spain), and 7.9 percent (U.S.).
Japanese Wine Imports and Market Share by Exporting Country: 1994–2019
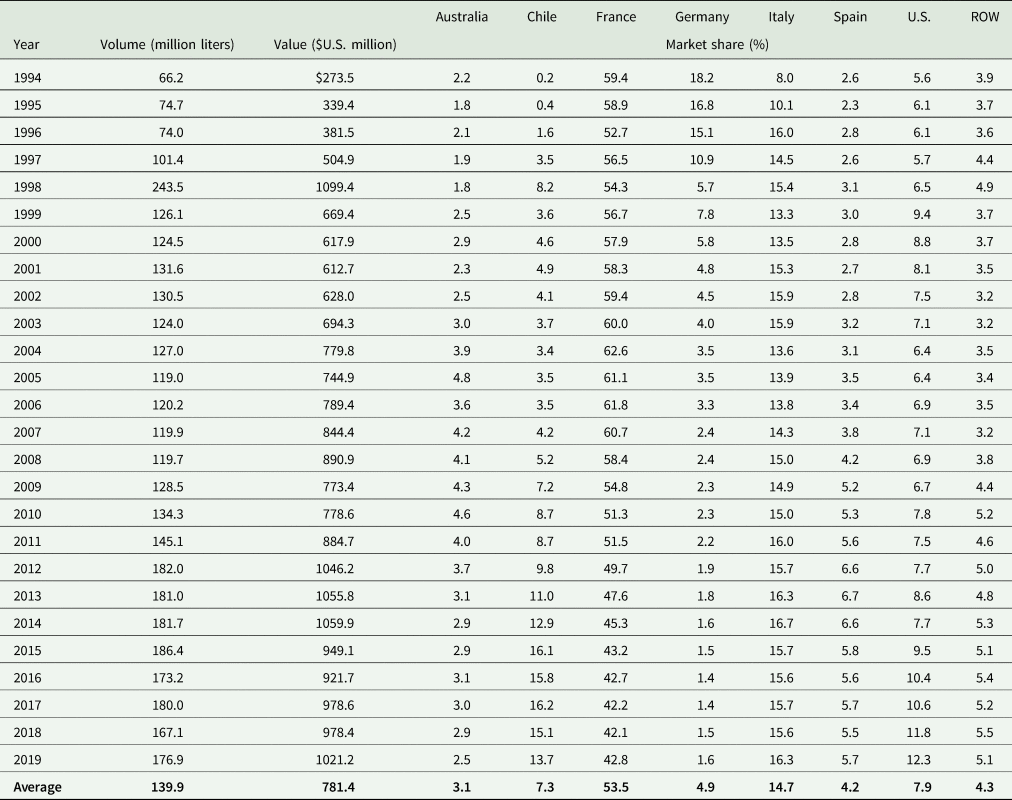
Note: ROW is rest of world.
Source: Global Trade Atlas, IHS Markit®.
Table 3 shows the price of Japanese wine imports by source from 1994 to 2019 and indicates that consumers are now purchasing more expensive wine. For instance, the average price of U.S. wine was $2.84/liter in 1994, but increased to $16.14/liter in 2018. Other noted increases during this period include French wine ($5.26/liter to $9.75/liter), German wine ($3.15/liter to $6.00/liter), and Italian wine ($2.98/liter to $5.05/liter). The price of Spanish wine has been relatively stable (around $3.00/liter), while Chilean wine prices have actually decreased to less than $3.00/liter in recent years. The significant increase in U.S. wine prices could be due to factors other than preferences for more expensive wine. While the tariff on Japanese wine imports is typically 15 percent, the actual policy is 15 percent or 125 yen/liter, whichever is less (Kurai and Satake Reference Kurai and Satake2020). Note that this specific tariff component discourages imports of inexpensive wine.
Imported Wine Prices in Japan by Source: 1994–2019
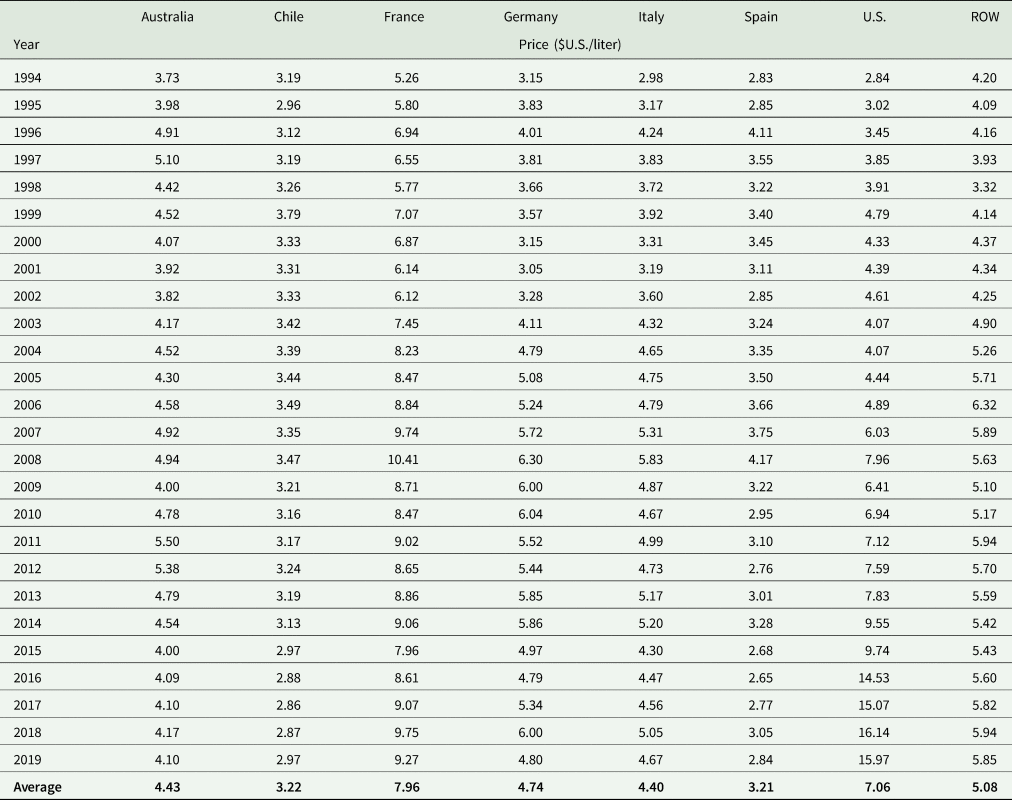
Note: ROW is rest of world.
Source: Global Trade Atlas, IHS Markit®.
The observed price and import changes over time are, in part, due to source-based promotional activities by organizations and governments in the exporting countries. In Australia, for instance, a $50 million export support package was created through a public-private partnership to promote Australian wine in Asian markets (Clark Reference Clark2019). EU wine promotion has been funded through the Common Organization of Agricultural Markets, with nearly $4.8 million allocated to wine promotion in markets such as Japan in recent years (Wine Business International 2017). In the United States, the Wine Institute received almost $10 million from the U.S. Department of Agriculture in 2019 to promote U.S. wine in Japan and other markets (Todorov Reference Todorov2019). Chile has also created public-private partnerships dedicated to global wine promotions and international wine tourism (Coelho and Montaigne Reference Coelho, Montaigne, Ugaglia, Cardebat and Corsi2019).
Model and Methods
Dynamic Demand Model
The generalized dynamic Rotterdam model is used in estimating imported-wine demand in Japan. The model is similar to the static Rotterdam model developed (Theil Reference Theil1980) but can also account for trends and lags in consumer behavior. Let q and p denote the quantity and price of imported wine in Japan, i and j denote the country of origin, and n denote the number of exporting countries. Given these terms, the demand for wine from country i is expressed as follows (Bushehri Reference Bushehri2003):

Note that Δ is the log-difference operator where for any q and p, Δq t = lnq t − lnq t−12 and Δp t = lnp t − lnp t−12. Monthly data are used for the analysis and the 12th-period difference is used to correct for seasonality (Lee Reference Lee1988). $w_{it} = \left({p_{it}q_{it}/\mathop \sum \nolimits_{i = 1}^n p_iq_i} \right)$ is the average import share for the ith country and $\bar{w}_{it}$
 is the two-period average of w it: $\bar{w}_{it} = 0.5\lpar {w_{it} + w_{it-12}} \rpar$
 . ΔQ t is the finite version of the Divisia volume index, which is a measure of aggregate import expenditures in real terms and is derived as follows: $\Delta Q_t = \sum\nolimits_{i = 1}^n {{\bar{w}}_{it}\Delta q_{it}}$
 . θi = (∂q i/∂Q) is the effect of aggregate expenditures on an import (marginal share) and πij is the Slutsky price coefficient (conditional price effect), which measures the impact of the price of wine in country j on wine imports from country i, holding real expenditures constant. ɛit is a random disturbance term.
γij is the impact of past imports from the jth source on present imports from the ith source. A positive own-lag estimate (γii > 0) suggests habit persistence, indicating that imports of a product increases preference for that product in the future. A negative estimate (γii < 0) suggests stocking behavior, which is also possible given the storable nature of bottled wine. The sign and magnitude of the cross-lag estimates (γij) depend on the cross-price relationship between products (substitutes versus complements) and the adjustment behavior of buyers (habits persistence versus stocking behavior) (Pollak Reference Pollak1970). γi is a constant, which is a measure of imports trends not due to prices or real aggregate expenditures. Note that a trend term in levels is represented by a constant term in a differenced model.
γi, γij, θi, and πij are treated as fixed parameters for estimation. Demand theory requires the following parameter restrictions for adding-up, homogeneity, and symmetry:

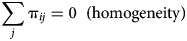

Given the parameters in equation 1, the short-run expenditure and compensated and uncompensated price elasticities are, respectively, as follows (Seale, Sparks, and Buxton Reference Seale, Sparks and Buxton1992):


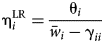
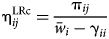
Setting Δq jt = Δq jt−1, we can also derive the long-run expenditure and compensated and uncompensated price elasticities, respectively, as follows (Bushehri Reference Bushehri2003):

Data and Estimation
Monthly import data (1994:1–2019:12) were obtained from the Global Trade Atlas, IHS Markit®. As mentioned, Japanese wine imports are limited to the following product category: HS 2204.21 (bottled wine) wine of fresh grapes (other than sparkling wine) in containers not exceeding 2 liters. The countries included in the analysis are the major suppliers: (in alphabetical order) Australia, Chile, France, Germany, Italy, Spain, and the United States. These countries have consistently accounted for about 95 percent of bottled wine imports in Japan since 1994. All remaining suppliers are aggregated into the rest of world (ROW). Unit values (value ÷ quantity) are used as proxies for import prices, which are reported in the previous section (Table 3). To account for price changes due to tariff reductions during the data period, we adjusted the unit values according to the EPA tariff schedules. In the case of the EU, the full adjustment was immediately applied: February 2019–December 2019. We applied partial adjustments to the unit values for Chile and Australia based on their respective tariff schedules (Table 1).
Due to limited data, domestic wine sales are not included in the analysis. This is not particularly problematic because imports account for the majority of consumption in Japan (approximately 70 percent) (Anderson and Harada Reference Anderson and Harada2018). There is also strong consumer differentiation between domestic and imported wine in Japan (Paulson and Kurai Reference Paulson and Kurai2018). This suggests that preferences are such that the marginal rate of substitution between domestic and imported wine is zero, or at the very least independent of the country of origin (i.e., domestic and imported wine are group-wise dependent). Theil (Reference Theil1980) shows that if this is the case, the Rotterdam model could be used to estimate import demand without accounting for domestic purchases.
The demand system represented by equation 1 was estimated using the generalized Gauss–Newton method in TSP (version 5.0), which is a maximum-likelihood procedure for equation systems (Hall and Cummins Reference Hall and Cummins2009). Due to the adding-up property, the demand system is singular and requires that an equation be deleted for estimation, but estimates are invariant to the deleted equation (Barten Reference Barten1969). We tested for price and expenditure endogeneity using the Wu–Hausman procedure similar to Henneberry and Hwang (Reference Henneberry and Hwang2007). The result indicated that endogeneity is not an issue. We also tested the parameter restrictions homogeneity and symmetry using likelihood ratio tests. We could not reject homogeneity at the 0.05 significance level, but we rejected symmetry given homogeneity. Both were still imposed on the model to improve the predictive power of the demand system (Kastens and Brester Reference Kastens and Brester1996). Elasticities and their corresponding standard errors were derived using the ANALYZ procedure in TSP.
Results
Import Demand Estimates
The demand estimates (marginal share and price coefficients) are reported in Table 4. The marginal share estimates (expenditure effect) for each source are positive and statistically significant at the 0.01 level. France has the largest marginal share estimate (0.58). This is expected given France's role as Japan's top supplier. The marginal share estimates indicate that for every dollar increase in total expenditures on imported wine, on average, $0.58 was spent on French wine. Significantly less was allocated to Australian ($0.02), Chilean ($0.09), German ($0.04), Italian ($0.14), Spanish ($0.04), U.S. ($0.06), and ROW ($0.03) wine.
Conditional Demand Estimates for Japanese Wine Imports by Source
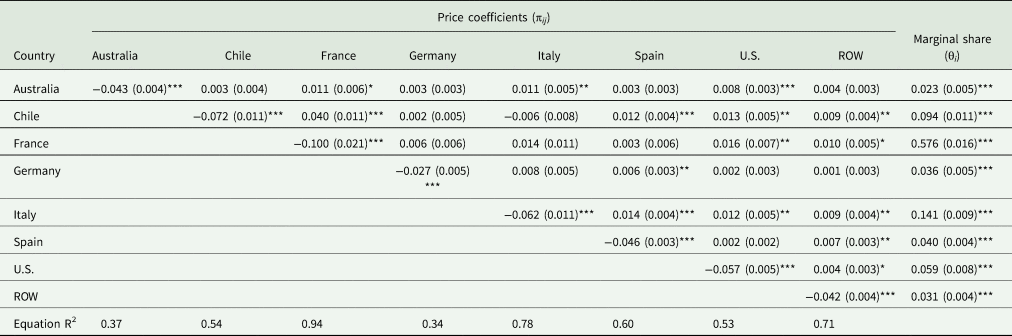
Note: Standard errors are in parenthesis. Homogeneity and symmetry are imposed on the estimates. ***, **, and * denote significance levels 0.01, 0.05, and 0.10, respectively. ROW is rest of world.
The conditional own-price effects (πii) (presented along the diagonal in Table 4) are all negative, which is to be expected, and statistically significant at the 0.01 level. The own-price effects range from −0.100 (France) to −0.027 (Germany). The cross-price estimates (off-diagonal values) indicate how Japanese consumers substitute wine from one supplier to another supplier (holding real expenditures constant). Results show significant competitive relationships (substitutes) across suppliers: Australia and France (0.011), Australia and Italy (0.011), Australia and the United States (0.008), Chile and France (0.040), Chile and Spain (0.012), Chile and the United States (0.013), Chile and ROW (0.009), France and the United States (0.016), France and ROW (0.010), Germany and Spain (0.006), Italy and Spain (0.014), Italy and the United States (0.012), Italy and ROW (0.009), Spain and ROW (0.007), and the United States and ROW (0.004). There are no conditional complementary relationships. Note that these estimates are best understood when used to derive elasticities, which are reported later in this section.
The trend and dynamic adjustment estimates (lag coefficients) are reported in Table 5. The results indicate a negative trend for French (−0.005) and German wine (−0.003), and positive trends for Spanish (0.002) and U.S. wine (0.003). The significance of the lag coefficients indicates that import demand responsiveness is not instantaneous. The own-lag estimates are statistically significant and positive for Australia, France, and ROW, indicating habit persistence. The own-lag estimate for Spain is significant but negative (−0.004), indicating stocking behavior.
Trend and Lag Coefficients for Japanese Wine Imports by Source
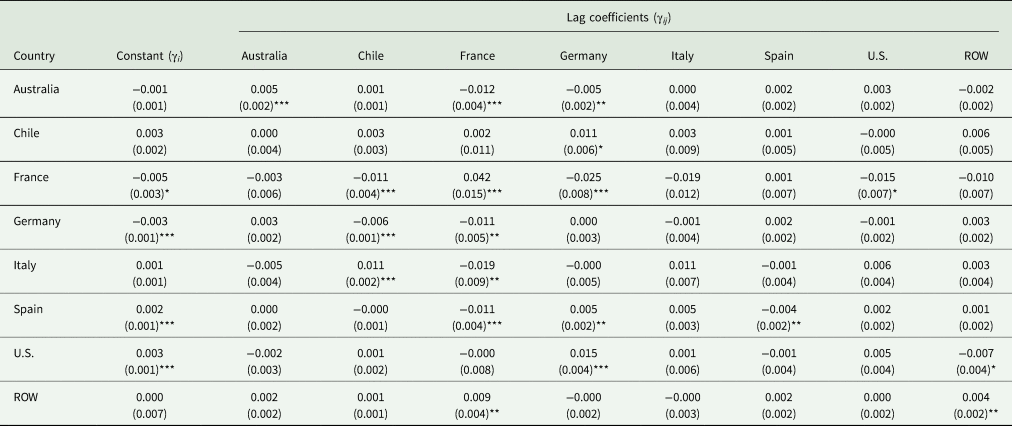
Note: Standard errors are in parenthesis. ***, **, and * denote significance levels 0.01, 0.05, and 0.10, respectively. ROW is rest of world.
The expenditure and own-price elasticities for Japanese wine demand are reported in Table 6. The expenditure elasticities are statically significant at the 0.01 level. Chilean wine has the highest expenditure elasticity in both the short-run and long-run (1.26 and 1.31), indicating that for every percentage increase in total expenditures on imported wine, imports of Chilean wine increases by about 1.3 percent. The demand for French wine in Japan is also expenditure elastic in both the short-run and long-run (1.10 and 1.20). Other than the long-run expenditure elasticity for Italian wine (1.00), all other estimates are less than one. The compensated own-price elasticities, which accounts for the substitution effect of a price change, are statically significant at the 0.01 level for all countries. The demand for Australian wine in Japan is the most elastic in both the short-run and long-run (−1.30 and −1.51). In the short run, the compensated own-price elasticities range from −1.30 (Australian wine) to −0.19 (French wine). In the long-run, the range is −1.51 (Australian wine) to −0.21 (French wine). The short- and long-run uncompensated own-price elasticities, which account for the substitution and income effect of a price change, are larger in absolute value but follow a similar pattern as the compensated own-price elasticities.
Expenditure and Own-Price Elasticities for Japanese Wine Demand by Source

a Compensated.
b Uncompensated.
Note: Standard errors are in parenthesis. All estimates are significant at the 0.01 level. ROW is rest of world.
Tariff Reform and Policy Simulation
We conducted policy simulations (import demand projections) using the long-run uncompensated price elasticities (Gustavsen and Rickertsen Reference Gustavsen and Rickertsen2003) and expected price changes based on the tariff schedules in each agreement. The cross-price elasticity estimates used for these projections are reported in the Appendix (Table A1). Since the EPA with Chile has been in place since 2007, we do not consider this agreement in the simulation procedure. The first simulations are based on the following: full tariff elimination for EU wine and elimination of the remaining tariff (approximately 4 percent) for Australian wine. The impacts of the EU and Australian agreements are assessed separately and compared to the baseline (3-year average imports: 2017–2019). We also address the issue of USJTA making up for any losses that U.S. wine may have experienced from existing agreements. To address this issue, we updated the baseline using the projection results from the EU and Australia EPAs. We then assessed the impacts of the initial tariff reduction for U.S. wine as specified in USJTA (15–8.5 percent). We also considered the outcome of full elimination (8.5–0.0 percent). Using the ANALYZ procedure in TSP (Hall and Cummins Reference Hall and Cummins2009), Monte Carlo simulations were used to derive 95 percent uncertainty intervals (UIs) using the standard errors of the elasticities. This provided a “high-low” range and allowed for assessing the statistical significance of each projection.
Results for the EU and Australian agreements are reported in Table 7. The impact of Japan-Australia agreement reflects the fact that Japanese importers are highly sensitive to Australian wine prices. When the tariff (approximately 4 percent) on Australia is eliminated, Japanese imports of Australian wine are projected at $31 million, which is an increase of $1.8 million and 6.1 percent when compared to the baseline. The UI indicates the following range with 95 percent confidence: $1.4–$2.2 million, indicating that the projected change is statistically significant. The projected changes and UI's indicate that the impact of this agreement on competing suppliers is negligible and/or insignificant. U.S. wine is the only exception, which is projected to decrease by $0.38 million [−0.70, −0.06].Footnote 2
Long-Run Import Projections Based on Australia and EU Agreements with Japan
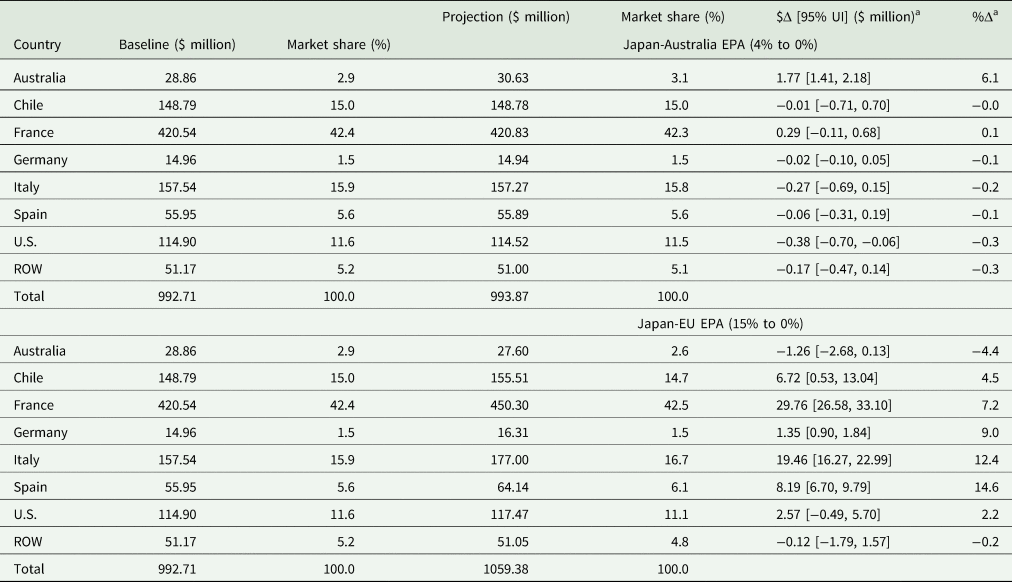
a Changes are projections relative to the baseline values.
Note: Baseline values are 3-year averages (2017–2019). ROW is rest of world.
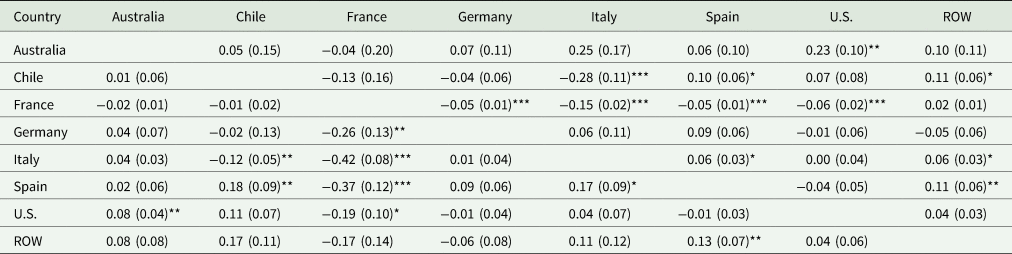
Given the tariff elimination on the EU, Japanese imports of French, German, Italian, and Spanish wine are all projected to increase. French wine is projected to increase to $450.3 million, an increase of $29.7 million [26.58, 33.10] or 7.2 percent. Imports of German wine are projected at $16.3 million, an increase of $1.4 million [0.90, 1.84] or 9.0 percent. Italian wine is projected at $177.0 million, an increase of $19.5 million [16.27, 22.99] or 12.0 percent. Spanish wine is projected to increase to $64.1 million, an increase of $8.2 million [6.70, 9.79] or 14.9 percent. The EU agreement does not have a significant impact on non-EU countries except Chile. Imports of Chilean wine are projected to increase by $6.7 million [0.53, 13.04] or 4.5 percent, primarily due to the significant and negative uncompensated cross-price elasticity between Chile and Italy (Table A1). Although insignificant, the projected increase for U.S. wine ($2.57 million) indicates that the United States could actually benefit from the Japan-EU EPA, primarily due to an uncompensated complementary relationship between U.S. and French wine (Table A1).
Import projections for USJTA are reported in Table 8. The purpose of these simulations is to assess if tariff reductions on U.S. wine could negate any negative changes from existing agreements. Note the updated baseline in Table 8, which is derived using the significant outcomes from Table 7. The United States is the only country where the updated baseline value is less than the original baseline value (−$0.38 million), primarily due to the impact of the Australia EPA on imports of U.S. wine. Given the first-year tariff reduction (15–8.5 percent) as specified in USJTA, Japanese imports of U.S. wine are projected at $121.4 million. This is an increase of $6.9 million [5.72, 8.18] or 6.0 percent, far exceeding the projected losses from the existing agreements. Australia is the only country negatively impacted by USJTA (−$0.52 million, −1.7 percent). French wine is actually projected to increase ($2.2 million, 0.5 percent). This is due to the significant and negative uncompensated cross-price elasticity between French and U.S. wine (Table A1). To examine the full tariff elimination outcome, we use the results from the partial tariff reduction (Projection*) as starting values. Full tariff elimination on U.S. wine results in an increase in imports of $7.8 million [6.47, 9.25], which is in addition to the increase from the initial tariff reduction. Other than Australia, and France to a lesser degree, the effects of USJTA on competing countries are negligible and insignificant.
Long-Run Import Projections Based on the U.S.-Japan Trade Agreement
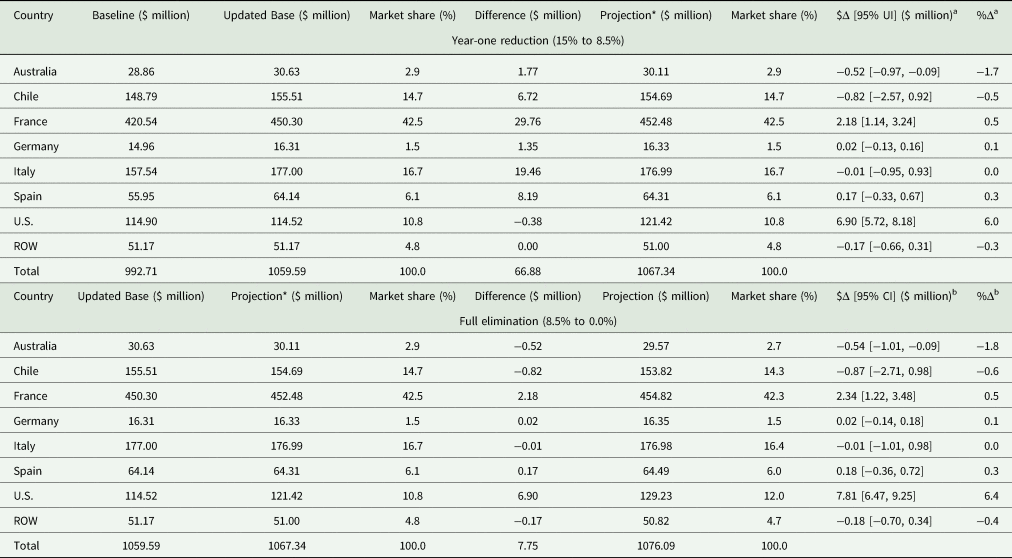
a Changes are projections relative to the updated base values.
b Changes are projections relative to Projection* values.
Note: Baseline values are 3-year average imports (2017–2019). Updated Base is the baseline updated to reflect the significant changes in Table 7. ROW is rest of world.
Conclusion
In this study, we estimated the demand for imported wine in Japan by source assuming a dynamic framework. The overall objective was to obtain estimates to simulate the impact of trade agreements on Japanese wine imports and assess the relationship between tariffs and exporter competitiveness. From the simulations, we can conclude the following. First, tariff reductions primarily affect countries a party to an agreement. In all instances, imports from each country are projected to significantly increase under their respective agreements. Second, bilateral agreements such as Japan-EU EPA, JAEPA, and USJTA marginally impact competing countries. A noted exception was the impact of USJTA on Australian wine. For the EU agreement, the most significant change for a competing country (Chile) was actually positive.
The main takeaway from this study is that tariff reductions clearly benefit wine-exporting countries in Japan, but substitutions across wine-exporting countries are minimal. This would suggest that the overall concerns raised by U.S. producers about loss competitiveness in the Japanese market due to existing and recent trade agreements do not fully apply to the wine sector. This may be due to the nature of foreign wine preferences, which are likely different from relatively homogenous commodities like wheat, rice, or corn. There is some evidence that the Japan-Australia EPA might have negatively affected U.S. wine exports to Japan, but this effect is small when compared to the positive effect of Japan removing tariffs on U.S. wine. USJTA counterbalancing the effects of recently existing trade agreements countries is clearly important. However, in the case of U.S. wine, USJTA should lead to significant increases in exports that appear to be the result of an increase in overall sales, as opposed to a reallocation of existing demand across exporting sources.
Acknowledgments
This article benefited from comments and suggestions from two anonymous reviewers and the Editor.
Author contributions
Both authors contributed equally to this article and share authorship.
Appendix
The long-run uncompensated cross-price elasticities are reported in Table A1. These estimates along with the long-run uncompensated own-price elasticities in Table 6 were used for the trade policy projections in Tables 7 and 8. Note that these estimates include both the substitution and income effect of a price change.
Long-Run Uncompensated Cross-Price Elasticities


 Open access

