



INTRODUCTION
Influenza infection is associated with 51 000 deaths each year in the USA, representing 2·2% of all US deaths per year [Reference Thompson1]. The rapidly spreading pandemic influenza A(H1N1)pdm09 that emerged from Mexico in spring 2009 infected 43–89 million individuals by the end of the outbreak and was responsible for 8870–18 300 deaths, as estimated by the Centers for Disease Control and Prevention (CDC) [2]. This new virus caused death in otherwise healthy young adults in larger numbers compared to typical influenza viruses [Reference Fineberg3]. Influenza A(H1N1)pdm09 swept through the rural university town of Pullman, WA, USA, in August 2009, and rapidly infected about 10% of the student population. In this community, which was particularly vulnerable to H1N1 infection due to more than 90% of individuals being young adults aged 18–26 years, individuals are well-informed and well-connected by the academic environment in which they interact with others in close proximity, and they are subject to minimal or no outside movement such as immigration or emigration, as well as no pharmaceutical or containment interventions. The ability to accurately understand and predict mechanisms of epidemic spread in the unique environment of a rural university town based upon collected data is of critical importance.
Compartmental models [Reference Brauer4] have been used in the past to analyse numerous influenza outbreaks including the H1N1 pandemic of 1918 and the 1968–1971 H3N2 epidemic [Reference Mathews5], as well as to predict the potential severity of a future influenza outbreak [Reference Roberts6] and to determine how vaccines or drug resistance may affect the spread of infection [Reference Alexander7]. In the case of 2009 pandemic H1N1, modelling approaches were used to predict epidemic dynamics [Reference Chao8–Reference Yang11], to assess the efficacy of the CDC planned vaccination scheme for the US epidemic [Reference Towers and Feng12], to examine the effect of control measures [Reference Cruz-Pacheco13], to assess the potential severity and transmissibility of the pandemic [Reference Fraser14], and to determine the contagious period of this viral strain [Reference De15] (for review, see [Reference Boelle16]).
Unlike studies of epidemic spread in urban settings [Reference Chao8, Reference Chao9, Reference Yang11], only a few studies have explored influenza dynamics in geographically contained settings, which can have quite different dynamics. Wearing et al. [Reference Wearing, Rohani and Keeling17] used trajectory matching on incidence data to parameterize epidemic models and determine the basic reproductive rate (R 0) of an influenza outbreak in an English boarding school [18]. Mathews et al. [Reference Mathews5] estimated R 0 in two populations, an H3N2 outbreak on an island in 1971 and the H1N1 pandemic in military camps in 1918. No studies, however, have examined H1N1 spread in a rural university setting, although there are dozens of such areas throughout the USA and elsewhere.
In this work we present a dataset from Washington State University (WSU) that describes the number of influenza cases reported to the university health service between August and December 2009. The small university town of Pullman, WA, USA is in a rural region surrounded by agricultural land with most students residing in town to attend the university. This dataset provides a unique opportunity to study an influenza epidemic spreading through the geographically contained community of a rural university town. Using this dataset we developed mathematical models to understand the mechanisms of infection for pandemic H1N1 [i.e. A(H1N1)pdm09] in a university student population. Specifically, we aimed to determine the role of self-protection on H1N1 dynamics, quantify the impact of the protected group and derive basic infection parameters. To our knowledge, this work is the first investigation to use compartmental modelling with data to understand H1N1 epidemic dynamics in a rural university campus setting. This may provide valuable insight into the dynamics of H1N1 infection and allow us to better prepare for the next epidemic by more accurately predicting the factors that influence H1N1 spread.
METHODS
Data collection
The epidemiological data were collected by WSU (Pullman, WA, USA) student health centre, Health and Wellness Services (HWS), from students who sought medical care from the centre. Data were collected daily from the start of the autumn semester on 22 August 2009 for 4 weeks, and thereafter on Mondays to Saturdays until the end of the epidemic on 3 December 2009. HWS is normally closed on Sundays but remained open once the epidemic was underway due to the number of ill students. Data were not available due to Sunday closure on 23 August 2009 and on Sundays from 20 September 2009 onwards, or on 26–28 November 2009 when HWS was closed for the Thanksgiving holiday. The population served by HWS includes undergraduate and graduate students. Each person who called or visited HWS with any symptom of influenza-like illness (ILI) was assumed to be positive for H1N1. Initially, all influenza that was seen and tested by HWS was confirmed to be influenza A(H1N1)pdm09. After 10 days, however, any individual with ILI was considered a case of H1N1, as per CDC recommendations [19]. The prevalence of infection was calculated assuming a recovery time of 6 days [Reference De15]; i.e. ρ t /N = ρt − 1 /N + γ t /N − rt /N, where ρ t is the number of individuals with infection on day t, γ t are the new cases on day t, r t are individuals who recover on day t, and N is the total population size (18 234).
Models
We employed a classical SIR model [Reference Kermack and Mckendrick20] as well as two models with protection of susceptibles (SPIR and alternate SPIR), and a quarantine model (SIQR) [Reference Nuno21] for the purpose of modelling the 2009 H1N1 outbreak in Pullman, WA, USA. For each model we provide the expression for the basic reproductive rate, R 0, which is defined as the average number of secondary infections that result when one infected individual is introduced into a population of susceptibles [Reference Anderson and May22]. R 0 is a threshold that delineates whether an epidemic spreads (R 0 > 1) or dies out (R 0 < 1). We employed the next-generation method [Reference Van den Driessche and Watmough23] to calculate R 0.
Kermack–McKendrick model
In the SIR model, S represents the density of susceptible individuals, I represents the density of infected individuals, and R represents the density of recovered individuals. The full model is given by

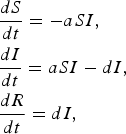 $$\eqalign{& \displaystyle{{dS} \over {dt}} = - aSI\comma \cr & \displaystyle{{dI} \over {dt}} = aSI - dI\comma \cr & \displaystyle{{dR} \over {dt}} = dI\comma} $$
where a is the transmission rate and d is the recovery rate. The basic reproductive rate for this model is given by
 $${R_0} = \displaystyle{a \over d}{S_0}.$$
Model with protection
We also consider the following modification of the SIR model, where an additional compartment (P) represents susceptible individuals with self-protection from infection (hereafter, ‘protection’):
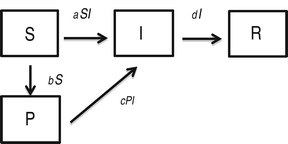
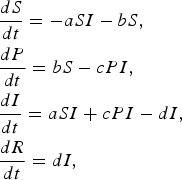 $$\eqalign{& \displaystyle{{dS} \over {dt}} = - aSI - bS\comma \cr & \displaystyle{{dP} \over {dt}} = bS - cPI \comma\cr & \displaystyle{{dI} \over {dt}} = aSI + cPI - dI \comma\cr & \displaystyle{{dR} \over {dt}} = dI\comma} $$
where a is the transmission rate of susceptible individuals without protection, b is the rate of protection, c is the rate at which protected individuals become infected, and d is the recovery rate. In this model c > 0 indicates that the protection from infection is partial. We found that the basic reproductive rate for this model is given by
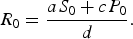 $${R_0} = \displaystyle{{a{S_0} + c{P_0}} \over d}.$$
Alternate model with protection that is 100% effective
In this model, 100% effectiveness of protected individuals is captured by considering absolutely no infection of individuals in P class.
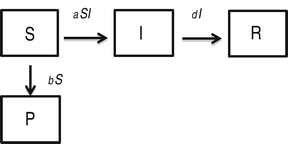
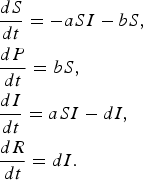 $$\eqalign{& \displaystyle{{dS} \over {dt}} = - aSI - bS\comma \cr & \displaystyle{{dP} \over {dt}} = bS\comma \cr & \displaystyle{{dI} \over {dt}} = aSI - dI\comma \cr & \displaystyle{{dR} \over {dt}} = dI.} $$
We found that the basic reproductive rate for this model is given by
 $${R_0} = \displaystyle{a \over d}{S_0}.$$
Epidemic management (quarantine) model
In this model [Reference Hethcote, Ma and Liao24], infected individuals self-quarantine at rate b, due to symptoms of infection, which removes them from mixing and infecting other susceptible individuals. Quarantined infected individuals recover at rate g.
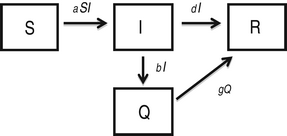
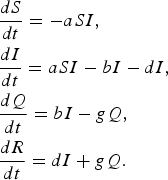 $$\eqalign{& \displaystyle{{dS} \over {dt}} = - aSI\comma \cr & \displaystyle{{dI} \over {dt}} = aSI - bI - dI\comma \cr & \displaystyle{{dQ} \over {dt}} = bI - gQ \comma\cr & \displaystyle{{dR} \over {dt}} = dI + gQ.} $$
We found that the basic reproductive rate for this model is given by
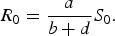 $${R_0} = \displaystyle{a \over {b + d}}{S_0}.$$
Model assumptions and initial values
We consider this a closed population (i.e. a population with no births, deaths or continual immigration and emigration), since we considered birth and death during the semester to be insignificant due to the age group of the students, and we also considered entry and exit of students during the semester to be negligible, because students typically do not leave campus for the duration of the semester. We considered that the infection began after a single mass immigration event when students returned to campus after the summer break. Models assumed that all individuals with H1N1 contacted the university health centre, and no callers called more than once. Recovery time was 6 days [Reference De15]; thus the parameter d = 1/6 per day in all models. We assumed all infected individuals were symptomatic. Among the total population of size N = 18 234, the initial populations in different compartments were as follows:
 $$\eqalign{&S\left( 0 \right) = {S_0} = 18223; \quad I\left( 0 \right) = {I_0} = 11;\cr &R\left( 0 \right) = P\left( 0 \right) = Q\left( 0 \right) = 0.}$$
Parameter estimation and model selection
We fitted several models to the data using a nonlinear least squares approach to find the model that best fits the data. We also estimated the parameter values for the potential transmission rates and protection rate. For the parameters of the best-fitting model, we calculated 95% confidence intervals using 10 000 bootstrap replicates [Reference Efron and Tibshirani25].
For the purpose of model comparison, we calculated the error sum of squares (SSE), the regression sum of squares (SSR), the total sum of squares (SST) as well as R 2, the coefficient of multiple determination, and R 2 adj, the adjusted coefficient of multiple determination. The model with the greatest R 2 adj, which balances the cost of using more parameters against the gain in R 2, can be considered the model that best matches the data [Reference Devore26]. Furthermore, to determine if a group of predictors are jointly statistically significant, we performed the F test [Reference Bates and Watts27]. Note that the SIR model is the nested model of all other models considered. Using the F test, we compared the impact of the predictors of full models (SPIR, alternate SPIR, and SIQR) to the predictors of the nested SIR model in regards to best fit [Reference Devore26].
The test statistic used for this F test is
 $$F = \displaystyle{{(SS{E_j} - SS{E_k})/(k - j)} \over {SS{E_k}/(n - k)}},$$
where SSE j is the SSE value for the reduced model with j parameters, SSE k is the SSE value for the full model with k parameters, and n is the number of data points. The subset of the predictors in the full model is significant if the F statistic is greater than the value of an F distribution with the appropriate degrees of freedom [Reference Devore26, Reference Bates and Watts27].
RESULTS
Epidemiological data on the 2009 H1N1 outbreak in a rural university town
The prevalence data (the number of individuals with infection/total population size) are shown in Figure 1. The prevalence increased markedly over the first 2 weeks of the outbreak, reaching a peak of 3·57% on day 13. Cumulatively, over 2000 students were infected (i.e. more than 10% of the population). The epidemic resolved by the end of the semester.
University health centre data (infected fraction of total population over time).

SPIR model gives best fit to data
Kermack–McKendrick model fit
Using the recovery rate of d = 1/6 per day [Reference De15], the SIR model was fitted to the WSU dataset. It captures the initial rise in infection, the peak, and the resolution over the next several months, as seen in the epidemiological data. The prevalence of infected individuals is shown in Figure 2a . The R 2 adj and other statistical measures of variation are shown in Table 1. We observed that the model peak fits the data better than the model tail, and therefore we tested whether a better fit would be produced by truncating the dataset on day 38, after the decline in infections following the peak. Fitting the model with the truncated dataset, however, did not show a better fit, as can be seen in Figure 2b and by the reduced R 2 adj (Table 1). As the full dataset provides a better fit for this model, the full dataset was used in the subsequent studies.
(a) Prevalence of infected individuals for the Washington State University (WSU) full dataset from days 0 to 103, for data (solid line) and the SIR model (dotted line). (b) Prevalence of infected individuals for WSU truncated dataset from days 0 to 38, for data (solid line) and the SIR model (dotted line).

Statistics of model fitting

* SSE, Error sum of squares; R 2, coefficient of multiple determination; R 2 adj, adjusted coefficient of multiple determination.
† Modelled with full dataset.
‡ Modelled with truncated dataset.
SPIR model fit
Next we investigated whether we would find a better fit between the model and the data if we modified the model to include the condition that some individuals received some protection from infection during the epidemic. This protection could potentially consist of self-isolation or social distancing by susceptibles or other preventative measures undertaken by susceptibles due to concern about the risk of infection. Plots of the prevalence of infection for the data and the fitted protection model (SPIR) are shown in Figure 3. The SPIR model prediction is in excellent agreement with the full dataset, and the R 2 adj of the dataset with the SPIR model is greater than that with the SIR model (Table 1). This indicates that the SPIR model gives a better fit than the SIR model, signifying the importance of the protected group. Furthermore, we performed the F test and found that the better fit provided by the SPIR model is statistically significant (F test, P < 0·001).
Prevalence of infected individuals for the Washington State University full dataset, for data (solid line) and the SPIR model (dotted line).

Alternate SPIR model fit. The SPIR model investigated a situation where individuals in the population with some protection were still susceptible to infection. The alternate SPIR model explores a situation in which the effect of protection was absolutely perfect. Plots of the prevalence of infection for the data and model are shown in Figure 4. The F test showed that the alternate SPIR model did not produce a significantly better fit than the SIR model. The R 2 adj of the dataset with the alternate SPIR model is less than that with the SPIR model (Table 1), indicating that the SPIR model gives a better fit than the alternate SPIR model. We next asked if the extra predictor in the SPIR model (compared to the alternate SPIR model), representing the transmission rate of the protected population, was a significant predictor for the goodness of fit. For this, we performed the F test with the alternate SPIR model as the nested model and the SPIR model as the full model, and found that the full model leads to a significantly better fit of the observed data. Therefore the additional parameter in the SPIR model, the transmission rate of the protected population, contributes significantly to making the SPIR model the best-fitting model.
Prevalence of infected individuals for the Washington State University full dataset, for data (solid line) and the alternate SPIR model (dotted line).

SIQR model fit. Next we investigated whether a better fit to the data would be found if we considered a model in which infected individuals were quarantined. Quarantine of infected individuals was thought to play a role because HWS had urged students to recover before resuming class attendance in order to slow the spread of the epidemic. Furthermore, some students reported that floors of their university dormitories were quarantined. On fitting the SIQR model to the full dataset (Fig. 5), we observed that the R 2 adj of the fit with the SIQR model is less than that with the SPIR model (Table 1). This shows that the SPIR model gives a better fit to the data than the SIQR model. Further F tests confirmed that the additional predictors in the SIQR model (compared to the SIR model) do not improve the goodness of fit.
Prevalence of infected individuals for the Washington State University full dataset, for data (solid line) and the SIQR model (dotted line).

Estimation of parameters and basic reproductive rate for best-fitting model
Using the best-fitting model, SPIR, we estimated parameters a, b, and c for H1N1 epidemic dynamics in this rural university town (Table 2). Our estimates show that the transmission rate of susceptibles without protection was 5·45 × 10−5 [95% confidence interval (CI) 5·33 × 10−5 to 6·05 × 10−5] per individual per day. During the epidemic, these susceptible individuals transfer into the protected group at the rate of 0·15 (95% CI 0·14–0·18) per day. Our results show that this protection substantially reduces susceptibility to H1N1 infection by lowering the transmission rate over 14-fold, to 3·74 × 10−6 (95% CI 3·65 × 10−6 to 5·35 × 10−6) per individual per day (Table 2). The basic reproductive rate, R 0 [Reference Anderson and May22, Reference Heesterbeek28, Reference Heffernan, Smith and Wahl29], obtained using our estimated parameter values from the best-fitting model (SPIR), was 5·96 (95% CI 5·83–6·61).
Model parameters and initial values for the best-fitting model, SPIR

* CI, 95% confidence intervals (generated by 10 000 bootstrap replicates).
The protected group has a substantial impact on epidemic dynamics
We quantified the effect of the protected group. We investigated whether the epidemic could have been prevented if the initial proportion of protected individuals was increased, what proportion of the population was protected over the course of the epidemic, and how many new infections were generated by the protected group. We found that increasing the initial proportion of the protected group can substantially reduce R 0 (Fig. 6a ). In fact, if the initial proportion of the protected population is high enough (around ⩾90%), this would lower R 0 below 1. Thus a large initial protected group could prevent the epidemic. The protected group constitutes a large portion of the population, particularly after the first 3 weeks of the epidemic, reaching >80% of the population (Fig. 6b ). As a result, a moderate number of new infections arise from the protected group over the course of the epidemic, although more new infections arise from the susceptible group (Fig. 6c ). After the first 3 weeks of the epidemic, more new infections arise from the protected group than from the susceptible group. Therefore, the protected group plays a substantial role in the epidemic dynamics.
(a) The basic reproductive rate, R 0, as a function of the initial proportion of the protected group, P(0) (solid line). The threshold, R 0 = 1, delineating whether an epidemic will spread or die out, is shown (dotted line). (b) Prevalence of susceptible individuals (solid line) and protected individuals (dotted line) during epidemic using the SPIR model. (c) New infections arising from the susceptible group (solid line) and protected group (dotted line) during epidemic using the SPIR model.

DISCUSSION
In this study we investigated the transmission mechanisms and quantified the role of a protected group in the 2009 H1N1 influenza epidemic in Pullman, WA, USA. By fitting models to the epidemic data using nonlinear optimization, we estimated the transmission parameters of the epidemic. Unlike many early studies of H1N1 transmission [Reference Fraser14, Reference Boelle, Bernillon and Desenclos30–Reference Nishiura and Roberts32] that considered either countrywide or international spread of infection, we investigated the 2009 H1N1 epidemic in a university town community subject to minimal to no outside intervention. In this unique setting, in which the population mostly consists of young adults aged 18–26 years, the spread of infection is largely governed by the interactions in the academic environment. For such environments, we identified that the SPIR model, which considers the potential effects of the protected group, was the best fitting model, with the highest R 2 adj compared to the SIR model, the alternate SPIR model (with complete protection), and the SIQR (quarantine) model.
Our results suggest that a portion of the susceptible population was afforded some protection from infection during the epidemic. The protected compartment constitutes a large proportion of individuals after the first 3 weeks of the epidemic, at which point more new infections come from this population than the susceptible population. This protection may have resulted from awareness about the epidemic and subsequent precautions undertaken by susceptible individuals to reduce their exposure, such as social distancing, increased hand washing [Reference Cowling33] or vitamins and supplements [Reference Roxas and Jurenka34]. This result is realistic, considering that the population at risk was extremely well informed. The university issued daily reports on the epidemic, urging individuals to be careful and indicating measures they could take to avoid infection. Furthermore, the population was well connected, since all individuals were involved in the educational programmes of the university, with the ability to share information through their interactions in classes and other activities. Vaccination was not thought to play a role in the protection, because the H1N1 vaccine was not available before the outbreak; it was rolled out later in the year. Regarding quarantine, our results showed that despite the university's recommendation to stay home when ill, quarantine did not play a noticeable role.
This study makes an important contribution to the field of epidemic modelling for influenza. Theoretical modelling has been used to examine influenza spread in a geographically isolated area [Reference Roberts6]; however, there are only a few cases where modelling and data have been combined for a closed epidemic [Reference Mathews5, Reference Wearing, Rohani and Keeling17, 18, Reference Murray35], and, to the best of our knowledge, no other studies focus on the rural university setting. The WSU H1N1 dataset is unique because it describes the epidemic from the beginning of the outbreak before the peak of infection, to its resolution, in a population on a university campus that was likely to have had little immigration or emigration. Unlike the boarding school dataset (number of data points, n = 14) [18] or the island dataset (n = 50) [Reference Mathews5], in our study we have a much larger dataset (n = 104). While other studies used simulation or other modelling approaches to predict future epidemic dynamics [Reference Chao8–Reference Yang11, Reference Fraser14], in this work we used compartmental modelling to determine what mechanisms most likely played a role in the spread of this influenza epidemic in university town setting. Several characteristics distinguish this type of population from others, in that individuals are young adults aged between 18 and 26 years who are highly connected by the university, and they interact according to similar routines by way of adherence to the academic schedule.
Furthermore, finding reliable transmission data in closed or restricted populations to shed light on influenza dynamics is often difficult, particularly for epidemics such as the 2009 H1N1 pandemic, which affect the global population and are confounded by inconsistent data collection and the movement of individuals between different areas. Without data from a closed population, basic transmission parameters, including R o, can be difficult if not impossible to determine. Wearing et al. calculated R 0 for the boarding school epidemic to be 3·74 with the SIR model [Reference Wearing, Rohani and Keeling17]. Mathews et al. estimated R 0 to be between 3·73 and 10·69 for the island outbreak, in which the infection was introduced to the population as a single immigration event, similar to our collected data [Reference Mathews5]. Our SPIR model, which we found to be the best fit for the WSU H1N1 data, gave R 0 = 5·96 (5·83–6·61) for this rural university town environment. This value falls between those of these other estimates, and reflects that H1N1 spread rapidly through the campus community. This is reasonable; with most of the students living on or adjacent to campus, students may have spread the virus simply by social behaviour and attending classes even with influenza symptoms. Interestingly, we found that the value of R 0 is highly dependent on the initial proportion of the protected group in the university town, and with significantly higher levels of such a protected group, R 0 can be brought down to below 1 and an epidemic can be avoided.
Some limitations to this study should be noted. First, we modelled a population of students on a college campus within close proximity to one another at all times. Consequently, our results may not be generalizable to other populations. However, our results are relevant for many settings that share characteristics of our population including military units, islands, nursing homes, boarding schools, and other rural college campuses, in which the community is surrounded by a large region with low population, approximating a closed population. Rural college campuses differ from those near or in metropolitan regions, in which the immigration of infected individuals that can repeatedly seed the infection would be expected to occur more frequently and to a greater extent. Second, we used a model that assumed a closed population in which students did not leave for the duration of the epidemic. However, it may not be a strictly closed population, since a small percentage of students may commute or drop out, and non-students may travel in and out of the community. Third, we note that transmission rates vary among viruses, and hence our analyses may need to be repeated were a novel virus to appear. Furthermore, the modelling results presented here rely upon the use of deterministic modelling, which captures the dynamics of large populations but not small populations or rare events. Additionally, all students who were infected with H1N1 were assumed to have contacted HWS, and all students who contacted HWS with ILI were assumed to have had H1N1 as opposed to other illnesses. If these assumptions are inaccurate, then our results would underestimate the magnitude of the epidemic and the transmission rate, in the case that not all students with H1N1 contacted HWS, and our results would overestimate transmission in the case that some students with ILI counted by HWS did not have H1N1. Finally, we acknowledge the limitation that the central result regarding the choice of the best-fitting model is entirely based on the R 2 adj and F test of this rich dataset. Further study with more accurate data will provide a better estimate of the impact of the protected group.
The main goals of this work were to gain deeper insight into the mechanisms of epidemic spread of H1N1 and quantify the impact of the protected group in a rural college campus environment. The results identify the importance of the protected group and indicate that the protected group alone, if large enough, would be sufficient to reduce R 0 below 1. In conclusion, this work offers novel insight into influenza epidemiology and advances current knowledge of influenza epidemiology by indicating that effective epidemic control strategies in other geographically contained communities should consider the local population structure, as slowing a rapidly spreading outbreak may require different interventions than in the case of the general population.
ACKNOWLEDGEMENTS
The authors thank D. Garcia from Health and Wellness Services for providing the epidemiological data. We also thank D. Chao, E. Johnson, X. Wang, C. Cobbold, A. Dawes, and R. Tyson for useful discussions, as well as the anonymous reviewers for helpful suggestions. Finally we thank J. L. Kwon, G. Vogel, and A. Piazza for initial studies. E.J.S. acknowledges startup funding and seed grant funding from Washington State University. N.K.V. acknowledges startup funding from the University of Missouri–Kansas City and the UMRB grant from the University of Missouri Research Board.
DECLARATION OF INTEREST
None.



