
1. Introduction
The purpose of this paper is to
-
∙ summarise how recent changes made to Financial Reporting Council (FRC) reporting regulations are likely to impact corporate risk identification, measurement, evaluation and monitoring practices, and provide assurance to stakeholders concerning future viability;
-
∙ review the relevant literature concerning firm disclosures of risk information that may bear on the topic;
-
∙ provide archival evidence of how risk reporting practices by a sample of UK-listed firms during the transitional period have been impacted by key relevant provisions of the revised code provisions, and consider how these practices have been evolving; and
-
∙ provide examples of best practices by firms in complying with the FRC Corporate Codes in the period immediately before their mandatory implementation.
We believe these topics are important because the changes in FRC reporting requirements will have a significant impact upon many companies and will in many cases need enhancements to risk management processes. This is of interest to the actuarial profession because many of the changes focus on the modelling and quantification of risks – areas where actuaries have significant experience and could potentially provide assistance to companies outside the financial services sector.Footnote 1
We have approached this research through both quantitative and qualitative analysis of a sample of corporate report and accounts covering a wide spectrum of company sizes. Our focus throughout this report is on reporting within published annual report and accounts. We recognise that some companies will provide additional reporting of risks by means other than their annual report but this is out of the scope of our analysis.
The remainder of this paper is organised as follows. Section 2 provides details of the recent developments in the UK Corporate Governance Code. Section 3 provides a literature review. Section 4 outlines the research methodology. Section 5 discusses the results of empirical tests concerning the association of trends in levels and changes of risk disclosure quality and various firm characteristics. Section 6 evaluates case studies of best practice disclosures. Section 7 provides a conclusion. Section 8 discusses the potential implications for actuaries.
2. Background
The UK Corporate Governance Code and associated Guidance (commonly referred to as the “Turnbull Guidance”), which are issued by the FRC, have long set expectations for UK-listed companies with regard to the management and reporting of risks. The UK Corporate Governance Code has been updated numerous times with the previous version of the code issued in 2012. The Turnbull Guidance was first issued in 1999 and was subsequently updated in 2005.
The most recent work to update the Code and Guidance commenced with the Sharman Inquiry in 2011 which focussed on post financial crisis going concern disclosures. After an extended period of consultation a revised version of the UK Corporate Governance Code was issued in September 2014, together with a replacement for the previous Turnbull Guidance entitled Guidance on Risk Management, Internal Control and Related Financial and Business Reporting.
The changes were effective for financial years commencing on or after 1 October 2014. For companies with a calendar financial year this means that the report and account covering the 2015 financial year will be the first for which the new Code and Guidelines are a requirement. The analysis in this paper focusses on 2013 and 2014 report and accounts. The report and accounts covering the 2013 financial year will typically have been issued in the first half of 2014 before the new Code and Guidelines were published. The report and accounts covering the 2014 financial year will typically have been issued in the first half of 2015 after the new Code and Guidelines had been published but before they became a requirement. These accounts therefore presented an opportunity for firms to voluntarily adopt all or some of the new requirements early.
With regard to the UK Corporate Governance Code, the main changes impacting risk management processes and disclosures are set out below.
The Code sets out a number of Main Principles under which sit specific code provisions.
There has been only a very minor change to the Main Principle relating to risk management and internal control with the term “significant risks” being replaced by “principal risks” and the text now reading as follows:
“The board is responsible for determining the nature and extent of the principal risks it is willing to take in achieving its strategic objectives. The board should maintain sound risk management and internal control systems”.
There are now three code provisions within this section of the Code where previously there was just one. The three provisions are as follows:
“C.2.1. The directors should confirm in the annual report that they have carried out a robust assessment of the principal risks facing the company, including those that would threaten its business model, future performance, solvency or liquidity. The directors should describe those risks and explain how they are being managed or mitigated”.
“C.2.2. Taking account of the company’s current position and principal risks, the directors should explain in the annual report how they have assessed the prospects of the company, over what period they have done so and why they consider that period to be appropriate. The directors should state whether they have a reasonable expectation that the company will be able to continue in operation and meet its liabilities as they fall due over the period of their assessment, drawing attention to any qualifications or assumptions as necessary”.
“C.2.3. The board should monitor the company’s risk management and internal control systems and, at least annually, carry out a review of their effectiveness, and report on that review in the annual report. The monitoring and review should cover all material controls, including financial, operational and compliance controls”.
The first two of these provisions are new. The third is very similar to the previous code provision. C.2.1 adds a requirement to describe the principal risks and how they are being managed or mitigated. The description of principal risks was already a requirement of the Companies Act 2006 but was not previously referred to within the Code. C.2.2 introduces forward-looking statements about the ongoing viability of the firm.
In this revision of the Code the FRC also enhanced the provision relating to going concern assessment. The provision now reads as follows:
“C.1.3. In annual and half-yearly financial statements, the directors should state whether they considered it appropriate to comply with the going concern basis of accounting in preparing them, and identify any material uncertainties to the company’s ability to continue to do so over a period of at least twelve months from the date of approval of the financial statements”.
As noted earlier, the updated “Turnbull” Guidance was issued in September 2014 with the title Guidance on Risk Management, Internal Control and Related Financial and Business Reporting. This was a significant revision to previous guidance reflecting the changes to the Code, the recommendations of the Sharman Inquiry and generally enhanced expectations regarding risk management best practice.
It is not the role of this paper to provide a comprehensive summary of the revised guidance but we highlight paragraph 50 of the Guidance which states that
“The descriptions of the principal risks and uncertainties should be sufficiently specific that a shareholder can understand why they are important to the company. The report might include a description of the likelihood of the risk, an indication of the circumstances under which the risk might be most relevant to the company and its possible impacts. Significant changes in principal risks such as a change in the likelihood or possible impact, or the inclusion of new risks, should be highlighted and explained. A high-level explanation of how the principal risks and uncertainties are being managed or mitigated should also be included”.
Overall, the revised guidance materially increases the expectations for risk management processes within firms. In a report by the Institute and Faculty of Actuaries (IFoA, REF1) it was concluded:
“The current guidance and the current processes in many firms are based on a traditional, control-focussed approach to risk management. However, the new guidance is asking firms to embrace a much more advanced, enterprise-wide risk management process that encompasses many advanced elements such as a focus on culture, decision making and sophisticated quantification and modelling of risks”.
In conclusion, the new Corporate Code, effective for reporting periods ending after 30 September 2015, requires that UK company annual reports must now incorporate a new “strategic report” element that must include specific statements concerning the following elements:
-
∙ a “robust assessment” about their principal risks (C.2.1);
-
∙ the company management’s expectations about the future prospects of the company (C.2.2); and
-
∙ a review of the effectiveness of risk management procedures and monitoring policies (C.2.3).
3. Literature Review
This section briefly outlines and reviews prior research related to voluntary risk reporting practices by firms. Both theoretical perspectives and empirical literature is reviewed, although the analysis is restricted to that applicable to this report and hence is not intended to be a comprehensive or exhaustive review of the literature in general. The focus is mainly restricted to reporting practices by UK-listed corporations during the most recent relevant study period of 2008 onwards.
3.1. Theoretical Perspectives
In general, there are two alternative theoretical explanations in the relevant literature that motivate rationales for why firms may choose to voluntarily report risk information to their stakeholders.Footnote 2 Standard economic models such as Verrecchia (Reference Verrecchia1983), Dye (Reference Dye1985) and Dontoh (Reference Dontoh1989) predict that corporate managers with “good news” will voluntarily release the information whenever the perceived benefits (e.g. higher stock market value for the firm) exceeds the costs associated with disclosure (such as “proprietary costs” related to public revelation of private corporate information).
An alternative justification for firms to voluntarily disclose (risk) information relates to more instrumental demands from society generally for greater “political visibility”. Firms that are particularly sensitive to political interference (e.g. larger firms) face greater incentives to disclose information. Studies have typically focussed on disclosure incentives facing firms in relatively regulated industries, such as public authorities or regulated banks (e.g. Lim & McKinnon, Reference Lim and McKinnon1993).Footnote 3
The above theoretical perspectives assume that the shareholder is the dominant stakeholder that corporate managers face in exercising discretion over the nature and quality of risk disclosures; however, a broader “complexity” perspective on such practices emphasises instead the enhanced roles of “gatekeepers” such as regulators and professional bodies and consultants to prevent corporate wrongdoing. In particular, the increased emphasis in the revised code on “future viability”, “principal risk exposure” and “assessment of risk management systems” places a potentially greater role on professionals such as auditors, regulators and other professionals to monitor and verify the reliability of corporate (risk) information.
Based on this alternative perspective, the new requirements could be viewed as increasing the relative importance of various private gatekeepers, such as accountants, who are traditionally viewed as the most prominent group of gatekeepers of corporate governance and compliance with securities law (e.g. Coffee, Reference Coffee2006). On the other hand, the new requirements also increase the relative power of more specialist risk professionals, such as IFoA, or Institute of Risk Management qualified individual employees IRM and/or CERA-qualified individual employees, consultants, etc. that are presumably more qualified to provide advice and assurance services to corporations that are subject to the new requirements. Goergen (Reference Goergen2010, page 63), in reviewing the outcome of the financial crisis (but before the new Corporate Codes were implemented), suggests that enhanced shareholder monitoring will likely entail changes to the dynamics in the complex social ecosystem of shareholders, employees, stakeholders and gatekeepers that surround the corporation. Consequently, it could be observed that “voluntary compliance” with the revised code requirements is less to do with increasing shareholder accountability, but instead is more related to efforts by corporations to realign these complex gatekeeper inter-relationships in fulfilling their broader accountability to society as a whole.
3.2. Empirical Evidence
There is a large and growing literature on risk reporting, but it is generally unfocussed and does not provide unequivocal evidence in favour of either the theoretical perspectives outlined above. Institute of Chartered Accountants in England and Wales (ICAEW) (2011) summarises the general state of research in risk reporting by concluding that researchers found that disclosure requirements had limited effect, while research findings are mixed.
“While there is some evidence that both quantitative and qualitative risk reporting may have been useful, there is also evidence that qualitative risk reporting is not considered useful by some users of corporate reporting. Indeed, users appear to have conflicting views on risk reporting – some finding it useful, some not” (ICAEW, 2011, page 15).
Subsequently, Abraham & Shrives (Reference Abraham and Shrives2014) developed a generic model for assessing the quality of risk factor disclosures, and apply it to evaluate the quality of risk reporting by four companies in the food production and processing sector. Their results suggest that company managers prefer providing disclosures that are symbolic rather than substantive. They suggest that improving the quality of reporting could be maintained within a properly monitored “comply or explain” approach, which is consistent with the FRC’s latest approach in revising the Code. By contrast, in the United States, the Securities and Exchange Commission (SEC) has since 2005 mandated firms to include a “risk factor” section in their Form 10-K (Annual Report) filings. Campbell et al. (Reference Campbell, Chen, Dhaliwal, Lu and Steele2014) found that US firms that face greater risk tend to disclose more risk factors, and that the type of risks disclosed are affected by the types of risk faced by the firm (i.e. financial, tax, legal, other systematic and other idiosyncratic). They conclude that the SEC’s decision to mandate risk factor disclosures is vindicated, as firm disclosures are firm specific and useful to investors.
There are also relatively few studies that investigate incentives and disincentives for risk reporting practices in the insurance industry, where actuaries might expect to play a key role in providing reporting narrative to stakeholders concerning corporate policies on risk management and future expectations. The first IFoA risk reporting working party (Klumpes et al., Reference Klumpes, Dubey and Kumar2014) examined practices in risk reporting by global insurance companies. They examine various arguments for and against risk reporting, whether voluntary or compliance in nature. An important issue is whether reporting is dominated by shareholder, regulatory or managerial incentives. They evaluated whether current reporting practices were consistent with political visibility, cultural effects or idiosyncratic managerial incentives. Their empirical analysis is based on (1) a content analysis of disclosures contained in annual reports of a sample of European, Asian and US global top 25 insurers between 2006 and 2012 and (2) a survey of internal business reporting practices.
Klumpes et al. (Reference Klumpes, Dubey and Kumar2014) re-characterise a disclosure index from prior research to examine the relationship between the extent of risk disclosure and various managerial, agency and other characteristics. They predict and find that the extent and nature of risk disclosures depends on cultural imperatives and managerial incentives.
In the closely related banking context, Barakat & Hussainey (Reference Barakat and Hussainey2013) examine the impact of corporate governance mechanisms on the quality of operational risk disclosures provided in the annual reports and risk reports in a representative sample of 63 publicly listed European banks for the fiscal years 2008 and 2009. They find that banks having a higher proportion of outside board directors are associated with higher operational risk disclosure quality. Their results corroborate the findings of previous studies and confirm the positive impact of effective corporate governance mechanisms on disclosure quality in public firms and the importance of considering the effects of the legal setting in which various disclosure practices take place.
In the non-financial sector, Linsley & Shrives (Reference Linsley and Shrives2006) explore risk disclosures within a sample of 79 UK company annual reports using content analysis. A significantly positive association is found between the number of risk disclosures and company size. Similarly, a significant association is found between the number of risk disclosures and level of environmental risk. However, they make no effort to delineate disclosure “quality” from accounting “quantity”-driven factors that might be associated with the frequency of risk disclosures.
Anis et al. (2016) address this issue by measuring each information quality attribute and then aggregate these measures in a single disclosure quality score.Footnote 4 Further tests show that their measure is reliable and valid. They also find that disclosure quantity is not a good proxy for disclosure quality. In addition, it shows that the determinants of disclosure quality and disclosure quantity differ. However, their study was focussed on the more generic issue of “reporting quality” rather than focussing on risk reporting. Furthermore, their analysis was premised on assuming that the qualitative characteristics of financial reporting information, as specified in the Accounting Standards Board Operating and Financial Review (2006), is also a valid basis for assessing information quality.
3.3. Summary and Critique
The revisions to the Corporate Code provide considerable challenges to UK firms to significantly extend both the nature and the scope of their existing annual reporting practices. However, given the relative novelty of the changes, it should not be surprising that there is, at the time of writing, very little substantive evidence available in the existing literature that could help guide firms in effectively implementing these requirements.Footnote 5 Furthermore, the FRC’s principle-based approach has left considerable discretion as to how firms can implement changes to their reporting.
While the more relevant empirical literature has continued to evolve and clarify methodological issues since the ICAEW (2011) review, there remains a lack of any clear evidence supporting the implications of either standard economic or political visibility arguments as to why firms might voluntarily disclose risk information. Moreover, we consider that Anis et al.’s (2016) disclosure method is likely to be less relevant to evaluate the readability of strategic risk reporting narrative disclosures made by firms in compliance with the key disclosure aspects of the newly revised Code.
There are still considerable gaps in our understanding of risk reporting practices and the extent to which they comply with the new provisions of the Corporate Code. Moreover, the result of the existing studies outlined above are equivocal as to the influences affecting disclosure and appear to be plagued by the failure to delineate mandatory (e.g. mandated financial statement footnotes that need to comply with relevant accounting standards), voluntary and/or principle-based “comply or explain”-based risk managerial-level strategic disclosures to which the revised governance code relevant provisions apply.
4. Research Methodology
This section briefly outlines the sample selection procedures, and how the various indices used for measuring various aspects of risk management communication, and defines and describes the major firm characteristics that prior research suggests is associated with corporate managerial incentives to comply with risk reporting practices.
4.1. Sample Selection Procedure
The final sample is based on the industry match-paired sample of firms in three, equally sized large cap (FTSE 100), mid cap (FTSE 250) and small cap (FTSE All-Share), and stratified across 20 key industries. The choice of industry sectors is partly driven by the FTSE industry sector classification system and the desire for capturing sufficient richness in diversity in disclosure quality across regulated, financial and industrial sectors.
Firms selected for inclusion in the sample were initially based on a random selection procedure, and were then subject to the following additional selection criteria: (i) have complete, relevant financial and statistical data over the study period 2012–2014; (ii) provide full information in their website and/or other sources to enable annual reports to be obtained for research purposes; and (iii) are not subject to major restructuring, mergers and acquisition (M&A) or corporate governance structure changes over this period. These final selection criteria limited the number of total sample firms to 60, comprising 20 from each large-, mid- and small-cap indices.
The 3-year sample period 2013–2015 is considered to be most appropriate to this study for a number of reasons. First, the UK Companies Act requires UK firms for reporting period on or after 30 September 2013 to provide a strategic report. Second, the subsequent financial reporting year 2014 provides an opportunity for firms to voluntarily comply with the Corporate Code changes that were issued in September 2014. Third, analysing reports in the financial year immediately preceding the mandatory implementation date (i.e. for financial reporting years ending before 1 October 2015) permits us to draw inferences about the incentives facing firms to comply early with the relevant Corporate Code risk management and strategic disclosure requirements. Finally, the period also coincides with industry-specific risk reporting developments, such as the BSBC 30390 (banking), Pillar 3 reporting requirements under Solvency II (insurance) and other industry sector sustainability reporting requirements (under international reporting guidelines and ISO requirements for sustainability and/or integrated reporting).
The final sample of 60 companies is listed in Table 1.
Sample of Large-, Mid- and Small-Cap Firms

The large-cap firms are typically listed on multiple exchanges and have international operations. By contrast, most mid-cap firms are leaders in the UK industries in which they operate but tend to have some international exposure. The small-cap firms are mostly well-known national companies but have significantly smaller scale investment and operating activities than the more international-focussed, larger firms.Footnote 6
4.2. Construction of Disclosure Indices
Chen et al. (Reference Chen, Miao and Shevlin2015) distinguish between various types of disclosure indices that can be used to proxy existing measures of “overall disclosure quality”. These include voluntary disclosure measures such as management forecasts and conference calls, or researcher self-constructed indices (e.g. Botosan, Reference Botosan1997; Francis et al., Reference Francis, Nanda and Olsson2008), or analyst ratings such as the now-discontinued Association of Investment Management and Research (AIMR) scores, or the narrative quality of management discussion (e.g. strategic report) contained in annual reports, such as the Fog index (Li, Reference Li2008).Footnote 7
In this study, we use two of these main types of disclosure indices in order to analyse the quality of disclosures in the narrative text component of UK company annual reports.Footnote 8 We first use a generic (Fog) index to analyse the overall general readability of “risk narrative” elements of both the management strategy and risk management narrative sections of UK company annual reports, in line with prior literature.Footnote 9 The Fog complete formula is
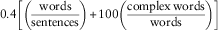 $$0.4\left[ {\left( {{{{\rm words}} \over {{\rm sentences}}}} \right){\plus}100\left( {{{{\rm complex}\,{\rm words}} \over {{\rm words}}}} \right)} \right]$$
obtained from Lancaster University Management School and provides a readability score for the relevant sections labelled either “strategy report” or “risk policies”. These provide us with an initial comprehension of the nature and extent of compliance with both the “viability” and “review and monitoring of procedures” elements of the revised code.
However, this generic type of readability index is unlikely to be sufficient to evaluate readability of corporate reports concerning more specific requirements of the revised code, such as disclosure of information about the effectiveness of the assessment of principal risks. We therefore further develop three “researcher self-constructed” disclosure indices.Footnote 10 These are based on the three “stages” of risk assessment as identified in figure 3 of the ISO 31000/2009 standard:Footnote 11
-
I. Risk identification stage: this index examines disclosures concerning the various types of risk exposure which appear to be most applicable for use by actuarial professionals, particularly in the context of financial services, as developed by Kelliher et al. (2012) – i.e. market, credit, insurance and demographic, liquidity, operational, strategic, and frictional and aggregation.Footnote 12
-
II. Risk measurement and evaluation stage: this index seeks to assess what risk measurement approaches were used for overall enterprise risk management (ERM) and control processes, the risk analysis of market, credit, liquidity, and operational and non-quantifiable risks. It is composed of various categories of standard processes and measurement systems that are used to assure that the firm complies with the relevant internal and externally validated risk evaluation requirements. These typically comply with robustness and prudence objectives as specified by Solvency II, Pillar 3 type disclosures – such as definition and description of limits and escalation processes, risk mitigation activities, variability at specified confidence intervals and stress tests.Footnote 13
-
III. Risk monitoring and control stage: this covers various components of management control and monitoring processes to assure the quality of risk evaluation and identification techniques considered in Stages I and II above. They include the adoption and retention of high-level managerial (e.g. ERM) and control processes, risk appetite, risk culture, emerging risks, risk controls, risk assurance, incentives board monitoring, lines of defence and whistleblowing.
Each of the above disclosure indices were constructed based on a maximum of 100 “points” possible for each of the major components outlined above and are summarised in Table 2.Footnote 14 All components were equally weighted except for Stage I, which was based on the weighting system explained further in Klumpes et al. (Reference Klumpes, Dubey and Kumar2014). These are the principle Basel-based risk categories (financial, operational) as well as strategic, frictional and aggregate risks.
Decomposition of Risk Management Indices

ERM, enterprise risk management.
4.2.1. Scope of analysis
Annual reports that are available on the website of each of the sample companies identified in Table 1 were then analysed for 2013 and 2014, separately. A keyword search was then conducted to identify each of the component items summarised in Table 2, with a score of 1 if fully disclosed (based on a subjective judgement about the frequency of keyword occurrence, in this case judged to be at least six separate disclosures), 0.5 if partly disclosed (between 1 to 5 disclosure instances) and 0 otherwise. This process was repeated for each company annual report and for each major component of the three stages, as summarised in Table 2. This resulted in a total score out of 45 points, which was recalculated to a score out of 100 points to ensure consistency with the disclosure indices outlined below.
4.3. Descriptive Statistics: Company Financial and Market Characteristics
In order to analyse the determinants of disclosure quality (discussed in the next section), various financial characteristics were collected for the sample companies for the 3 years ended in 2013 from Compustat.Footnote 15 If the “economic” perspective on why firms choose to adopt the revised code requirements early holds, then we would expect that liquidity, growth, profitability and future prospects (proxies by book to market) would be significantly and positively associated with both our generic (i.e. Fog index) and bespoke (three stages) disclosure measures. On the other hand, if the alternative “political visibility” perspective holds, then the cross-sectional variation in these disclosure measures across the sample is more likely to be explained by factors such as firm size and growth.
As the future viability statement is closely connected with management expectations about the future, it was considered appropriate to evaluate the quality of reporting practices by reference to the ratio of current value to market participants’ best estimate of future value (i.e. the “book to market” ratio), as well as total firm risk. Relevant capital market data were also collected book to market, standard deviation daily stock returns. This enabled us to calculate the total risk for each company, defined as the daily standard deviation of stock price. All data are calculated for the 3 financial years ending 2013 (growth) or as at the 2013 reporting year date (size). Table 3 defines each of the financial and market variables used to analyse cross-sectional variations in disclosure quality, and also summarises descriptive statistics for each of the three sub-samples of companies.Footnote 16
Descriptive Statistics: Company Financial and Market Characteristics (Total Sample)
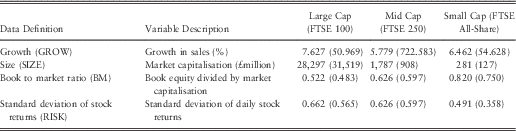
Average, s.d. in brackets.
For our sub-samples of companies, the large-cap companies on average are more than 16 times larger market capitalisation than mid-cap firms, which in turn are more than six times larger than small-cap firms. In terms of market data, the book to market ratio for small-cap firms is relatively higher than for either mid-cap or large-cap firms. By contrast, the standard deviation of stock returns for large-cap firms is significantly higher than for either mid-cap or small-cap firms. These statistics imply that, for at least our sample of UK firms during the study period 2013–2015, firm size is negatively associated with both (a) the extent to which the market’s assessment of the extent to which current and future equity value (i.e. “intrinsic value”) is captured by past-oriented accounting book value and (b) total firm risk. Consequently, more effective communication of risk management, risk culture and corporate strategy are likely to be particularly important to larger sized firms, in influencing the stock market’s relatively more negative assessment of both their total intrinsic value and firm risk.
4.4. Descriptive Statistics: Disclosure Indices
Table 4 reports descriptive statistics for the Fog scores. These are reported separately for 2013 and 2014 comply within years and also separately in connection with both the disclosures in sections labelled “risk management” and “management strategy” (where relevant).Footnote 17
Descriptive Statistics: Fog Indices (Sample Companies By Market Capitalisation)
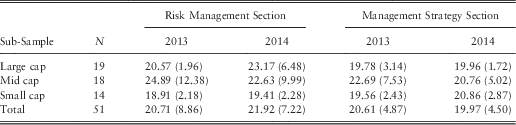
Average, s.d. in brackets.
Overall, Table 4 provides only equivocal evidence of improvement in the readability of the risk management and management strategy sections between the early (2013) and late (2014) pre-implementation years related to the new corporate governance code disclosure requirements. Moreover, these scores do not appear, at least in total, to support the stated policy objective of the revised corporate governance code to improve both the quality and consistency of UK corporate disclosures concerning firm risk and strategy. We also find more consistent trends over time across our entire sample in terms of disclosure consistency (i.e. as represented by the lower variations in overall score quality year on year) vis-à-vis the measured “quality” of disclosure (i.e. as represented by the magnitude change of the average Fog scores over time). Moreover, these trends are inconsistent in terms of both the type of score and firm size sub-samples. We briefly discuss below the major commonalities and trends.
In relation to the risk management-related Fog scores, there is an overall, slight overall increase in the Fog scores for the total sample over time; however, this masks contrasting trends within the three sub-samples. Whereas for both the large- and small-cap firm sub-samples, there is a small overall (but statistically insignificant) average improvement, there is a decline for the mid-cap sub-sample. By contrast, while the extent of variation in Fog scores for both the mid-cap and small-cap sub-samples reduces over time, it increases significantly for the large-cap sub-sample. This result implies there appears to be significant differences between our sub-samples in terms of the trade-off between improvements in overall “quality” in risk disclosures and their extent of variations in practices.
By contrast, average “management strategy” Fog scores only improved over time for the small-cap sub-sample. There was no clear overall trend, with a slight decline in quality of scores for the mid-cap sub-sample and virtually no change for the large-cap sub-sample. The extent of variation in Fog scores declined over time for both the large-cap and mid-cap sub-samples, but slightly increased for the small-cap sub-sample.
In summary, the overall Fog score trends present a confusing picture. There is no real consistent trend either in terms of overall quality and extent of variation in scores.
Further detailed analysis of the self-constructed risk disclosure indices scores was also undertaken (not reported), decomposed by stage of risk assessment (see section 4.2). This analysis suggests that firms are relatively better at providing a narrative description of their principal risks, and of their monitoring processes of risk management systems (Stages I and III) than in quantifying and analysing those risks (Stage II). These findings imply there are a number of opportunities for qualified professionals such as actuaries to engage with firms, in order to help them to further enhance both the quality and standardisation of their risk reporting practices.
4.5. Risk Management Disclosure Index Score
This section describes the major characteristics and trends in our three specifically constructed risk management disclosure index scores for Stages I–III, defined in Table 2. The major features and trends (2013–2014) are discussed by comparing both industry sector (20 different firm-based levels, then aggregated into four sub-samples), as well as by market capitalisation (FTSE 100 (large cap), FTSE 250 (mid cap) and FTSE All-Share (small cap)) for the 2 years, 2013–2014. The major features of the scores are reported separately for each of the Stages I–III.
4.5.1. Disclosure index
We first briefly outline the major trends in the components of the risk management disclosure index scores breakdown for each major component of Stages I–III, further decomposed by market size sub-sample firms.
Table 5 shows that business risk is the most significant component of Stage I. There are some minor changes in the relative importance of some risk components across the three sub-samples, mainly in the business risk and operational risk components. However, there are no significant variations in any of the other Stage I risk components.
Component Breakdown of Average Stage I Scores (Market Capitalisation Sub-Sample (% of Total Score))
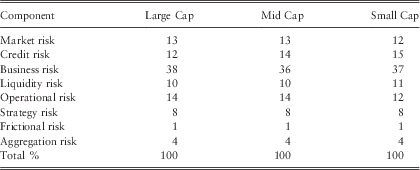
Table 6 shows the breakdown of Stage II overall disclosure scores into the ten components, for each of the same three sub-samples of firms. These show that overall, the analysis of liquidity and credit risk are the most important analysis components, while non-quantified risks are the most salient component related to risk evaluation. There are few significant variations across the sub-samples.
Component Breakdown of Average Stage II Scores (Market Capitalisation Sub-Sample (% of Total Score))
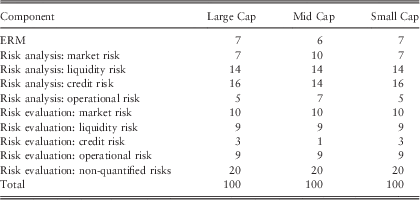
ERM, enterprise risk management.
Finally, Table 7 shows the breakdown of Stage II overall disclosure scores into the ten components related to board-level monitoring and control procedures, again broken down by each of the same three sizes based firm sub-samples. These show that risk assessment, three lines of defence and whistleblowing are the most important components. By contrast, risk culture and risk appetite appear to be less significant, and slightly decrease in relative importance as firm size decreases. Again, there are few other significant variations across the three sub-samples.
Component Breakdown of Average Stage III Scores (Market Capitalisation Sub-Sample (% of Total Score))
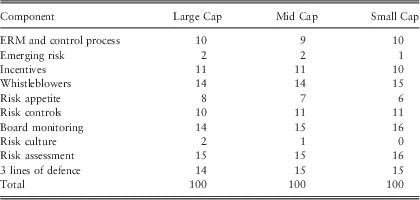
ERM, enterprise risk management.
Figures 1 and 2 provide summary variations in the total scores, in terms of market capitalisation and industry sector, respectively. The overall disclosure index score averages were highest for Stage I and lowest for Stage II (see Figure 1). However, Stage I disclosures also exhibited the most significant variations between market capitalisation sub-samples. For example, Stage I disclosure for FTSE 100 firms scored 69.1% compared with 61.0% for FTSE All-Share firms. In addition, Stage II disclosures for FTSE All-Share firms were 28.4% compared with FTSE 100 at 35.6%. By contrast, Stage III showed little variation across different firm sizes.
Average Stages I–III disclosure score (by firm size, 2014)

Average aggregate total disclosure across all firm sizes (comparative, 2013–2014)

Figure 2 shows an analysis of the disclosure scores by broad industry sector. The financial sector received the top aggregate total disclosure score, whereas the services sector showed the lowest score. There was a minor increase for each sector for the period 2014 compared with 2013.
4.6. Reliability Tests
We follow the procedures established in prior relevant disclosure analysis literature (e.g. Anis et al., Reference Anis, Fraser and Hussainey2016) in conducting standard reliability checks on our disclosure scores. These include checks on the reliability of the keywords, reproducibility and accuracy.
The reliability of most of the keywords was established by verification of their usage in Kelliher et al.’s (2 II). Some of the categories used in Stage III were based on authorities such as well-known textbooks on ERM, Sweeting (Reference Sweeting2011).
Reproducibility refers to the degree to which a process can be replicated under different circumstances and using different coders (Krippendorff, 1980). The Fog scores were based on the well-established WMMatrix software available at Lancaster University (https://cfie.lancaster.ac.uk:8443/). The specific risk management scoring measurement systems were constructed for Stage I to be directly comparable with those used in Klumpes et al. (Reference Klumpes, Dubey and Kumar2014), although the Stage II and Stage III scores are novel and therefore would not necessarily be reproducible. However, for all scoring systems, scores were agreed for a sample of firms between the research assistant and one of the co-authors.
Accuracy of the disclosure scores was assured by checking the accuracy of each word in every keyword list before considering it a keyword, by examining whether it really indicates what it is meant to do. Pearson’s correlation tests were also conducted to verify the degree of correlation (independence) between each of the three specific, manually coded risk management disclosure indices. We would expect a significant, positive correlation between the three indices but <70%. By contrast, we expect a lack of correlation between the computerised Fog scores related to the risk management and strategy sections of company annual reports.
5. Empirical Findings
This section discusses the main patterns and cross-sectional variations among the sample of UK firms voluntarily complying with the new Corporate Code that we predict might explain the patterns of disclosure scores documented in the previous section. Empirical tests also provide a validity test of the explanatory power of our various alternative content-based disclosure indices described in the previous section.
5.1. Determinants of Early Compliance
The first analysis we conduct examines which perspective (economic or political visibility incentives) best explains the decision by firms to comply early with the new corporate governance code by our industry-matched sample of UK firms. This permits us to discriminate among the alternative perspectives discussed in section 2, i.e. is the timing of the compliance with the corporate governance codes related to a good news story, to inform the market about risks which were previously not disclosed, or a bad news story, i.e. to explain to the market the mismanagement of risks by firm management.
We first pool the entire sample and then examine various patterns in behaviour of firms in terms of statistical variations in disclosure indices and the relevant financial characteristics defined in section 5 above. We then analyse whether firms comply with the specific new Corporate Code requirements identified in section 2. This is achieved by labelling and populating specific narrative sections related to “strategic risk management” and/or “risks”, and “our strategy” or “business strategy” during the transitional period 2013 (i.e. in the first full financial year after the revised Corporate Code was issued in September 2013 but before its implementation date, effective in September 2015).
Our first initial results are equivocal. In the case of the “viability statement” requirements of the revised code, we find that only one firm (British Aerospace) actually provided a statement in the form of a managerial narrative concerning its future prospects. By contrast, we find that 60% (31 firms) comply with the Corporate Code early through specified narrative sections in their “management” sections of the annual reports that address managerial policies in relation to “risk management” and “strategy”.Footnote 18
Following prior research (e.g. Anis et al., Reference Anis, Fraser and Hussainey2016), we then use the following ordinary least square (OLS) regression model to discriminate between alternative economic and political visibility explanations (discussed previously in section 3.1). This is proxied by the strength of statistical association between a disclosure index and various corporate and financial characteristics for any firm, i in our sample.
 $$DIS_{{it}} \,{\equals}\,a_{i} {\plus}B_{{\rm 1}} SIZE_{i} {\plus}B_{{\rm 2}} RISK_{i} {\plus}B_{{\rm 3}} BM_{i} {\plus}B_{4} COMPLY_{i} {\plus}{\varepsilon}_{i} $$
where DIS it is the disclosure quality for firm i at time t, as measured either using Fog scores for risk management and strategy sections, respectively, or risk management specific indices for Stages I, II and III, respectively; the explanatory variables are those defined in Table 2. COMPLY is a dummy variable indicating whether the firm chose to voluntarily comply with the corporate governance code requirements at least a full financial year before the mandated implementation date, and ε the error term in the regression. Where the Fog index measurement software was unable to detect a specified section or discrete element of the annual report of a number of companies related to the generic topics “risk management” and/or “management strategy” or “our business strategy”, COMPLY was coded as 0, 1 otherwise. This distinction is important because the absence of a specified “section” of the annual report therefore implies that the company did not actually comply with the implicit Revised Code requirements for statements concerning C.2.2. (i.e. management expectations) and C.2.3 (i.e. risk management).Footnote 19
Consistent with our predictions outlined in section 3.1 above, any significant, positive association established between DIS it and B 2−B 4 would support the “economic” rationale for early compliance with the revised code, while a positive relation between DIS it and B 1 would be supportive of an alternative “political visibility” explanation.
As the OLS regression analysis assumes independence of the variables, we need to ensure they are not highly correlated with each other.Footnote 20 Table 8 shows the correlation analysis between the variables. Panel A (B) reports the correlation between the five measures of disclosure quality (firm characteristics).
Correlation Matrix
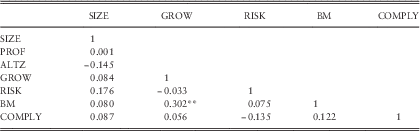
**5% level of statistical significance.
The correlations between independent variables are all low, except for the positive correlation between BM and GROW. This is to be expected as book to market is traditionally associated with growth opportunities.
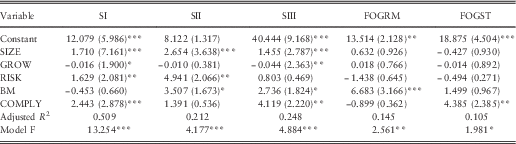
Table 9 reports the OLS regression results for the above-specified linear model, where six different sets of models are shown depending on the choice of disclosure index.
Ordinary Least Square Regression Results (Determinants of Risk Disclosure Quality)
Coefficients, significance level in brackets.
***1% level of significance, **5% level of significance and *10% level of significance.
The overall F-statistic for all six OLS regressions are statistically significant at least at the 5% level, implying that the model specified in equation (1) explains cross-sectional variations across the pooled sample.
The propensity to comply with the Corporate Code disclosures early (COMPLY) is positively associated with disclosure quality measures for all models except for the Fog-based risk management model, and are statistically significant at least at the 10% level, except for the Stage II model.
By contrast, there is a negative, but not statistically significant, association between Fog-based risk management disclosure measure and the propensity to comply with the corporate governance code reporting requirements. This is consistent with an adverse selection argument which implies that those firms with relatively greater risk management-based disclosures are less likely to comply with the Code.
For each of the three specific indices, SIZE is positive and significant at the 10% level, implying that political visibility, rather than pure economic rationales for early compliance, may be underlying the results. However, both RISK and BM are also positively associated with disclosure quality for Stages II and III (and combined score) regressions, implying that relatively more risky and future value-oriented firms are likely to disclose more information about their risk measurement and monitoring processes and procedures, respectively.
The OLS regression model results are more equivocal for the two Fog score-based disclosure indices. GROW is positively and statistically significantly related to disclosures related to risk management. By contrast, it is negatively and statistically related to disclosures related to management strategy. These results seem intuitively plausible if we accept an adverse selection-based economic story that the extent of a firm’s future prospects is positively and negatively related to the extent of their elaboration of risk management and corporate strategy, respectively. However, except for BM, none of the other variables are statistically significant for any of these models.
6. Best Practice Examples
In this section, we briefly highlight the outliers in terms of good and poor practices as revealed by the three specific risk management disclosure indices Stages I–III for the 2 years. We then provide a qualitative assessment derived from reading a small sample of report and accounts and we highlight some examples of good practice disclosure we have seen.
6.1. Outliers
Table 10 shows the highest and lowest scoring industry sectors within each category of market capitalisation for the 2013 financial year. The financial sector comprises three industries such as banking, insurance and life insurance, which are subject to stringent disclosure regulations. Consequently, this sector shows the highest average scores in each of the three stages and across all company sizes except at stage I for FTSE 100, which was led by the oil and gas industry. In contrast, the transport industry (categorised as part of the “other” sector), received the lowest scores at all stages across most firm sizes. Although we would generally expect to witness higher disclosure scores for FTSE 100 firms than FTSE 250 or FTSE All-Share, the results showed variation across different industries. For instance, the banking industry showed higher disclosure scores for larger firms (FTSE 100), while the software and support industry showed lower disclosure scores for larger firms. The services sector poor disclosure score stems from its low scoring firms in software and support and travel and leisure.
Sector Outliers by Disclosure Stage and Market Capitalisation (2013)
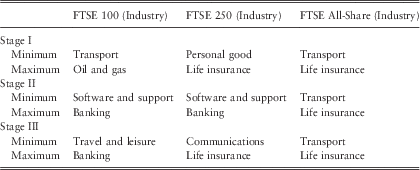
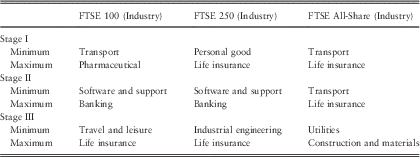
Table 11 shows the highest and lowest scoring industry sectors within each category of market capitalisation for 2014. There are a small number of changes from 2013 but the overall picture presented is very similar to 2014.
Sector Outliers by Disclosure Stage and Market Capitalisation (2014)
6.2. Commentary and Discussion
6.2.1. Stage I
The results of the qualitative analysis of company disclosures are consistent with the disclosure index results. We generally found that very high or very low disclosure index scores were corroborated by a review of the corresponding reports.
We noted that certain issues facing a company may lead to significantly increased levels of reporting such as for BP plc in 2013.
An example of good practice disclosure of principal risks was noted in the Chesnara FY14 year-end accounts.

6.2.2. Stage II
The results of the qualitative analysis of company disclosures are again consistent with the disclosure index results. It was noted that HSBC appears to demonstrate good examples of the analysis and disclosure of key risks, consistent with the findings for Stage II, for example, measuring targets versus actual level. There was a notable improvement in Sage accounts between 2013 and 2014, in particular around the disclosure of risk appetite, severity of risk exposure and commentary on whether risks have increased or decreased over the financial period. By contrast, for medium-cap firms there seems to be more emphasis on qualitative disclosure and less on precision of measures used. For small-cap firms, industry sector appears to have a significant impact on the insurance sector (Chesnara) providing significantly more quantum and quality of disclosure than the minimum as illustrated by the transport sector. There does not seem to be a significant variation between average firms in this sector and “outlier high-quality firms” and there are relatively few examples seen of good/excellent practice.
6.2.3. Stage III
The results of the qualitative analysis of company disclosures are again consistent with the disclosure index results. It is apparent that regulated, risk-oriented financial firms such as HSBC provide a significantly greater level of detail and disclosure on key components of their risk management framework than do unregulated non-financial firms. The HSBC 2014 accounts include a chart clearly defining the risk management framework as well as details on sustainability of this framework.
On the other hand, non-financial firms present a much more myopic view of risk management with a focus on simple control related or operational risk aspects of risk management. Most of the discussion is kept at the strategic level and lacks specification and sophistication. There is a distinct lack of recognition of the role that issues like risk culture or risk appetite have in the design of effective management control and monitoring systems.
HSBC was an example from 2014 of good practice disclosures with an extract presented below.

6.3. Commentary Published by the Professional Firms
A number of the professional firms have released publications providing a detailed analysis of all aspects of company report and accounts and have included discussion of the readiness of UK firms to adopt the revised Code. Our aim in this paper is not to replicate the content of these publications but to hopefully provide an alternative perspective through the analysis methodologies presented in the earlier sections of this paper.
Deloitte reported “52% of the companies surveyed referred to changes that would be necessary to adopt the 2014 Code, but only a handful had early-adopted any of the new provisions. One company noted that they had done so in relation to the new requirements around directors’ remuneration. Another included a viability statement” (2016).
7. Conclusion
This paper provides important new insights on incentives facing UK firms to voluntarily comply with new Corporate Code requirements related to risk assessment, monitoring and viability statements.
When we look at our results in their entirety, we believe that we have found several pieces of evidence supporting the political visibility explanation of early compliance with the new Corporate Code requirements, at least related to principal risk assessments and review processes. By contrast, there is little evidence that our sample firms have chosen to provide a viability statement. Further, it seems that the propensity to produce specified risk management and “management strategy” elements of the strategic report are more closely related to standard economic (adverse selection) or “good news” rationales.
The extent of our inferences from the empirical analysis reported in section 5 is subject to standard econometric analysis limitations associated with the sample size, errors in measurement variables and distributional assumptions underlying the parametric tests conducted. Thus, our results should be treated with caution at this point.
Subject to these caveats, our results imply that political visibility is the primary motivation behind management incentives to comply early with the revised code requirements relating to assessment of principal risks and monitoring mechanisms. However, by contrast, there seem little incentives facing most of our sample to produce a viability statement, suggesting that an alternative “adverse selection” – economic argument.
Further research is warranted in a number of directions. First, further clarification is needed of the validity of the various “readability indices” constructed and applied in the analysis as proxies for disclosure quality. Second, our analysis of the New Code requirements was restricted to those likely to be of most interest to risk professionals (i.e. identification of principal risks, monitoring processes of risk management systems, and quantification and analysis of risks). However, the revised code also contains important new requirements concerning alignment of managerial remuneration policies with the long-term sustained creation of value. Therefore we did not study the impact of corporate governance quality measures such as the number of independent directors, managerial bonuses and/or options, ownership concentration or audit and/or non-audit professional fees paid to intermediaries. Such variables may also be of relevance to the evolving role of risk professional “gatekeepers” in affecting discretionary disclosure policies in the strategic report element of UK corporate annual reports. Moreover, there appears to be a significant level of overlap between the “strategic report” requirements of the revised code and the separately developed global “integrated reporting” protocols related to sustainability reporting. Further research is needed to clarify these issues.
Finally, as noted in the paper, the disclosures we have analysed have not yet fully adopted the provisions of the 2014 Corporate Governance Code so we can expect material changes to subsequent reports that would merit further analysis.
8. Implications for Actuaries
The changes to the 2014 Corporate Governance Code and the associated guidelines represent a significant stepping up of the expectations being placed on corporate risk reporting. There is increased focus on the quantification and modelling of risk and the new viability statement requirement will require firms to model outcomes for their business under a range of different scenarios.
These are areas where actuaries could make a particularly valuable contribution. They bring strong modelling capabilities and risk management expertise underpinned by a robust professional and ethical framework. Actuaries have experience of modelling future outcomes for insurance companies and pension funds. Solvency II regulations mean that insurers have implemented the most advanced risk management processes. The research tends to support the view that the financial sector is ahead of many other sectors in their risk reporting practices. This all suggests that an excellent opportunity exists for the profession.
Other elements of our findings are however less encouraging. They suggest that firms may only implement change when they need to in order to comply with regulations. Their focus may purely be on meeting market expectations in relation to compliance rather than being driven by a strong belief in the value to be gained from enhancing their risk management processes. If this is the case then it may be difficult for actuaries to persuade firms that their skills are worth paying for.
2015 report and accounts will soon be available for analysis and it will then be possible to study how firms have chosen to comply with the requirements. There is the potential for firms to give investors and other stakeholders a much richer understanding of how they will perform under a range of different future scenarios. Alternatively, firms may choose to offer the minimum level of disclosure to tick a compliance box. The authors would encourage the IFoA to consider further research to develop an understanding of the links between business performance and the quality of risk reporting. For actuaries to extend their influence in wider business sectors they will need to demonstrate the value that their skills can add.
Acknowledgements
We would like to take this opportunity to thank a number of people involved in this project, particular thanks go to Elliot Varnell for his sponsorship, to Dawn Macintosh and Diane Wilson for their support, to Sarah Mathieson and the research team for their patience, Chiara McCormack for her editorial support and especially Giselle Dominguez for her high quality research assistance. We would also like to thank the numerous other members of the actuarial profession who gave up their valuable time to contribute to the formulation of our ideas and comment on our results.
Disclaimer
The views expressed in this publication are those of invited contributors and not necessarily those of the Institute and Faculty of Actuaries. The Institute and Faculty of Actuaries do not endorse any of the views stated, nor any claims or representations made in this publication/presentation and accept no responsibility or liability to any person for loss or damage suffered as a consequence of their placing reliance upon any view, claim or representation made in this publication/presentation. The information and expressions of opinion contained in this publication are not intended to be a comprehensive study, nor to provide actuarial advice or advice of any nature and should not be treated as a substitute for specific advice concerning individual situations. On no account may any part of this publication be reproduced without the written permission of the Institute and Faculty of Actuaries (or authors, in the case of non-IFoA research).


 Open access