


Introduction
The Bay of Fundy dykelands are a region of predominantly agricultural land protected by dykes along coastal regions of the Bay of Fundy in Nova Scotia and New Brunswick, Canada. Dykes, originally built by early sixteenth-century Acadian settlers from France, were created as a means to establish arable land and provide irrigation for the resulting croplands (Desplanque Reference Desplanque and Segeren1982). Tidal salt marsh reclamation by dyking continued well into the mid-twentieth century. Today, approximately 77% of Nova Scotia’s natural tidal salt marsh has been lost due to dyking (MacDonald et al. Reference MacDonald, Noel, van Proosdij and Chmura2010; Wollenberg et al. Reference Wollenberg, Ollerhead and Chmura2018).
The sustainability of the Bay of Fundy dykelands is presently being called into question because of sea level rise and the threat of increasing storm severity in the region due to climate change. Policy makers and other stakeholders have begun to reconsider the long-term cost effectiveness of maintaining dykes (Wollenberg et al. Reference Wollenberg, Ollerhead and Chmura2018). Coastal managers and researchers have investigated the possibility of managed realignment of dykes as a way to address concerns about dyke sustainability and increasing maintenance costs. The managed realignment process is a nature-based solution that includes the breaching, removal, and realignment further inland of dykes, allowing for the restoration of foreshore salt marsh habitat (French et al. Reference French, French, Clifford and Watson2000; Bowron et al. Reference Bowron, Neatt, van Proosdij, Lundholm and Graham2011).
Tidal salt marshes are intertidal wetland habitats characterised by periodic inundation of salt or brackish waters (Pennings and Bertness Reference Pennings and Bertness2001). The marshes are highly productive ecosystems that support many aquatic and terrestrial species and provide several water quality and hydrological functions (Pennings and Bertness Reference Pennings and Bertness2001).
Although tidal salt marsh restoration has great potential to protect coasts and provide beneficial contributions to people along the Bay of Fundy, dykes are covered by living vegetation and therefore also perform ecological functions. Salt marsh restoration will require some disruptions to dyke habitats and forfeiture of valuable agricultural land. In addition, managed realignment may negatively affect wild pollinator populations. Dykes and the land behind them provide upland habitat for many flowering plant species that cannot tolerate salt water. Many floral species found on dykes in the Bay of Fundy region are nonnative naturalised species, such as Medicago sativa (Linnaeus) (Fabaceae), Sonchus oleraceus (Linnaeus) (Asteraceae), Daucus carota (Linnaeus) (Apiaceae), Trifolium spp. (Linnaeus) (Fabaceae), and Taraxacum spp. (Wiggers) (Asteraceae). Native species such as Solidago canadensis (Linnaeus) (Astraceae) and Symphyotrichum novi-belgii (Linnaeus) (Asteraceae) are also present. Dykes may also provide nesting habitat for ground-nesting bees and other insects, both behind the dyke and on the dyke itself (Antoine and Forrest Reference Antoine and Forrest2021).
Tidal salt marshes are composed of primarily wind-pollinated plant species (e.g., Carex paleacea (Schreber ex. Wahlenberg) (Cyperaceae), Juncus gerardii (Loiseleur-Deslongchamps) (Juncaceae), Sporobolus pumilus (Peterson and Saarela) (Poaceae), and S. alterniflorus (Peterson and Saarela) (Poaceae)), with a lower abundance and richness of insect-pollinated species (e.g., Solidago sempervirens (Linnaeus) (Astraceae) and Limonium spp. (Miller) (Plumbaginaceae)) than those that grow on dykes (Bowron et al. Reference Bowron, Neatt, van Proosdij, Lundholm and Graham2011). Little to no viable nesting habitat is expected in salt marshes because of wave intrusion during high tide, which periodically floods the marsh.
Few studies to date have investigated pollinators in salt marshes. Davidson et al. (Reference Davidson, Fowler, Skov, Forman, Alison and Botham2020) showed that pollinators in the United Kingdom – mainly Apis mellifera Linnaeus and Bombus spp. Latreille (both Hymenoptera: Apidae) – access this habitat. However, more research is needed to better understand how pollinators may be using salt marshes and to better predict how dyke realignment and salt marsh restoration will, if at all, affect pollination services in the Bay of Fundy and elsewhere.
The value of pollination services and the contributions of pollinators to people cannot be understated. The total volume of global food production dependent on pollinators is estimated to be 35%, making these species invaluable to global food security (van der Sluijs and Vaage Reference van der Sluijs and Vaage2016). In the Canadian context, value of pollination services provided by the western honey bee, A. mellifera, for direct harvested agriculture (e.g., blueberry (Ericaceae), squash (Cucurbitaceae), and apple (Rosaceae)) has an estimated economic worth of CAD$3.2 billion annually, and when production of hybrid canola (Brassicaceae) seed (and products derived from canola) is included, this value increases to CAD$7 billion (Agriculture and Agri-Food Canada 2021; Rondeau et al. Reference Rondeau, Willis Chan and Pindar2022).
Most studies researching crop pollination and pollination services have focused primarily on managed bee species such as A. mellifera (Goulson Reference Goulson2003; Garibaldi et al. Reference Garibaldi, Carvalheiro, Leonhardt, Aizen, Blaauw and Isaacs2014) and have undervalued the contributions of wild pollinators, which are often more effective at pollinating crops (Hung et al. Reference Hung, Kingston, Albrecht, Holway and Kohn2018). Given the well-documented importance of wild pollinators to agriculture systems (Sheffield et al. Reference Sheffield, Kevan, Pindar and Packer2013a; Gervais et al. Reference Gervais, Bélisle, Mazerolle and Fournier2021), continued research on wild pollinators is needed urgently, in Nova Scotia (Walker et al. Reference Walker, Pindar and Lundholm2023) and globally, to address changes in species populations. Around the Bay of Fundy, both dykelands and salt marshes occur adjacent to agricultural lands planted with crop species known to be pollinated by insects, such as apple (Sheffield et al. Reference Sheffield, Kevan, Pindar and Packer2013a), tomato (Solanaceae), and blueberry (Javorek et al. Reference Javorek, Mackenzie and Vander Kloet2002). The role of dykes and salt marshes in providing resources for pollinators is unknown but needs to be better understood in order to predict the possible impacts of dyke management and wetland restoration activities on insect pollinator populations.
In global plant and insect biodiversity studies, the two greatest positive predictors of wild bee abundance and diversity are floral abundance and floral diversity (Hyjazie and Sargent Reference Hyjazie and Sargent2022). Therefore, it is no surprise that pollinator communities are highly dependent on the specific flowering plant species that are present on the landscape.
Given the vital contributions of pollinating insects to both people and the agricultural industry in Nova Scotia, one of the primary objectives of this study was to examine the differences in pollinator communities between dyke and salt marsh habitats. This work also began addressing a gap in the literature regarding how wild bees access and use salt marshes. We hypothesised that dykes would host a greater abundance and richness of pollinators than nearby salt marshes would, due to their greater floral abundance and richness and nesting-habitat availability.
Methods
Site selection
Eight sites each of salt marsh habitat and dyke habitat (ntotal = 16) were selected from the Minas Basin and Cobequid Bay region in the Annapolis Valley, Nova Scotia, Canada. To assess each habitat’s potential pollinator contributions to adjacent crops, sites were located less than 1 km from agricultural land. Local crops and management types differed significantly (e.g., orchard, intensive ground and vegetable crops, organic ground and vegetable crops, forage, etc.). Sites were located at least 400 m apart (with one exception, which was 200 m from the next site). Sites within 3 km of one another were grouped as one “location” for statistical models (Supplementary material, Fig. S1). Sites were sampled every 7–14 days, from 26 June to 5 October 2020, with one sampling exception occurring during October, one month after the last mid-September sample.
Pollinator and floral sampling
Sampling occurred only on days with suitable flying conditions (partial to full sun, no or low wind, and a minimum temperature of 15 °C). In addition, at salt marsh sites, sampling occurred only during favourable tidal cycles when the site was not flooded. At each site, pollinator specimens were collected using a total of 30 ultraviolet–bright blue, yellow, and white pan traps (15 cm diameter, 12 oz) placed at ground level. Traps were laid by alternating colours approximately 3 m apart, following three transects positioned parallel to each another and separated by 30 m (Supplementary material, Fig. S2). Traps were deployed between 08:00 and 10:00 hours, local time, and collected after a six-hour period. All specimens were stored in 95% ethanol at room temperature before being washed and pinned. In total, 114 samples were collected (more than 684 hours of sampling), with each site being sampled 6–8 times.
On salt marsh sites, transects were placed in the mid to high salt marsh zone (Sporobolus pumilus–dominant community), between the low marsh edge (Sporobolus alterniflorus–dominant community) and the brackish upland edge (Juncus gerardii–dominant community; Supplementary material, Fig. S2; Porter et al. Reference Porter, Lundholm, Bowron, Lemieux, van Proosdij, Neatt and Graham2015). One exception to this was at Cogmangun Restoration, where 1–2 traps per transect were placed in the high marsh zone in order to maintain trap spacing. No pan traps were laid in low salt marsh areas because tidal inundation would have disrupted the traps over the survey period. On dyke sites, transects were laid starting at the foreshore base of the dyke, then up and over the dyke proper, and stopping before the landward base of the dyke (Supplementary material, Fig. S2). Because of area constraints, transects at Noel Northwest, Noel Southwest, Starr’s Point North, and Starr’s Point South had 1–2 traps placed in the fringe marsh to maintain transect spacing.
Pollinators were first grouped into bees (Hymenoptera: Anthophila), wasps (Hymenoptera: Aprocrita), hoverflies (Diptera: Syrphidae), and butterflies and moths (Lepidoptera). Bee and hoverfly specimens were then sorted and identified to species whenever possible, using the online interactive dichotomous key, Discover Life (discoverlife.org), and Packer et al. (Reference Packer, Genaro and Sheffield2007). Further identifications were made using LaBerge (Reference LaBerge1985) and Mitchell (Reference Mitchell1960) for Andrenidae and Halictidae, Sheffield et al. (Reference Sheffield, Ratti, Packer and Griswold2011) for Megachilidae, Romankova (Reference Romankova2007) for Hylaeus (Colletidae), Mitchell (Reference Mitchell1960) and Rehan and Sheffield (Reference Rehan and Sheffield2011) for Ceratina (Apidae), Mitchell (Reference Mitchell1962) for Apidae, Laverty and Harder (Reference Laverty and Harder1988) and Williams et al. (Reference Williams, Thorp, Richardson and Colla2014) for Bombus (Apidae), and Gibbs et al. (Reference Gibbs, Packer, Dumesh and Danforth2013) and Gibbs (Reference Gibbs2010, Reference Gibbs2011) for Lasioglossum (Halictidae). Native or introduced status of bees was defined according to the Atlantic Canada Conservation Data Centre (http://www.accdc.com/) and Sheffield et al. (Reference Sheffield, Kevan and Smith2003). We also assigned functional guilds to each bee species by nest type, following Sheffield et al. (Reference Sheffield, Kevan, Pindar and Packer2013a). Nest guilds included “cavity,” “colony aboveground,” “colony hive,” “colony underground,” “ground,” and “parasite” and were assessed following Packer et al. (Reference Packer, Genaro and Sheffield2007), Sheffield et al. (Reference Sheffield, Ratti, Packer and Griswold2011), Williams et al. (Reference Williams, Thorp, Richardson and Colla2014), and Danforth et al. (Reference Danforth, Minckley, Neff and Fawcett2019; Table 1). However, hoverflies were identified to genus, and species when possible, according to Miranda et al. (Reference Miranda, Young, Locke, Marshall, Skevington and Thompson2013). Bees were identified by Terrell Roulston, with assistance from Hughstin Grimshaw-Surette (H.G.-S.) and Alana Pindar (A.P.), and hoverflies were identified by H.G.-S. All voucher specimens are housed by A.P. in the insect collection at Cape Breton University, Sydney, Nova Scotia, Canada.
Bee (Hymenoptera) taxa, conservation status, nest guild, and number found in dyke and salt marsh habitats. Native and introduced status was defined according to the Atlantic Canada Conservation Data Centre (http://www.accdc.com/), except for Bombus impatiens, which was defined per Sheffield et al. (Reference Sheffield, Kevan and Smith2003). Nest functional guild was defined per Packer et al. Reference Packer, Genaro and Sheffield2007 (4), Sheffield et al. Reference Sheffield, Ratti, Packer and Griswold2011 (2), Williams et al. Reference Williams, Thorp, Richardson and Colla2014 (3), and Danforth et al. Reference Danforth, Minckley, Neff and Fawcett2019 (1). COSEWIC, Committee on the Status of Endangered Wildlife in Canada

During each visit, floral abundance within a rectangle defined by the perimeter of the transects (∼1620 m2) was estimated using a visual index with a discrete range from 0 to 3. Grasses and other wind-pollinated (anemophilous) species were excluded from surveys, and only showy flowers (zoophilous) were included. A score of “0” represented no floral resources (no flowering individuals), a score of “1” represented a very low abundance of floral resources (1–10 individual plants), a score of “2” represented a low to intermediate abundance of floral resources (11–20 individual plants), and a score of “3” represented a high to very high abundance of floral resources (≥ 21 individual plants). Floral species identity and richness (number of showy flowering species) were recorded during each site visit for the same areas assessed for floral abundance.
Statistical analysis
All statistical analyses were performed in R, version 4.1.2 (R Core Team 2021), using the RStudio integrated development environment, version 2021.09.0 + 351 (RStudio 2021). We fitted four separate statistical models to analyse the abundance and richness of pollinator species and plant species between habitats (i.e., habitat type as fixed effect). For pollinator abundance and richness models and for floral richness models, we used negative binomial generalised linear regression models with a log-link function using the glmmTMB package (Brooks et al. Reference Brooks, Kristensen, van Benthem, Magnusson, Berg and Nielsen2017). The models’ fit was verified by simulating residuals (for 1000 runs) and by comparing them to fitted values, in addition to testing for outliers and overdispersion in the models using the DHARMa package (Hartig Reference Hartig2022). Given the ordinal nature of the floral abundance data, we fitted a proportional odds regression model, using the package MASS (Venables and Ripley Reference Venables and Ripley2002). The assumptions and fit of the proportional odds regression model were verified using the car package (Fox and Weisberg Reference Fox and Weisberg2019), following Brant (Reference Brant1990). For each of the linear models described above, we first assessed whether the random effect of “location” (Supplementary material, Fig. S1) should be included in the model by running a mixed linear model version of the model. Negligible variance was attributable to the “location” random effect for most models, but both floral abundance and floral richness models indicated substantial variance attributable to location. In the latter two cases, the final models were mixed linear models that included the fixed effect of “habitat” and the random effect of “location.” To assess the statistical significance of the “habitat” effect in all models, we compared full and null models, conducted with Wald Chi-square tests using type II sum-of-squares, performed with the car package (Fox and Weisberg Reference Fox and Weisberg2019). Given that comparisons between dyke and saltmarsh habitats within the same location may share individuals, we repeated the same analyses with one site removed where a dyke and a salt marsh occurred within 1 km of one another. The following site combinations fell into this category: Belcher Street reference site (salt marsh) and Belcher Street restoration site (dyke); and Newport Dyke, Newport Marsh North, and Newport Marsh South (Supplementary material, Fig. S1). For these revised analyses, we retained the Belcher Street reference site (salt marsh) and Newport Dyke (dyke), omitting the other sites within those locations.
To investigate differences in nest guilds within and between salt marshes and dykes, species rank abundance (log-transformed) curves were plotted, grouped by nest guild using the BiodiversityR package (Kindt and Coe Reference Kindt and Coe2005). To account for differences in sampling efforts in each habitat, pollinator-species rarefaction was completed to find the extrapolated maximum pollinator richness and to evaluate sampling completeness. This rarefaction was achieved following procedures by Chao et al. (Reference Chao, Gotelli, Hsieh, Sander, Ma, Colwell and Ellison2014), using the iNEXT package (Hsieh et al. Reference Hsieh, Ma and Chao2022).
To compare differences in pollinator community composition (i.e., β diversity) in each habitat, nonmetric multidimensional scaling ordination was performed using the vegan package (Oksanen et al. Reference Oksanen, Simpson, Blanchet, Kindt, Legendre and Minchin2022). Pollinator community proximity was measured using Chi-square distance (a weighted Euclidean distance) due to large differences in relative abundances of species. Given the differences in abundance, this metric yields a robust measure of compositional differences (Greenacre Reference Greenacre2017). The quality of ordination was verified by using the stress level and plotting a Shepard diagram, and it was also verified within the vegan package. To test the statistical significance of the differences in community composition between habitats, a permutational multivariate analysis of variance using “location” as a blocking variable was performed using the vegan package (McArdle and Anderson Reference McArdle and Anderson2001; Oksanen et al. Reference Oksanen, Simpson, Blanchet, Kindt, Legendre and Minchin2022). We also repeated this analysis with the Belcher Street restoration (salt marsh) and Newport Dyke (dyke) sites removed so that none of the dyke and salt marsh sites compared were located within 1 km of each other.
To examine the association between pollinator abundance and richness and floral abundance and richness, we fit negative binomial generalised linear regression models with fixed effects of “habitat” type and either “floral abundance” or “floral richness.” These models were implemented using the glmmTMB package, and the goodness-of-fit was assessed using the DHARMa package, as described above. The metrics were also assessed in mixed linear model form, with “location” as a random effect. Wald Chi-square tests with type II sum-of-squares were used to test the statistical significance of this relationship between habitats. This was achieved by using full models containing fixed effects of “habitat,” and floral abundance or richness were tested against reduced models without floral abundance or richness – again, using the car package (Fox and Weisberg Reference Fox and Weisberg2019).
Results
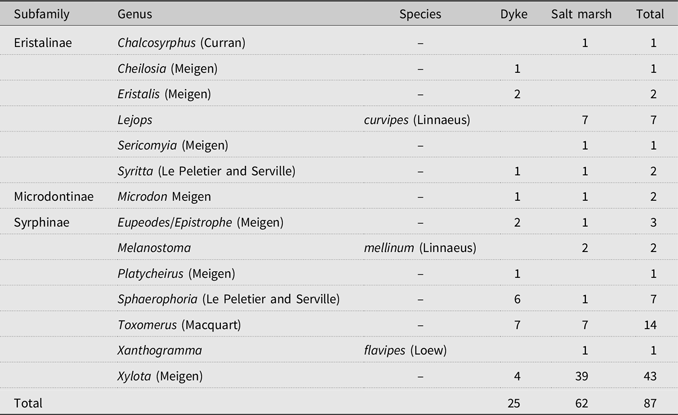
A total of 2487 pollinator specimens from 86 taxa were collected, with similar abundances of 1415 and 1072 in dykes and salt marshes, respectively. Bees made up the largest abundance of taxa in both habitats, with 1131 in dykes and 797 in salt marshes (Table 1). Wasps represented the second largest proportion of catches, with 233 and 196 individuals in dykes and salt marshes, respectively. The abundance of hoverflies (collected from 14 genera; Table 2) was greater in salt marshes, with 62 specimens collected, compared to dyke sites, where 25 specimens were collected, although hoverfly species richness was similar in both types of habitat. Lepidopterans made up the lowest proportion of total taxa, with 26 collected from dyke sites and 17 collected from marsh sites.
Hoverfly (Diperta: Syrphidae) taxa and number of individuals found in dyke and salt marsh habitats. Total abundance was greater in salt marshes, but richness was similar between habitats
Bee specimens included taxa from 20 genera representing five families (Table 1). Halictidae represented the greatest proportion of family abundance (64.5%), followed by Apidae (28.0%). The three most abundant species were Lasioglossum leucozonium (Schrank) (Halictidae), Agapostemon virescens (Fabricius) (Halictidae), and Halictus ligatus (Say) (Halictidae). Four introduced species were recorded, including Apis mellifera (managed), Bombus impatiens (Cresson), Anthidium manicatum (Linnaeus) (Megachilidae), and the above-mentioned most abundant species Lasioglossum leucozonium. The present study is the first to our knowledge to record Lasioglossum taylorae (Gibbs) (Halictidae) (five specimens) in Nova Scotia; the species was observed only in salt marsh habitat at three different sites. In addition, we recorded a specimen of a Committee on the Status of Endangered Wildlife in Canada–listed (2015) species of special concern, Bombus terricola (Kirby) (Apidae), at one dyke site.
Analysis of rank abundance of nest guilds shows ground-nesting bees dominated abundance in both habitats (dyke: 858 specimens; salt marsh: 629 specimens), followed by colony underground species (dyke: 101 specimens; salt marsh: 88 specimens; Fig. 1). Notably, cavity-nesting bees were much more abundant in dyke habitat than in salt marshes (dyke: 116 specimens; salt marsh: 29 specimens; Fig. 1). Parasitic (cuckoo) bees were found in both habitats and exhibited similar relative abundance positions in each habitat (Fig. 1). In total, seven parasitic taxa were recorded, including Coelioxys octodentatus (Say) (Megachilidae), Coelioxys rufitarsis (Smith) (Megachilidae), Coelioxys porterage (Cockerell) (Megachilidae), Nomada articulata (Smith) (Apidae), Nomada vicina (Cresson) (Apidae), Triepeolus pectoralis (Robertson) (Apidae), and Sphecodes spp. (Latreille) (Halictidae).
Species rank abundance plots illustrating the distribution of bee nesting guilds in A, dyke and B, salt marsh habitat, sampled from June to October 2020. Ground nesters were most abundant and rich in both habitats, and cavity nesters were more abundant on dyke than salt marsh.

On-the-wing observations were made of bees visiting the wind-pollinated salt marsh grass, Sporobolus michauxianus (Peterson and Saarela) (Poaceae); these bees included Bombus spp. (Latreille) (Hymenoptera: Apidae) and Megachilidae (Latreille), likely Megachile spp. These visits were observed at two salt marsh sites on four separate occasions in July and August, which were notably dry and hot months compared to historical trends (Supplementary material, Table S1). Bombus spp. were witnessed collecting pollen from S. michauxianus by hanging onto the flowering stem with their mandibles and tarsi and grooming pollen into their corbicula. Megachilidae were observed removing pieces of S. michauxianus leaves and flying away with them, likely to be used in nest construction. Although not directly measured in this study, S. michauxianus was found at all salt marsh sites and at some of the dyke sites (Roulston Reference Roulston2021) and is common on the landward side of dykes throughout the Minas Basin (Lundholm et al. Reference Lundholm, Graham, Kickbush and Bowron2022).
The rarefaction analysis showed that both the dyke and salt marsh habitats exhibited similar levels of observed pollinator taxon richness, with 67 and 66 taxa recorded, respectively. Extrapolated richness estimates were also comparable, with values of 82.03 and 81.98 for the dyke and salt marsh habitats, respectively (Fig. 2A). Furthermore, the observed sampling coverage was high, reaching 98.5% for the dyke habitat and 98% for the marsh habitat. Similarly, the extrapolated coverage was 99% for both habitats. These high coverage values indicate that both habitats were adequately sampled, as evidenced by the asymptotic behaviour of the rarefaction curves for both habitats (Fig. 2A).
A, Species rarefaction curves showing observed and extrapolated species richness by habitat, with maximum observed richness indicated by the dot, and shaded areas indicated 95% confidence intervals; B and C, wild bee abundance and richness; D and E, floral taxon abundance and richness. Boxplot interquartile range (IQR) represents 25th and 75th percentiles with tails up to 1.5 × IQR, mean values are indicated by the diamond.
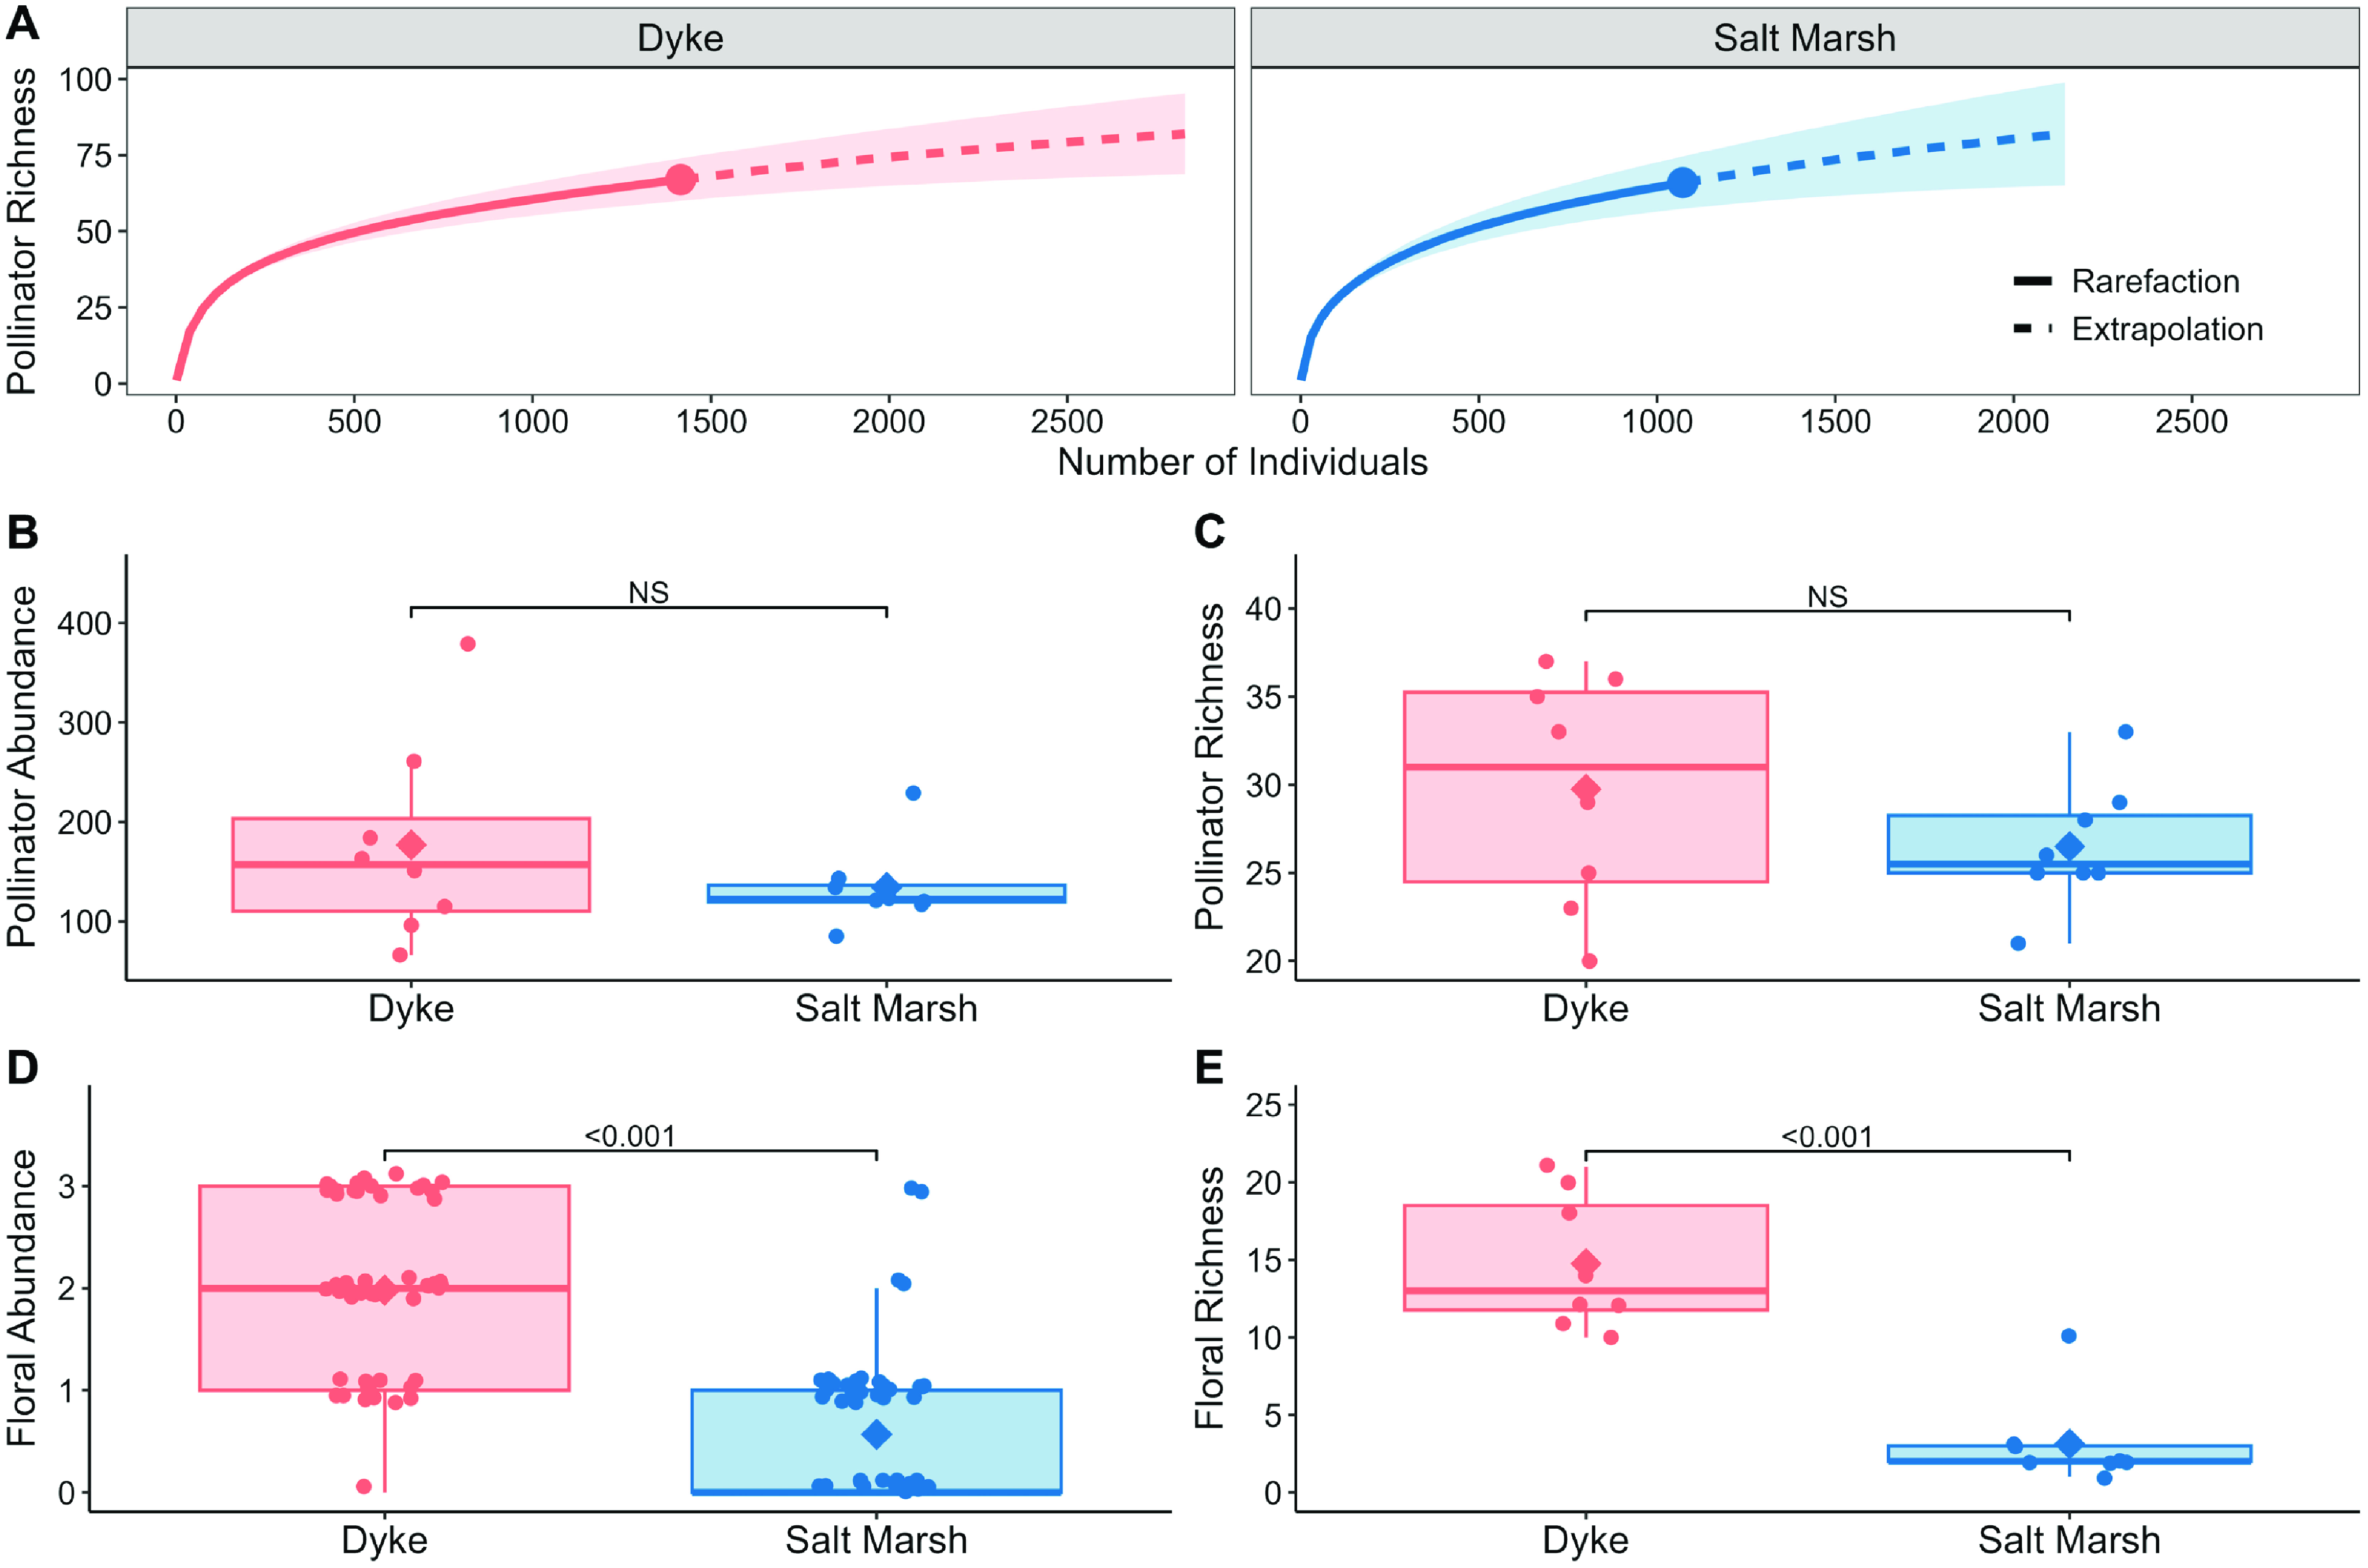
The mean pollinator abundance was similar in both habitats, with abundance in dykes (mean = 176.9 ± 35.7 (standard error)) slightly greater than abundance in marsh (mean = 134.0 ± 14.0 (standard error); Fig. 2B). The pollinator abundance model showed no significant difference between habitats (χ2 –1 = 1.845, P = 0.174). Removing dyke and saltmarsh sites within 1 km of one another yielded no significant difference between habitat type (χ²–1 = 0.232, P = 0.630).
Mean pollinator richness was slightly greater on dykes (mean = 29.8 ± 2.3 (standard error)) than in salt marshes (mean = 26.5 ± 1.2 (standard error); Fig. 2C). Results from the pollinator richness model complemented the rarefaction results, indicating that differences in richness between the two habitats were not significant (χ²–1 = 1.500, P = 0.221); likewise, when dyke and saltmarsh sites within 1 km of one another were removed, no significant difference was observed (χ²–1 = 0.088, P = 0.767).
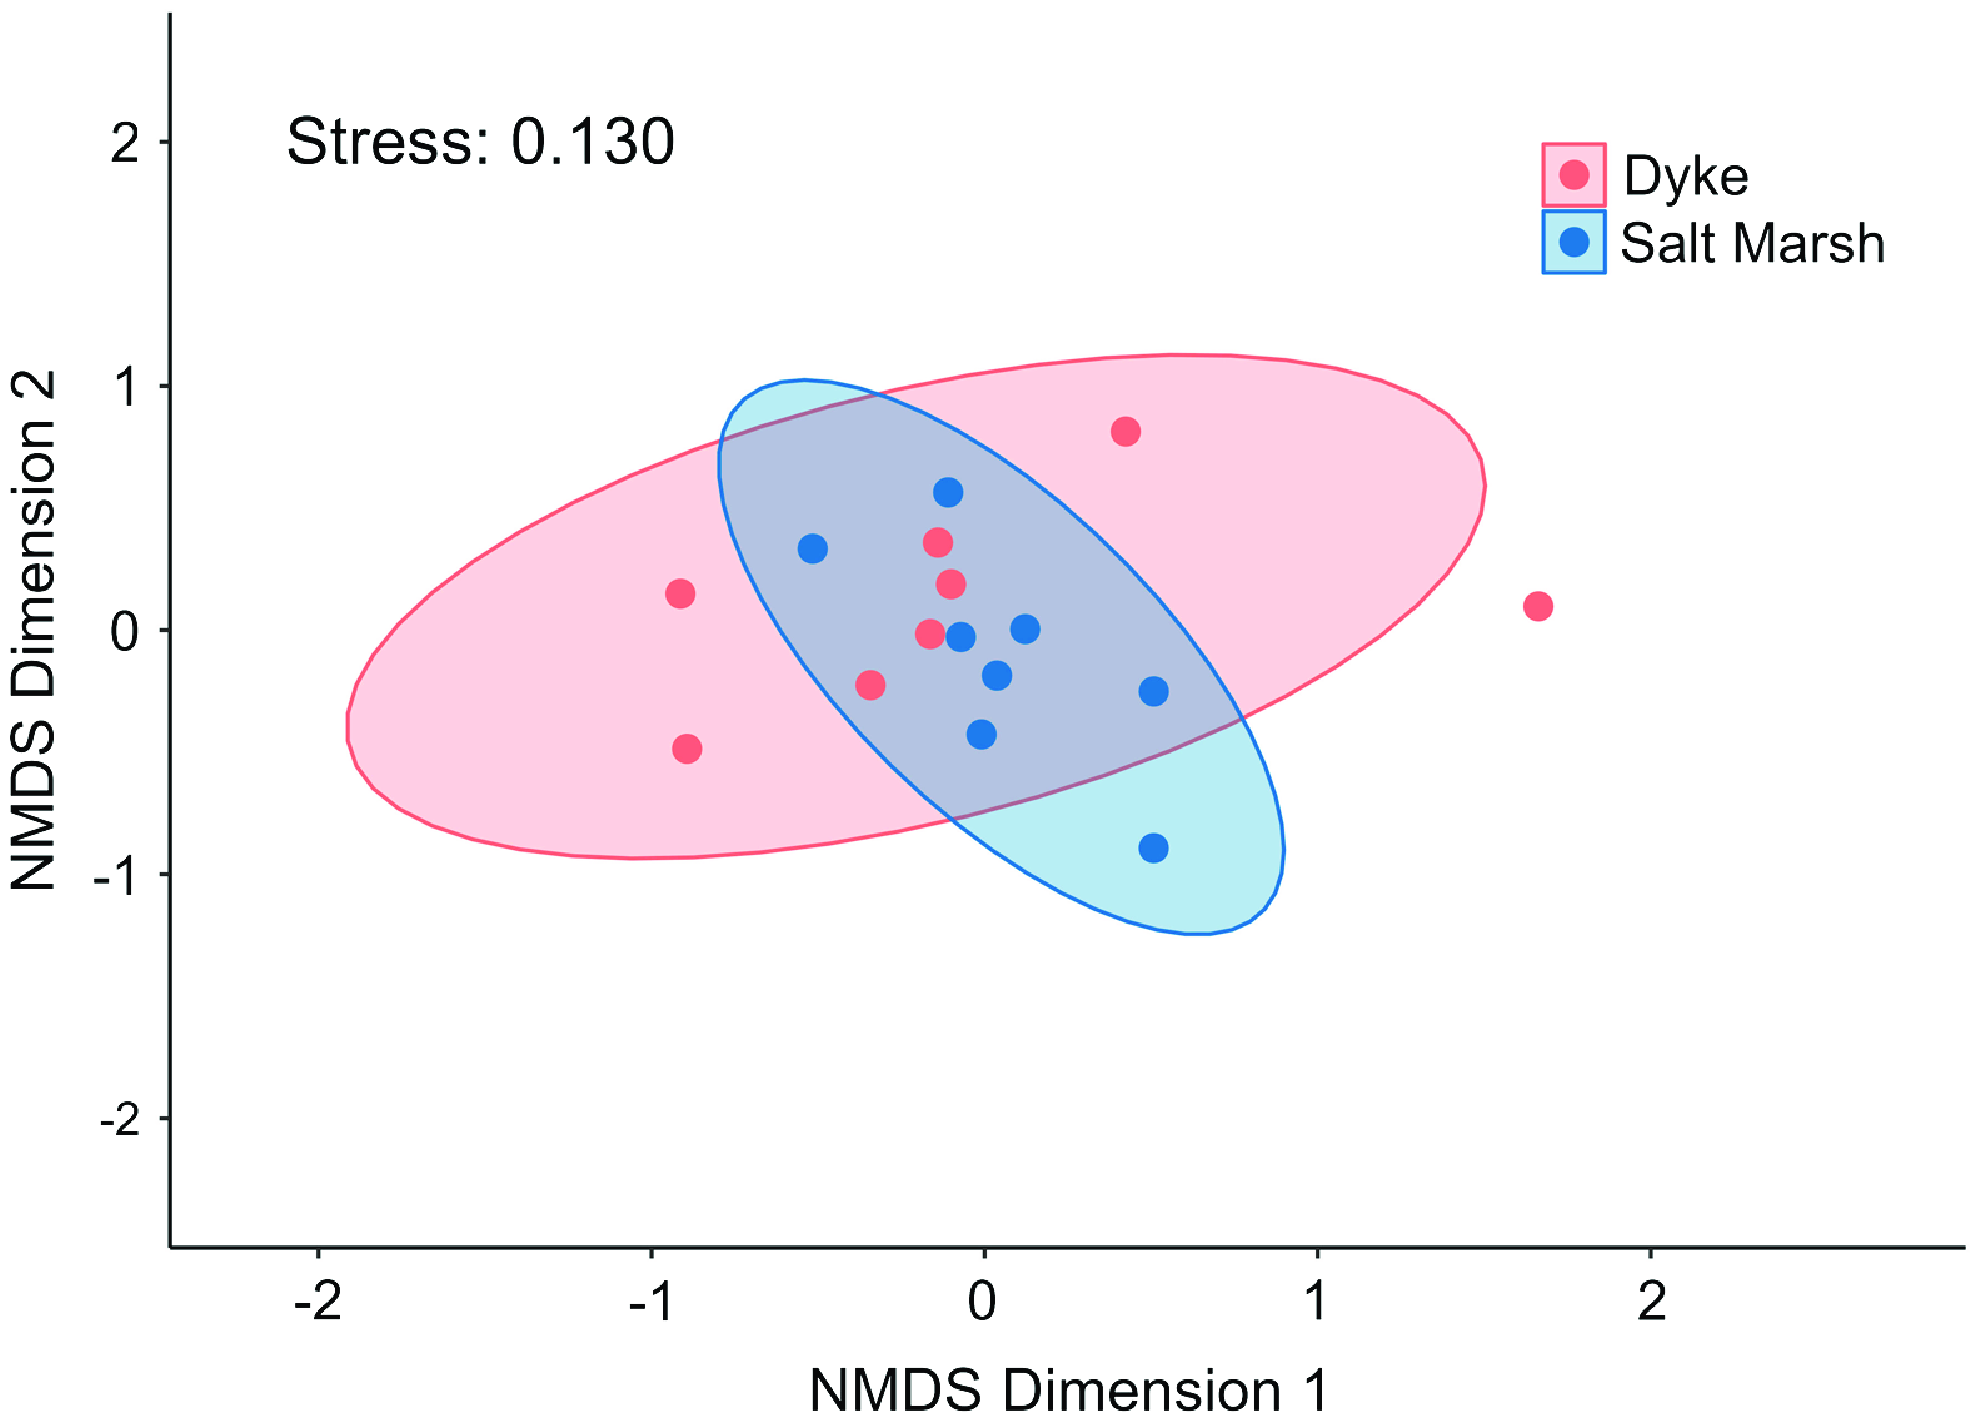
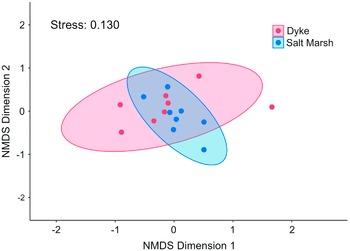
Ordination on pollinator communities resulted in no apparent clustering of habitats, with considerable overlapping in site replicates, thereby indicating similarity in species composition between habitats (Fig. 3). Permutational multivariate analysis of variance showed that no significant differences existed in pollinator community composition between the two habitat types (pseudo-F 1,14 = 1.340, P = 0.170). When dyke and saltmarsh sites closer than 1 km to one another were removed, there were still no significant differences detected (pseudo-F 1,12 = 1.4, P = 1.0).
Wild bee community composition measured using nonmetric multidimensional scaling, with proximity measured with Chi-square distance computed from species abundance, represented by the number of individuals of each taxon captured at that site over the entire sampling season (June–October 2020); each point represents a site (k = 2, stress = 0.130).
The dykes were covered by upland plant species and had many ruderal flowering species, including both annuals and perennials (Supplementary material, Table S2). In contrast, the salt marsh sites comprised mainly wind-pollinated graminoids (e.g., Sporobolus spp., Juncus spp., etc.), with fewer abundant flowering species (Supplementary material, Table S2). Floral abundance was stable on dykes across the sampling times, whereas high floral abundance only occurred in salt marshes in the fall, driven specifically by the blooming of Solidago sempervirens (Supplementary material, Fig. S3). Floral abundance scores were consistently greater on dykes, with most samples having high scores of “2” or “3”, and only two samples having a score of “0” (Fig. 2D). In contrast, on salt marshes, most samples had a low score of “0” or “1”, and only two samples scored as “3” (both from the same site; Fig. 2D). The floral abundance model revealed a significant effect of habitat (χ²–1 = 36.3, P < 0.001; Fig. 2D). Correspondingly, habitat had a significant effect on floral richness (χ²–1 = 42.1, P < 0.001). Mean floral richness was greater on dykes (mean = 14.8 ± 0.1 (standard error)) than in salt marshes (mean = 3.1 ± 0.1 (standard error); Fig. 2E; see Supplementary material, Table S2 for a list of plant taxa). Pollinator abundance did not vary significantly with floral abundance in either habitat (χ²–1 = 0.00, P = 0.99; Fig. 4A). Pollinator richness also did not vary significantly with floral richness by habitat (χ²–1 = 0.01, P = 0.90; Fig. 4B).
Responses of A, wild bee abundance to floral abundance by habitat type and B, wild bee richness to floral richness by habitat type. Each point represents a sampling event at a particular site (seven sampling events per site from June to October 2020).

Discussion
Pollinator community
We reject our hypothesis that pollinator abundance is higher on dykes than in salt marshes. Although the overall abundance of pollinators on dykes was greater, including one site with 2.5 times higher abundance than the overall average, this difference was not statistically significant (Fig. 2B). This may be attributable to the limited number of sites studied (only eight of each habitat) or to the inherent variability in population levels within these habitats. However, it is worth noting that the abundance of pollinators observed in salt marshes was unexpectedly high. This occurred despite the low abundance of floral resources in salt marshes (Fig. 2D), and we expected the number of pollinators to reflect this difference, per Roulston and Goodell (Reference Roulston and Goodell2011). Our result contradicts Hyjazie and Sargent (Reference Hyjazie and Sargent2022), which found that floral abundance and diversity is a significant positive predictor of pollinator abundance and diversity. However, we saw no relationship between floral abundance and richness and pollinator abundance and richness in either habitat (Fig. 4A, B).
Contrary to our hypothesis, the richness of pollinators on dykes was not higher than that observed in salt marshes. Both habitats shared many of the same bee species (Table 1) and hoverfly genera (Table 2), as well as wasps, butterflies, and moths. Again, this was an unexpected result. As mentioned above, richness (or diversity) of pollinator communities is typically reflected in richness of floral species. One potential explanation for the decoupling found in the present study is that pollinators are moving among the habitats we studied. For example, the prevalence of croplands in proximity to salt marsh habitat in the region would be expected to negatively affect pollinator richness (Kremen et al. Reference Kremen, Williams and Thorp2002), but other habitats such as florally rich dykes and a variety of upland natural habitats can also occur in proximity to salt marshes. Pollinators could easily spill over into habitats with lower amounts of floral resources that still could be used occasionally or opportunistically, as we observed with bees harvesting pollen or leaf pieces from salt marsh grasses. Although we showed statistically that the lack of differences in pollinator richness and abundance persist regardless of whether paired proximal dyke–salt marsh sites (less than 1 km apart) were included, the fact remains that both saltmarshes and dykes occur near one another and may share individual pollinators. This is also reflected in the results of the nonmetric multidimensional scaling, which showed that the taxonomic composition of the two sampled communities is similar (Fig. 3). Because of the communities’ proximity to one another on the landscape, pollinators may be accessing both habitats simultaneously, at least in places where natural or restored salt marsh exists in the dykelands. It should be noted that we examined potential pollinator assemblages only for a single growing season. The habitat value of dykeland and tidal wetland ecosystems to pollinators should be evaluated over longer periods to account for year-to-year variation.
Bee nest guilds
As expected, ground nesters were found to be the most rich and abundant group in the present study, given that three-quarters of bee species live in the ground (Fig. 2; Antoine and Forrest Reference Antoine and Forrest2021). Despite our results suggesting a similar abundance of ground-nesting bees on both dykes and salt marshes, dykes likely offer significantly more nesting opportunities than salt marshes do, due to the periodic flooding of salt marshes by tidal waters. A notable characteristic of many dykes in the Bay of Fundy is that they are made of sandy, loosely compacted soils, in which many ground-nesting bees are known to nest (Sardiñas and Kremen Reference Sardiñas and Kremen2014; Antoine and Forrest Reference Antoine and Forrest2021). The banks of dykes also offer niches for bee species that prefer slopes (Antoine and Forrest Reference Antoine and Forrest2021). This contrasts with salt marshes in the upper Bay of Fundy, which typically have dense sediments of mud and clay, usually unsuitable for most ground-nesting insects. However, some Megachile spp. prefer to build their nests in muddy soils and line them with leaves (Buschini Reference Buschini2006).
We found that parasitic (cuckoo) bees had similar abundances and richnesses in the two studied habitats (Table 1; Fig. 2). This result is important: parasitic bees are bio-indicators of community health because they maintain the stability of bee communities (Sheffield et al. Reference Sheffield, Pindar, Packer and Kevan2013b). Our finding implies that both habitats have potential to support healthy bee populations.
One noticeable difference in the functional groups observed between the two habitats was the higher abundance of cavity-nesting bees found on dykes than in salt marshes. This finding is likely a result of the low availability of suitable vegetation in the salt marsh for cavity nesters. In contrast, dykes support pithy vegetation, and woody plants are typically in much higher abundance there. More research is needed to investigate both habitats’ ability to support nesting niches, with dyke habitats likely providing more nesting habitat for bees and other pollinating insects.
The use of pan traps was practical for this study, but this method is known to be biased in favour of small-bodied bees (Prendergast et al. Reference Prendergast, Menz, Dixon and Bateman2020). Anecdotally, during several visits to both dyke and salt marsh sites, bumble bees (Bombus spp.), which are large-bodied bees, were seen but not captured during the sampling period, which may be reflected in this taxa’s undersampling generally (Prendergast et al. Reference Prendergast, Menz, Dixon and Bateman2020). Despite that, Bombus spp. richness and abundance were similar in both habitats in the present study (Table 1).
An intriguing and highly significant finding of this study was the observation of Bombus and Megachilidae bees visiting Sporobolus michauxianus, a wind-pollinated grass typically associated with salt marshes. This unexpected interaction highlights the overlooked importance to pollinators of resources provided by wind-pollinated taxa, with a substantial proportion attributed to grass species (Immelman and Eardley Reference Immelman and Eardley2000; Pound et al. Reference Pound, Vinkenoog, Hornby, Benn, Goldberg, Keating and Woollard2023). Although we found no other reports of bees visiting S. michauxianus in the literature, Pojar (Reference Pojar1973) reported pollen collection by Bombus occidentalis (Greene) from salt marsh species in western Canada. We note, during the present study, wilting of flowers in both habitats was common in July and August due to high seasonal temperatures, and the bees observed here could have been foraging opportunistically on what was available. Megachildae bees were also seen removing sections of S. michauxianus leaves, which these bees use for nest construction. At the very least, these observations suggest that salt marshes provide essential resources for bees. The potential of salt marshes to provide resources for pollinators should not be overlooked, especially because this habitat is usually considered to be of low value to pollinators.
Plant community
The plant communities differed greatly between the two studied habitats. The present study shows that floral abundance was significantly higher on dykes than in salt marshes (Fig. 2D), providing a greater availability of floral resources (Roulston and Goodell Reference Roulston and Goodell2011). In addition, floral abundance was stable throughout the growing season on dykes across the study, whereas salt marshes had high floral abundance only during the fall, due mostly to a single species. In agroecosystems, provision of consistent abundance of floral resources when crops are out of bloom is important for sustaining healthy pollinator populations and promoting crop pollination (Levenson and Tarpy Reference Levenson and Tarpy2023).
We found that floral richness was also significantly higher on dykes than in salt marshes (Supplementary material, Table S2; Fig. 2E). This is an important result because more diverse floral communities are known to support more diverse pollinator communities (Potts et al. Reference Potts, Vulliamy, Dafni, Ne’eman and Willmer2003). We noted several different nonnative weedy species, such as clover, Trifolium spp. (Fabaceae), and alfalfa, Medicago sativa (Fabaceae), growing on the dykes (Supplementary material, Table S2). There may be some influence of cover crops blowing onto the surrounding dykes. We observed a few flowering species growing in salt marshes and only one species, Solidago sempervirens, growing at all but one salt marsh sites (Supplementary material, Table S2). However, several of these floral species are known to increase pollinator abundance and richness in salt marshes, as compared to grazed (disturbed) marshes where these flowering species are absent (Davidson et al. Reference Davidson, Fowler, Skov, Forman, Alison and Botham2020).
Possible effects on pollinators of managed dyke realignment and salt marsh restoration
Dyke realignment involves the alteration or removal of short sections of dyke, often followed by reconstruction of a dyke further inland. Because we found similar numbers of pollinators in dyke and salt marsh habitats, the presence of tidal wetlands on the foreshore sides of dykes may offer an alternative habitat for bees and other pollinators while floral resources develop on the new dykes. Alternatively, disturbance of existing dykes would likely disrupt ground-nesting bees, but how frequently and under which circumstances dykes are used as nesting habitat is unclear. The length of dyke affected by any dykeland realignment project would be small, and because pollinators use many habitats within a landscape, other habitats within dykeland systems likely are able to provide resources to pollinators. At the very least, the present study shows that pollinators use both dyke and salt marsh habitats. There is opportunity for both these habitats to thrive and be enhanced through active restoration of salt marsh (Rabinowitz et al. Reference Rabinowitz, Lundholm, Graham, Bowron and van Proosdij2023) and through management of dykes, including by planting native floral mixes and floral strips (Nichols et al. Reference Nichols, Goulson and Holland2019). Such stewardship practices can support pollinators, which provide essential contributions and services to the surrounding croplands and communities (Garibaldi et al. Reference Garibaldi, Carvalheiro, Leonhardt, Aizen, Blaauw and Isaacs2014; Kremen and Merenlender Reference Kremen and Merenlender2018).
Conclusions
The present study is the first to examine wild bee assemblages in salt marshes and on dykes in the Bay of Fundy dykelands. The study’s results suggest that, although salt marshes had lower floral abundance and richness than dyke habitats did, both habitats shared similar overall numbers, species composition, and richness of insects that are likely pollinators. Given this, we conclude that both habitats provide resources to wild bee populations, although more research is required to quantify wild bee movement among the different habitats on the landscape, as well as the pollinators’ population dynamics. Further investigation into how wild bees access these habitats, such as ground nesting in dykes and visits to wind-pollinated taxa on salt marshes, is also needed. The proximity of both habitats to pollinator-dependent croplands also suggests that these habitats should be considered in studies into the effects of adjacent land uses on important bee populations.
Supplementary material
The supplementary material for this article can be found at https://doi.org/10.4039/tce.2024.34.
Acknowledgements
The authors thank Evan McNamara for collection and preparation of specimens and Hughstin Grimshaw-Surette for support in specimen identification. This research was funded by the Natural Sciences and Engineering Research Council of Canada (NSERC) research network: ResNet (NSERC NETGP 523374-18 to JL)]. Cette recherche a été financée par le Conseil de recherches en sciences naturelles et en génie du Canada (CRSNG) [numéro de référence NSERC NETGP 523374-18 à JL].
Competing interests
The authors declare that they have no competing interests.


 Open access