


Introduction
The past few decades have seen widespread – though not universal – stagnation of incomes and living standards in advanced democracies (Nolan & Thewissen, Reference Nolan, Thewissen and Nolan2018a, Reference Nolan, Thewissen and Nolan2018b; Nolan & Weisstanner, Reference Nolan and Weisstanner2021; Reeves et al., Reference Reeves, Pulliam and Schobert2019; Thewissen et al., Reference Thewissen, Kenworthy, Nolan, Roser and Smeeding2018). Together with rising income inequality, such developments raise concerns about the capacity of governments to deliver ‘inclusive growth’ to the broad population (OECD, 2018; Ostry et al., Reference Ostry, Loungani and Berg2019). Income dynamics and the unequal distribution of economic gains have also become topics in comparative political economy and comparative politics. Recent research has argued that redistributive preferences and voting are shaped by people's income expectations (Rueda & Stegmueller, Reference Rueda and Stegmueller2019) or ‘positional deprivation’ relative to other groups (Burgoon, Reference Burgoon2019; Burgoon et al., Reference Burgoon, Noort, Rooduijn and Underhill2019).
These studies are part of a broader effort in the literature to move away from static toward dynamic perspectives on the political consequences of economic developments (Margalit, Reference Margalit2019). But the well‐known paradox that support for redistribution did not increase correspondingly with rising income inequality since the 1980s remains unresolved (Kenworthy & McCall, Reference Kenworthy and McCall2008). Where citizens have been ‘left behind’ economically, we do not observe a widespread turn to pro‐redistributive left parties but a turn towards radical right parties instead (Burgoon et al., Reference Burgoon, Noort, Rooduijn and Underhill2019; Kurer, Reference Kurer2020). The puzzle therefore is why stagnation and inequality has not led to higher political demand for redistributive policy to address these developments.
This paper seeks to resolve this puzzle by exploring how ‘absolute’ and ‘relative’ income stagnation shape citizens’ attitudes towards redistribution. Absolute stagnation, as used here, refers to an individual experiencing low rates of income growth over time (without reference to the growth rates experienced by other income groups). Relative stagnation refers to an individual experiencing relatively lower rates of income growth over time in comparison to the rates of income growth experienced by other income groups. This distinction builds on, and seeks to generalise, a previous study that found differential effects of absolute and relative income changes on redistribution preferences in a laboratory experiment in the United States (Mérola & Helgason, Reference Mérola and Helgason2016).
The effect of relative stagnation is straightforward to conceptualise from a political economy perspective: income stagnation relative to other groups should lead to higher support for redistribution. Recent work by Brian Burgoon and co‐authors uses the similar concept of ‘positional deprivation’, which denotes ‘a situation where the increase (decrease) in disposable income of an individual is smaller (larger) relative to the growth in income of other groups in the same country's income distribution’ (Burgoon et al., Reference Burgoon, Noort, Rooduijn and Underhill2019, p. 52, emphasis in original). My own findings strongly overlap those presented in Burgoon (Reference Burgoon2019) and confirm that relative income stagnation is indeed associated with higher support for redistribution.
In contrast, the main contribution of this paper is to shed light on absolute stagnation (i.e., a failure to secure high absolute growth rates of one's own income over time). I argue that absolute stagnation reduces support for redistribution. This surprising association (counterintuitive from a political economy perspective) builds on a different theoretical perspective, which starts from the old premise in the welfare state literature that welfare states require economic growth and resources to be financed (Lindert, Reference Lindert2004; Wilensky, Reference Wilensky1975). Breaking this logic down to the micro‐level implies that individuals need to experience a certain absolute income growth to perceive being able and willing to afford redistributive welfare policies paid by taxes. Redistributive welfare policy in this view is seen as a ‘luxury good’: demand for it increases with rising incomes (Durr, Reference Durr1993). Absolute stagnation may lead to lower support for redistribution due to a combination of ‘egotropic mechanisms’ (emphasising strained individual resources) and ‘sociotropic mechanisms’ (emphasising lower social affinity with other groups). Absolute stagnation, in sum, may offset the positive effect of relative stagnation on support for redistribution. Therefore, the joint impact of income stagnation on redistributive policy preferences is uncertain.
For the empirical analysis, I estimate trends in absolute and relative income stagnation from Luxembourg Income Study microdata (LIS, 2021) for 14 countries since the 1980s. This data shows that relative gaps have increased, but there is a less‐known variation in absolute growth rates: Lower income and middle‐income groups in countries like Germany, Italy or the United States have seen almost no real income growth, while growth rates of 3 per cent per year have been no exception in pre‐crisis Ireland or Norway. I match these income growth estimates with International Social Survey Programme (ISSP) and European Social Survey (ESS) survey data, to construct a longitudinal individual‐level dataset between 1985 and 2018, which goes beyond existing studies in the literature. Using random‐effects models, I find that absolute stagnation is associated with lower support for redistribution. This is the opposite of the effect of relative stagnation, which is associated with higher support. The conditional effect of absolute stagnation is stronger if incomes stagnate in relative terms – which implies that the highest demand for redistribution is predicted under a combination of absolute growth and relative stagnation – but the effect of absolute stagnation does not differ much by current income.
These findings have three broader implications. First, they show that widespread stagnation has consequences for political support for the welfare state. Absolute stagnation may help in explaining the general absence of more pro‐redistributive preferences, although income inequality has increased. Second, while reaffirming the importance of dynamics for policy preferences (Margalit, Reference Margalit2019), I show that absolute and relative changes matter differently and depend upon each other. Third, the relevance of absolute and relative stagnation arguably is not limited to policy preferences, but also applies to broader electoral politics. Relative deprivation has been associated with the rise of radical right and left parties (Burgoon et al., Reference Burgoon, Noort, Rooduijn and Underhill2019), but few studies look at absolute changes in economic fortunes alongside relative changes. While relative deprivation makes sense to understand some electoral changes, such as the radical left with its strongly redistributive programme, it is not a straightforward explanation of the radical right's success (Busemeyer et al., Reference Busemeyer, Rathgeb and Sahm2021; Engler & Weisstanner, Reference Engler and Weisstanner2021). Adding a more encompassing view of both absolute and relative changes to people's socio‐economic situation could add to this literature and would be in line with a much needed ‘electoral turn’ in political economy research (Beramendi et al., Reference Beramendi, Häusermann, Kitschelt, Kriesi, Beramendi, Häusermann, Kitschelt and Kriesi2015, p.4).
Stagnation and redistributive preferences
The argument in this paper posits that the dynamic experience of socio‐economic stagnation matters for individuals’ positions on redistribution, but in differential ways for stagnation in absolute and relative terms. The traditional ‘median voter’ models of redistribution in political economy (Meltzer & Richard, Reference Meltzer and Richard1981) have long been criticised for being unable to account for the empirical observation that unequal societies have lower levels of redistribution (Iversen & Soskice, Reference Iversen and Soskice2009; Moene & Wallerstein, Reference Moene and Wallerstein2001). Prior studies have addressed this ‘Robin Hood paradox’ (Lindert, Reference Lindert2004, p. 15) by focusing on government partisanship (Bradley et al., Reference Bradley, Huber, Moller, Nielsen and Stephens2003), electoral institutions (Iversen & Soskice, Reference Iversen and Soskice2006) or ethnic heterogeneity (Alesina & Glaeser, Reference Alesina and Glaeser2004), among other factors.
Many recent contemporary political science and political economy studies focus more explicitly on the dynamics of self‐interest‐based explanations (see Margalit, Reference Margalit2019). This move abandons the static nature of the Meltzer–Richard model and its assumption that redistribution preferences are largely stable unless there are exogeneous changes to the income distribution (Avdagic, Reference Avdagic2019). One major strand within this research focuses on risk, that is, the probability of experiencing income and employment losses that can be covered by social insurance (Iversen & Soskice, Reference Iversen and Soskice2001; Gingrich & Ansell, Reference Gingrich and Ansell2012; Rehm Reference Rehm2009, Reference Rehm2016). A closely related strand looks at future income expectations (holding risk constant), where individuals expecting to experience upward mobility will demand less redistribution (Bénabou & Ok, Reference Bénabou and Ok2001; Moene & Wallerstein, Reference Moene and Wallerstein2001; Rueda & Stegmueller, Reference Rueda and Stegmueller2019).
Both risk and future income expectations introduce a dynamic time horizon which increases explanatory power for redistributive preferences. But risk does not always translate into actual income losses (Rehm et al., Reference Rehm, Hacker and Schlesinger2012). Largely missing in the literature, so far, are comparative studies about the actual historical evolution of individuals’ incomes and the impact thereof on policy preferences. Some existing studies use panel data on income changes, but are limited to single countries.Footnote 1 The economic voting literature looks at the effect of income and growth dynamics in comparative perspective, but for a different dependent variable, voting for the incumbent, and usually with macro‐level instead of individual‐level data (e.g., Aytaç, Reference Aytaç2018). As noted in the introduction, the absence of work on the actual evolution of incomes in the literature is surprising given that shifts in the income distribution have been a prominent macroeconomic development of the past decades. In this paper, I seek to fill this gap and argue that retrospective income growth over the recent past (here, over a 5‐year period) is a theoretically meaningful indicator to study the political impact of stagnation.
Distinguishing absolute and relative dynamics
My argument conceptually distinguishes between absolute and relative income dynamics. Absolute income dynamics, as used here, refer to the actual rate of income growth, stagnation or decline over time, that is, the change between an individual's current income and her income in the past. Relative income dynamics, in contrast, refer to the same rate of income growth, stagnation or decline over time but in comparison to the rate of income growth experienced by other income groups (or compared to the average).
The argument builds on the important US experimental study by Mérola and Helgason (Reference Mérola and Helgason2016), who found opposite effects of absolute and relative income shifts on redistributive preferences. They start from the puzzle that different literatures on the relationship between economic shifts and redistributive preferences make opposing predictions and propose a new framework distinguishing the effect of absolute and relative income shifts on preferences. Like my paper, Mérola and Helgason (Reference Mérola and Helgason2016, p. 1110) note that political economy theories primarily focus on the effect of relative income dimension – essentially, whether individuals are net contributors or net beneficiaries of redistribution – while neglecting absolute income changes. Mérola and Helgason (Reference Mérola and Helgason2016, p. 1111) conceptualise the effect of absolute income shifts mainly in terms of group solidarity and a feeling that ‘everyone is on the same boat, sharing equally in the gains of the economy’. This increase in social affinity, in turn, shapes redistributive preferences: ‘Such feelings of group belongingness will increase concerns with inequality, resulting in individuals supporting greater redistribution, even at a cost to themselves, conditional on the status of the group’ (Mérola & Helgason, Reference Mérola and Helgason2016, p. 1120).
I extend this pioneering work by Mérola and Helgason (Reference Mérola and Helgason2016) both theoretically and empirically. Theoretically, by providing a broader theoretical framework on absolute income shifts, which takes into account not only group‐driven (or sociotropic) motivations but also egotropic motivations. I also consider the joint impact of absolute and relative income shifts and develop a set of hypotheses about conditional effects of the two types of income changes. Empirically, by using representative and more generalisable observational data from 14 advanced democracies since 1985. In the following sections, I derive hypotheses for the relationship between relative income stagnation and redistributive preferences first, since these are straightforwardly embedded in the literature, and then proceed with hypotheses for absolute stagnation.Footnote 2
Relative stagnation
A straightforward axiom from a political economy perspective is that when income stagnation is unequally distributed, some individuals or groups stand to gain more from tax‐transfer redistribution than others (Meltzer & Richard, Reference Meltzer and Richard1981). Relative income stagnation in this view is a distributive zero‐sum game, in which each group's gains are matched by the losses of other groups. These relative gains or losses are what defines an individual's economic self‐interest and lead to polarised preferences for redistribution. Individuals that have seen relatively higher growth than the average have less to gain from taxation and should demand less redistribution, and vice versa. This can apply irrespective of an individual's current income position. Low‐income individuals might become opposed to redistribution if they are catching up over time relative to other groups. High‐income individuals might become supportive (or, less opposed) of redistribution if their income growth experience has lagged behind others.
The political effects of relative stagnation have been studied extensively by Burgoon et al. (Reference Burgoon, Noort, Rooduijn and Underhill2019) with respect to voting behaviour and by Burgoon (Reference Burgoon2019) with respect to redistributive preferences. They conceptualise relative income stagnation very similarly to this paper as ‘positional deprivation’, defined as ‘a situation where the increase (decrease) in disposable income of an individual is smaller (larger) relative to the growth in income of other groups in the same country's income distribution’ (Burgoon et al., Reference Burgoon, Noort, Rooduijn and Underhill2019, p. 52). Burgoon (Reference Burgoon2019) finds that positional deprivation is associated with higher support for redistribution. Moreover, positional deprivation tends to increase support not only for radical left parties, who promote a strong redistributive stance, but also for radical right parties, especially if respondents’ relative income growth is outstripped by low‐income individuals. These studies convincingly highlight the impact of relative income dynamics, although they do not test the effects of absolute income dynamics.Footnote 3 In line with these studies and much of the political economy literature on redistribution, my first hypothesis for relative income stagnation is:
H1: Relative income stagnation is associated with higher support for redistribution.
Absolute stagnation
Whether someone becomes better or worse off in relative terms, however, can mean different things depending on whether their own income is growing or stagnating in absolute terms. Absolute and relative growth have theoretically and empirically distinct implications for redistributive preferences (Mérola & Helgason, Reference Mérola and Helgason2016). At first glance, the experience of lower real income growth – what I call absolute stagnation – can gradually build up to income losses and create insecurity about one's long‐term income position. According to standard political economy literature, such insecurity may in turn increase support for redistribution based on insurance motivations (e.g., Rehm, Reference Rehm2016; Rueda & Stegmueller, Reference Rueda and Stegmueller2019).
However, the impact of absolute stagnation can deviate from this familiar political economy perspective. First, in contrast to relative stagnation, absolute stagnation can potentially affect all individuals – rich or poor – in a society at any given point in time. If all individuals experience lower real income growth, the distribution of net beneficiaries and contributors to redistributive welfare policies, from which the political economy literature derives the hypothesis about relative stagnation and demand for redistribution, is left unchanged. Second, as I will show in the empirical section, absolute stagnation in practice measures quite gradual income changes – for example, whether an individual's rate of income growth is 0.5 per cent instead of 2 per cent per year. This is an important difference that can accumulate over time. But it is different from the kind of substantial income declines people experience when losing their job, on which the political economy literature focuses. Therefore, political economy perspectives are not sufficient to expect a positive effect of absolute stagnation on support for redistribution.
A different theoretical account on the effect of absolute stagnation is required instead. My starting point is that welfare states require resources and certain levels of economic prosperity to be financed (Lindert, Reference Lindert2004; Wilensky, Reference Wilensky1975). A lack of economic growth may be reflected in an increased demand for redistributive welfare policies due to the higher prevalence of income losses and insecurity. But at the same time, lack of economic growth can also strain individuals’ resources and their ability and willingness to pay the taxes required to finance these benefits. This in turn would undermine their support to provide redistributive welfare policies in the first place. As such, absolute stagnation can have the counterintuitive consequence to result in lower support for redistribution.
From this alternative perspective, redistributive welfare state policy can be seen as a ‘luxury good’ (Durr, Reference Durr1993), where demand for such policy increases with rising incomes. Because redistributive welfare state policy ‘does not come cheap’ (Durr, Reference Durr1993, p. 159), it requires that voters are in a comfortable economic position to pay for these policies: ‘While liberal elites may push such policies at all times, such an agenda can only be supported by a healthy economy or (to be more accurate) by a populace enjoying the fruits of a healthy economy.’ (ibid.). Often neglected by the political economy literature, there is substantial cross‐national empirical evidence supporting the hypothesis that (aggregate) policy preferences move to the left under economic expansions and to the right in economic downturns (Barth et al., Reference Barth, Finseraas and Moene2015, p. 573; Markussen, Reference Markussen2008; Neundorf & Soroka, Reference Neundorf and Soroka2018; Stevenson, Reference Stevenson2001; Wlezien & Soroka, Reference Wlezien and Soroka2021).
The argument that absolute stagnation can reduce support for redistribution involves two types of mechanisms: egotropic and sociotropic mechanisms. While the two types of mechanisms differ regarding their analytical assumptions – the egotropic mechanism mainly highlights an individual's own rational self‐interest, the sociotropic mechanism highlights an individual's altruistic and other regarding considerations – both mechanisms refer to processes at the individual level, that is, to the individual experience of income stagnation. In practice, the two mechanisms lead to the same hypothesis and are hard to separate with the comparative and observational empirical data upon which this paper relies.
The egotropic mechanism posits that absolute stagnation, by reducing the real disposable household income available compared to the past, leaves individuals with lower resources to afford paying for taxes and contributions for redistributive welfare policies. In other words, individuals that experience absolute stagnation become more concerned about their own material position and their actual or perceived ability to pay for redistribution. Conversely, as individuals become better‐off in absolute terms, they might be more able to afford resources to finance redistributive welfare policies. While affordability concerns might not be constant across current income groups (see the discussion on conditional effects below), such concerns could become more (less) salient for all individuals over time as stagnation increases (decreases). This egotropic mechanism lies at the heart of the idea of redistributive welfare policies as ‘luxury goods’ (Durr, Reference Durr1993), whereby redistribution is desirable as long as favourable (absolute) economic experiences permit the ability to pay for these policies through taxes and contributions.
The sociotropic mechanism, in contrast, emphasises not only individuals’ material self‐interest and material ability of individuals to finance redistributive welfare policies, but also their willingness to do so based on altruistic and other‐regarding considerations. Alt (Reference Alt1979) has shown that economic downturns, and the threat they pose to household incomes, can reduce solidarity with other groups. Altruistic considerations are more likely among affluent individuals (Dimick et al., Reference Dimick, Rueda and Stegmueller2018), and absolute improvements of citizens’ economic situations can provide them with the necessary resources for such behaviour. Absolute income growth can also affect social affinity between different groups, depending on whether such experiences are shared with other groups. As Mérola and Helgason (Reference Mérola and Helgason2016, p. 1111) point out, situations where everyone enjoys positive absolute economic changes (and, hence, relative growth differences are low) create positively connotated perceptions of a common fate: ‘a feeling of different groups being not only “on the same boat” but also being on a “desirable boat”’. This increased social affinity (or, reduced social distance) is associated, in turn, with inequality aversion and higher redistribution support (Alt & Iversen, Reference Alt and Iversen2017; Lupu & Pontusson, Reference Lupu and Pontusson2011).
Both the egotropic mechanism (emphasising a lower ability to pay taxes under absolute stagnation) and the sociotropic mechanism (emphasising lower social affinity under absolute stagnation) lead to the same prediction: absolute stagnation reduces support for redistribution. If we would distinguish more fine‐grained types of redistributive policies, the mechanisms might apply more strongly for some programs than for others. For example, the income‐maximising rationale behind the egotropic mechanism has been associated with support for redistribution taking from the ‘rich’, while the social affinity rationale behind the sociotropic mechanism has been associated with support for redistribution giving to the ‘poor’ (Cavaillé & Trump, Reference Cavaillé and Trump2015). However, my study conceptualises redistributive preferences as a broader shorthand for support for the welfare state, encompassing both its redistributive and insurance functions. Thus, in practice it may not be possible to differentiate between the two mechanisms, as they lead to the same main hypothesis for the association between absolute stagnation and support for redistribution:
H2: Absolute income stagnation is associated with lower support for redistribution.
I operationalise the concept of absolute stagnation using retrospective income growth over a 5‐year period, which measures the rate at which the current income of an individual in a certain income decile has grown or declined compared to an individual in the same income decile in year t − 4. This avoids making any strong cognitive assumptions about reference groups and knowledge about income distribution – two potentially problematic areas for studies focusing on relative dynamics. First, effects of relative stagnation crucially depend on the choice of reference groups to which individuals compare their experiences. Although there is evidence that income group identification matters for redistributive preferences (Cansunar, Reference Cansunar2021), it could also be the case that individuals primarily compare themselves to non‐income related groups such as friends, relatives, neighbours or co‐workers. Second, arguments about relative stagnation involve assumptions about individuals’ knowledge of the income distribution, that is, that respondents are able to assess their own income position, the income position of others, as well as the respective change of these two groups over time. These assumptions may be difficult to square with evidence that individuals are notoriously inaccurate at estimating the income distribution (Gimpelson & Treisman, Reference Gimpelson and Treisman2018). By focusing on absolute change, my implicit assumption that individuals have an idea about whether their own incomes have grown, stagnated or declined over the recent past – irrespective of how others’ incomes have grown – seems more realistic.
Conditional expectations
Despite involving less demanding assumptions, I still expect that the effect of absolute income stagnation may be more or less pronounced under different conditions. First, the two types of stagnation (absolute and relative) are likely to interact and reinforce each other. Concern about material position and the ability to afford paying taxes – which underlines the effect of absolute stagnation on preferences – is likely more salient in a context where individuals are stagnating in relative terms as well. Similarly, relative stagnation may reduce the disposition for altruistic behaviour in a similar way than absolute stagnation. Thus, I expect that absolute stagnation reduces support for redistribution even further when relative incomes also stagnate, while the effect of absolute stagnation may be more muted if individuals are relatively better off. In combination, the highest levels of support for redistribution should be observed when absolute income growth is high (allowing individuals to afford welfare policies) but relative income growth is low (allowing individuals to shift the burden of taxation upon other groups).
H3: The effect of absolute income stagnation on support for redistribution is stronger at high relative stagnation.
In a similar vein, the willingness and financial ability to afford welfare policies may vary between individuals who are currently rich or poor, not only between individuals who have become richer or poorer. If incomes stagnate in absolute terms by growing, for example, only by 0.5 per cent instead of 3 per cent a year, then they are likely to significantly lag behind rising living costs. Such a situation could be more severe for low‐income individuals, who may have little financial reserves and little prospects of a high income. Thus, if income goes down, the poor will be hit harder than the rich, as they have less room and resources to pay for bills. Consequently, the negative impact of absolute stagnation on support for redistribution should turn out to be stronger among low‐income groups.
H4a: The effect of absolute income stagnation on support for redistribution is stronger at low current incomes.
On the other hand, absolute income stagnation may also affect different income groups relatively equally. All individuals experiencing absolute stagnation may see their perceived costs of living increase. In contrast, absolute growth may render all income groups more able and willing to afford spending more on luxury goods like redistributive welfare policies. Finding such a uniform effect of absolute income growth does not necessarily imply that established political economy findings should be called into question. First and foremost, current income is likely to have a strong negative effect on support for redistribution, irrespective of the context of absolute stagnation. As documented many times in the political economy literature, high‐income individuals are still more likely to oppose policies to which they are net contributors.
H4b: The effect of absolute income stagnation on support for redistribution does not depend on current income levels.
Data and methods
The empirical analysis combines estimates on absolute and relative income changes from the Luxembourg Income Study (LIS, 2021) with survey data on redistribution preferences from the International Social Survey Programme (ISSP) and the European Social Survey (ESS). The sample encompasses 14 advanced democracies representative of a variety of welfare state regimes (see Supporting Information Appendix 1 for the countries and sample details). I selected countries for which LIS data are available since the late 1980s. The sample, therefore, does not include younger democracies in Central and Eastern Europe and Latin America, and some countries (Japan, New Zealand, Portugal, Sweden, Switzerland) for which LIS data does not cover the entire time span. ISSP survey data on redistribution preferences is available since 1985. Previous studies have already combined ISSP and ESS surveys for the purpose of studying redistribution preferences over a long time period (Lupu & Pontusson, Reference Lupu and Pontusson2011; VanHeuvelen, Reference VanHeuvelen2017; VanHeuvelen & Copas, Reference VanHeuvelen and Copas2018). The final sample for the working‐age population (aged 18–65, see below) comprises 187,885 individuals from 14 countries nested in 166 country‐waves between 1985 and 2018.
Support for redistribution
The dependent variable is support for redistribution. Support is measured with the 5‐point answer scales from the questions whether the ‘government should take measures to reduce differences in income levels' (ESS) and ‘It is the responsibility of the government to reduce the differences in income between people with high incomes and those with low incomes’ (ISSP). The variable ranges from 1 = ‘strongly disagree’, 2 = ‘disagree’, 3 = ‘neither nor’, 4 = ‘agree’, to 5 = ‘strongly agree’. Don't know, refuse and other answers were coded as missing. I create a binary variable that indicates support for redistribution for respondents agreeing or strongly agreeing with the statement, although the results are substantively similar with a continuous variable. For a reduced ISSP sample, I also use two alternative dependent variables to explore the mechanisms of my framework: an item that the government should provide a decent living standard for the unemployed and an item on preferences to cut government spending (‘agree’ or ‘strongly agree’ coded as 1).
Absolute and relative stagnation
The key explanatory variable is the experience of income stagnation in absolute and relative terms. Using the Luxembourg Income Study (LIS 2021), I estimate the average annual growth rate of real disposable household incomes for each income decile. All income growth estimates are restricted to working‐age adults (18–65 years), to ensure that the estimates are not driven by income changes due to retirement and variation in old age pensions, but the estimates are substantively similar for the total population (Supporting Information Appendix 2).
To compute the measure for absolute income growth, I proceed in several specific steps, largely following existing work in economics (Nolan & Thewissen, Reference Nolan, Thewissen and Nolan2018a, Reference Nolan, Thewissen and Nolan2018b). First, I estimate each decile's average disposable household income, adjusted for household size using the square root equivalence scale. Second, although LIS data has recently been made available on an annual basis for some countries, it still contains gaps. I use linear interpolation to fill in these gaps. Third, I adjust the income estimates for inflation, using 2015 consumer price indices. Fourth, I calculate the average annual percentage‐change in these incomes over a 5‐year period (the average growth in t0/t − 1, t − 1/t − 2, t − 2/t − 3, and t − 3/t − 4). This is my measure for absolute income growth or stagnation.
To measure relative income growth or stagnation, I calculate the difference between a decile's absolute income growth and average income growth across all deciles. These choices align exactly with the choices made by Burgoon and colleagues (Reference Burgoon, Noort, Rooduijn and Underhill2019) to calculate ‘positional deprivation’. Specifically, they also use linear interpolation and assess change over a 5‐year window, which they argue is a meaningful time frame for voters assessing income change across the election cycle (Burgoon et al., Reference Burgoon, Noort, Rooduijn and Underhill2019, p. 64).Footnote 4 The choice to use income growth of the average as the reference group is motivated by median voter theories in the tradition of Meltzer and Richard (Reference Meltzer and Richard1981) or, more recently Iversen and Soskice (Reference Iversen and Soskice2019), who focus on the economic position of pivotal voters – including the median voter – relative to average income in a society. It is possible to specify other reference groups. For example, Burgoon et al. (Reference Burgoon, Noort, Rooduijn and Underhill2019) further distinguish between lower‐register and upper‐register positional deprivation. While this is not the focus of my paper and I have no strong theoretical expectations, I make sure that calculating relative income growth with alternative reference groups does not affect the main findings (see Supporting Information Appendix 4, A4.2).
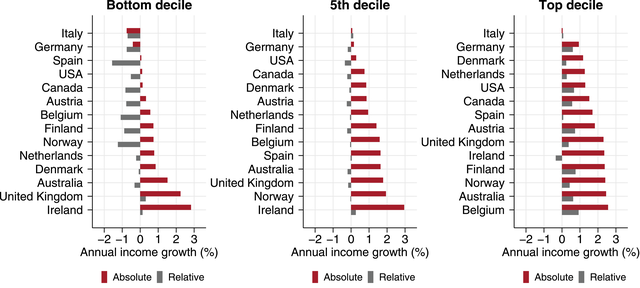
Figure 1 shows the distribution of absolute and relative income stagnation for the working‐age population. The numbers are averages between 1991 and 2013, the time span for which LIS data is available in all 14 OECD countries in my sample. The panel on the left shows the estimates for the lowest income decile. Absolute real income growth in 11 out of the 14 countries has been below 1 per cent a year, and even negative in two cases (Italy and Germany). Australia, the United Kingdom and Ireland have seen much higher absolute income growth, although for the latter two cases this was driven primarily by the time before the Great Recession. The grey bars indicating relative income growth show that the bottom's income growth has lagged behind average income growth in most countries, even in countries with moderate absolute growth like Spain, Norway, Belgium or Finland.
Absolute and relative income growth. Notes: Averages 1991–2013 based on LIS data for working‐age population. [Colour figure can be viewed at wileyonlinelibrary.com]

The middle panel of Figure 1 shows income growth for the fifth decile. Middle incomes have grown more strongly than bottom‐decile incomes. In a significant minority, though, middle incomes have barely experienced any growth over this time period, notably in Italy, Germany and the United States. In relative terms (grey bars), the fifth decile has seen lower income growth than the average in all countries except Italy and Spain. Finally, the right‐hand panel of Figure 1 shows a more robust income growth for the top decile (again with the exception of Italy). Relative growth at the top has outstripped average growth in all countries except Ireland. For all three income deciles, Figure 1 demonstrates a substantial variability between countries with stagnating incomes (e.g., Italy, Germany or the United States) and countries with high income growth (e.g., Ireland, Norway, Australia or the United Kingdom) in both absolute and relative terms.
The next step is to link these income growth estimates by income decile with the corresponding income decile of the ISSP/ESS survey respondents. For this step, I first recode the ISSP/ESS's current income variable. Following Donnelly and Pop‐Eleches (Reference Donnelly and Pop‐Eleches2018, p. 358–359), I assign midpoints of the income bands shown to respondents and apply a correction for imputing the midpoint of the top category.Footnote 5 I adjust incomes for household size (dividing by the square root of number of household members) and divide respondents into ten income deciles. These deciles provide the link between an ISSP/ESS survey and the LIS income growth estimates in a given year. The income deciles from LIS and ISSP/ESS are highly comparable.Footnote 6 The LIS estimates for absolute and relative income growth at the bottom income decile are assigned to respondents in the ISSP/ESS's bottom income decile, the LIS estimates at the second decile to the ISSP/ESS's second decile, and so on.
The measures of income growth could give rise to two caveats. First, they might seem cognitively too demanding. However, for absolute income growth, individuals only need to sense the change in their own personal incomes – they are not required to know the shape of the income distribution and the income evolution of other groups. Interestingly, for relative income growth, where such assumptions are potentially a serious issue, Burgoon (Reference Burgoon2019) finds that perceptions of positional deprivation are quite accurate. Relying on original survey data from 13 European countries, Burgoon (Reference Burgoon2019) reports a positive and statistically significant correlation between objective measures for positional deprivation between 2008 and 2014 and a subjective measure for positional deprivation.
A second caveat is that my income growth measures rely on ‘anonymous’ data from repeated cross‐sectional surveys rather than longitudinal panel data. Looking at the income growth rate of the person at a specific decile in different years may be problematic because people change their income position; the persons representing a specific decile may not be the same individuals over time (Jenkins & Van Kerm, Reference Jenkins and Van Kerm2011). Unfortunately, the cross‐sectional LIS data does not allow assessing the precise extent of individual income mobility in my sample. However, I argue that the anonymous income growth measures are still valid proxies about the income trajectories that a ‘typical’ low‐income, middle‐income or high‐income person is likely to have fared on average between two time periods. In practical terms, the difference between the two methods may be rather technical and negligible. For example, although Jenkins and Van Kerm (Reference Jenkins and Van Kerm2011) take into account the extent of income mobility in Britain between 1991 and 2005, their conclusion that income growth under the first Labour government was significantly more pro‐poor than in the other time periods remains the same with both the cross‐sectional and the panel approach.
In this paper, I take the additional step to limit the main analyses to working‐age adults (18—65 years). This should help alleviate the issue of income mobility as a potential confounder by removing income declines at the time of retirement, which are likely to be strongly driven by cross‐national variation in pension design. Finally, it is important to note that panel data, on top of validity issues due to panel attrition, are not available for the same number of countries and time periods as the LIS income data (see also Burgoon et al., Reference Burgoon, Noort, Rooduijn and Underhill2019, p. 61—62).
I estimate regression models of support for redistribution (measured as a binary variable, see above) with random effects for country‐waves and standard errors clustered at the country‐wave level.Footnote 7 This multilevel specification, where individuals are nested in country‐waves, is preferrable to an alternative model specification with country fixed effects in this case. The country fixed effects would completely absorb the differences in levels of stagnation across countries. But as we have seen in Figure 1, there is considerable cross‐country variation in stagnation levels and this variation is sometimes invariant across income groups and time. For example, lower income growth in Italy than in Ireland implies that over sustained periods of time, many Italian but few Irish individuals have been afflicted by income stagnation. A country fixed‐effects specification would absorb this important variation instead of allowing to test its explanatory power on redistributive preferences. More generally, I follow prior studies on redistributive preferences that have used random‐effects multilevel model specifications (e.g., Barth et al., Reference Barth, Finseraas and Moene2015; Finseraas, Reference Finseraas2009; Kevins et al., Reference Kevins, Horn, Jensen and Kersbergen2018; Schmidt‐Catran, Reference Schmidt‐Catran2016; VanHeuvelen, Reference VanHeuvelen2017). To ensure the robustness of the findings, however, I check a range of alternative specifications, including alternative random‐effects models and country‐wave fixed‐effects models, as well as models with a continuous coding of the dependent variable.
Apart from absolute and relative income growth, the models include respondent's current income decile, as well as a range of control variables. At the micro level, I control for age (in years), gender (1 = female, 0 = male), education (1 = tertiary education, 0 = non‐tertiary), and unemployment (1 = unemployed, 0 = other). At the macro level, I control for standard economic and institutional differences that could affect redistributive policy preferences and outcomes. These are national unemployment rates (source: AMECO), social expenditure in percentage of GDP (source: OECD), income inequality (Gini market income, source: SWIID), and GDP per capita (source: OECD). Finally, I add dummies for the year of each survey wave. Summary statistics are available in Supporting Information Appendix 1.
Findings
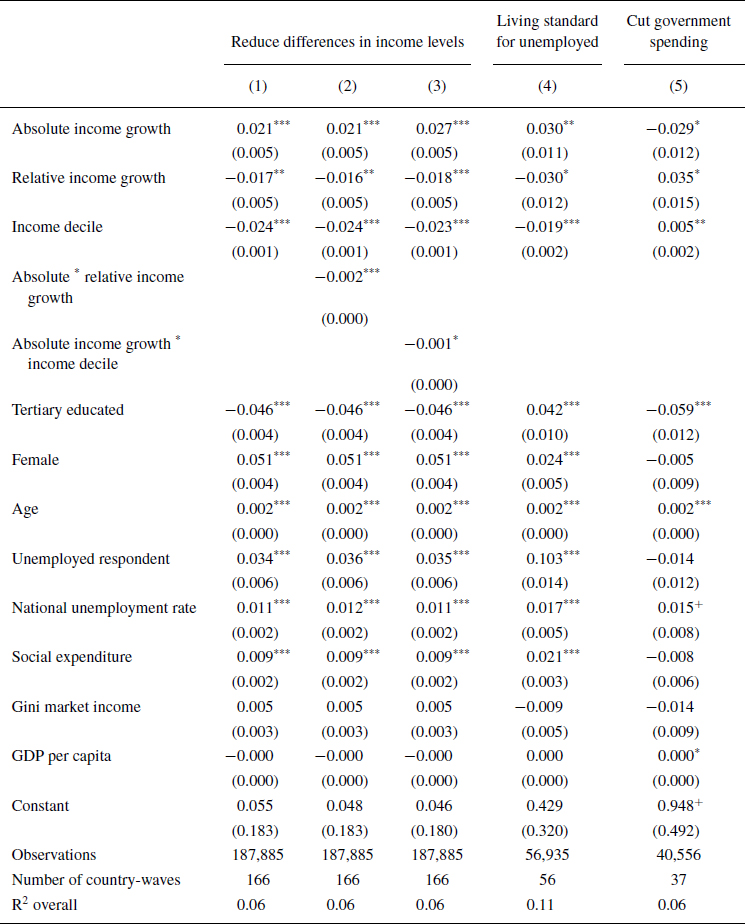
Table 1 presents the results from random‐effects regression models of preferences for redistribution among the working‐age population (results for the entire adult population and other robustness tests are discussed below). Model 1 estimates the baseline effects for absolute and relative income growth. Models 2 and 3 add interactions between absolute growth, relative growth and current income. Models 4 and 5 show the findings for two alternative dependent variables (support the unemployed and spending cuts) to explore the postulated mechanisms.
Regression models of support for redistributive welfare policies

Notes:
*** p < 0.001.
** p < 0.01.
* p < 0.05.
+ p < 0.1. Robust standard errors in parentheses. GLS regression of support for redistribution (1 = agree/strongly agree, 0 = else) with country‐wave random effects. Wave dummies included (not shown).
The main finding from the first model in Table 1 shows a differential effect between absolute and relative income growth. Absolute income growth is positively associated with support for redistribution (p < 0.001). In line with H2, respondents that experienced stagnating real incomes over a 5‐year period are likely to demand less redistribution. Respondents with growing incomes demand more redistribution. The substantive magnitude of this effect is non‐negligible. For each additional percentage point of absolute income growth, redistribution preferences increase by 2.1 percentage points. Where incomes grow by 3.3% a year (the 90th percentile) the predicted probability to support redistribution is 67.2 per cent, compared to only 61.7 per cent where incomes grow by 0.7% (median) and 57.7% where incomes decline by 1.2% (10th percentile).
Relative income growth, in contrast, is negatively associated with support for redistribution (p < 0.01). In line with H1 and the comparative political economy literature, respondents with lower income growth relative to the average demand more redistribution, and respondents with higher income growth demand less redistribution. These opposite effects of absolute and relative stagnation hold even as we control for current income – which is negatively related to support for redistribution – and other variables. The control variables show that support for redistribution is higher among lower‐income groups and non‐tertiary educated, female, older or unemployed respondents. At the country level, unemployment and social spending are positively associated with preferences, while income inequality and GDP per capita are not statistically significant.
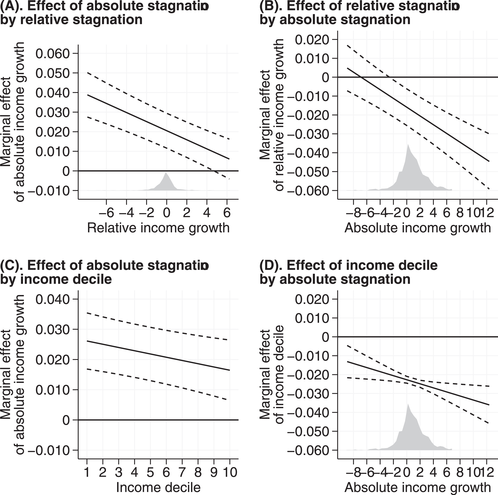
Model 2 in Table 1 tests the interaction between absolute and relative stagnation. The marginal effects are shown in Figure 2. Model 2 finds a negative, statistically significant interaction between absolute and relative income growth (in line with H3, p < 0.001). Panel A in Figure 2 shows that the marginal effect of absolute income growth is much stronger when respondents have low relative income growth. In other words, absolute income stagnation reduces support for redistribution more strongly when respondents lag behind in relative terms than when they are better off compared to other income groups. Conversely, panel B shows that the marginal effect of relative income growth is stronger under high absolute growth. Lagging behind in relative terms does not significantly increase support for redistribution if respondents have low absolute growth, but it does significantly increase support if respondents have high absolute growth. Taken together, the highest predicted support for redistribution (70 per cent) is obtained under high absolute and low relative growth (where ‘high’ and ‘low’ indicate the 90th and 10th percentiles, respectively), followed by high absolute/high relative growth (65 per cent), low absolute/low relative growth (59 per cent), and low absolute/high relative growth (57 per cent).
Conditional effects. Notes: Marginal effects based on Models 2 and 3 in Table 1, with 95% confidence intervals. Light‐grey areas in panels A and B denote kernel distribution of respondents.

Model 3 in Table 1 finds a statistically significant, but substantively weak, interaction between absolute income growth and current income. As panel C in Figure 2 shows, the effect of absolute stagnation does not vary much by income. The marginal effect of absolute stagnation is slightly stronger among low‐income respondents (in line with H4), but it is significant even for the top income groups (panel C). From the same interaction model, panel D shows the marginal effect of current income. At any value of absolute income growth, current income has a negative and statistically significant association with support for redistribution.
Returning to Table 1, Models 4 and 5 show that the association between absolute stagnation and two alternative dependent variables are statistically significant in the expected direction in both cases, despite a reduced sample size comprised only of ISSP waves. Model 4 finds that absolute stagnation reduces support for providing a decent living standard for the unemployed. This is in line with the sociotropic mechanism, which expects such support to increase when (shared) growth creates social affinity between groups. The second finding from Model 5 is that absolute stagnation increases willingness to cut government spending. This is more in line with the egotropic mechanism and can be seen as an alternative expression for the reduced willingness to provide public resources in case of stagnating real incomes.
Robustness checks
The key finding that absolute stagnation reduces support for redistribution is robust to several alternative specifications. Although it is theoretically important to consider both absolute and relative stagnation, their joint inclusion together with current income in the same model could lead to collinearity issues. However, Supporting Information Appendix 3 shows that omitting relative income growth (Model A3.1) or current income (A3.2) does not alter the statistically significant association between absolute income growth and support for redistribution. Other methodological robustness checks in Supporting Information Appendix 3 show that results are substantively similar with using random effects by country (A3.3) or by country‐wave‐decile (A3.4) instead of by country‐wave; using a continuous dependent variable (A3.5); using ordered logistic regression (A3.6); using a fixed‐effects model with country‐wave dummies (A3.7); or using pooled ordinary least squares (OLS) with clustered standard errors (A3.8). The interaction models with country‐wave fixed effects are also similar (A3.9).
In addition, Supporting Information Appendix 4 shows that results are similar for the total adult population (A4.1); distinguishing between bottom‐oriented or top‐oriented relative income growth (A4.2); using a 10‐year window for income growth estimates (A4.3); not including any macro‐level control variables (A4.4); using year dummies (A4.5) or 5‐year period dummies (A4.6) instead of wave dummies. They are also robust to using only ISSP survey waves (A4.7), only ESS waves (A4.8), controlling for subjective income in ESS waves (A4.9) and controlling for levels of redistribution (A4.10). Finally, the results are substantively similar for subset samples of both tertiary‐educated (A4.11) and non‐tertiary‐educated respondents (A4.12) and they hold across all groups of party supporters (Supporting Information Appendix 5). This indicates that the findings are not only the product of ideological beliefs and values that vary by education and partisanship.
Conclusion
Widespread income stagnation has led to concern that advanced democracies have failed to deliver ‘inclusive growth’ and to share the fruits of economic gains (OECD, 2018; Ostry et al., Reference Ostry, Loungani and Berg2019). This paper has used extensive survey data since 1985 to assess whether such stagnation has shaped redistributive policy preferences, arguing that a careful distinction between absolute and relative dimensions of stagnation is key to better understand voters’ policy preferences. My analysis confirms that relative stagnation is associated with higher support for redistribution (see also Burgoon, Reference Burgoon2019). However, I find that absolute stagnation is associated with lower support for redistribution. This important finding is somewhat surprising and counterintuitive to explain for comparative political economy theories. I have argued that absolute stagnation reduces demand for redistribution as voters become less able, or less willing, to afford welfare policies due to the stagnation in their material resources. This effect is especially pronounced if individuals simultaneously stagnate in relative terms. High‐income earners are still more likely to support redistribution than low‐income earners, but the dynamic effect of absolute stagnation applies similarly across all income groups.
These findings imply that it is primarily absolute stagnation, not relative stagnation, that may help explaining the puzzle why demand for redistribution increased in very few countries even though income inequality increased in many countries. That political support for redistributive policies depends on a certain extent of (absolute) economic prosperity does not come as a surprise to some classical theories of the welfare state. The argument by Wilensky (Reference Wilensky1975), for example, that welfare states depend on economic growth is often dismissed as functionalist and apolitical (Esping‐Andersen, Reference Esping‐Andersen1990). But actually, there is a convincing political logic in the behaviour of individuals to demand more welfare policies when their own economic circumstances improve and less such policies when their circumstances stagnate (or decline) and concerns about affording to pay for welfare policies are likely to take over. The same logic is also well‐established in public opinion literature showing that policy mood moves leftward as economic conditions improve (Durr, Reference Durr1993; Stevenson, Reference Stevenson2001). Future research, however, should validate these arguments under which economic circumstances redistribution really is a luxury good using different items that directly ask about willingness to pay taxes and perceptions about affordability – ideally, using longitudinal or panel data.
The framework distinguishing between absolute and relative economic experiences has broader implications for research in comparative politics. Recent studies on electoral shifts, in particular on the rise of radical right parties, emphasise the importance of relative dynamics – in terms of not only income deprivation (Burgoon et al., Reference Burgoon, Noort, Rooduijn and Underhill2019) but also relative declines of perceived social status (Gidron & Hall, Reference Gidron and Hall2017; Kurer, Reference Kurer2020). This consensus on the superiority of relative experiences for contemporary electoral outcomes is somewhat puzzling. Radical right parties do not have clearly redistributive or pro‐welfare platforms (Busemeyer et al., Reference Busemeyer, Rathgeb and Sahm2021; Rovny, Reference Rovny2013) and they do not draw support from the relatively most deprived voters (Engler & Weisstanner, Reference Engler and Weisstanner2021). Therefore, explanations of relative deprivation and ‘left behind’ groups should at least be complemented by absolute dynamics such as experiencing income stagnation.
Whether the links between absolute and relative stagnation and policy preferences matter for broader political outcomes, though, is another open question beyond the scope of this study. It depends first on whether voters translate their redistributive preferences into actual vote choices for political parties. Recent evidence suggests that they (still) do (Abou‐Chadi & Hix, Reference Abou‐Chadi and Hix2021). But it is also likely that absolute and relative stagnation carry implications for policy preferences and behaviour beyond the economic left‐right dimension of political conflict. Future research should explore whether some combinations of absolute and relative stagnation affect electoral outcomes on top of, and independent of, redistributive preferences.
Acknowledgments
I am grateful to Klaus Armingeon, Sarah Engler, Carsten Jensen, Thomas Kurer, Brian Nolan, David Rueda, Wouter Schakel, Isabelle Stadelmann‐Steffen, Tim Vlandas, Delia Zollinger, and participants at the 2019 ECPR General Conference (Wrocław), the 2020 SPSA Conference (Lucerne) and the Comparative Politics & Political Economy seminar (Konstanz) for valuable comments. A previous draft is available as LIS Working Paper No. 782.
Online Appendix
Additional supporting information may be found in the Online Appendix section at the end of the article:
Appendix 1: Sample details and descriptive statistics
Appendix 2: Absolute and relative income growth for the total adult population
Appendix 3: Methodological robustness tests
Figure A3.9: Conditional effects with country‐wave fixed effects
Appendix 4: Substantive robustness tests
Appendix 5: Effect of stagnation by partisanship
Table A5: Regression models of support for redistribution
Figure A5: Marginal effect of absolute stagnation by partisanship


 Open access