


Introduction
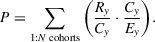
Recent opinion polls in the United Kingdom suggest that there has been a considerable shift in public opinion against Brexit compared to the 52 per cent to 48 per cent vote to leave the EU in the June 2016 referendum. For example, Figure 1 shows responses in a weekly YouGov survey since the referendum, in which they asked a representative sample of the public (via their online panel) whether they thought the decision to leave the European Union (EU) was “Right” or “Wrong”. In early August 2016, about 5 weeks after the referendum, 46 per cent of respondents said that Britain was right to leave while 42 per cent thought the decision was wrong. By August 2023, in contrast, 56 per cent said Brexit was wrong while only 32 per cent said it was right.
Changing public opinion on Brexit.

At face value, these numbers suggest that almost one‐third of people who voted to Leave the EU in 2016 have changed their minds. However, it is not possible to draw this inference from these aggregate numbers. While it seems plausible that many individuals have become more Brexit‐critical over time, the depicted dynamics can also be affected by changes to the composition of the electorate. To give an illustrative mock example: if a thousand Brits who support Brexit would die, the net approval for Brexit in the United Kingdom would shrink without anyone changing their mind on the matter. To account for this, we use individual‐level data to decompose how much of the change in Brexit attitudes is due to people changing their minds and how much is due to such compositional changes.
There are reasons to expect that compositional changes affect long‐term Brexit approval. In the June 2016 referendum, there was a steep age gradient in the vote: older citizens were more likely to vote to Leave the EU, while younger citizens were more likely to vote to Remain. While it is impossible to pinpoint all the exact reasons behind this divide, some research has explained parts of the age gradient with more pro‐European attitudes among younger voters (Eichengreen et al., Reference Eichengreen, Maria Mari and Thwaites2021) and lower education combined with increased concerns about globalization and multiculturalism among older voters (Hobolt, Reference Hobolt2016). In the 8 years since the referendum, some older voters (who presumably continued to be more likely to support Brexit) have passed away, while new generations of younger voters (who presumably are more likely to be opposed to Brexit) have entered the electorate.
In this research note, we present evidence that, other than just individuals changing their minds, a significant proportion of the decline in support for Brexit at the aggregate level is due to demographic changes in the electorate. To do this, we use a series of four original YouGov polls from 2016, 2018, 2020 and 2022, each representative of the UK electorate at the time. We enriched the data, which is part of YouGov's periodic Brexit tracker poll, by purchasing additional access to a battery of socio‐demographic and political questions asked of more than 1600 respondents at each time point, for a total of more than 6600 valid responses. The lists of the most relevant questions and response scales are reported in the online Appendices A1 and A2. With this comprehensive 6‐year dataset, we uncover significant differences in Brexit support between older and younger cohorts, with the oldest cohorts staying the most supportive of Brexit and the youngest cohorts becoming even more anti‐Brexit over time, from an already more critical baseline. The generational gap in Brexit support is thus not closing over time.
With demographic decomposition calculations, we show that between 2016 and 2022 – the period in which most of the change in attitudes occurred – roughly a third of the overall decrease in support for Brexit can be attributed to younger cohorts replacing older cohorts in the electorate. Based on our findings and an official dataset of Office for National Statistics' (ONS) projections of the UK age structure until 2030, we derive a series of testable hypotheses about the pressure that cohort replacement will continue to put on support for Brexit over the next decade.
Our findings suggest that cohort replacement alone will be a major factor in determining the future relationship between Britain and the EU. The dwindling popularity of Brexit does not rely on within‐cohort attitudinal changes (although those are also at play), as cohort replacement by itself has a strong enough effect to turn public opinion in the aggregate.
Cohort replacement and long‐term support for Brexit
The Brexit referendum is just one of many cases where direct democracy has been used to determine a country's relationship with the EU. Forty‐three such referendums had been held before 2016 (Qvortrup, Reference Qvortrup2016). While support for direct democracy has been increasing in recent decades (LeDuc, Reference LeDuc2003), that trend has been reversed since Brexit, with people across Europe becoming more critical of referendums (Rojon & Rijken, Reference Rojon and Rijken2021; Steiner & Landwehr, Reference Steiner and Landwehr2023).
Populist attitudes are one of the strongest predictors of support for direct democracy, with populist citizens often believing that only referendums allow for a true translation of the ‘will of the people’ into policy (Jacobs et al., Reference Jacobs, Akkerman and Zaslove2018; Werner & Jacobs, Reference Werner and Jacobs2022). Furthermore, people tend to be more supportive of referendums that are likely to be beneficial to them (Harms & Landwehr, Reference Harms and Landwehr2020) and that they expect to win (Werner, Reference Werner2020). Political campaigns can increase interest in referendums, and referendum results are often a function of support for the initiating party (Franklin et al., Reference Franklin, Eijk and Marsh1995) as well as the time, effort and money spent in the pre‐referendum campaign (Hobolt, Reference Hobolt2009).
Keeping these findings in mind, the Brexit result seems almost likely in hindsightFootnote 1: the Conservative Party was popular at the time (Cracknell et al., Reference Cracknell, Uberoi and Burton2023), their voters were on average populist and anti‐EU (Webb & Bale, Reference Webb and Bale2014), and the Leave campaign spent more money on advertising than the Remain campaign (Statista, 2023). In addition, older voters, who are known to vote at higher proportions than younger voters (Kimberlee, Reference Kimberlee2002), were overwhelmingly in favour of leaving the EU (Hobolt, Reference Hobolt2016).
None of those factors were set in stone, though, which led to a debate about a possible second referendum (Brooks, Reference Brooks2019; Eriksen, Reference Eriksen2018; Welfens, Reference Welfens2017). With support for the Conservative Party declining (Paleckis, Reference Paleckis2023; YouGov, 2023) and older voters being replaced by younger ones (Lutz, Reference Lutz2013), some analysts suggested that a tipping point could emerge where reconsideration of Brexit and discussions about rejoining the EU might gain momentum (Bellamy, Reference Bellamy2019). Government satisfaction and public sentiment are volatile; however, and a second referendum would lack legitimacy if it was based on a short‐lived political momentum. The cohort gradient in Brexit support, on the other hand, is a factor that is steadily and continuously moving the electorate against the Brexit vote. It is a fact of life that older generations die out, while younger generations acquire voting rights. If this dynamic alone accounts for a large enough portion of the anti‐Brexit trend, growing support for rejoining, or at least support for a closer relationship between the United Kingdom and the EU than the one established by the Brexit trade agreement, might be difficult to resist.
The analysis of generational differences and their cultural dynamics over citizens' life courses has a long history in sociology and demography (Mason et al., Reference Mason, Mason, Winsborough and Poole1973; Ryder, Reference Ryder1965; Yang & Land, Reference Yang and Land2013). Some research has found that personal values, beliefs and attitudes are remarkably stable over the life course (Kiley & Vaisey, Reference Kiley and Vaisey2020; Vaisey & Kiley, Reference Vaisey and Kiley2021; however, Lersch, Reference Lersch2023). To the extent that this is the case, aggregate‐level societal change will be driven by a ‘demographic metabolism’ of cohort replacement (Hooghe, Reference Hooghe2004; Lutz, Reference Lutz2013). More recently, political scientists have also begun to model generational differences in political attitudes (van der Brug & Kritzinger, Reference Brug and Kritzinger2012; Walczak et al., Reference Walczak, Brug and Vries2012). Differences in electoral support across the generational divide have been demonstrated in the Netherlands (van der Brug & Rekker, Reference Brug and Rekker2021) and Germany (Steiner, Reference Steiner2023), with cohort replacement playing a non‐negligible role in aggregate voting behaviour in both cases. Also, relevant for our study, aggregate change in holding a European identity is a strongly cohort‐driven process (Lutz et al., Reference Lutz, Kritzinger and Skirbekk2006).
The role of cohort replacement in referendums has not seen much attention yet. However, if there is a steep cohort gradient in a referendum – with a large generational gap in public opinion that does not shrink over time – the outcome of the referendum could quickly lose popular legitimacy after the older generations have achieved their goals.
Data
To analyse the effects of cohort replacement on Brexit support, we acquired the individual‐level data from four YouGov surveys in the Autumns of 2016, 2018, 2020 and 2022. Each sample is representative of the UK electorate and contains more than 1600 valid responses (total N = 6664). Next to questions about Brexit support (vote choice in the referendum and current support for Brexit), each survey also includes a rich complementary battery of demographic questions (such as age, gender, education and social class) and questions on voting behaviour in general elections. The data provided by YouGov includes a survey weight for each respondent. These weights ensure that biases arising from the potential over‐ or undersampling of certain segments of the population are minimized, and the sample represents the entirety of the British electorate. The question wording and response scales of the relevant items are included in the online Appendices A1/A2. We enrich these data with yearly population statistics provided by the ONSFootnote 2 to validate the representativeness of the cohort structures and to model hypothetical future Brexit support based on ONS cohort projections up to 2030.
How cohort replacement decreases support for Brexit
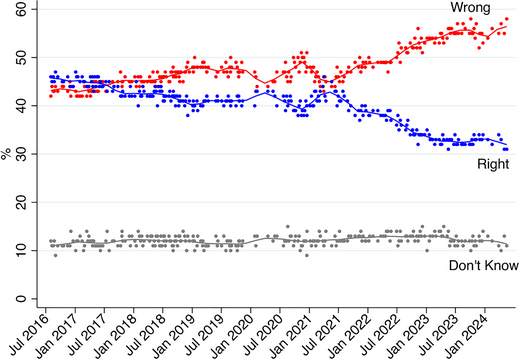
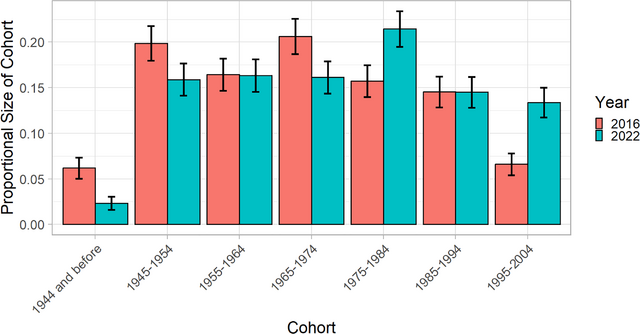
Visualizing the YouGov data in cohort splits in Figure 2, we first show how different 10‐year birth cohorts have answered the ‘Brexit: Right or Wrong?’ question in four waves in the Autumns of 2016, 2018, 2020 and 2022. The responses are weighted by YouGov population weights to ensure that the sample is representative of the UK electorate. Regarding the cohort gradient in Brexit support, the data paint a clear picture: older cohorts are on average far more supportive of Brexit than younger ones. The difference in the proportion of people saying that Brexit was Right is over 40 percentage points between the oldest and the youngest cohort in 2016 and over 50 percentage points between them in 2022. In Online Appendix A3, we show that this cohort gradient in Brexit support persists across a wide range of other divides, including education, social class, gender and partisanship.
Proportions of birth cohorts saying Brexit was Right/Wrong.

In most cohorts, we observe relative stability in Brexit support. Some of the youngest cohorts, however, become more critical over time while some of the oldest cohorts become more supportive. This is clearest in the youngest two cohorts, born after 1985 (but also among those born in 1965–1974), where fewer respondents thought that Brexit was Right and more thought it was Wrong over time. The oldest two cohorts, born before 1954, continued to support Brexit in 2022, as they did right after the referendum (and even slightly more in the case of the oldest cohort).
Furthermore, we can see that within‐cohort changes in Brexit support are non‐monotonic. Some cohorts that become more opposed to Brexit over time experience small trend reversals between 2‐year periods (e.g., the 1955–1964 cohort became more pro‐Brexit from 2018 to 2020 but experienced an anti‐Brexit trend across the entire 6‐year timeframe). While part of this non‐monotonicity might simply be caused by a random error, we argue that due to our large representative samples, such random error likely plays a negligible role. Rather, such trend reversals are likely to reflect genuine within‐cohort opinion changes. We account for such non‐monotonicity in our following analyses by modelling the data in 2‐year splits instead of assuming a linear trend over 6 years.
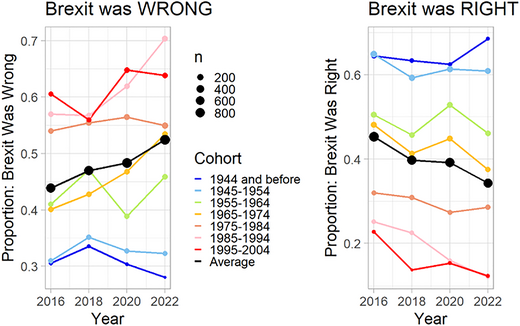
In Table 1 (and plotted in Online Appendix A6), we report linear probability models regressing binary Brexit support on the age of respondents, the year of the interview and the interaction between those two variables. Coefficients can be interpreted as proportional changes in Brexit support associated with the respective categorical comparisons or unit changes of the predictor variables:
 $$\begin{equation} {Y} = \beta _{0} + \beta _{1}Age + \beta _{2}Year + \beta _{3}Age*Year + e. \end{equation}$$
The gap in Brexit support between young and old voters and its growth over time

Note: Controls include gender, education, vote choice and social class.
*p $<\nobreakspace $0.1; **p $<\nobreakspace $0.05; ***p $<$ 0.01.
Models 1 and 2 show that Brexit support is significantly higher among older voters (columns 1 and 2) and that this significant generational gap persists even when controlling for various relevant respondent characteristics, including their gender, education, vote choice and social class. Models 3 and 4 show that the gap in Brexit support between younger and older voters is not shrinking over time (columns 3 and 4). In fact, the model without control variables produces a positive and statistically significant interaction effect between later periods and age, meaning that the gap is actually growing over time. However, when controlling for the respondents' gender, education, vote choice, and social class, the effect disappears, meaning that there is no detectable growth or shrinkage over time in the age‐based gap in Brexit support.Footnote 3 This situation, with a large generational gap in Brexit support that is not decreasing over time and that is independent of other political and socio‐demographic attributes, leads us to expect a substantial negative effect of cohort replacement on aggregate‐level Brexit support. Figure 3 shows descriptively that cohort replacement is happening, with a significant decline of the two oldest cohorts and a significant growth of the youngest cohort.
Proportion of respondents by birth cohort in YouGov polls in 2016 and 2022.
Note: The error bars for the YouGov proportions are 95 per cent confidence intervals.

We next estimate how much of the aggregate swing in public attitudes against Brexit is due to this cohort replacement (with older cohorts who supported Leave passing away and younger cohorts supporting Remain joining the electorate) as opposed to people changing their minds. To get a point estimate of how much change in opinions toward Brexit is due to cohort replacement as opposed to changes in opinion within cohorts, we apply a demographic decomposition (Das Gupta, Reference Das Gupta1993; Preston et al., Reference Preston, Heuveline and Guillot2001) to the change from 2016 to 2022 in the shares of respondents who told YouGov that Brexit was either Right or Wrong. The aggregate change in opinion is decomposed into the rate effect and the composition effect. The rate effect is an estimate of the aggregate change resulting from cohorts changing their minds over time and captures any reactions to current events but also random noise in attitudinal measurements over time. The composition effect estimates the aggregate change due to shifting shares of birth cohorts that differ in their views over Brexit (voter replacement). More precisely, we apply a decomposition with four populations (YouGov samples) following Das Gupta (1993, p. 99):
 $$\begin{equation} \alpha _{jk.lm} = \alpha _{jk} - \frac{2\alpha _{jk}+\alpha _{kl}+\alpha _{km}-\alpha _{jl}-\alpha _{jm}}{{{4}}}. \end{equation}$$
 Here, $\alpha$ refers to the (rate or composition) effect between two YouGov waves, with the subscripts referring to the different waves. On the right‐hand side of the equation, the $\alpha^{\prime}{\rm s}$ refer to the (rate or composition) effects between each wave. The rate effects between two waves (here, j to k) are calculated as the difference in Brexit responses when keeping the cohort structure constant (at the mean of the two waves); the composition effects are calculated by allowing the cohort structure to change but keeping the cohort‐specific response patterns constant (at their means) (Das Gupta, Reference Das Gupta1993, p. 6; Preston et al., Reference Preston, Heuveline and Guillot2001, pp. 21–30).Footnote 4 The four population decomposition is thus a function of the decompositions between pairs of waves and has the benefit of being exact: the rate and composition effects from 2016 to 2018, from 2018 to 2020, and from 2020 to 2022 sum up exactly to respective effects from 2016 to 2022. Furthermore, unlike a two population decomposition with lumped samples, the four population decomposition accounts for the non‐monotonicity in within‐cohort changes over the 6‐year timespan. It also allows for non‐linear time trends, which we do indeed capture, as discussed below.
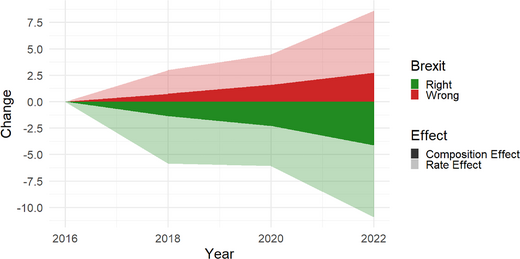
With this exercise, we estimate that roughly a third of the aggregate change in opinions on Brexit between 2016 and 2022 is due to voter replacement. Figure 4, a visual representation of the decomposition results, shows how many percentage points of change from 2016 to 2022 are due to the voter replacement (the composition effects) and how many are due to changes in opinion within cohorts over time. As can be seen, voter replacement accounts for 2.7 percentage points (32 per cent) of the increase in opposition to Brexit and 4.1 percentage points (38 per cent) of the decrease in support for Brexit. These are conservative estimates, considering that the overall decline in Brexit support in our data is slightly lower than in the public YouGov polls shown in Figure 1. Rate effects on the other hand, which encompass all within‐cohort changes over time, account for 5.9 percentage points (68 per cent) of the increase in opposition to Brexit and 6.8 percentage points (62 per cent) of the decrease in support for Brexit.
Changes in Brexit attitudes relative to 2016: The roles of cohort replacement (dark colours) and changes in opinion (light colours).

Thus, while within‐cohort changes still account for the larger share of aggregate opinion changes, roughly a third of the increasing share of Brexit opposition can be attributed to young, anti‐Brexit people joining the electorate, while a third of the decreasing share of Brexit support can be attributed to old, pro‐Brexit people dying. As one would expect, the composition effect follows a linear trend over timeFootnote 5 while the temporal patterns of the rate effect are unpredictable and non‐linear.Footnote 6 However, when looking at the change from 2020 to 2022, the share of the composition effect actually increases beyond the linear trend for declining Brexit support but not for increasing Brexit opposition. While we cannot identify causality, this acceleration could be related to excess mortality due to Covid‐19, where more pro‐Brexit older voters died than would have been expected. Future research, utilizing more appropriate data, may want to delve deeper into the relationship between excess mortality and Brexit support.
Although the exact shares of declining support and increasing opposition attributed to voter replacement depend on which years are compared as well as on the granularity of the birth cohorts used, our estimates remain robust across various specifications, with differences between results from more fine‐grained and more broadly defined cohorts being marginal. All results from the decompositions point to the importance of demographic metabolism (Lutz, Reference Lutz2013), where old cohorts are replaced with new ones. Considering how much the average view has changed, it is remarkable that demography has played such a major role in this shifting opinion in such a short space of time. The reason, of course, has to do with the large cohort differences in the Brexit referendum initially.
This persistent effect of cohort replacement on Brexit attitudes might also have important implications for the long‐term popular legitimacy of the Brexit referendum. The youngest cohorts, who were not able to participate in the referendum, will continue to steadily join the electorate with anti‐Brexit attitudes being strongest in this group. At the same time, larger proportions of the oldest cohorts will eventually pass away and thus the most pro‐Brexit generations will have less representation in the electorate over time.
Testable hypotheses about the future of Brexit support
To theorize how cohort replacement might influence Brexit attitudes in the absence of within‐cohort opinion shocks in the near future, we visualize several hypothetical scenarios of aggregate Brexit attitudes based on a range of empirical within‐cohort attitudinal benchmarks and official ONS cohort projections.
For these hypothetical projections, we combine our polling data with yearly demographic projection data from ONS ranging from 2020 to 2030. For 2020 and 2022, we first contrast the YouGov polls with the official ONS statistics to evaluate the representativeness of our data. In Online Appendix A4, we show that the differences between the YouGov and the ONS samples are insignificant and negligible, giving confidence in the representative cohort structure of the YouGov data. For 2023 to 2030, we estimate hypothetical Brexit attitudes at the aggregate level by using a range of different within‐cohort attitudinal benchmarks from 2016 to 2022 and summing them up according to the ONS‐predicted cohort structure. Precisely, for the attitudinal benchmarks, the aggregate proportion of people responding that Brexit was Wrong/Right is calculated by the product of the proportion of people in a given cohort responding that Brexit was Wrong/Right and the proportional size of the cohort in relation to the entire electorate, summed up across all cohorts, as documented in Equation (3) ‐ ‐ where R represents the number of people in a given cohort giving a certain response, C represents the overall number of people in a given cohort and E represents the number of people in the entire electorate, all based on YouGov data, represented by the subscript y:
 $$\begin{equation} P = \sum _{1:N \text{ cohorts}} {\left(\frac{R_y}{C_y} \cdot \frac{C_y}{E_y} \right)}. \end{equation}$$
For the hypothesized projections, then, only the last part of this equation is changed, with the proportional size of the entire cohort in relation to all the other cohorts now based on official population projections for 2023 to 2030 by ONS (subscript o), as documented in Equation (4):
 $$\begin{equation} P = \sum _{1:N \text{ cohorts}} {\left(\frac{R_y}{C_y} \cdot \frac{C_o}{E_o}. \right)} \end{equation}$$
When interpreting the hypothetical projections in Figure 5, one has to keep in mind that they are not accompanied by confidence intervals in the traditional sense because there are two factors of uncertainty in the estimates displayed, only one of which can be accounted for: uncertainty about the true within‐cohort attitudes (which we account for), and uncertainty about the true between‐cohort proportions (which cannot be accounted for). As the ONS cohort projection data do not include measures of uncertainty, we cannot estimate confidence intervals for our projections. Rather, we account for uncertainty about within‐cohort attitudes by deriving hypotheses based on multiple empirical benchmarks, ranging from more than 45 per cent Brexit support to less than 35 per cent Brexit support. ONS projections are assumed to be accurate. Since there is uncertainty in the estimates that cannot be accounted for, it is important to reiterate that these projections should be regarded as hypotheses, that will be testable as time passes, rather than as deterministic predictions.
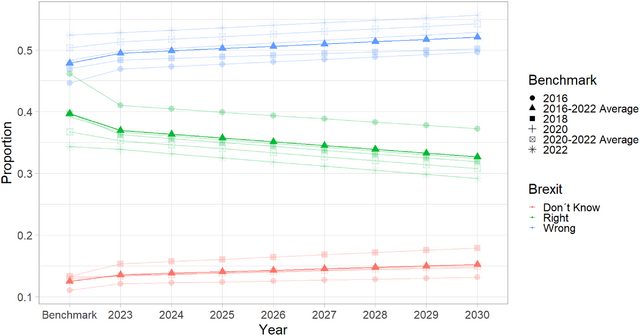
Hypothesized changes in Brexit attitudes based on cohort replacement.

As shown in Figure 5, even in the absence of a decline in Brexit support at the within‐cohort level, cohort replacement predicts a substantial decrease in aggregated support for Brexit across six different empirical benchmarks. For example, in the benchmark sample that averages public opinion from 2016 to 2022 (which has the brightest colors in the plot), roughly 40 per cent of respondents say that Brexit was Right and roughly 48 per cent say that it was Wrong. In the corresponding projection for 2030, created with the average cohort‐specific responses from the four YouGov polls and ONS cohort projections for 2030, only roughly 33 per cent say Brexit was Right and roughly 52 per cent say it was Wrong.
These trends are similar across all six benchmarks. Even if we base hypotheses on the most conservative benchmark, within‐cohort Brexit support levels from 2016, Brexit support is hypothesized to fall below 40 per cent and opposition will rise to almost 50 per cent by 2030 due to cohort replacement. This suggests that cohort replacement is going to continue to decrease Brexit support across a range of scenarios unless within‐cohort Brexit support sees a substantial increaseFootnote 7 even beyond the original support levels from 2016. Such an individual‐level increase in Brexit support is not indicated by any of the trends since 2016 but of course cannot be ruled out as within‐cohort attitudes could always be influenced by political and economic shocks. For example, if economic conditions improve in the United Kingdom (relative to the EU) and (young) people ascribe such positive developments to Brexit, the assumptions underpinning these projections would not hold. If these conservative hypotheses fail to be confirmed by the end of the 2020s, then we will have overestimated the role that cohort replacement plays in shaping attitudes towards UK–EU relations.
Conclusion
The British public appears to be turning against Brexit, or at least turning against how Brexit has worked out since the 2016 referendum. Nevertheless, as a result of the large birth cohort differences in support for Brexit in the referendum and over time, within‐cohort opinion changes are not the only phenomenon driving this change. Older birth cohorts, who remain overwhelmingly supportive of Brexit, are gradually being replaced in the electorate by younger cohorts, who are overwhelmingly and increasingly opposed. The generational gap in Brexit support is related to differences in educational and social status between older and younger voters, but it cannot be explained away by these factors, as we demonstrate descriptively and in a series of regression analyses.
According to our representative data, both the generational gap in Brexit support and the replacement of old pro‐Brexit voters with young anti‐Brexit voters are statistically significant. We quantify the impact of these two phenomena on Brexit support in a point estimate from demographic decompositions: cohort replacement accounts for roughly one third of the decline in Brexit support over 6 years, while the remaining two thirds are explained by within‐cohort changes.
These findings have two main implications. First, in the specific case of Brexit, there is likely to be growing public pressure in the United Kingdom to change the status quo, for example, by seeking a closer relationship with the EU than agreed in the initial exit trade agreement. Even in the absence of further anti‐Brexit trends at the individual level, the already large majority of anti‐Brexit voices continues to grow proportionally.
Second, more generally, the case of Brexit shows that referendums with major policy and political consequences can quickly lack broad public support if the winners of the vote are much older on average than the losers. While older voters can implement their preferred policy changes, these cannot be expected to be backed by a majority of voters a few years down the line, unless there is a significant pro‐referendum life course dynamic.
However, our findings need to be understood in the context of the interplay between rate effects and composition effects. While cohort replacement has been a substantial factor in Brexit opinion dynamics, two thirds of changes in Brexit attitudes are still explained by people changing their minds. Any of the hypothesized dynamics are contingent on younger (and middle‐aged) generations remaining somewhat opposed to Brexit. If some unpredictable events would unfold in the near future that would cause younger people to become much more favourable towards Brexit, cohort replacement would no longer lead to anti‐Brexit shifts. If Brexit supporters were to be replaced with other Brexit supporters, public opinion would be at a standstill.
Acknowledgements
The research was supported by the Research Council of Norway, through the Stein Rokkan Chair at the European University Institute.
Open access publishing facilitated by European University Institute, as part of the Wiley ‐ CRUI‐CARE agreement.
Conflicts of interest statement
The author(s) declare no conflicts of interest.
Data availability statement
The replication files for this project are publicly available on the EJPR website.
Online Appendix
Additional supporting information may be found in the Online Appendix section at the end of the article:
Online Appendix
Data S1


 Open access