1. INTRODUCTION
Synthetic Aperture Radar (SAR) images have provided a potential contribution for measuring various oceanic phenomena such as estimation of the wavelengths and directions, as well as wave heights under several meteorological conditions. An ocean SAR image consists of fine resolution images with some rough signatures of oceanographic phenomena such as waves, currents and internal waves. (Vachon and Raney, Reference Vachon and Raney1991; Kim, Reference Kim2009).
The linear system approaches to the SAR imaging mechanism (Alpers, Reference Alpers1983) provide a basis for a procedure to estimate wave height spectra from SAR intensity images. The effectiveness of a linear system approach to SAR wave imaging can be explored through numerical simulation study. SAR ocean wave simulations begin with the input of ocean spectrum in order to estimate height topography, use of models based on the backscattered signals as the function of wave height which includes the mapping of intensity levels depending on the flow of wind over an ocean (Ouchi and Burridge, Reference Ouchi and Burridge1994).
Retrieval of the ocean wave parameters depends on various consequent factors such as incidence angle, polarizations, wind speed and sea state conditions, and also on SAR imaging mechanisms. The Normalized Radar Cross Section (NRCS) for the case of flat sea surface shows negative value of more than –10 dB (Hasselmann and Hasselmann, Reference Hasselmann and Hasselmann1991; Hasselmann et al., Reference Hasselmann, Bruuning, Hasselmann and Heimbach1996). An analytic expression for the non-linear ocean-to-SAR spectral transform (Krogstad, Reference Krogstad1992) describes the SAR image spectrum as a function of ocean wave fields. It shows the relation for ocean wave spectrum derived from SAR signal spectrum. The SAR image spectrum was also obtained through the Modulation Transfer Function (MTF) which produces accurate estimates of slope and height-variance spectra (Frank and David, Reference Frank and David1986).
Numerous models have been proposed to retrieve the wave parameters, either in deep sea or coastal waters using various analytical expressions. Polarimetric analysis (Ouchi and Yang, Reference Ouchi and Yang2010; Shiroto and Ouchi, Reference Shiroto and Ouchi2010) is also one way to estimate wave heights. This uses polarimetric ratio of radar cross section for HH- and VV- polarization images for the purpose of estimating the wave slopes by means of pixel based analysis. Co-polarization (HH/VV) image data are less affected by wind and sea states and they show better response for wave parameter estimation as compared to the cross-polarization (HV/VH) image data (Vachon et al., Reference Vachon, Krogstad and Peterson1994).
Poor SAR images with low Signal-To-Noise Ratio (SNR) are extremely difficult to analyse and obtain wave parameters from. The selection of sample size (M × N pixels) of SAR images is the critical task. Computation time increases value for the large datasets (Kuo et al., 1999). Sea surface back scattering (Valenzuela, Reference Valenzuela1978) response by sensors is more dominantly affected by surface scattering phenomena between the interactions of electromagnetic and sea surface waves.
The detection of wave properties using SAR data can be useful in various oceanographic and maritime applications such as detection of the ships direction, current direction estimation.
In this paper we will introduce a simple technique to correlate SAR-derived wavelengths using Fast Fourier Transform (FFT) with the implementation of the dispersion relation to investigate wave slopes and heights for different water wave conditions. Analysis is to be carried out over 16 subset areas extracted from SAR imagery which shows the appearance of waves observed by SAR near to the coast of Chukk Island, Micronesia. Apart from the previously developed models, this method proposes the correlation between SAR image properties and the wave hydrodynamics.
2. EXPERIMENTAL DATA AND METHODOLOGY
2.1. Experimental Data
The ocean wave measurement was carried out by means of a satellite based RADARSAT-2 SAR sensor which operates in the C-band (5·4 GHz) of the electromagnetic spectrum. SAR signals are more affected by variation in meteorological conditions such as sea state, wind speed, and direction etc. The higher the wind speed, the rougher the sea surfaces will be; in particular, rough signatures appear in the SAR image due to signal smearing effect.
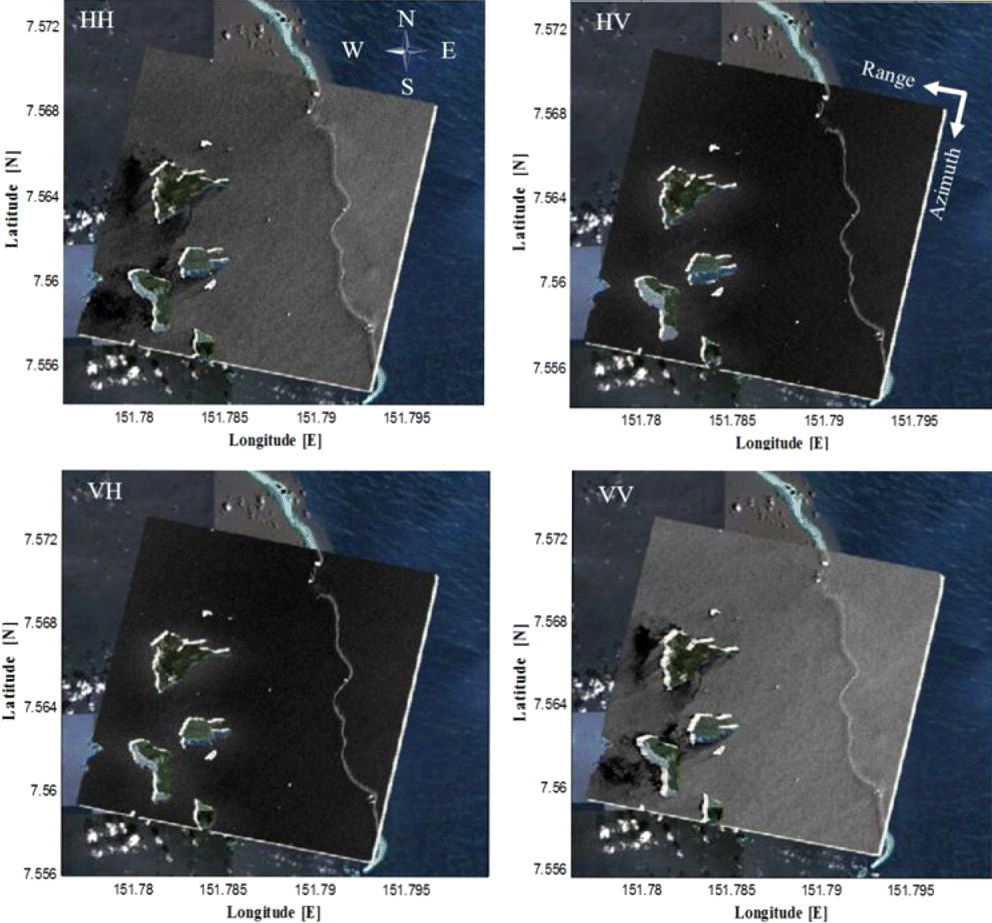
Figure 1 shows the Fine quad–polarization (HH, HV, VH and VV) data acquired on 4 November 2010 at 19:40:21·60 Universal Coordinated Time (UTC) in descending orbit pass, and are mapped with their relative earth's Ground Control Points (GCP) for the research site (7·74N, 151·92E), coast of Chukk Island, Micronesia and overlaid onto the optical image.
RADARSAT–2 (Fine quad polarization mode) datasets acquired over the coast of Chukk, Micronesia on 4 November 2010 and overlaid onto the optical image with the selected GCPs over the Earth's coordinate system.

Table 1 gives the general specification of SAR image data which consists of the SAR parameters such as: the mode of operation, radar frequency, incidence angle, azimuth and range pixel spacing etc.
Specification of SAR data used in this study

The left hand side of Figure 2 represents SAR image (HH-polarization) data used for this study; C-band SAR images are less affected by severe meteorological conditions in HH-polarization. From SAR imagery, a single image frame of size 1024 × 1024 pixels is to be extracted, which consists of group of different subset areas. The red square box over the image represents the region of spherical wave pattern due to the opening of coral reefs as well as of breakwater regions.
SAR image for HH–polarization (left). Red square box represents the region of spherical wave signature and wave propagation signatures can easily be observed as shown in the right panel.16 different regions (A-to-P), equally spaced (256 × 256 pixels), represents the regions of interest for the estimation of wave parameters.

The right hand side of Figure 2 represents the enlarged view of the red square frame and we divided this frame into 16 different subset areas (A-to-P) (256 × 256 pixels) as shown with black square boxes. These areas are extracted to perform FFT analysis in order to estimate the dominant wavelengths which will be used to estimate respective wave heights for each subset area. The spherical wave signatures can easily be observed in the frame which propagates from area D to M.
A depth navigational chart is illustrated in Figure 3. The chart shows clearly the depth contour lines. It provides approximate average water depths for each subset area as shown with the dotted black square boxes which are mapped the same as the subset area represented over Figure 2 (right). These subset areas belong to either intermediate or deep waters. In particular, for deep waters, wave energies dissipate only by breaking, therefore changes occurs in their respective wave heights and lengths due to presence of an obstacle (which causes diffraction and interference between the waves) as shown at the middle part of the chart, but they are invisible in SAR image.
Depth distribution from the navigational chart for the same region as selected in Fig. 2 (right). Each grid shows the depths for the 16 sub-images.

Under certain idealized conditions, wave heights are determined by the wind, the distance to the coastline, and the time since the wind started to blow over the sea surface. Table 2 tabulates the meteorological data observations which represent moderate wind conditions and calm sea state; it shows the wind speed of 2·45 m/s at the time the image acquisition, with direction of wind from East-to-North East. This data was obtained from meteorological laboratory, Chukk Island, Micronesia at the same time as the image acquisition.
Metrological observation data for wind speed and direction on the same date as of the image acquisition obtained from metrological laboratory Chukk Island, Micronesia

2.2. Methodology
Figure 4 represents the block diagram for wave height estimation especially in spherical wave conditions. First, 16 subset areas were extracted from the SAR image (HH-polarization) data as mentioned in Figure 2 (right). FFT analysis was then carried out over all the extracted areas in order to obtain the coordinates for the peak frequency response. The FFT analysis results were used to estimate the wave numbers in range. Azimuth directions and are given as,  $k_x = \displaystyle{{2\pi P} \over {N\Delta x}}$ and $k_y = \displaystyle{{2\pi Q} \over {M\Delta y}}$ respectively, where M, and N are the absolute difference of pixel coordinates for peak frequencies (obtained through FFT analysis); P and Q are the number of samples and line spacing in range and azimuth directions between peak frequencies coordinates respectively. ∆x, and ∆y represent pixel size resolution in range, and azimuth directions respectively (here it is 4 m in both range and azimuth directions). The resultant wave numbers (k) are then estimated by Equation (1).
 $$k = \sqrt {k_x ^2 + k_y ^2} $$
Schematic block diagram for extraction of ocean wave parameters with the use of SAR.

The wave number is defined as the number of cycles travelled by a particle over unit length of distance. Hence, the dominant wavelengths can be derived as,  $L = \displaystyle{{2\pi} \over k}$ for each sub–image area with the consideration of their respective resultant wave numbers. Angular frequencies can be estimated through dispersion relation under different water wave conditions (shallow, intermediate, and deep) with the use of their respective wave numbers.
However, approximate average depths can be obtained through a bathymetric chart for all the extracted areas. Furthermore, local sea surface slopes are then estimated by the following Equation 2 (Leo, Reference Leo2007).
 $$\alpha = \tan ^{ - 1} \left( {\displaystyle{{\omega ^2 d} \over g}} \right)$$
where:
ω is the angular frequency (in rad/sec) of the progressive waves.
d is the water depth (in metres) below the sea surface.
g is the gravitational acceleration whose value is 9·81 m/s2
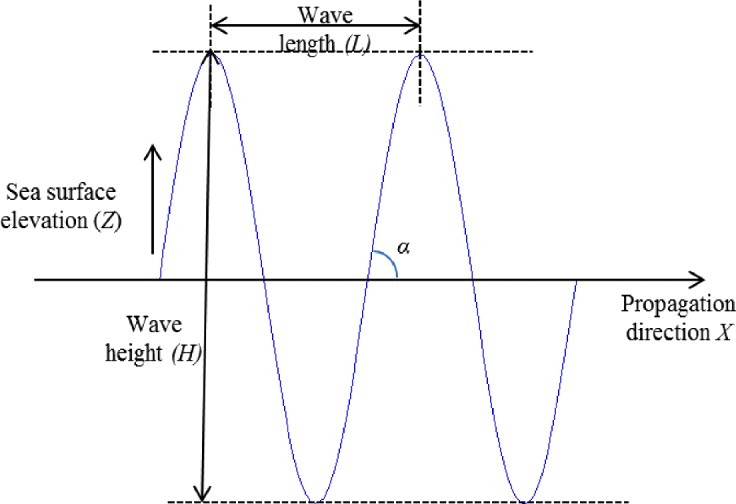
Wave heights can easily be derived by the basic geometry of progressive waves as shown in Figure 5, which shows the direction of wave propagation in the X-direction, and sea surface elevation in Z- direction. L indicates the wavelength of the sinusoidal wave, wave height can easily be derived using in Equation 3.
 $$h = \displaystyle{{L\tan \alpha} \over {2\pi}} $$
Basic diagram for ocean sea surface wave as a function of sine (or cosine) wave. X–axis represents the direction of propagation and Z–axis refers to the sea surface elevation.

3. RESULTS
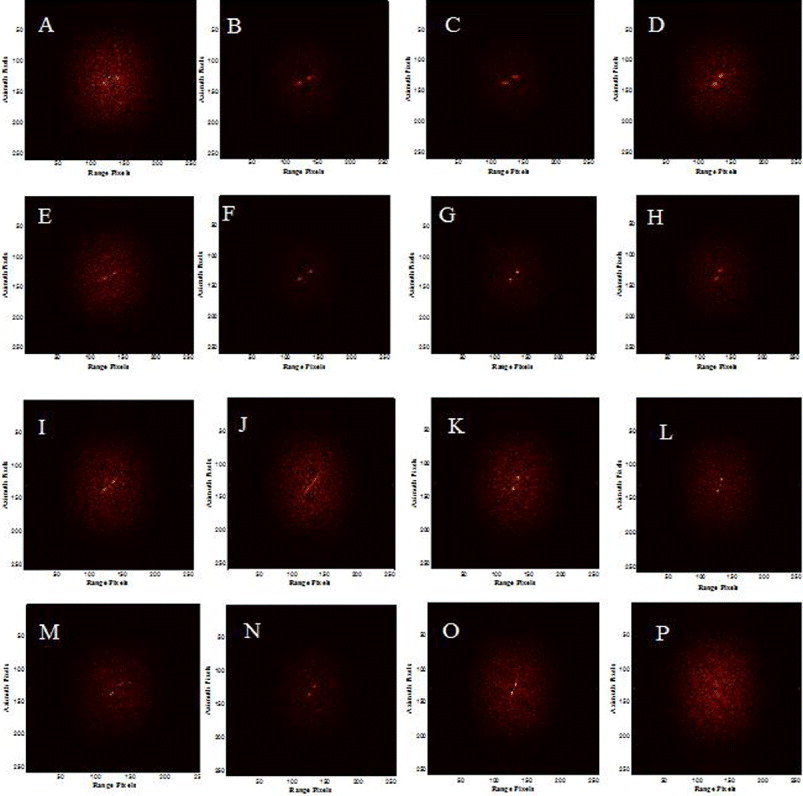
Figure 6 illustrates classified FFT results for the subset areas from A-to-P respectively. The extracted wave parameters are tabulated in Table 3. Variation in wave heights depends on the obtained wavelengths through SAR and average bathymetric depths for 16 subset areas. The waves appearing in subsets are in the form of high frequency sine waves propagating in the radial direction due to the opening of breakwaters and coral reefs. These waves are spherical in nature and are away from the SAR ‘look direction’ (range of propagating waves progresses radially); if the ocean wave travels towards the range direction of the SAR satellite path, the signature will be different due to different signal backscattering response of the range travelling waves. Some subset areas, such as P, are more dominated by means of the velocity bunching.
Classified FFT result for sub–images (A–to–P). Appearance of peak near to the centre represents the peak frequency coordinates where maximum energy is to be concentrated. Region P shows more noisy response due to invisibility of waves in extracted sub–image.

Result for wave parameters extracted for all 16 sub–image regions (A-to-P)

The brightness of a pixel in FFT is proportional to the amplitude of the sine waves it encodes. Subsets B, C, F, G, H and L show the moderate concentration of peak frequency response, while other areas show the noisy response due to more undulation of sea surface present in subset areas.
The appearance of a peak in image indicates a non-linear feature of the waves. Higher frequency sine waves (indicated by bright pixels further away from centre of FFT) represents the sharper edges between dark and brighter areas over an extracted Subset. A peak appearing in a subset represents the coordinates for maximum concentration of energy. Peak-to-peak distance determines the resultant wave numbers and their respective wavelengths.
It is necessary to estimate the water wave conditions and to determine whether the subset areas are deep, shallow or intermediate. These conditions can easily be derived by use of depth to wavelength ratios. If these ratios are more than 0·5, the subsequent region belongs to deep water. Otherwise, the reason can be intermediate or shallow. The location or research site normally indicates intermediate and deep water zones. Care has to be taken when the calculating angular frequencies with the implementation of the dispersion relationship for deep as well as intermediate, water wave conditions. Based on this criterion, sea surface slopes, and wave heights are estimated as per Equations. (2) and (3) respectively.
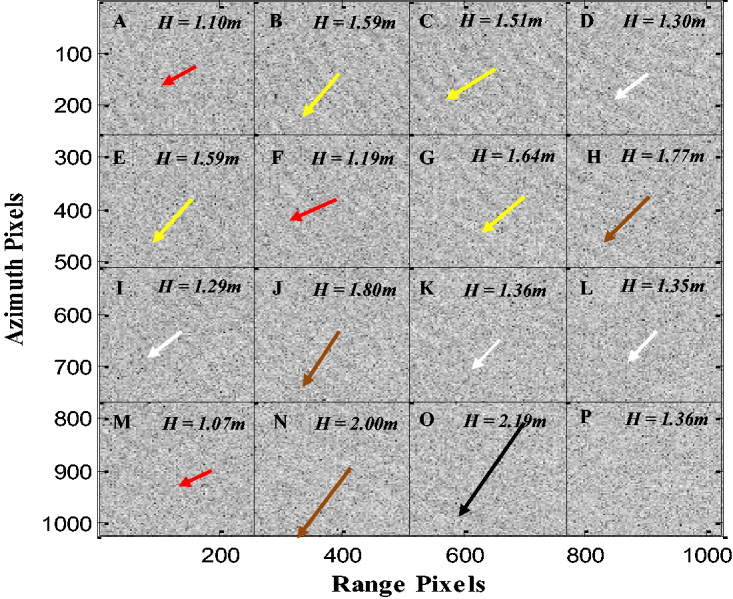
Figure 7 displays the final output result which shows the direction of propagation for the different extracted subset areas with the representation of wave heights. For example, the red arrows represent wavelengths varying in between 40 ∼ 50 m for the areas A, F and M. The white arrow belongs to the wavelengths in between 50 ∼ 60 m for the areas D, I, K and L. Yellow arrows represent wavelength variation between 60 ∼ 70 m for the areas of B, C, E and G. The brown arrows indicate wavelength variation of 70 ∼ 80 m for the areas H, J and N. The black arrow represents wavelength variation of 80 ∼ 90 m for the area O.
Graphical representation for wave parameters as tabulated in Table 3. Arrows represents the direction with the indication of wavelengths for all 16 regions, such as red arrow (L = 40 ∼ 50 m), white arrow (L = 50 ∼ 60 m), yellow arrow (L = 60 ∼ 70 m), brown arrow (L = 70 ∼ 80 m) and black arrow (L = 80 ∼ 90 m). Sub-image area P represents the similar wave properties as of K with comparison of VBR and mean image intensities (please see text for detail).

If we consider, area D is the origin of the spherical wave propagation and area M is the end of wave propagation over the selected image frame. The wave heights for the areas such as D, G, J, and M are found to be 1·30, 1·64, 1·80 and 1·07 m respectively as tabulated in Table 3, due to shallowness and presence of an obstacle (Figure 3) at the middle of an image. Subset areas G and J are affected and hence they show high value of wave heights. Wave height again reduces from 1·80 m to 1·07 m as it progresses from J to M in a radial direction. This condition satisfies the spherical wave properties in an ideal case, but in actual practice there should be a gradual reduction of wave heights from the point source towards the propagation direction. Also, the direction of waves in the areas F, G, K, H, and O are more affected due to effect of shallow water and bottom topography.
Subset area P is more affected by the velocity bunching phenomena and it may be difficult to predict the wave parameters for this area.
As for the range, travelling waves in the SAR imaging mechanism are based on the tilt modulation of the water wave particles and surface scattering phenomenon. Our research site is located at a place where the waves are spherical in nature. The imaging mechanism for the spherical wave appears to be the resultant of range and azimuth direction image mechanisms. The waves which propagate perpendicular to the SAR direction appear clearly in an image but the waves which propagate almost parallel to the SAR direction do not appear in an image.
Our research site is located at the place of opening of coral reefs, and break waters. Due to these phenomena, wave effects such as diffraction and interference occur at every location and time. Hence, the estimated wave height is not decaying consistently along the direction of wave propagation.
The non-uniform variation of wave parameters can also be explained by means of the water depths. The obtained bathymetric chart is old and, since the variation in depth depends on time and respective location, the lack of latest depth information means that, it may be difficult to estimate the exact wave parameters at each particular point of interest. The variation in the wave height as shown on Table 3 does not satisfy the decay of its amplitude in any condition, due to occurrence of wave diffraction at the research site, which shows different signal signature patterns.
4. SUMMARY
This method is based on observation of consecutive waves along their propagation from a start point up to a certain distance in spherical and radial manner. Wave height estimation of ocean waves by SAR is normally difficult due to dependency of radar properties such as incidence angle, look direction and imaging mechanisms, and various oceanographic phenomena such as wind speeds and sea state conditions. In this paper we proposed a simple novel technique to estimate the spherical wave heights for the 16 different subset areas (256 × 256 pixels) extracted from RADARSAT-2 SAR sensor data over the coast of Chukk Island, Micronesia. FFT analysis was carried out over all the subset areas in order to determine the wavelengths and based on these measurements, wave slopes were estimated for all the subset areas using dispersion relation for different water depth conditions obtained from the navigational bathymetric chart.
Wave heights were derived with the use of wavelengths and slopes for all subsequent areas. Velocity bunching relationships have also been performed in order to show the variation in mean image intensities with the variation in wave height along the azimuth spatial direction due to the velocity bunching mechanism.
5. CONCLUSIONS
The research site was an open region of coral reefs, as well as breakwaters. This area is more affected by diffraction and interference of waves. This suggests the loss of energies towards the wave propagation direction. Due to the presence of some obstacles, it shows increment of wave height, especially for the middle portion of the extracted image, but subsequently reduction in wave heights. Wave heights obtained by this method especially deal with the wave slopes obtained through dispersion relationships and wavelengths obtained through SAR FFT analysis. This method provides a greater capability to estimate wave parameters in ocean science and engineering, in both coastal areas and deep sea regions, provided that the in-situ bathymetric information is known.
This work is in progress and in future we will estimate the wave heights using the polarization ratio of radar cross sections for HH- and VV-polarization data to estimate sea surface slope by pixel-based analysis to test and validate the results with in-situ measurements. Also, we plan to estimate the wave parameters using the theory of radar cross section and velocity bunching effect for the spherically generated waves.
ACKNOWLEDGEMENT
RADARSAT-2 data were provided by Canadian Space Agency (CSA); Canada. Meteorological observation data was provided by meteorological laboratory, Chukk Island, Micronesia. The corresponding author would especially like to thank Dr. C.S Yang, Korea Ocean Research & Development Institute (KORDI), South Korea for providing the dataset.