


Sustainable remediation techniques focus on altering the geochemical conditions in the microenvironment of solid particles to immobilize the potentially toxic elements (PTEs) in the source (Hodson, Reference Hodson2010). To this end, naturally occurring clays and clay minerals have been tested widely for the treatment of wastewaters containing Pb, Cu and Zn, among other elements (Bhattacharyya & Sen Gupta, Reference Bhattacharyya and Sen Gupta2008; Uddin, Reference Uddin2017). The physicochemical properties of clays and clay minerals, their natural abundance and the low cost of quarrying and treatment have placed them on the top of the list of organic and inorganic amendments used for remediation purposes (Uddin, Reference Uddin2017). Immobilization of PTEs by clays can be achieved through bonding onto the clay structure and changes in the physicochemical conditions of the environment, which affect element speciation. The retention of metal cations has been studied extensively using treated and non-treated clays, demonstrating the synergistic effects of ion exchange, surface complexation and precipitation (Bhattacharyya & Sen Gupta, Reference Bhattacharyya and Sen Gupta2008; Uddin, Reference Uddin2017; Kypritidou & Argyraki, Reference Kypritidou and Argyraki2018).
The adsorption efficiency of clays for Pb has been studied extensively in the laboratory using single- and/or multi-element solutions under static (batch) experimental conditions. Static (batch) experiments are used to study adsorption kinetics and retention mechanisms by altering various variables such as pH, temperature, ionic strength and sorbate concentration (Bourliva et al., Reference Bourliva, Michailidis, Sikalidis, Filippidis and Betsiou2013; Guerra et al., Reference Guerra, Mello, Resende and Silva2013; Mhamdi et al., Reference Mhamdi, Galai, Mnasri, Elaloui and Trabelsi-Ayadi2013; Kypritidou et al., Reference Kypritidou, Argyraki, Chryssikos and Stamatakis2016). In these experiments, solutions of fixed concentrations are mixed with a predefined quantity of solids for a constant period of time. Such experiments may provide insights into retention mechanisms through easy-to-use procedures. However, they have some disadvantages, such as: (1) the low solid-to-liquid ratio used that is not representative of natural systems; (2) the long reaction times that may increase mass transfer and transport; (3) the effect of abrasion that may alter the solid surface; and (4) the effect of elemental release from the sorbent that may compete with the sorbate (Limousin et al., Reference Limousin, Gaudet, Charlet, Szenknect, Barthès and Krimissa2007; Bi et al., Reference Bi, Schmidt and Haderlein2010).
Dynamic (flow-through) experiments constitute another type of experiment that is employed to study the adsorption efficiency of clays and clay minerals regarding Pb. In these experiments, a solution of known concentration passes with a steady rate through a column packed with the sorbent. The height of the clay beds, flow rate and initial elemental concentration are some of the parameters that influence adsorption under dynamic conditions (Tan & Hameed, Reference Tan and Hameed2017; Patel, Reference Patel2019). Such tests do not alter the surface of the grains due to agitation and provide information about the hydrodynamic processes that occur during solute transport (Patel, Reference Patel2019). In addition, small-scale columns, or micro-columns, may be used instead of the typical laboratory columns. Micro-columns are inexpensive, less time-consuming to use and can be used to assess the performance of a sorbent before its application in field-scale operations (Crittenden et al., Reference Crittenden, Berrigan and Hand1986; Poddar, Reference Poddar2013; Huber et al., Reference Huber, Badenberg, Wulff, Drewes and Helmreich2016).
Although dynamic adsorption is more realistic when studying natural systems, the experimental set-up is more demanding, as non-saturation conditions (i.e. preferential flow paths, stagnant zones and coagulation) may appear within the clay bed (Patel, Reference Patel2019). Therefore, most dynamic adsorption studies focus on non-expandable clays, such as palygorskite, sepiolite (Turan et al., Reference Turan, Mart, Yüksel and Çelik2005; Lv et al., Reference Lv, Wang, Liao, Li and He2013) and kaolinite (Unuabonah et al., Reference Unuabonah, Olu-Owolabi, Fasuyi and Adebowale2010). When expandable clays such as smectites are involved in fixed-bed columns, they usually undergo thermal (Bertagnolli et al., Reference Bertagnolli, Kleinübing and da Silva2011; Gimenes et al., Reference Gimenes, De Almeida Netb, Vieira and Da Silva2013; de Freitas et al., Reference de Freitas, de Almeida, de Almeida Neto and Vieira2018) or acid (De Almeida Neto et al., Reference De Almeida Neto, Vieira and Da Silva2014) pretreatment, altering the physicochemical characteristics of the pristine material. Although the use of a dilution agent (e.g. quartz (Qz) sand) has been proposed as an option to overcome clogging problems (Bi et al., Reference Bi, Schmidt and Haderlein2010) and has been applied successfully to smectite-containing columns (Wibulswas, Reference Wibulswas2004), this approach has not been used widely.
Moreover, the application of micro-columns in dynamic adsorption is often restricted to other materials such as granular activated carbon (Poddar, Reference Poddar2013; Freihardt et al., Reference Freihardt, Jekel and Ruhl2017) and Fe-oxides (Kaprara et al., Reference Kaprara, Kalaitzidou, Zouboulis and Mitrakas2017). Few studies involve the use of clays in such set-ups (Grieco et al., Reference Grieco, Chang, Maio and Hwang2021); however, the small particle size of these materials allows the investigation of the interactions occurring in the microenvironment of the solid particles.
The present study focuses on studying the adsorption efficiency of natural Fe-Mg-rich clays for Pb under dynamic adsorption conditions in fixed-bed micro-columns. The clay samples used in the present study originate from north-west Greece and contain varying amounts of palygorskite and Fe-smectite. They have various commercial applications due to their sorptive properties, and they have also been tested for their efficacy in stabilizing PTEs in mining soils (Zotiadis et al., Reference Zotiadis, Argyraki and Theologou2012). Static adsorption experiments showed that these natural clay materials have significant adsorption capacities (27.6–52.1 mg g–1 for Pb and 7.7–17.6 mg g–1 for Cu), which were attributed to the natural coexistence of both clay phases in the samples (Kypritidou et al., Reference Kypritidou, Argyraki, Chryssikos and Stamatakis2016; Kypritidou & Argyraki, Reference Kypritidou and Argyraki2018; Pyrgaki et al., Reference Pyrgaki, Messini and Zotiadis2018). However, to understand further the interactions under constant-flow conditions, which represent natural systems, dynamic adsorption experiments need to be employed. A complete assessment of the adsorption behaviour of clays dictates the examination of how various experimental parameters affect this behaviour (e.g. the pH and Pb concentration of the inlet solution, the flow rate, the bed height, etc.) to better understand the retention mechanisms. Moreover, dilution agents, such as Qz sand, were employed to overcome the coagulation problems cause by smectite. Within this scope, the specific objectives of this study are: (1) to elucidate the adsorption kinetics of Pb ions by Fe-Mg-rich clays and how these are influenced by varying the experimental conditions; (2) to compare the maximum adsorption capacity of clays as obtained from both static and dynamic adsorption experiments; and (3) to assess the effect of the dilution agent on the adsorption ability of clays.
Materials and methods
Clay materials
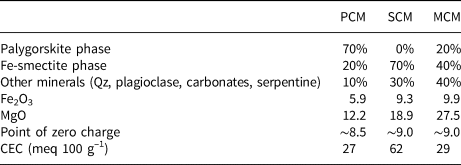
Three clay materials tested as sorbents were included: (1) a clay dominated by the palygorskite phase (~70 wt.%, namely PCM); (2) a clay dominated by Fe-smectite (~70 wt.%, namely SCM); and (3) a clay containing both palygorskite and Fe-smectite (20 wt.% palygorskite and 40 wt.% Fe-smectite, namely MCM). These clay materials were field samples originating from three different deposits of the Ventzia Basin, northern Greece, and they are alteration products of ultramafic rocks (Kastritis et al., 2013). The bulk samples were provided by Geohellas S.A. mining company, which is responsible for the exploitation of the respective clay deposits. Apart from palygorskite and Fe-smectite, these materials also contain several auxiliary phases, such as quartz, serpentine, plagioclase and carbonates. The structure and mineralogy of the clay phases in these deposits have been studied extensively by Gionis et al. (Reference Gionis, Kacandes, Kastritis and Chryssikos2006, Reference Gionis, Kacandes, Kastritis and Chryssikos2007), Chryssikos et al. (Reference Chryssikos, Gionis, Kacandes, Stathopoulou, Suárez and García-Romero2009) and Kaufhold et al. (Reference Kaufhold, Chryssikos, Kacandes, Gionis, Ufer and Dohrmann2019), revealing the complex nature of these materials. A rigorous characterization of the respective clay samples (PCM, SCM and MCM) regarding their mineralogy, structure, chemistry and physicochemical properties was reported by Kypritidou & Argyraki (Reference Kypritidou and Argyraki2018) and is summarized in Table 1. More details regarding the structural, mineralogical and physicochemical properties of the samples are given in the Supplementary Materials. The field samples were ground in a laboratory ball mill to obtain a homogeneous particle size of <63 μm and used without further purification.
Summary of the main mineralogical, chemical and physical characteristic of the clay samples (Kypritidou & Argyraki, Reference Kypritidou and Argyraki2018).
Chemical reagents
The Pb solutions were prepared in the laboratory by dissolving the appropriate amount of Pb(NO3)2 grade salt (Ing. Petr Svec-Penta Chemicals s.r.o.) in deionized water. The initial pH of the solutions was adjusted using 0.1 N NaOH or 0.1 N HNO3. Measurements were carried out using a benchtop pH meter (Jenway 3040 Ion Analyzer).
Column set-up
The dynamic adsorption experiments were carried out using an experimental set-up of small-scale columns, as described in detailed by Kypritidou & Argyraki (Reference Kypritidou and Argyraki2021). Briefly, small-scale columns were constructed using 10 mL polyvinyl chloride (PVC; 1.2 cm diameter) syringes, filled with the clay sorbents diluted with Qz sand (1:7 dilution ratio). The resulting solid material was composed of 12% clay (0.5 g) and 88% Qz sand (3.5 g) to increase the column bed permeability and avoid coagulation due to the presence of Fe-smectite. The as-prepared solids were homogenized mechanically by mixing in a rotary shaker for 30 min. Then, the mixtures were packed in the syringe and pressed manually using the syringe piston to attain a uniform bed height. The bed was supported on the bottom and top of the column by glass wool. Two columns were prepared for each clay–Qz sand mixture to examine the reproducibility of the results. The clay–Qz sand columns are hereafter referred as PCM-Qz, SCM-Qz and MCM-Qz, having hydraulic conductivities of 9.78, 1.32 and 5.69 ×10⁻⁶ cm s–1, respectively. Columns containing only sand were also prepared as controls for investigating the influence of the dilution agent on the retention of Pb. The preparation of the columns and the experimental set-up was carried out in the General Chemistry Laboratory, School of Chemical Engineering, National Technical University of Athens.
The prepared columns were fitted to three-channel micro-flow variable-speed peristaltic pumps (BQ80S, LeadFluid Co. Ltd) via silicon tubes, enabling the simultaneous upward inlet of the solutions into six columns. The columns were washed with double-deionized water prior to adsorption experiments with an upward flow equal to 0.07 mL min–1 (0.5 rpm) for 48 h to remove any soluble salts and stabilize the bed porosity. The pH of the saturated bed was recorded as ~8.0 ± 0.1.
Dynamic adsorption procedures
After the saturation of the beds with deionized water, the Pb solutions passed through the columns in an upward-flow mode. The adsorption efficiency of the clay materials for Pb was tested under various experimental conditions. The selected parameters studied included pH (2.5, 3.5 and 6.0), initial Pb concentration (C 0 = 100 and 200 mg L–1) and flow rate of the inlet solutions (Q = 0.35, 0.70 and 1.40 mL min–1). The pH and Pb concentrations of the inlet solutions were selected based on the adsorption behaviour of the clay materials under static conditions (Kypritidou & Argyraki, Reference Kypritidou and Argyraki2018). Specifically, pH 3.5 was used in previous static experiments, whereas pH 2.5 and 6.0 were selected to test the performance of the materials with acidic (i.e. acid mine drainage) and alkaline liquids (i.e. a wastewater). A pH > 6 would induce hydrolysis of Pb and was avoided. The flow rates examined were selected based on the size of the columns, the permeability of the beds and laboratory trials. The experiments were conducted at ambient temperature. The effluents were collected from the tops of the columns in increments of 20 mL and the pH values were recorded. When the pH of the effluents reached the pH of the inlet solution or was stable for >1 h, the bed was considered to have reached equilibrium with the inlet solution. The effluents collected were filtered through a 0.45 μm cellulose membrane and were stored at 4°C prior to analysis using flame atomic adsorption spectroscopy (PinAAcle 500 series, Perkin Elmer), calibrated with 2.5, 5.0 and 10.0 mg L–1 standard solutions (Sigma-Aldrich). All measurements were carried out at the Laboratory of Economic Geology-Geochemistry, Department of Geology and Geoenvironment, National and Kapodistrian University of Athens.
Column data analysis and modelling
The changes in the Pb concentrations between the inlet solution (C 0, mg L–1) and the effluents (Ct, mg L–1) with respect to time (t, min) were evaluated using the respective breakthrough curves. Each data point was calculated as the mean value between the two replicate columns at the same time interval. The error bars represent the relative difference of the measurements. The maximum adsorbed Pb amount (M eq, mg) at the equilibrium point (t eq) of the beds was calculated by integrating the breakthrough curves obtained (C/C 0 vs t) as shown in Equation 1 (Tan & Hameed, Reference Tan and Hameed2017):
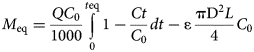
where Q is the flow rate (mL min–1), C 0 is the Pb concentration of the inlet solution (mg L–1), Ct is the Pb concentration of the effluents (mg L–1) at time t (min), t eq is the time when equilibrium is reached, ɛ is the bed porosity, D is the column diameter (1.2 cm) and L is the bed height (2.2 cm). The second term is called the ‘error function’ and accounts for the non-adsorbed metal amount retained within the bed pores (Tan & Hameed, Reference Tan and Hameed2017). Assuming that the bed porosity and volume are controlled by the Qz grains (specific gravity 2.56), the porosity (ɛ) of the bed was estimated to be 0.4 for all beds (regardless of the type of clay sorbent). Therefore, 0.01 mg of Pb was retained within the solution in the bed pores. The adsorption capacity at saturation, q s (mg g–1), is calculated by dividing M eq by the sorbent mass (m, 0.5 g) as q s = M eq/m.
The breakthrough (t b, min) and equilibrium (t eq, min) times were estimated from breakthrough curves when 10% and 90% of the inlet concentrations had reached the column outlet, respectively. By integrating the breakthrough curves at t = t eq, the Pb retention percentage (R, %) was obtained as in Equation 2:
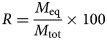
where M tot is the total Pb amount (mg) fed to the column (M tot = QC 0t eq).
The column data were further analysed using the Thomas and modified dose response (MDR) models to estimate the maximum adsorption capacity and adsorption kinetic constants of the beds (Xu et al., Reference Xu, Cai and Pan2013; Tan & Hameed, Reference Tan and Hameed2017; Patel, Reference Patel2019). The Thomas model assumes negligible axial dispersion, pseudo-second order reaction kinetics and Langmuir saturation. The general dynamic adsorption model is described by Equation 3 (Tan & Hameed, Reference Tan and Hameed2017):
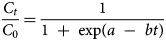
where $a = {{{\rm k_T}q_0m} \over Q}$ and b = kTC 0, kT is the Thomas rate constant (mL mg–1 min–1) and q 0 the maximum adsorption capacity of Pb (mg g–1).
The MDR model was employed as proposed by Yan et al. (Reference Yan, Viraraghavan and Chen2001). The model is expressed by Equation 4:
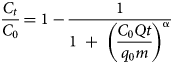
where α is the model constant. This empirical model is used to minimize the errors resulting from the Thomas model at very short and very long operational running times (Yan et al., Reference Yan, Viraraghavan and Chen2001).
The OriginPro 2016 software package (OriginLab Corp.) was employed for the fitting of the experimental data to the mathematical models and equations through non-linear regression methods using the Levenberg–Marquardt algorithm. The determined model parameters were evaluated based on R 2 and χ2 (Foo & Hameed, Reference Foo and Hameed2010; Tan & Hameed, Reference Tan and Hameed2017). Speciation calculations on the aqueous solutions were performed using PHREEQC geochemical code (Parkhurst & Appelo, Reference Parkhurst and Appelo2013) employing the minteq.v4 database (US Environmental Protection Agency, 1998).
Results and discussion
The role of Qz sand in Pb retention
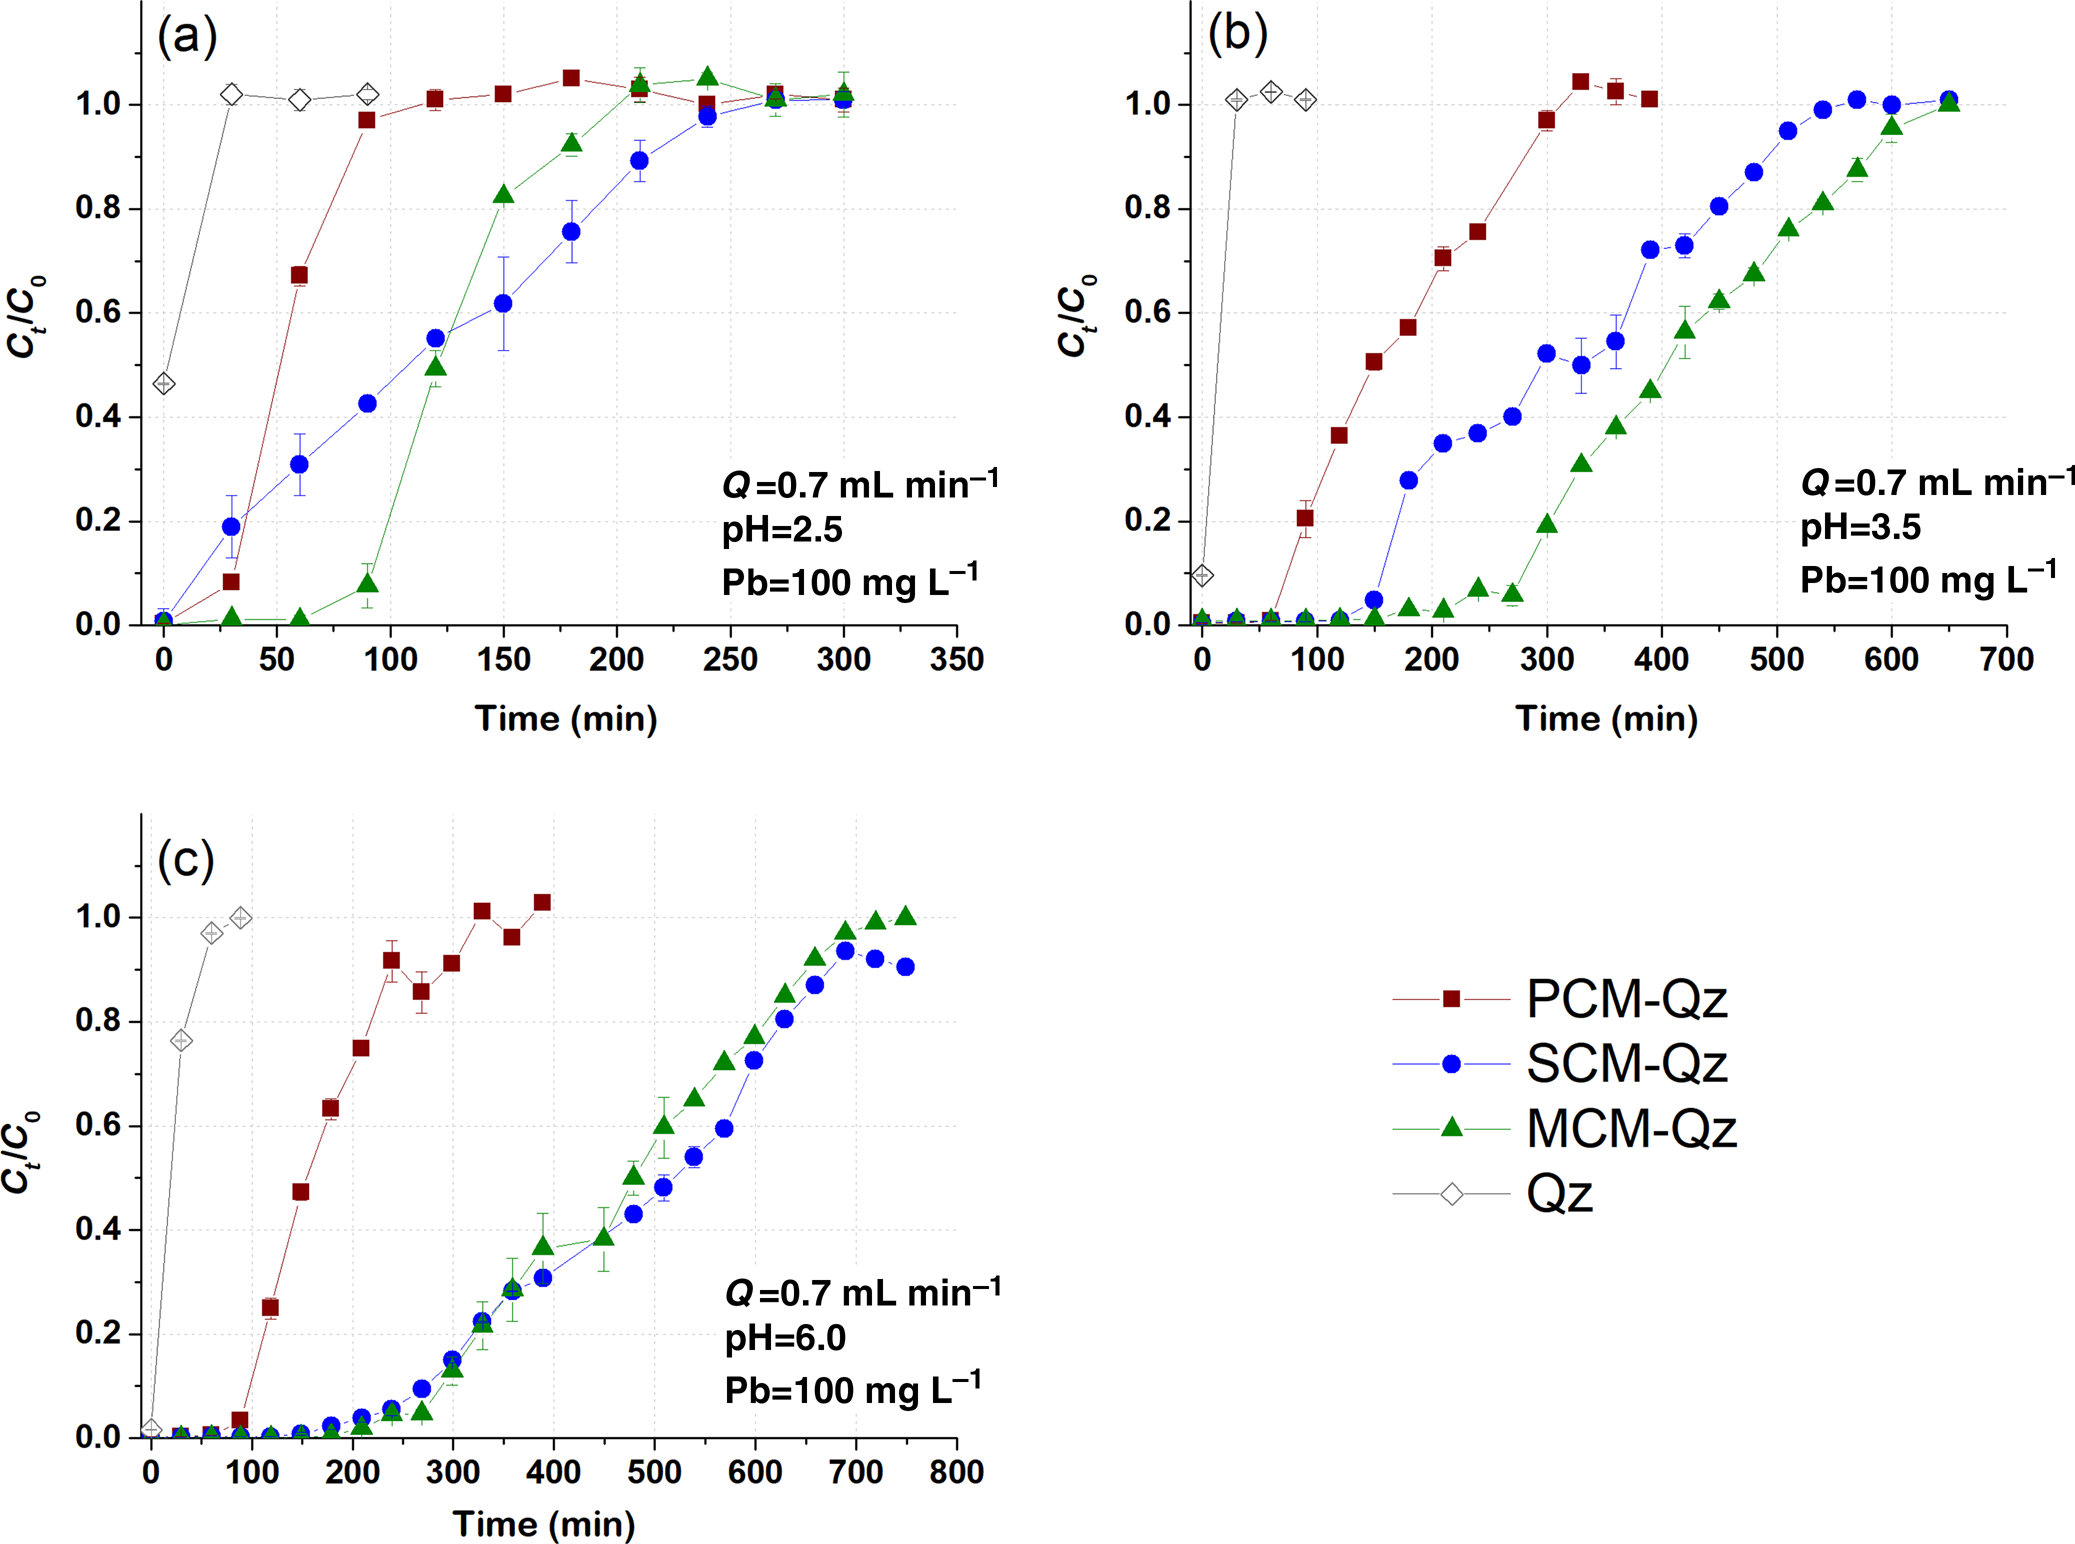
The role of Qz sand in the adsorption capacity of the clays was assessed by conducting the same dynamic adsorption experiments in columns containing only Qz sand (control) at experimental conditions of C 0 = 100 mg L–1 Pb, Q = 0.7 mL min–1 and pH = 2.5, 3.5 and 6.0 (Fig. 1). The saturation times of the Qz sand columns with inlet Pb solutions at pH values equal to 2.5 and 3.5 were 20–25 min, whereas at pH = 6.0 this value was 100 min. The effluent solution pH at saturation increased from 2.5 to 4.0, from 3.5 to 5.5 and from 6.0 to 8.0 for each starting pH value, respectively (Fig. S3). Based on Equation 1, the Pb adsorption capacity of the Qz sand columns (q eq) was <0.5 mg g–1. Due to this, the adsorption capacity of the beds as demonstrated by the breakthrough curves and the respective models was calculated based on the mass of the clay sorbent (i.e. 0.5 g).
Breakthrough curves of Pb sorption (mean ± relative difference) by PCM-Qz, SCM-Qz and MCM-Qz clay beds and Qz sand at inlet solution pH (a) 2.5, (b) 3.5 and (c) 6.0 (C 0 =100 mg L–1, Q = 0.7 mL min–1).
Adsorption of Pb onto clay–Qz columns
The effect of inlet solution pH. The effect of inlet solution pH on Pb adsorption by the beds was examined at pH values of 2.5, 3.5 and 6.0. The Pb concentration of the inlet solution was 100 mg L–1 and the flow rate was 0.7 mL min–1. The breakthrough curves obtained are presented in Fig. 1, and the experimental results for each bed (PCM-Qz, SCM-Qz and MCM-Qz) are given in Tables 2–4.
Experimental conditions of dynamic sorption, the breakthrough experimental data obtained and the model parameters derived for PCM-Qz beds. Values in parentheses denote the relative percentage differences between two measurements.

Experimental conditions of dynamic sorption, the experimental breakthrough data obtained and the model parameters derived for SCM-Qz beds. Values in parentheses denote the relative percentage differences between two measurements.
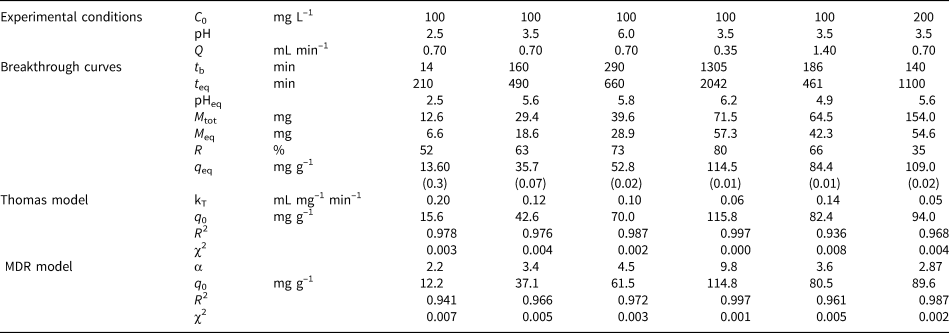
Experimental conditions of dynamic sorption, the experimental breakthrough data obtained and the model parameters derivedfor MCM-Qz beds. Values in parentheses denote the relative percentage differences between two measurements.

The breakthrough curves obtained at inlet pH 2.5 are steep compared to those obtained at the pH values of 3.5 and 6.0 (Fig. 1). A steep slope to the curve denotes a low level of interaction of Pb ions with the bed and therefore low retention of Pb ions. According to Tables 2–4, the breakthrough times (t b; i.e. the time at which Ct/C 0 = 0.1) increased with increasing inlet solution pH, implying a relative increase in the retardation of Pb ions within the columns. This had an effect on the retention percentage (R) and the adsorption capacity at saturation (q eq, mg g–1) of the beds.
The longest breakthrough times were observed for the MCM-Qz beds (t b = 80–290 min) and the shortest were observed for the PCM-Qz beds (t b = 30–100 min). Long breakthrough times denote stronger interactions of the solid particles with the Pb ions due to greater diffusion within the pores. Moreover, high diffusion is also expressed by longer equilibrium times of the beds (t eq; i.e. the time at which Ct/C 0 = 0.9), resulting in greater adsorption capacities. Equilibrium was reached more rapidly at influent pH 2.5 (Fig. 1a), following the order PCM-Qz (100 min) < MCM-Qz (200 min) < SCM-Qz (250 min). This resulted in Pb retention varying from 52 to 70%, which equals 6.3 ± 0.01 mg g–1 for PCM-Qz, 13.6 ± 0.30 mg g–1 for SCM-Qz and 14.9 ± 0.01 mg g–1 Pb for MCM-Qz. The adsorption capacity of the beds accounted for <50% of the cation-exchange capacity (CEC) of the clays (Table 1), indicating that the beds did not become fully saturated with Pb ions at pH 2.5. The low retention of Pb is attributed to the high solubility of the metal, the competition between the solids and ligands in the solution for Pb and the protonation of the clay surface, which repels the metal cations and makes both the surface edges and interlayer unavailable to Pb ions (Turan et al., Reference Turan, Mart, Yüksel and Çelik2005). Note that the clay structure is vulnerable at highly acidic conditions. By destroying the clay structure, fewer adsorption sites become available, decreasing the surface interaction with Pb ions.
At pH 3.5 (Fig. 1b), the achievement of equilibrium of the beds with the inlet solution took three times as long as that at pH 2.5, following the order PCM-Qz (310 min) < SCM-Qz (550 min) < MCM-Qz (690 min). The greatest and least sorbed metal amounts were observed for MCM-Qz (50.2 mg g–1) and PCM-Qz (19.5 mg g–1), respectively. The effluent solution pH at equilibrium increased to 5.2–5.7 compared to the initial solution pH. All three clays showed distinct S-shaped breakthrough curves due to the retardation of Pb ions. This inlet solution pH favours both the solubility of Pb and its diffusion within the clay mass for all of the beds. A greater adsorption capacity was observed for the MCM-Qz bed because this mixed clay material combines both the large surface area of the palygorskite phase and the great CEC of the Fe-smectite phase (Table 1; Kypritidou & Argyraki, Reference Kypritidou and Argyraki2018). The adsorption capacity of the MCM-Qz bed (0.48 mg g–1) exceeded the CEC of the MCM clay (0.29 mg g–1), indicating the contributions of both ion-exchange and surface-complexation reactions in Pb retention.
At inlet pH 6 (Fig. 1c), the equilibrium times of the beds were PCM-Qz (320 min) < MCM-Qz (650 min) < SCM-Qz (700 min) and their adsorption capacities were SCM-Qz (58.4 mg g–1) ≈ MCM-Qz (54.8 mg g–1) > PCM-Qz (19.5 mg g–1). These values accounted for the 89% and 67% of the SCM and PCM CECs, respectively, while they exceeded by far the CEC of the MCM clay (Table 1). The increase in the inlet solution pH from 3.5 to 6.0 did not affect the amount of Pb sorbed at equilibrium (q eq = 18.9 mg g–1).
Considering the greater effluent pH observed at equilibrium (5.5–5.8; Fig. S3), it can be assumed that the hydrolysis of Pb ions plays a major role in the retardation of Pb and its greater adsorption by the beds. Hydrolysed species, such as PbOH+, tend to form stronger bonds with a solid surface due to their lower ionic charge (James & Healy, Reference James and Healy1972). Speciation calculations using PHREEQC geochemical code were carried out using the Pb concentrations (Ct) vs the pH of the effluents (pHe) at each time interval for the MCM-Qz bed at the three inlet pH values (2.5, 3.5 and 6.0; Fig. S4). The main Pb species present in the effluents are Pb(OH)2(aq), PbOH+, Pb2+ and PbNO3+. The hydrolysed Pb species are the main Pb forms present at the start of the elution of the columns, and these are attributed to the high pH of the water-saturated beds (~8.5). These species are retained significantly by the solid surfaces through surface complexation and precipitation reactions. Indeed, the effluents were also oversaturated with respect to Pb(OH)2 (1 < saturation index (SI) < 2) for the first 50–200 min for inlet pH 2.5–6.0. With time, the pH of the effluent dropped (Fig. S3) and Pb2+ and PbNO3+ predominated (Fig. S4). The decrease in the pH of the effluent solutions was attributed to the constant circulation of the acidic solutions within the bed. Medvidović et al. (Reference Medvidović, Perić and Trgo2006) and Stylianou et al. (Reference Stylianou, Hadjiconstantinou, Inglezakis, Moustakas and Loizidou2007) proposed that the decrease in the pH of the effluents of zeolite columns saturated with Pb is the result of the hydrolysis of Pb (Pb2+ + H2O = PbOH+ + H+). In our case, PbOH+ species were not present in the effluents when the pH was reduced to <6.5 (Fig. S4); therefore, the release of protons due to hydrolysis reactions is unlikely to occur. Surface complexation reactions that occur between Pb ions and the edges of clay surfaces may also release protons into the solutions (SOH + Pb2+ = SOPb+ + H+, where SOH represents the clay surface edges). Such reactions seemed to play a significant role (along with exchange in the interlayer) in the retention of Pb by the clay samples in the current study, as was also concluded with regard to static adsorption experiments (Kypritidou & Argyraki, Reference Kypritidou and Argyraki2018).
The breakthrough curves for PCM-Qz at pH 3.5 and 6.0 are the same (Fig. S5a) and therefore the q eq values are also the same (~20 mg g–1; Table 2). By increasing the Fe-smectite content in MCM-Qz slightly (Table 1), the breakthrough curves separate from each other (Fig. S5b). A further increase in Fe-smectite, as in the SCM sample, gives three distinct breakthrough curves at the three pH values examined (Fig. S5c). Therefore, the presence of Fe-smectite plays a key role in increasing the adsorption capacity of clays with increasing inlet solution pH. By increasing the inlet solution pH, the solubility of Pb decreases and the interactions with the clay surface become stronger. Furthermore, the retained Pb ions may diffuse within the interlayer of Fe-smectite, where they exchange with the interlayer cations (mainly Mg; Kypritidou & Argyraki, Reference Kypritidou and Argyraki2018).
To prevent the destruction of the clay structure from occurring in extremely acidic environments such as pH 2.5 (Komadel & Madejová, Reference Komadel, Madejová, Bergaya, Theng and Lagaly2006; Xavier et al., Reference Xavier, Dos Santos, Santos, Oliveira, Carvalho, Osajima and Da Silva Filho2014; Krupskaya et al., Reference Krupskaya, Zakusin, Tyupina, Dorzhieva, Zhukhlistov, Belousov and Timofeeva2017), to improve adsorption and to prevent superimposing of precipitation phenomena onto adsorption (at pH 6.0), an inlet solution of pH 3.5 was used in the subsequent experiments. Moreover, at this inlet pH value, it is easy to distinguish the adsorption capacities of the three clays.
The effect of flow rate
The transport of aqueous solution and its effect on the retention of Pb by the bed were studied at flow rates (Q) of 0.35, 0.70 and 1.40 mL min–1 for inlet solutions with C0 = 100 mg L–1 Pb and pH 3.5. The respective breakthrough curves are presented in Fig. 2 and the experimental data are given in Tables 2–4.
Breakthrough curves of Pb sorption (mean ± relative difference) by PCM-Qz, SCM-Qz and MCM-Qz clay beds at flow rates, Q, of (a) 0.35 and (b) 1.4 mL min–1 (C 0 = 100 mg L–1, pH 3.5).
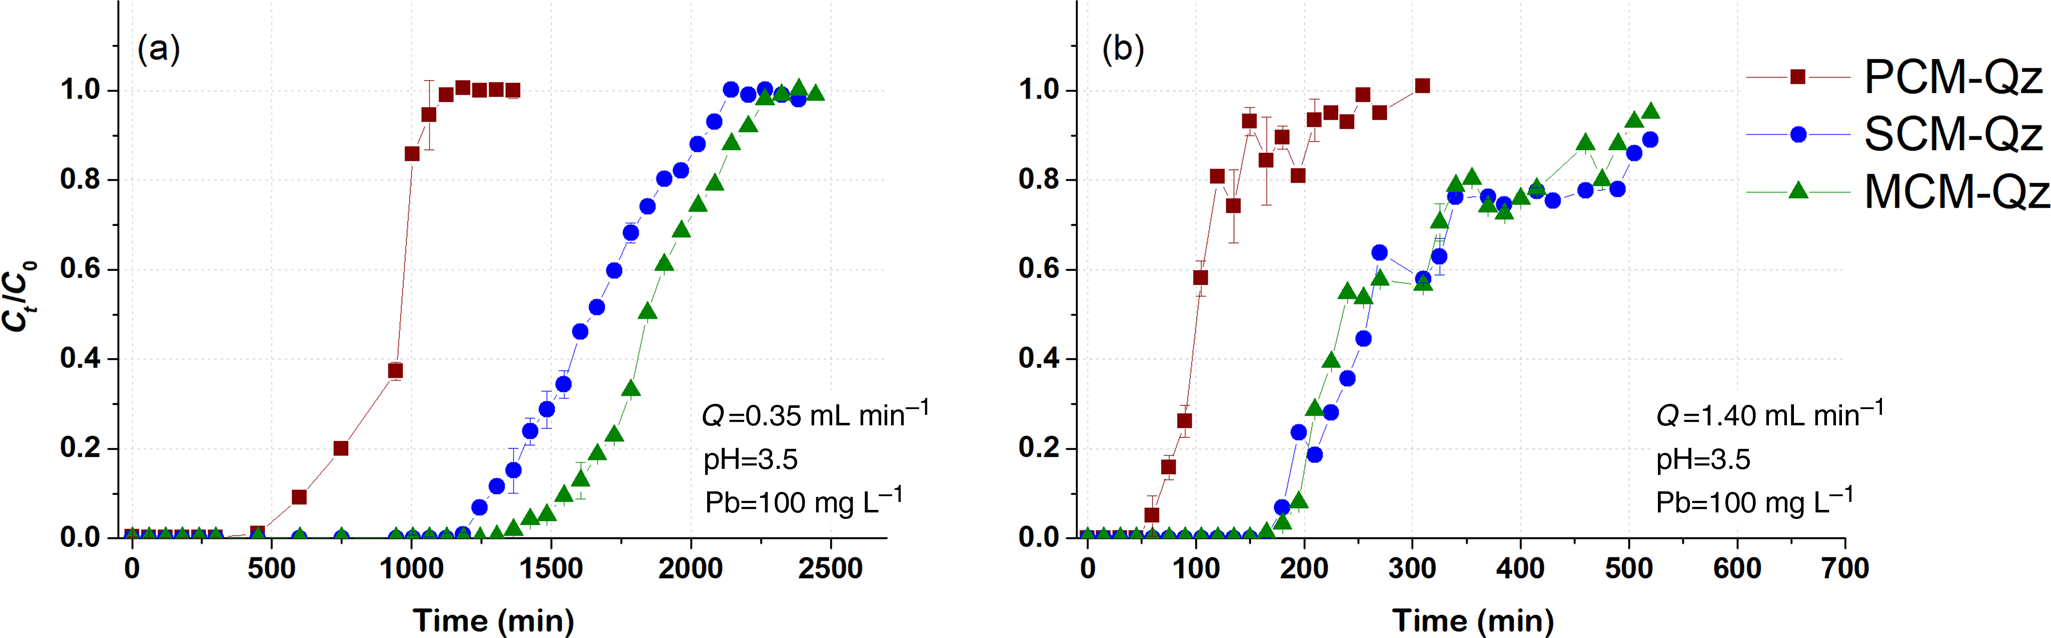
The steepness of the breakthrough curves increased with increasing flow rate of the solutions, demonstrating that Pb adsorption was controlled by the contact time between the solutions and the column beds. The rapid saturation of the beds can be attributed to the faster addition of Pb ions to the system. Low flow rates (0.35 mL min–1) allowed more time for the Pb ions to interact with the solids and access more active sites of the clays (Abdolali et al., Reference Abdolali, Ngo, Guo, Zhou, Zhang and Liang2017). The column pH at equilibrium ranged from 5.5 to 6.2 at a flow rate of 0.35 mL min–1, which led to lower solubility of Pb ions and greater retention on the solid surface. By contrast, high flow rates (1.4 mL min–1) resulted in steep breakthrough curves and low residence times of the solution within the column (Inglezakis & Grigoropoulou, Reference Inglezakis and Grigoropoulou2004). The rapid circulation of the acidic inlet solution within the column increased the solubility of the Pb ions, as the column pH at equilibrium (pHeq) was ~5. Therefore, at Q = 0.35 mL min–1, the saturation of the beds was achieved after 1000 min of elution, whereas at greater flow rates (Q = 1.4 mL min–1), saturation occurred in <550 min (Tables 2–4).
PCM-Qz beds presented the shortest equilibrium times, varying from 150 min at Q = 1.4 mL min–1 to 1000 min at Q = 0.35 mL min–1 (Fig. S6a & Tables 2–4). The adsorption capacities ranged from 59.8 ± 0.005 mg g–1 for PCM-Qz to 126.7 ± 0.002 mg g–1 for MCM-Qz at Q = 0.35 mL min–1 (Fig. 2a). The slow flow of the Pb solutions through the columns allowed for slower diffusion of Pb ions within the Fe-smectite interlayer of the SCM-Qz beds (Table 3) than within the channels of palygorskite of the PCM-Qz beds (Table 2), resulting in greater q eq values. By doubling the flow rate to 0.7 mL min–1 (Fig. 1b), the adsorption capacities of the beds followed the order PCM-Qz (19.2 ± 0.05 mg g–1) < SCM-Qz (35.7 ± 0.07 mg g–1) < MCM-Qz (45.2 ± 0.01 mg g–1). When the flow rate was increased to Q = 1.4 mL min–1 (Fig. 2b), the adsorption capacities of the beds increased further, following the order PCM-Qz (31.2 ± 0.01 mg g–1) < MCM-Qz (80.2 ± 0.01 mg g–1) < SCM-Qz (84.4 ± 0.01 mg g–1). Our findings are in contrast to the statement that the amount of Pb ions treated by the beds at greater flow rates is limited because the time for interaction between the Pb ions and the surface is inadequate to reach full saturation of the adsorption sites (Gong et al., Reference Gong, Zhang, Jiang, Zeng and Cui2015; Patel, Reference Patel2019). In our case, the maximum adsorption capacities in respect to flow rate follow the order 0.35 > 1.40 > 0.70 mL min–1. This observed discrepancy can be attributed to the oscillations in the data points (and the associated large errors) in the breakthrough curves at Q = 1.4 mL min–1 (Fig. 2b). These oscillations are the result of the perturbation of the established pores and the formation of preferential flow paths within the column due to high pressure. This is also supported by the overlapping of the breakthrough curves of all clay beds at flow rates of 0.7 and 1.4 mL min–1 (Fig. S6). To prevent disturbance to the established porosity at high flow rates and to shorten the execution time of the experiments, a flow rate of 0.7 mL min–1 is proposed as the optimum rate for a satisfactory adsorption of Pb by all three beds.
The effect of inlet Pb concentration
The effect of inlet solution concentration on adsorption of Pb by the beds was tested using C 0 = 200 mg L–1 Pb at pH 3.5 and Q = 0.7 mL min–1. The obtained breakthrough curves are given in Fig. 3 and were compared to those obtained at C 0 = 100 mg L–1 Pb under the same conditions (Fig. 1b). The experimental parameters are given in Tables 2–4.
Breakthrough curves of Pb sorption (mean ± relative difference) by PCM-Qz, SCM-Qz and MCM-Qz clay beds at inlet Pb concentration C 0 = 200 mg L–1, pH 3.5, Q = 0.7 mL min–1.
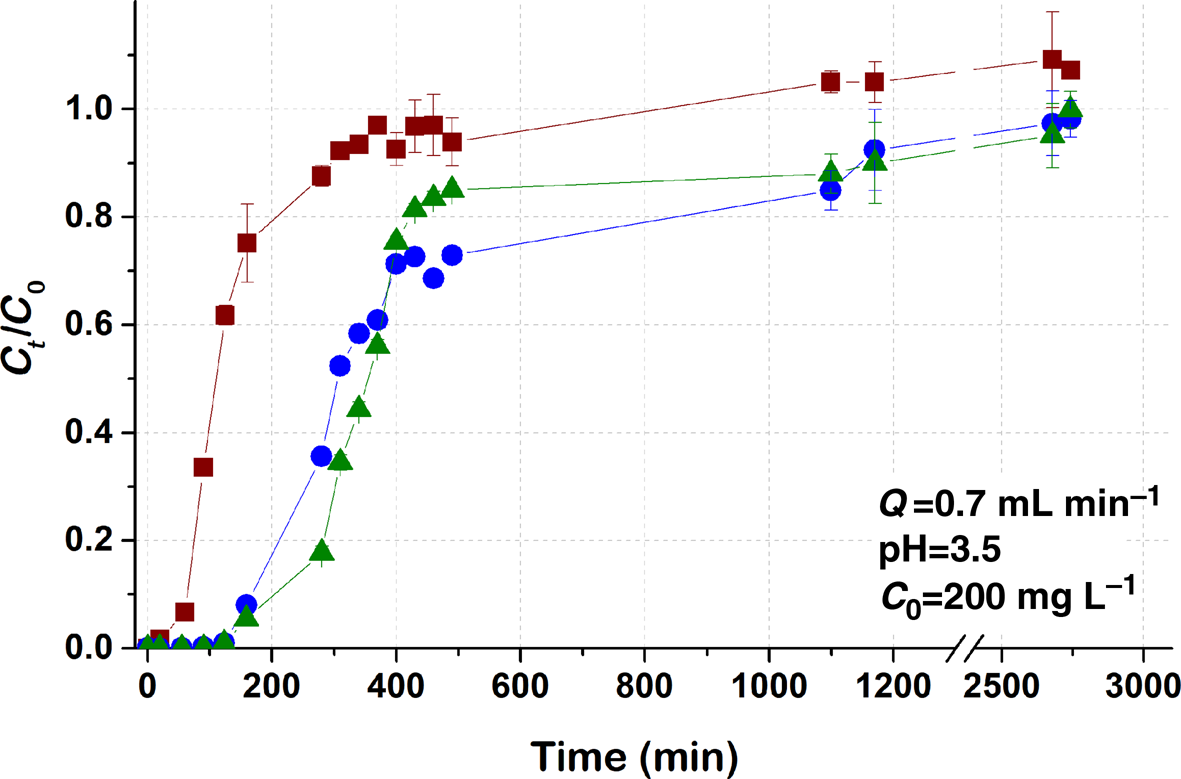
The steepness of the breakthrough curves increased with increasing metal concentration, and for inlet Pb concentrations of the order of 200 mg L–1 (Fig. 3) the adsorption capacities were PCM-Qz (37 mg g–1) < MCM-Qz (112 mg g–1) < SCM-Qz (120 mg g–1). The breakthrough time for the PCM-Qz bed was shorter at C 0 = 200 mg L–1 (t b = 60 min; Fig. 3 & Table 2) compared to at C 0 = 100 mg L–1 (t b = 75 min; Fig. 1b & Table 2); however, saturation was reached at almost the same time for the two concentrations (t eq = 300 and 290 min, respectively; Table 2). The breakthrough curves were identical for the two concentrations (100 and 200 mg L–1; Fig. S4), implying that a concentration of 200 mg L–1 exceeded the adsorption capacity of the clay.
The breakthrough curves for SCM-Qz and MCM-Qz at C 0 = 200 mg L–1 also overlapped (Fig. 3); therefore, the q eq values were almost the same (120 mg g–1 for SCM-Qz and 112 mg g–1 for MCM-Qz). In addition, there is great similarity between the breakthrough curves obtained at the two concentrations up to Ct/C 0 = 0.8. However, the experimental adsorption capacities of SCM-Qz and MCM-Qz beds at C 0 = 200 mg L–1 are greater (109 and 121 mg g–1, respectively) than those at C 0 = 100 mg L–1 (35.7 and 45.2 mg g–1, respectively) due to the small differences between the breakthrough curves at Ct/C 0 > 0.8 (i.e. close to saturation). It is suggested that at greater inlet Pb concentrations, adsorption occurs due to the increase in concentration gradient and the greater availability of sorbed species (Maiti et al., Reference Maiti, DasGupta, Basu and De2008).
Modelling of dynamic adsorption
The breakthrough curves obtained were fitted to specified models that are employed widely to study adsorption in dynamic systems (Xu et al., Reference Xu, Cai and Pan2013; Tan & Hameed, Reference Tan and Hameed2017; Patel, Reference Patel2019). Among them, the Thomas and MDR models were used in the current study to examine the kinetics of adsorption under flow-through experimental conditions. The parameters obtained of each model under the specified experimental conditions are given in Tables 2–4 as obtained from the fitting of the respective breakthrough curves (Figs S5–S7). Both models fitted the experimental data well, with R 2 values ranging from 0.936 to 0.998 and χ2 values ranging from 0.000 to 0.007.
The Thomas model assumes Langmuir-type kinetics, such as no axial dispersion occurring and the driving force of the reaction obeying pseudo-second order reaction kinetics (Xu et al., Reference Xu, Cai and Pan2013). The predicted maximum capacity of the beds for Pb (q 0, mg g–1) increased with increasing pH of the inlet solutions, increasing inlet Pb concentration and decreasing flow rate in all of the beds (Tables 2–4). The increase in solution pH limits the solubility of Pb ions due to hydrolysis. In addition, an increase in Pb concentration led to greater availability of Pb ions and greater loading of the solid surface with Pb ions (Maiti et al., Reference Maiti, DasGupta, Basu and De2008; Unuabonah et al., Reference Unuabonah, El-Khaiary, Olu-Owolabi and Adebowale2012; da Rosa et al., Reference da Rosa, Ostroski, Gimenes Meneguin, Gimenes and Barros2015). By decreasing the flow rate, more time is given for the solution to fill the pores evenly and for the ions to interact with the solid surface (Cruz-Olivares et al., Reference Cruz-Olivares, Pérez-Alonso, Barrera-Díaz, Ureña-Nuñez, Chaparro-Mercado and Bilyeu2013).
The Thomas rate constant, kT (mL mg–1 min–1), decreased with increasing inlet solution pH, decreasing flow rate and increasing initial Pb concentration. The highest kT values were observed in PCM-Qz beds (0.16–1.03 mL mg–1 min–1) and the lowest kT values were observed in SCM-Qz beds (0.05–0.20 mL mg–1 min–1), indicating that the external mass transfer from the liquid to solid phase was greater in palygorskite-rich than in Fe-smectite-rich beds.
In palygorskite clay, Pb is retained through surface complexation onto the edges of the channels, as well as through ion exchange with the tunnels (where it competes with Mg). In Fe-smectite clay, ion exchange in the interlayer dominates over surface complexation at the clay edges (Kypritidou & Argyraki, Reference Kypritidou and Argyraki2018). Due to this, external mass transfer may control the initial part of the breakthrough curve, but pore diffusion occurred at close to equilibrium, while it increased with increasing Fe-smectite content in the beds. This resulted in the greater adsorption capacities as well as prolonged saturation times of SCM-Qz beds compared to PCM-Qz beds. On the other hand, the MCM clay exhibited the characteristics of both palygorskite and Fe-smectite and therefore both external and pore diffusion of Pb occurred, increasing adsorption.
The MDR model is a ‘refined’ version of the Thomas model that is used to obtain better predictions regarding adsorption capacities, which are often overestimated by the Thomas model at very short or very long operation times. The MDR model fitted the whole of the breakthrough curve well, with R 2 = 0.941–0.998 and χ2 = 0.0004–0.007. The q 0 values obtained by the MDR model were closer to those obtained experimentally (Tables 2–4). The greatest differences were observed at C 0 = 200 mg L–1 (Fig. S7). It has been suggested by Calero et al. (Reference Calero, Hernáinz, Blázquez, Tenorio and Martín-Lara2009) and Cruz-Olivares et al. (Reference Cruz-Olivares, Pérez-Alonso, Barrera-Díaz, Ureña-Nuñez, Chaparro-Mercado and Bilyeu2013) that, while the Thomas model represents the initial part of the breakthrough curve appropriately (Ct/C 0 < 0.15), the MDR model can describe the whole breakthrough curve more accurately. In our case, the MDR model fitted the whole of the breakthrough curves well (Fig. S3), especially for the PCM-Qz and MCM-Qz columns, and therefore it predicted more accurately the maximum adsorption capacities of the beds.
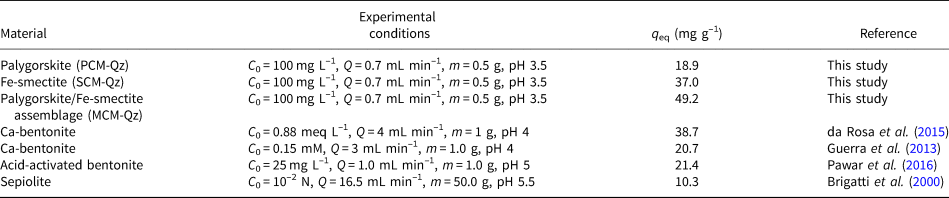
The adsorption capacities of palygorskite and smectite clays in their unmodified forms with respect to Pb under dynamic adsorption conditions has only been studied rarely (Brigatti et al., Reference Brigatti, Lugli and Poppi2000; Guerra et al., Reference Guerra, Mello, Resende and Silva2013; da Rosa et al., Reference da Rosa, Ostroski, Gimenes Meneguin, Gimenes and Barros2015). Some dynamic adsorption data from the literature regarding pure palygorskite and smectite clays are presented in Table 5. Generally, the adsorption capacities of palygorskite-rich (20.0 ± 0.03 mg g–1 Pb) and Fe-smectite-rich (35.7 ± 0.07 mg g–1 Pb) clays employed in the current study were comparable to those found in the literature for sepiolite (Brigatti et al., Reference Brigatti, Lugli and Poppi2000) and bentonite clays (Guerra et al., Reference Guerra, Mello, Resende and Silva2013; da Rosa et al., Reference da Rosa, Ostroski, Gimenes Meneguin, Gimenes and Barros2015), although the experimental conditions varied greatly. The MCM sample, which consisted of both palygorskite and Fe-smectite phases, seemed to have the greatest adsorption capacity among the tested materials (45.2 ± 0.01 mg g–1).
Comparison between the maximum sorption capacities (q eq, mg g–1) obtained experimentally in the current dynamic experiments with selected data reported in the literature.
The natural palygorskite/Fe-smectite clay (MCM) exhibited the greatest adsorption capacities under dynamic conditions among the tested materials at both inlet concentrations (C 0 = 100 and 200 mg L–1; Tables 2–4). The adsorption behaviour of this natural clay could not be correlated with the relative amounts of palygorskite and Fe-smectite present in the sample, as in a mixed clay where these phases could be mixed mechanically. We suggest that the structural characteristics derived from the coexistence of both clay phases (Fe-smectite and palygorskite) in the MCM clay play a significant role in its adsorption efficacy due to the combination of various adsorption mechanisms (i.e. ion exchange, surface complexation and precipitation). Despite some studies having been carried out in this area (Gionis et al., Reference Gionis, Kacandes, Kastritis and Chryssikos2006, Reference Gionis, Kacandes, Kastritis and Chryssikos2007; Kaufhold et al., Reference Kaufhold, Chryssikos, Kacandes, Gionis, Ufer and Dohrmann2019), the complete characterization of this material is still under investigation.
Comparison with static adsorption results
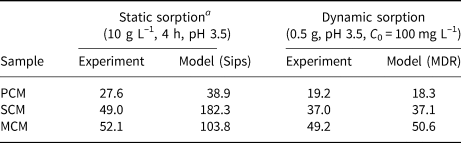
The maximum adsorption capacities of clays (q max, mg g–1) under static and dynamic conditions are given in Table 6, obtained both experimentally and by modelling. For dynamic adsorption, the data were obtained from the breakthrough curves at C 0 = 100 mg L–1, pH 3.5 and Q = 0.7 mL min–1, modelled using the MDR equation (Fig. 3). The MDR model was selected due to its overall better fit with the experimental data (R 2 = 0.975–0.991).
Comparison between experimental and modelled maximum sorption capacities (q max, mg g–1) for the PCM, SCM and MCM clays obtained under static and dynamic sorption conditions.
a Data acquired by Kypritidou & Argyraki (Reference Kypritidou and Argyraki2018).
The experimental and calculated adsorption capacities (using the MDR model) were compared to the respective adsorption capacities obtained under static experimental conditions. Static experiments were conducted using a solid:liquid ratio of 10 g L–1 undergoing 4 h of agitation, a pH 3.5 solution and initial Pb concentrations up to 800 mg L–1. The Sips isotherm equation was used to fit the batch experimental data and to estimate the maximum adsorption capacities of the clay materials (Kypritidou & Argyraki, Reference Kypritidou and Argyraki2018). The respective experimental and model-obtained adsorption capacities under both static and dynamic conditions are compared in Table 6.
The static adsorption capacities were somewhat greater than the dynamic ones, which can be attributed to the greater contact between the clay particles and the solution. In static experiments, the solid particles were dispersed fully within the solution, allowing the full contact of Pb ions with the solid surface. In packed beds, the contact between the particles may inhibit the uniform distribution of the solution, especially if preferential flow paths are formed. Consequently, not all of the mass of the sorbent comes into contact and reacts with the solution (Limousin et al., Reference Limousin, Gaudet, Charlet, Szenknect, Barthès and Krimissa2007).
The similar adsorption results between the static and dynamic adsorption experiments also indicate that Qz sand contributed significantly to the uniform wetting of clay particles by the Pb solution and therefore their interaction with Pb ions.
The maximum adsorption capacity of Fe-Mg clays could be estimated adequately under dynamic adsorption conditions (Table 5). Dynamic adsorption experiments are less time-consuming and more representative of field conditions compared to static experiments; therefore, they should be preferred in the evaluation of sorbents. Compared to static experiments, where a new system is prepared each time a parameter changes, dynamic experiments involve only the preparation of the column. Moreover, the use of micro-columns enabled the adequate evaluation of the adsorption capacity of the clay beds, minimizing the operation time and the amount of sorbent used compared to typical laboratory columns.
The adsorption efficiency of the clay beds under the same dynamic experimental conditions (pH 3.5, Q = 0.7 mL min–1, 0.5 g clay) was also studied using soil leachates enriched with Pb, Zn and Cu (Kypritidou & Argyraki, Reference Kypritidou and Argyraki2021). The results showed the great efficiency of the clay beds for treating multi-elemental soil solutions over relatively short operational times (up to 24 h).
Conclusions
The dynamic adsorption of Pb by clay–Qz beds was examined under various experimental conditions. The greatest adsorption was observed at an inlet concentration of C 0 = 100 mg L–1 Pb, pH 3.5 and Q = 0.35 mL min–1. The slow flow rate enabled the longer interaction of Pb ions with the beds, increasing their retention. Fast flow rates and extreme acidic solutions caused limited Pb adsorption due to brief contact times and the high solubility of Pb ions. Dynamic adsorption proved to be a less time-consuming methodology for studying adsorption, as well as being more realistic in terms of studying natural systems. The experimental results verified the great adsorption capacities of the clays, following the order MCM ≥ SCM > PCM, which agrees with the respective adsorption capacities obtained under static adsorption conditions. The combination of both palygorskite and Fe-smectite phases increased the retention of Pb due to the involvement of various adsorption mechanisms (i.e. ion exchange, surface complexation and precipitation).
Moreover, the utilization of Qz sand as a dilution agent allowed for the study of the adsorption behaviour of clays (especially Fe-smectites) in the dynamic system by enhancing the permeability of the beds without altering the surface properties of the clays or affecting the retention of Pb. Qz sand could also be used when simulating the movement and adsorption of Pb in sandy soils amended with clays. However, good homogenization of the clay–Qz mixtures is important to prevent the formation of preferential flow paths within the columns.
Acknowledgements
The authors acknowledge the kind contribution of Geohellas S.A. in providing the clay materials for this study.
Competing interests
The authors declare none.
Supplementary material
To view supplementary material for this article, please visit https://doi.org/10.1180/clm.2022.45.


 Open access