



1 INTRODUCTION
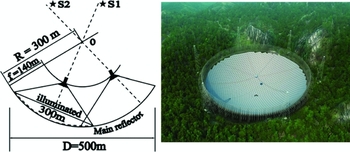
The Five-hundred-metre Aperture Spherical Telescope (FAST) is being constructed in a karst depression in Guizhou Province as one of the mega science facilities for basic research in China (Nan et al. Reference Nan2011). The spherical panels with an overall diameter of 500 m will be used to collect radio waves from the universe. It has about 4 400 active triangular panels with a spherical surface and a curvature radius of 318.5 m, while sitting on a cable-net that has a spherical shape and a radius of 300 m (Figure 1). During observations, the illuminated panels of the main reflector will be adjusted instantaneously to form a paraboloid with an aperture of 300 m in diameter (Qiu Reference Qiu1998) operating under the real-time control. The feed cabin is suspended about 140 m above the panels, with a focal ratio of f/D = 0.4665. The FAST will be able to observe radio sources up to a zenith angle of z = 40° in a frequency range of 70 MHz to 3 GHz. Dong & Han (Reference Dong and Han2013) recently calculated the beam patterns of the FAST at 200 MHz, 1.4 GHz and 3.0 GHz for observations at zenith angles of z = 0°, 27° (S1 in Figure 1) and 40° (S2 in Figure 1).
FAST optical geometry in the left from Nan (Reference Nan2006) and its 3-D model image in the right from Nan et al. (Reference Nan2011).
When spherical panels with the same curvature radius are used to fit a paraboloid, the deviation of panel surface from an ideal parabolic shape is unavoidable. Each spherical panel in the FAST leads to some axial defocusing effect, which affects the focal point and telescope gain. The curvature radius of spherical panels and the focal distance are therefore important parameters to optimise. We noticed that the early design of the spherical curvature radius is 300 m (Qiu Reference Qiu1998), and later it was officially designed to be 318.5 m (Nan et al. Reference Nan2011) based on calculations of the minimum root-mean-square (rms) deviation (Nan Reference Nan2006; Gan & Jin Reference Gan and Jin2010). However, the illumination function of a practical feed, gaps between panels, etc, were not taken into account, and the aperture efficiency was therefore overestimated to be as surprisingly high as 93.3% (Gan & Jin Reference Gan and Jin2010).
During the beam pattern calculation (Dong & Han Reference Dong and Han2013), we noticed that the beam shape and telescope gain are very sensitive to the focal distance. In that paper, we calculated the beam patterns of the FAST with official parameters in Nan et al. (Reference Nan2011), i.e. the curvature radius of panels ρ c = 318.5 m, and the focal distance f = 300 m × 0.4665 = 139.95 m. Using a coaxial feed with an edge taper of Te = −10.7 dB, we found the aperture efficiency at 3 GHz as being ~57%, about 20% lower than that of an ideal 300-m paraboloid.
In this paper, we explore the parameter space of the curvature radius of spherical panels and the focal distance and optimise the positions of panels for the best beam shapes and the maximum gain by comparison of the calculated beam patterns of the FAST at 3 GHz. At this frequency, the performance of the FAST is more sensitive to these parameters than at lower frequencies. In Section 2, we briefly describe the FAST models and feed models used in the calculations. In Section 3, we show our analyses of the focal position of the FAST and the curvature radius of a paraboloid, and present the calculation results by using the Shooting and Bouncing Ray method. Two approaches are tried to get the best beam patterns at 3 GHz. The first one is to explore the parameter space of the curvature radius of spherical panels and the focal distance, and the second is to search for the best positions of panels. Conclusions and discussions are given in Section 4.
2 MODELS FOR FAST AND FEEDS
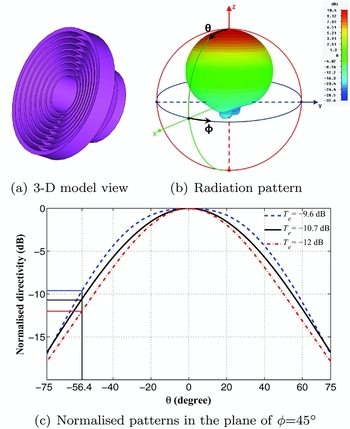
The FAST is a primary-focus radio telescope. First, we describe model of the feed. For our calculation, we use the same universal coaxial horn feed as that in Dong & Han (Reference Dong and Han2013) with seven corrugated walls (Figure 2(a)), which have good symmetry in its broad radiation patterns (Figure 2(b)), very low-level sidelobes and low-level cross-polarisation within the illumination angle. We take the radiation patterns with three possible edge tapers of Te = −9.6 dB, Te = −10.7 dB and Te = −12 dB by slightly changing the flare angle of the corrugated walls (Figure 2(c)).
Model of coaxial feed and radiation patterns with three edge tapers.
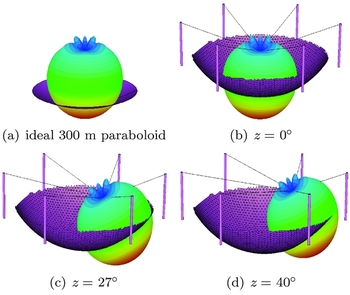
The main reflector of the FAST consists of 4 400 triangular spherical panels. The feed illuminates only some of the panels during observations. We construct the three deformed FAST models for observations at zenith angles of z = 0°, z = 27° and z = 40° (Figure 3), exactly the same as those in Dong & Han (Reference Dong and Han2013). The spherical panels in these models are assumed to be perfect electrical conductors with no thickness. They are adjusted to form a paraboloid with an aperture of 300 m in diameter (Qiu Reference Qiu1998) during observations. In the FAST model, we include two additional parameters as variables: the panel curvature radius ρ c and the focal offset Δf. In the following, we will calculate the beam patterns and telescope gains for various ρ c and Δf to achieve the best performance.
Models for feed illumination of an ideal 300-m paraboloid and the FAST for observations at z = 0°, z = 27° and z = 40°.
3 OPTIMISATIONS AND RESULTS
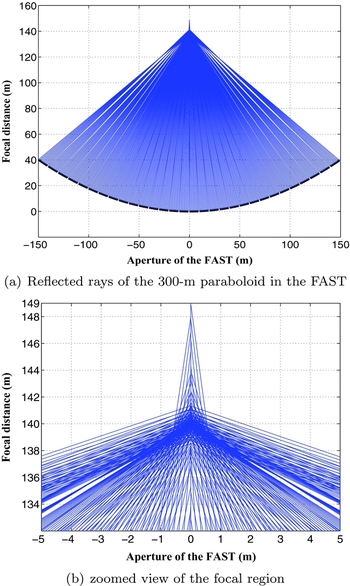
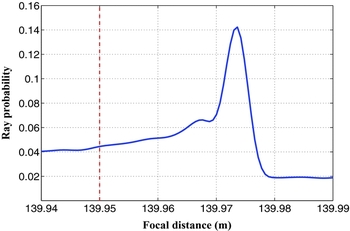
In principle, the best focal position of the FAST can be roughly determined by geometric drawings. We demonstrate this by plotting the reflected rays in Figure 4 for a 1-D ‘parabolic line’ which has thirty arcs as cuts of the spherical panels. The two ends of each arc are on a parabolic line. Ten equally spaced incident parallel rays are directed onto each arc in Figure 4(a) and the zoomed view of the focal region is shown in Figure 4(b). The best focal position should have the highest probability for the reflected rays crossing. The number of rays varies with respect to the focal distance, as shown in Figure 5. With 50 000 equally spaced incident rays directed onto each arc, the peak is slightly offset from the exact official focal distance, which is 139.95 m for the official focal ratio of f/D = 0.4665.
Reflected rays of an adapted paraboloid using the spherical panels for the 300 m aperture of the FAST.
The probability of reflected rays passing through the region near the official focal distance of 139.95 m.
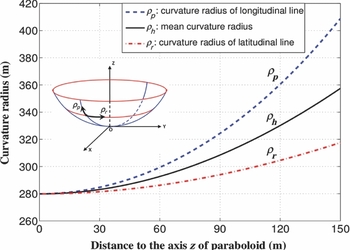
Now, we consider the best curvature radius of the spherical panels. For a 300-m paraboloid, the curvature of a parabolic surface varies significantly with distance to the axis of the paraboloid (see Figure 6). At each point, the curvatures along the longitudinal and latitudinal lines are different. The curvature radius is about ρ p = ρ r = 280 m near the centre, while it increases to ρ r = 318 m for the latitudinal line and ρ p = 409 m for the longitudinal line at the aperture radius of 150 m. Because FAST uses spherical panels of one given curvature radius of ρ c = 300 m (Qiu Reference Qiu1998) or ρ c = 318.5 m (Gan & Jin Reference Gan and Jin2010; Nan et al. Reference Nan2011) to approximate a paraboloid, there must be very different deviations in the central and outer part of the mimic paraboloid due to the inconsistent curvature radii on an ideal paraboloid. Without consideration of the illumination function of a practical feed, the minimum deviation for FAST's 300 m aperture was found for the spherical panels having a curvature radius of 318 m (Gan & Jin Reference Gan and Jin2010).
Variation of curvature radius of a 300-m paraboloid with f/D = 0.4665.
3.1 Beam optimisation via panel curvature and focal offset
We now calculate the beam patterns and the gains by using the three feed patterns and the FAST models shown in Section 2 with the Shooting and Bouncing Ray method for electromagnetic computations. We try to get the best calculation results for the parameter space of ρ c and Δf in 280<ρ c <350 m and −1<Δf<9 cm. The steps for the two parameters are 5 m for ρ c and 1 cm for Δf, with interpolations for some specific known values if necessary. In our calculation, each spherical panel is meshed by at least 1 500 curved triangular elements, and the smallest element in critical areas has an edge length of 0.4 mm. A total number of 108 rays are directed from the feed with a ray distance of 0.1~50 mm on the spherical panel after ‘adaptive ray sampling’. Experiments show that the accuracy of these settings is high enough to detect small deviations from the spherical panels and the focal shift in the FAST. Moreover, reflections from the feed cabin are ignored in our calculation since it might affect the optimal focal distance by reflecting rays into the backlobe of the feed.
The beam patterns and telescope gains at 3 GHz have been found to be a function of the focal shift Δf and curvature radius ρ c (Figure 7). The optimal values of these two parameters are ρ c = 300 m and Δf = 4.8 cm, which are almost the same for different levels of the feed edge taper Te . The best curvature radius, ρ c = 300 m, is smaller than 318.5 m obtained by Gan & Jin (Reference Gan and Jin2010), because the feed illumination is considered in this paper. A lower level of feed edge taper results in smaller best gains. For the ideal 300-m paraboloid, phase centres of the three feed patterns are carefully calculated and placed at the focal point exactly, so there are almost no focal shifts and the maximum gains are achieved at Δf = 0 cm. However, for FAST, a focal shift of about 4.8 cm is needed for the best gain. This small shift is quite critical for the performance at 3 GHz, not only showing that telescope gain could be improved by 0.6 dB, but also indicating that the tracking of a radio source for flux measurements needs good stability in the focal distance control.
Curves for the gain as a function of Δf for ρ c = 280 m, 300 m, 318.5 m and 350 m in the upper panels, and gain contours for Δf and ρ c in the lower panels for three different edge tapers of the feed: Te = −9.6 dB, Te = −10.7 dB and Te = −12.0 dB. For comparison, the gain for the ideal 300-m paraboloid as a function of the focal shift Δf is also calculated and plotted as blue lines in the upper panels.
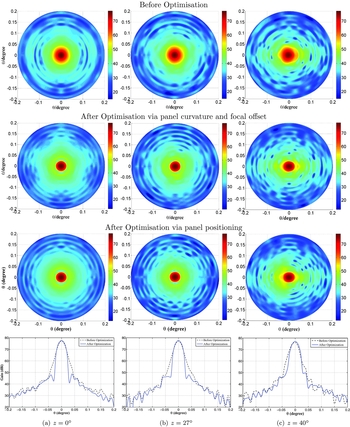
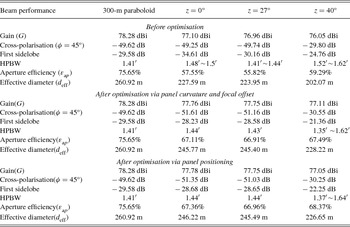
The beam patterns calculated using the official values of ρ c = 318.5 m and Δf = 0 cm are compared with those calculated with the best values in Figure 8. The shapes of the central beam are very different from z = 0° up to z = 40° and get much sharper now, as listed in Table 1; the telescope gain is 77.76 dBi at z = 0°, corresponding to an aperture efficiency of 67.11%. Compared to the beams calculated by using the official values, the efficiency is improved by 9.6%. Around the main beam at z = 0°, the pentagram sidelobes are caused by the pentagon-jointed panels of the main reflector of the FAST (see Figure 2 in Dong & Han Reference Dong and Han2013).
The beam patterns of the FAST at 3 GHz for observations at z = 0°, 27° and 40° with a feed of Te = −10.7 dB. Cuts in the φ = 45° plane are shown in the last row for beams before and after the optimisation.
Beam performance of the FAST at 3 GHz before and after optimisation.
3.2 Beam optimisation via panel positioning
The calculations above and in Dong & Han (Reference Dong and Han2013) are all based on the assumption that the three vertexes of each triangular panel sit on a 300-m paraboloid with f/D= 0.4665 (see Figure 9). However, by adjusting panel positions via actuators in the 2 300 control nodes, the surface deviation (rms) of the spherical panels from the expected paraboloid can be minimised. The panel ‘position optimisation’ (Gan & Jin Reference Gan and Jin2010) is very necessary during the operation of the FAST.
Illustration of panel offsets in different parts of the expected 300-m paraboloid of the FAST.
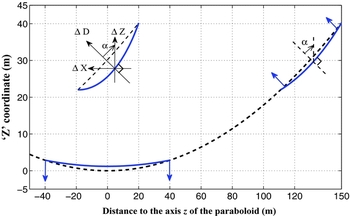
For each panel, the surface deviation rms should be calculated from the offset ΔD in every position in the panel from the expected paraboloid. The offset ΔD should be measured perpendicular to the local surface of the paraboloid (see Figure 9). In our FAST model, considering that every position of each inclined panel has a very similar inclined angle (α) to the vertical Z-axis, we can minimise the surface deviation by searching for one offset in Z directions, $\Delta Z=\Delta D/\text{cos}\alpha$
, through
$\Delta Z=\Delta D/\text{cos}\alpha$
, through
 \begin{eqnarray}
\text{min}(rms) &=&\text{min}\left(\sqrt{\frac{\sum _{i=1}^{n}\Delta D_i^2}{n}}\right)\nonumber\\
&\approx & \text{min}\left(\sqrt{\frac{\sum _{i=1}^{n}\lbrace [(Z^s_i+\Delta Z)-Z^p_i]\cos {\alpha }\rbrace ^2}{n}}\right).
\end{eqnarray}
\begin{eqnarray}
\text{min}(rms) &=&\text{min}\left(\sqrt{\frac{\sum _{i=1}^{n}\Delta D_i^2}{n}}\right)\nonumber\\
&\approx & \text{min}\left(\sqrt{\frac{\sum _{i=1}^{n}\lbrace [(Z^s_i+\Delta Z)-Z^p_i]\cos {\alpha }\rbrace ^2}{n}}\right).
\end{eqnarray}
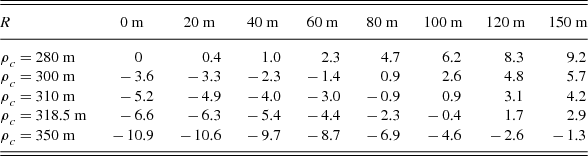
In our calculation for each panel, about n≈200 equally spaced points are sampled. Zs i and Zp i are the ‘Z’ coordinates of the spherical panel and expected paraboloid at the ith sampling point. This makes our calculation easy, while in practice actuators have to adjust the positions of the cable-net to the expected paraboloid with a shift of ΔD = ΔZcos α. We derived the values of ΔD which make the rms smallest for panels in various part of the expected paraboloid, as listed in Table 2. The spherical panels should be lower by several mm in the central region, and lift up by several mm at the edge (see illustration in Figure 9).
Panel offsets ΔD (unit: mm) at different parts (R = 0~150 m) for the best panel positioning of the mimic 300-m paraboloid of FAST.
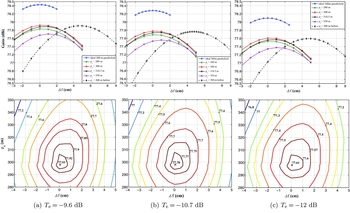
Using this new FAST model of adjusted panels, we calculate the beam patterns and telescope gains at 3 GHz for observations at zenith angles of z = 0°, z = 27° and z = 40°. Gain curves as a function of Δf for ρ c = 280 m, 300 m, 318.5 m and 350 m are calculated as shown in Figure 10. These curves exhibit almost the same best performance as that in Figure 7 but the focal shift needed is very small, in the range of Δf = 0~1 cm. The best curvature radius (see Figure 10) is also found to be ~300 m for the maximum gain, very similar to that in Figure 7. The beam pattern is also very similarly optimised as shown in Figure 8. This means that the precision in positioning of panels to achieve an accuracy of 1 mm is needed for the best performance for the FAST.
After the best positioning of panels, gain curves are calculated as a function of Δf for ρ c = 280 m, 300 m, 318.5 m and 350 m in the upper panels, and gain contours for Δf and ρ c in the lower panels are calculated for three different edge tapers of the feed: Te = −9.6 dB, Te = −10.7 dB and Te = −12.0 dB. For comparison, the gain for the ideal 300-m paraboloid as a function of the focal shift Δf is calculated and plotted as blue lines in the upper panels.
4 CONCLUSIONS
Our calculations of the beam patterns for the FAST model with a practical feed show that the best value of the curvature radius of spherical panels should be ~300 m. The feed should shift 4.8 cm up to get the best gain and best beam shapes. These values are slightly different from the official settings of the FAST (Nan et al. Reference Nan2011; Gan & Jin Reference Gan and Jin2010), but not very significant. However, we see that the aperture efficiency could be improved by ~10% at 3 GHz and that the beam shapes become sharper with the optimised panel curvature and feed position, in addition to the gain increasing by 0.6 dB. We also tried the best positioning of panels, and found that similar best beam patterns could be achieved through adjusting panel positions by a few mm. Our beam calculation results suggest that in future FAST tracking observations, an excellent stability and accurate positioning of feed movements to a few mm and of panels to 1 mm or better, have to be provided so that the observational beams do not obviously vary.
ACKNOWLEDGEMENTS
The authors are supported by the National Nature Science Foundation of China (10833003), and thank CST for support.



