


Highlights
What is already known
Effect size estimation in quantitative evidence synthesis is a time-consuming and error-prone step.
What is new
We propose a new R package that automatically calculates and flexibly converts multiple effect size measures. An open-access, browser-based application provides a graphical user interface to key features proposed in this R package.
Potential impact for research synthesis methods readers
Readers will benefit from a new, user-friendly tool that will make the process of estimating effect sizes easier and more reliable. While these tools are primarily dedicated to researchers performing a quantitative evidence synthesis, they can be useful to any researcher interested in estimating an effect size.
1 Introduction
Over the past few decades, numerous guidelines have emphasized the need to quantify and report the magnitude of the effect studied, in addition to the simple assessment of statistical significance.Reference Cumming 1 The estimation of an effect size is also the cornerstone of meta-analyses, which have become an essential tool for assessing the strength and credibility of an effect in the life sciences.Reference Murad, Asi and Alsawas 2 However, estimating an effect size, particularly in the context of meta-analyses, involves many challenging and error-prone steps. Extracting appropriate information from primary studies, properly calculating an effect size, and handling dependent effect sizes are all common sources of error in published meta-analyses.Reference Jones, Remmington, Williamson, Ashby and Smyth 3 – Reference Fingrut and Chen 7
Several pieces of software allow estimating effect sizes from various types of input data, including commercial software (such as Comprehensive Meta-analysis),Reference Borenstein, Hedges and Higgins 8 free software (such as the esci JAMOVI module, or RevMan),Reference Calin-Jageman and Cumming 9 , 10 R packages (such as esc, compute.es, metafor),Reference Lüdecke 11 – Reference Viechtbauer 13 and free online calculators. 14 However, estimating effect sizes for a meta-analysis with these tools is not always straightforward for distinct reasons (Supplementary Figure S1). First, many of the existing tools do not offer an automatic workflow. This requires users to sequentially estimate effect sizes from each type of input data (i.e., from each statistical indicator that allows the computation of an effect size). For example, if users have extracted four types of input data – such as means and standard deviations, ANOVA F-values, Student’s t-test p-values, and medians, ranges, and interquartile ranges – they must sequentially calculate effect sizes for each type. This increases the risk of error (and makes the process very time-consuming) in situations where studies report a large array of input data that enables the computation of an effect size. Second, many of the available pieces of software are not flexible. Users must gather very specific types of input data to estimate each effect size measure available in the software. For example, no software currently allows the estimation of an SMD from both the results of an ANCOVA model and the medians, ranges, plus interquartile ranges, while this need is commonly found in research practice. This forces users to master and switch between different software programs to access specific features. Third, no software currently proposes convenient solutions for automatically comparing estimates of the same effect computed from multiple types of input data. For example, when exploring the effect of an intervention (regardless of whether it is surgical, pharmacological, or psychosocial), it is common that the same report gives access to the means of the two groups at post-test, the mean differences in the change from baseline of the two groups, as well as the results of a model exploring the effect of the intervention but adjusting for covariates. In this perspective, a previous study has shown that the choice of such types of input data has a great influence on the effect size estimates (a median of SMD = |0.30|).Reference Luo, Funada, Yoshida, Noma, Sahker and Furukawa 15 Therefore, there is a need to develop and implement convenient features to easily visualize the consistency of effect sizes generated from different types of input data (but quantifying the same effect), and implement them in software.
Although less critical, other aspects reinforce the difficulties associated with estimating an effect size during evidence synthesis. A critical assumption of traditional meta-analytic models is that the effect sizes are independent. However, it is very common for meta-analytic datasets to include dependent effect sizes, for example, because a single study uses multiple measures of the same outcome, multiple time points, or multiple subgroups. Accounting for this dependency is often overlooked, even if it could lead to substantial biases in the pooled estimates.Reference Van den Noortgate, López-López, Marín-Martínez and Sánchez-Meca 16 Providing convenient tools to handle dependency between effect size estimates is thus critical in evidence synthesis research. Moreover, many meta-analytic datasets contain errors at the data extraction stage.Reference Gøtzsche, Hróbjartsson, Marić and Tendal 5 Therefore, major guidelines for systematic reviews and meta-analyses require data extraction to be completed in duplicate by independent pairs of data extractors.Reference Buscemi, Hartling, Vandermeer, Tjosvold and Klassen 17 However, when working with large datasets, performing this comparison can become a challenging task. Users would thus benefit from facilities that assist in the comparison of multiple datasets, implemented directly in the software they use to estimate the effect sizes.
To overcome these limitations of existing tools, we have developed a new comprehensive suite, named metaConvert, available both as R package and an open-access browser-based graphical interface (https://metaconvert.org). metaConvert aims to facilitate the calculation and conversion between different effect size measures. More generally, this suite directly addresses the needs expressed by researchers conducting a meta-analysis,Reference Mahmić-Kaknjo, Tomić and Ellen 18 but can benefit any researcher who needs to estimate an effect size.
2 Methods
2.1 General overview of the metaConvert tools
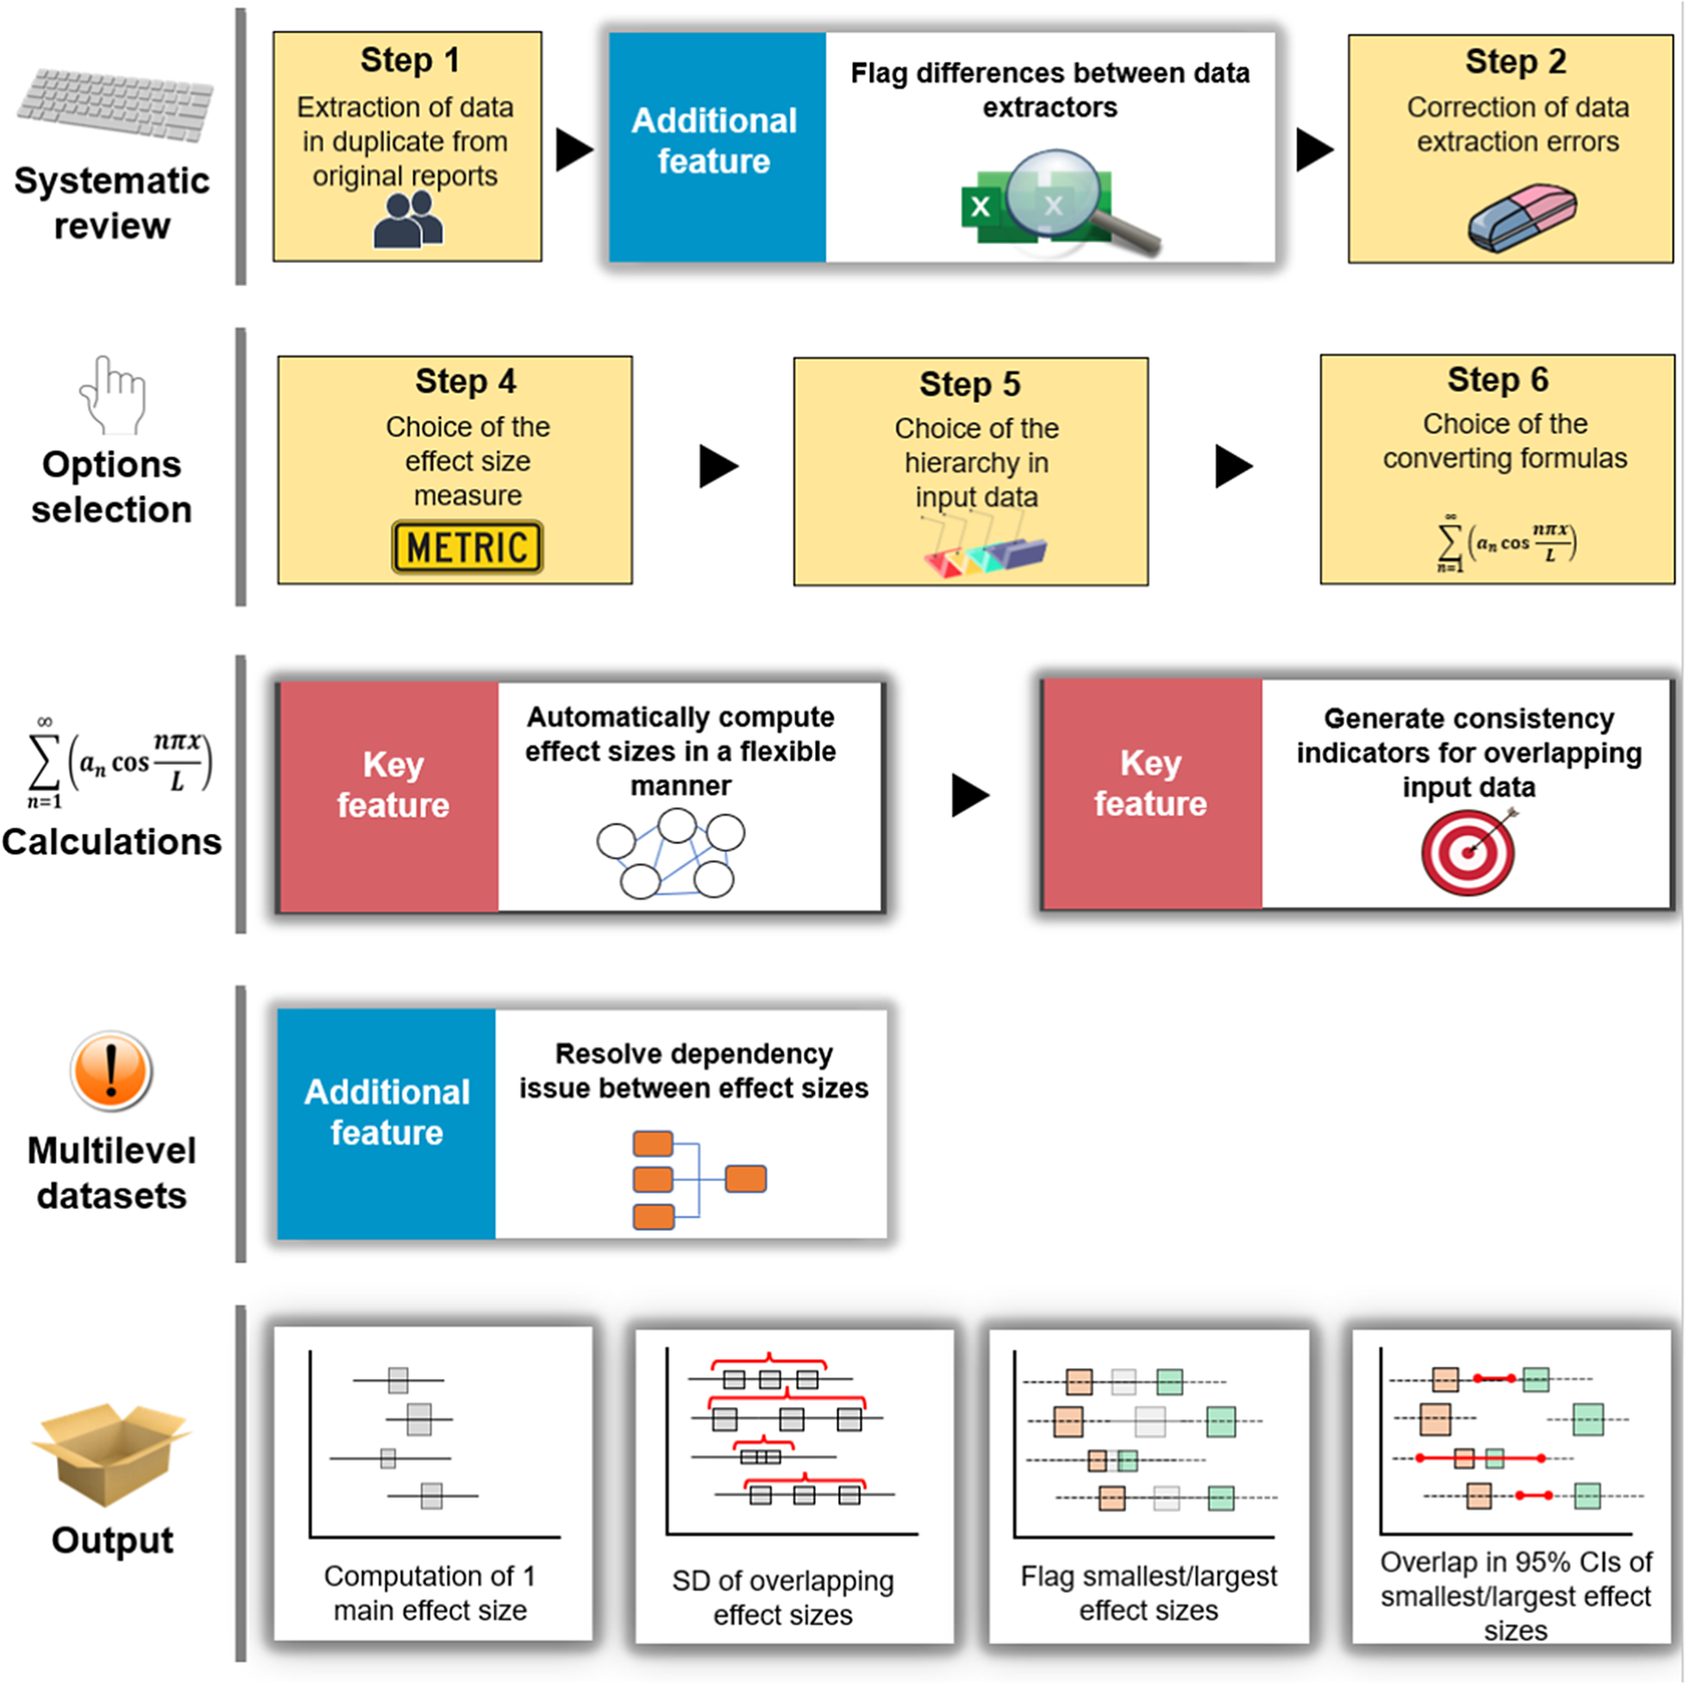
The metaConvert tools are organized around three key features (Figure 1).
Visual representation of the automated workflow of the metaConvert tools in the framework of a systematic review with a meta-analysis. All boxes in yellow are completed by the users while others are automatically handled by the metaConvert tools. At the data extraction stage, the first additional feature assists users by helping identify differences between information extracted by two independent data extractors. At the calculations stage, the two key features allow users (i) to obtain effect sizes generated automatically from a wide range of input data and (ii) to easily determine whether overlapping input data yield consistent effect sizes. Last, after the effect size estimation, the third additional feature allows users to use standard meta-analytic models when there are dependencies between effect sizes, by aggregating the dependent values into one independent value.
The first key feature implements an automatic and flexible effect size computation process, by relying on a core function that automatically calls more than 120 formulas estimating (or converting between) 11 effect size measures from various types of input data.
The second key feature is an innovative system designed to handle situations where several overlapping types of input data are present to estimate the same/a very similar estimand (i.e., situations where different statistical indicators are reported by the same study to estimate the same effect; e.g., a contingency table, an odds ratio value and 95% confidence interval [CI], and the proportions of events in two groups). This innovative feature enables users to (1) automatically calculate all effect sizes derived from all types of input data available and create a personalized selection process to retain only one of these effect sizes for the primary analysis, plus (2) to assess the consistency of effect sizes generated by the different types of input data.Footnote i
The additional features of the metaConvert tools are functions facilitating dataset comparisons between two data extractors, and facilitating the handling of dependent effect sizes.
2.2 Key feature: Automatically compute effect sizes in a flexible manner
The convert_df() function automatically generates effect size estimates, standard errors, and 95% CIs, directly from a well-formatted dataset (Figure 2). This function can estimate 11 effect size measures (Cohen’s d [D], Hedges’ g [G], mean difference [MD], odds ratio [OR], risk ratio [RR], incidence rate ratio [IRR], correlation coefficient [R], Fisher’s r-to-z transformed correlation coefficient [Z], variability ratio [VR], coefficient of variation ratio [CVR] and number needed to treat [NNT]). The function supports 127 formulas across 74 distinct input data combinations, with some combinations allowing multiple validated calculation methods. For example, because the conversion of an odds ratio to a correlation coefficient can be computed through several statistical approaches, the function implements several validated methods to ensure robust estimation across different contexts. All formulas are documented in the package documentation (https://cran.r-project.org/web/packages/metaConvert/metaConvert.pdf).
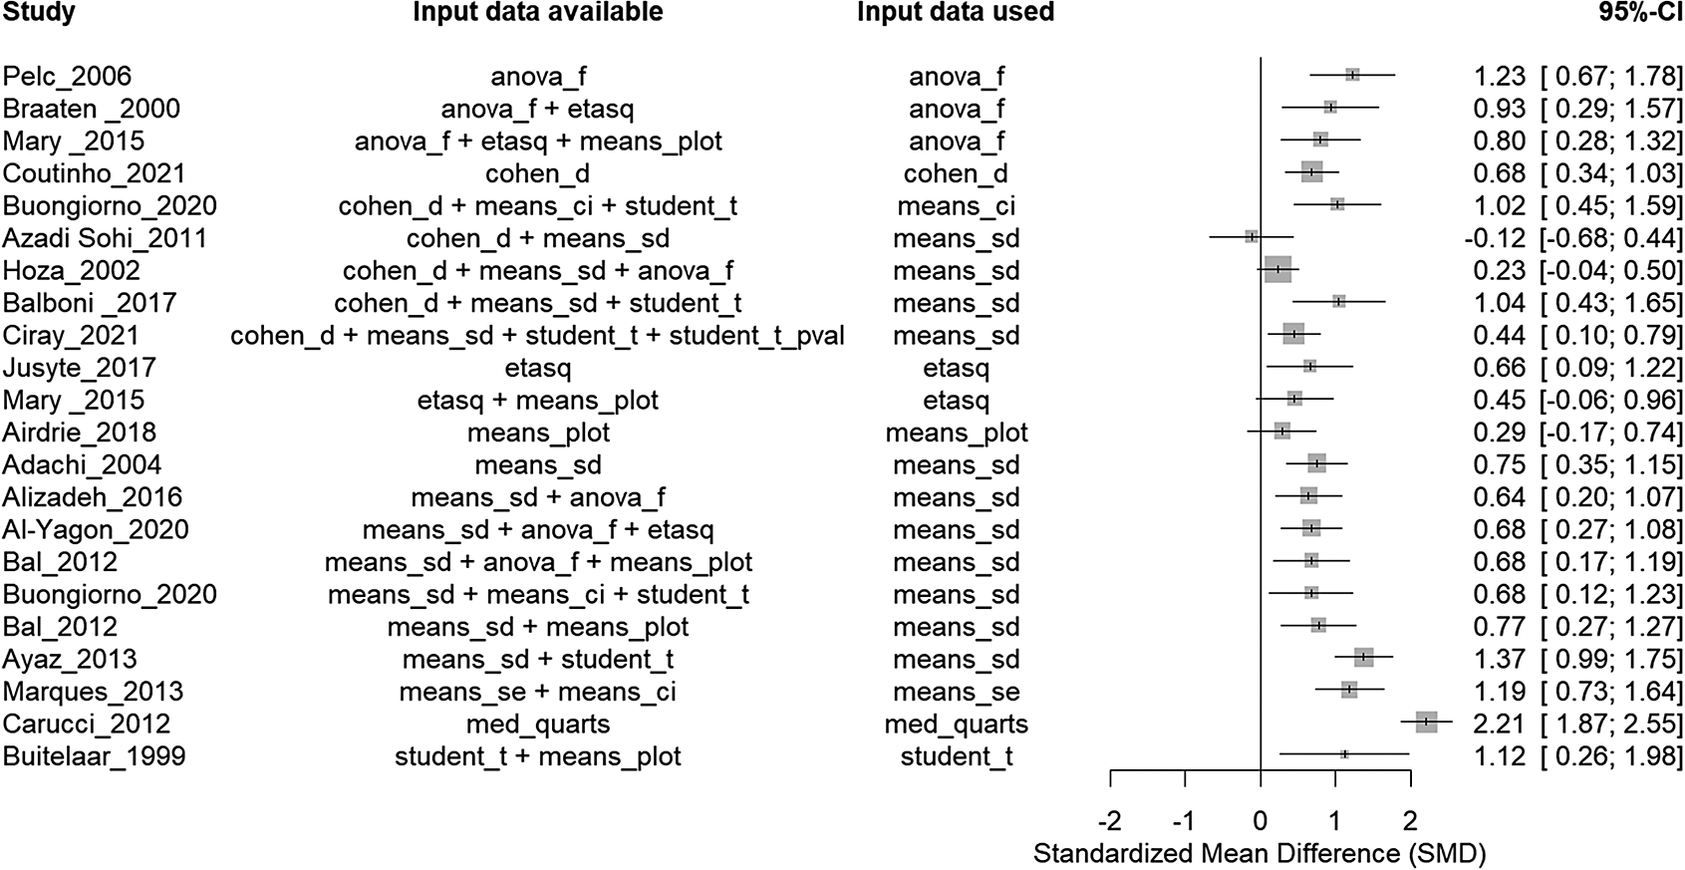
Example of plot showing, for each study, the main effect size, the input data used to generate it, and all the types of input data available to estimate the effect size measure. This plot can be generated directly from the output information generated by the convert_df() function and is automatically generated in the associated web-app.
The key strength of this function over most other similar software programs dedicated to effect size computation lies (in addition to automation) in the flexible process employed. Users are only required to input a well-formatted dataset, and this function generates the desired effect size values, standard errors, and confidence intervals from any relevant input data stored in this dataset. The combination of automation and flexibility offers several advantages. First, it ensures a high reliability in calculating effect sizes across users. Second, it saves a substantial amount of time (by preventing users from building long scripts needed to estimate effect sizes from different types of input data). Third, as described in the next ‘key feature’ section, it enabled us to develop a new innovative system that can easily handle situations where users have access to multiple input data to quantify the same effect.
2.3 Key feature: Handling of overlapping input data
In instances where a dataset contains overlapping types of input data (i.e., several statistical indicators allowing to estimate effect sizes representative of the same or highly analogous estimand), the metaConvert tools automatically calculate all effect sizes derived from all available types of input data. By default, users can select a single “main” effect size from these generated estimates, simplifying their data analysis plan. The tools also evaluate the consistency among effect sizes derived from different input data types.
2.3.1 Selection of one main effect size
Users can select a main effect size through three approaches:
-
1. Creating a custom hierarchy (e.g., prioritizing post-test means and standard deviations over baseline change scores when computing SMD)
-
2. Using pre-defined hierarchies for each effect size measure.
-
3. Selecting automatically the type of input data that produces either the smallest or largest effect size, enable sensitivity analyses to test the robustness of the results.
2.3.2 Generate consistency indicators
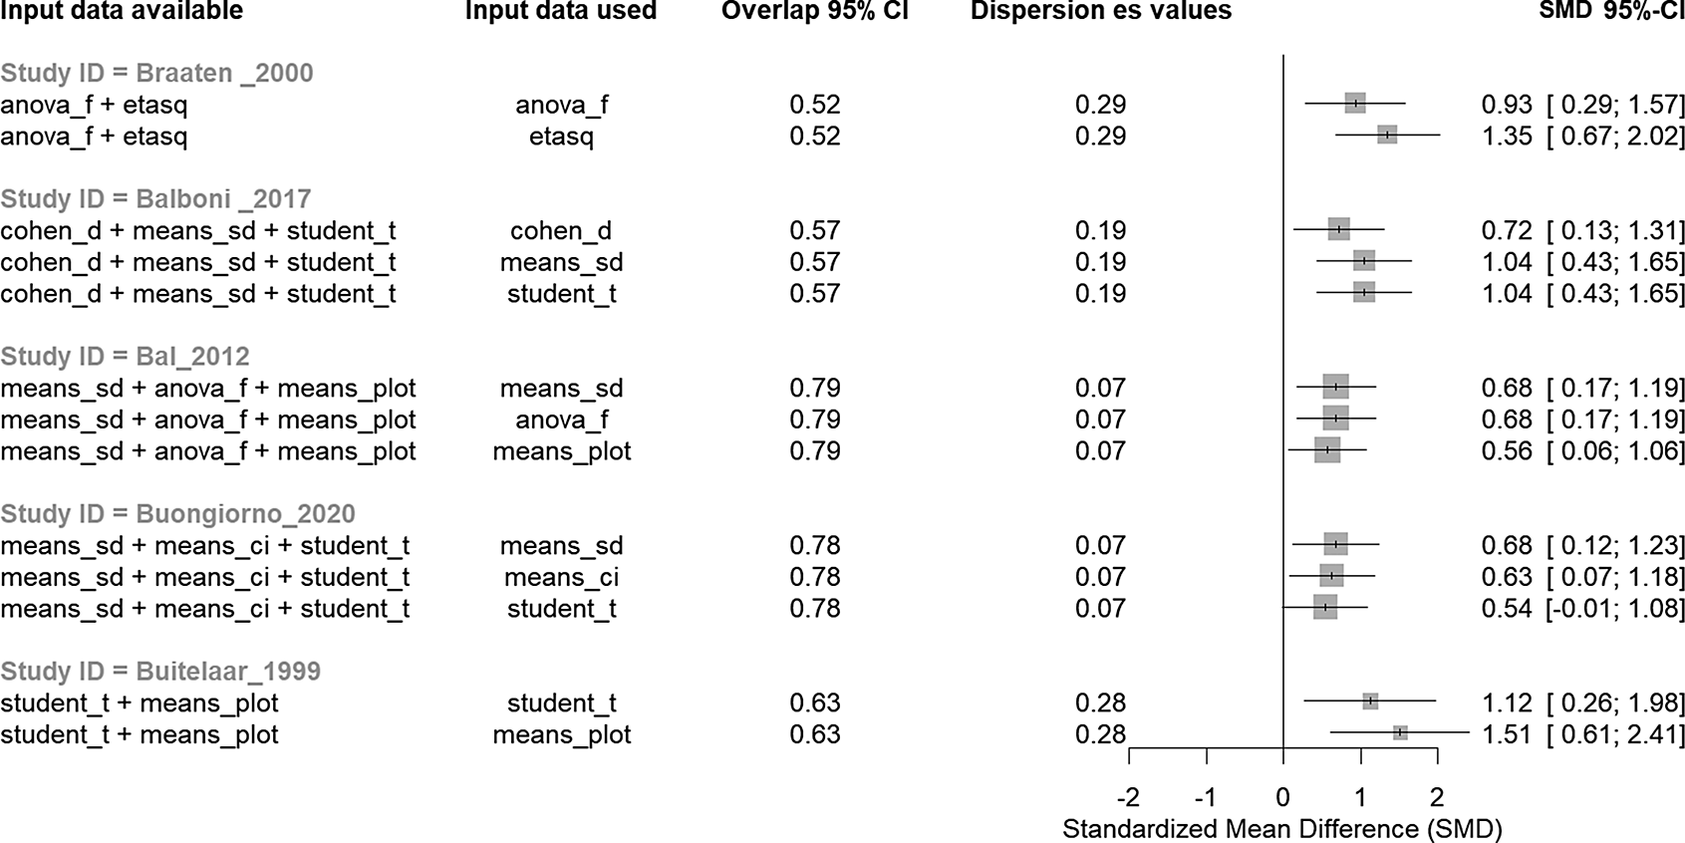
The tools generate five key indicators to assess the consistency of effect sizes generated for estimands with overlapping input data: (i) the smallest effect size, (ii) the largest effect size, (iii) the difference between the smallest and largest effect size, (iv) the standard deviation of the effect size values, and (v) the percentage of overlap between the 95% CIs of the smallest and largest effect sizes. Identifying the smallest and largest effect sizes, as well as their difference, allows users to readily discern the types of input data that result in more extreme effect size values, and to evaluate the magnitude of their divergence. The standard deviation of effect size values provides a straightforward mean of understanding the dispersion of all effect sizes generated by the different types of input data. Furthermore, the percentage overlap of the 95% CI of the smallest and largest effect sizes allows users to gain insight not only into the differences in effect size values but also into the differences in effect size variances. These five indicators enable a clear visualization of the consistency of the effect sizes obtained from different input data (Figure 3).
Example of plot showing, for some studies with overlapping data, the consistency in effect sizes depending on the type of input data used to estimate them, as well as consistency indicators. This plot can be generated directly from the output information generated by the convert_df() function.
2.3.3 Implementation workflow
This approach improves upon current practice, which typically uses only one arbitrary type of input data, by (i) extracting all available types of input data, (ii) generating a main effect size from a preferred type of input data, and (iii) visualizing consistency across different types of input data types.
2.3.4 Important considerations
While this system enhances transparency in the selection of input data, it does not limit the degree of freedom in decision-making. Therefore, it is crucial that meta-analysts outline in their protocol how they will handle overlapping input data types when planning their data analysis strategy. This should involve either defining a clear hierarchy for data selection or explicitly stating their reliance on the pre-established hierarchies provided by metaConvert. Failing to do so may result in selective data extraction. To aid in this process, users can refer to the proposed hierarchies for different effect measures, and, if needed, adjust them using interactive tables that display all available input data for estimating each effect size measure: https://metaconvert.org/input.html.
2.3.5 Error preventions
Finally, we believe this feature will help reduce the risk of data extraction errors. For instance, if data extractors forget to reverse the direction of an effect size estimated from a specific input, metaConvert will flag the discrepancy by identifying effect sizes of equal magnitude but opposite directions. Another common error, such as a typo during data extraction (e.g., entering an OR value of 3.1 instead of 2.1), would be caught by the software, as the noticeable difference between the smallest and largest effect sizes would alert the data analyst to potential mistakes.
2.4 Additional feature: Flag differences between data extractors
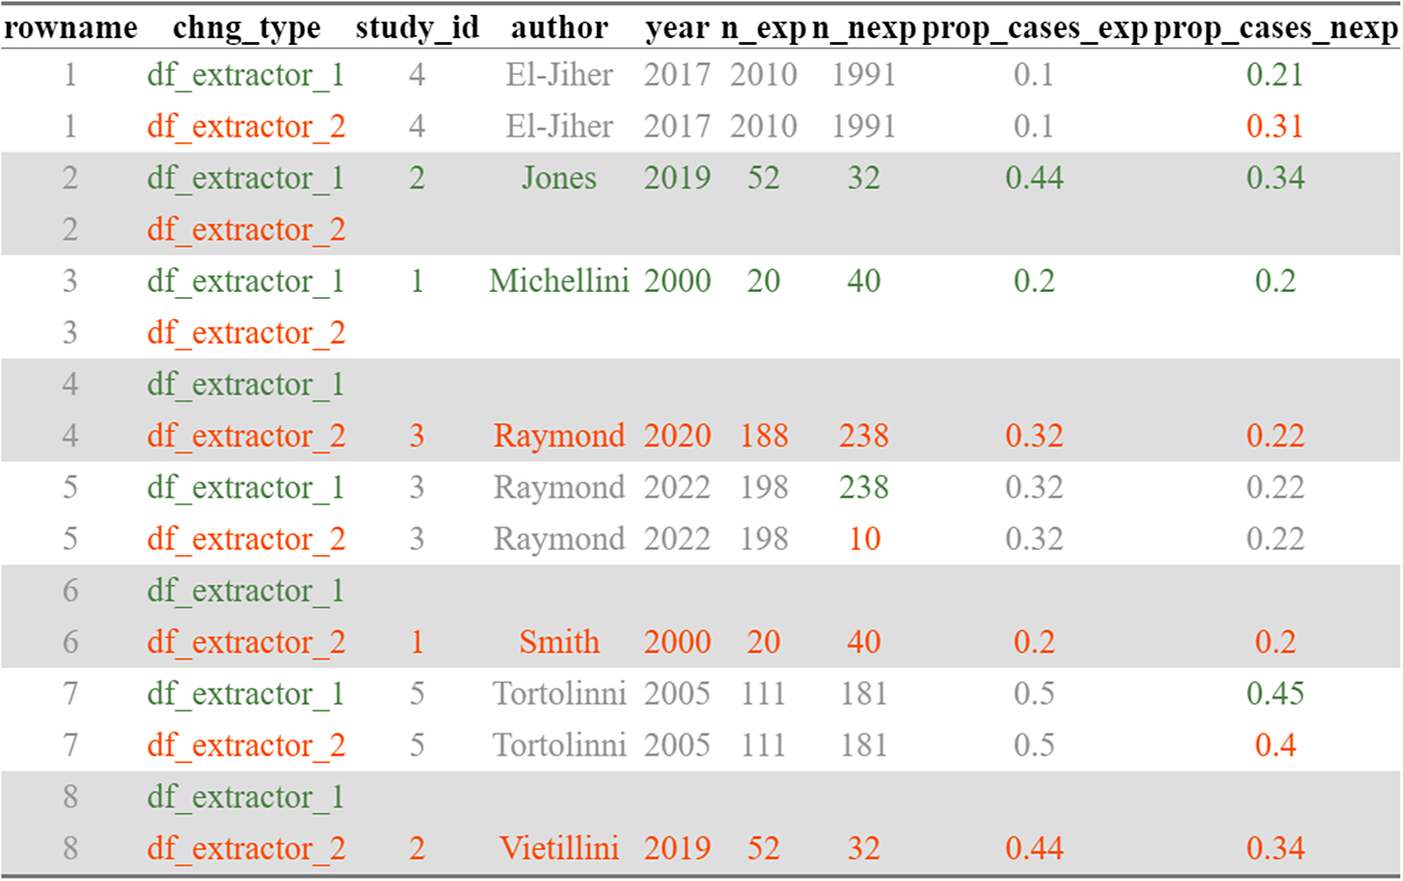
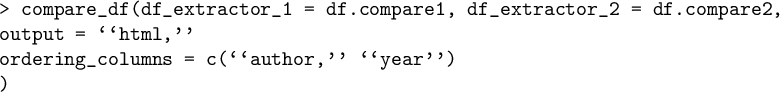
The compare_df() function simplifies the comparison of datasets by automatically identifying the information that differs between two datasets. This function is a wrapper around various functions from the R compareDF package,Reference Joseph 19 tailored specifically to the needs of researchers conducting meta-analyses (Figure 4).
Exact image returned by the compare_df() function, highlighting differences between two datasets.
2.5 Additional feature: resolve dependency issue between effect sizes
The aggregate_df() function proposed in the metaConvert tools implements three formulas that remove dependency between several effect sizes by aggregating them into one independent effect size.Reference Borenstein, Hedges, Higgins and Rothstein 20 With these formulas, the metaConvert tools allow users to handle situations where a unique study includes several dependent effect sizes because (i) participants have completed multiple measurements of the same outcome (such as by using several measures of the same outcome), (ii) participants have completed the same outcome at different time-points, or (iii) multiple independent subgroups have completed the same outcome (e.g., boys and girls).
3 Results
We present here an example of the use of each feature of the metaConvert tools. All the steps completed using the R package are reproduced using the web-app (Supplementary Figure S2). It is crucial to note that the automatic calculations proposed in the metaConvert tools necessitate that users format their datasets in accordance with fixed rules. Prior to the presentation of the examples, we will provide a concise overview of the facilities that we have developed to obtain the required dataset formatting.
3.1 Example: format the dataset
3.1.1 Using the R software
In R, users have the option of generating a dataset comprising the requisite columns (and a description of the information expected in each of these columns) for estimating the various effect measures proposed in metaConvert. The output can be a “data.frame” object, which can be viewed directly in the R console/viewer, or a regular file (such as .txt, .csv or .xlsx).
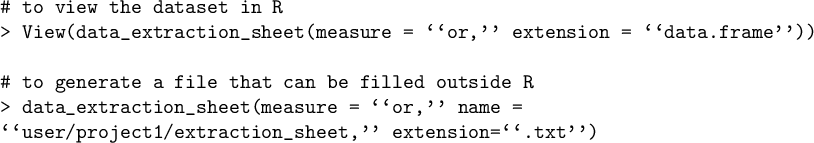
3.1.2 Using the metaConvert website
The metaConvert website offers an interactive tool that allows users to create customized data extraction sheets. To utilize this tool, users must first indicate the type of input data from which they would like to estimate their effect sizes. Once this information has been entered, the tool will generate a dataset that adheres to the prescribed formatting conventions (https://metaconvert.org/input.html).
3.2 Example: automatically compute effect sizes in a flexible manner using R
3.2.1 Automatic computation of the main effect size
To automatically compute the main effect size estimate directly from the dataset, the only function needed is the convert_df() function. Users must specify the effect measure that should be estimated (via the ‘measure’ argument), and the function will automatically estimate a main effect size, standard error, and 95% CI from any relevant input data stored in the dataset.
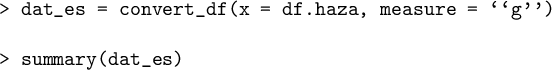
3.2.2 Flexibility in input data
We describe this convert_df() function as flexible because—even if a dataset contains many types of input data—this function adaptively identifies the input data required to estimate an effect size in the dataset, without requiring any further indication by the users. The output of the convert_df() function systematically indicates to the users which type of input data was used to estimate the effect size. In the present example, nine types of input data enabled to compute an effect size (see the ‘input data available’ column in Figure 3), and eight were actually used to estimate the main effect size (see the ‘input data used’ column in the Figure 3). This feature allows users—for example—to easily conduct further analyses exploring whether the type of input data chosen to estimate the main effect size is associated with effect size magnitude.
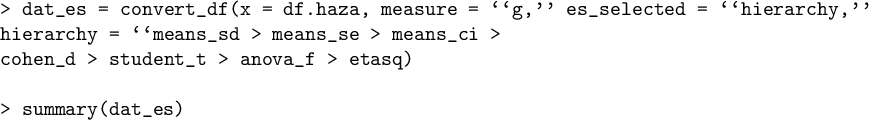
3.3 Example: generate consistency indicators for overlapping input data using R
When several overlapping types of input data (i.e., multiple statistical indicators) are available for the same estimand, users can select the procedure used to estimate a main effect size via the ‘es_selected’ argument. As a general rule, we recommend users to either select the pre-defined hierarchies (‘es_selected = “auto”) or define manually the hierarchy adapted to their situation (using the ‘es_selected = “hierarchy”). In this example, we manually indicate preferring estimating the Hedges’ g in priority from the means (plus either the standard deviation, standard error, or confidence interval), then from Cohen’s d values, then from t-test and ANOVA values, then from eta-square values. These input data have been chosen for this example, but many more types of input data can be used to estimate an SMD (see https://metaconvert.org/input.html).
For each row with overlapping input data, the convert_df() function outputs the statistical indicators of the consistency of effect sizes produced by different types of input data. Relying on this output, it becomes very easy for users to have objective indicators of the consistency of effect sizes (using the % of overlap between 95% CIs, or the SD of the effect size values) as well as to make subjective judgments by plotting the results generated by the convert_df() function (Figure 4).
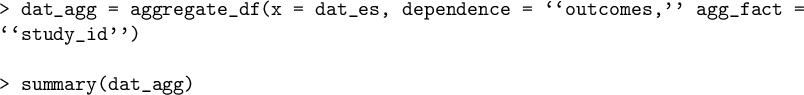
3.4 Example: aggregate dependent effect sizes using R
If a meta-analytic dataset contains dependent effect sizes, the aggregate_df() function enables it to summarize, for each clustering unit, all dependent effect sizes into one independent effect size. Three formulas are available.Reference Viechtbauer 13 , Reference Borenstein, Hedges, Higgins and Rothstein 20 The first synthesizes dependent effect sizes coming from the same participants and is appropriate when studies contain multiple effect sizes due to the completion of several outcome measures by the same participants. This formula can be applied by using the ‘dependence = “outcomes”’ argument. The second synthesizes dependent effect sizes coming from the same participants and is appropriate when studies contain multiple effect sizes due to the inclusion of the same participants but at different time-points. This formula can be applied by using the ‘dependence = “times”’ argument. The third synthesizes dependent effect sizes coming from different participants and is appropriate when studies contain multiple effect sizes due to the presence of multiple subgroups (e.g., a given study reports two effect sizes, one per sex of the participant). This formula can be applied by using the ‘dependence = “subgroups”’ argument. The name of the column of the dataset containing information on the clustering unit is indicated using the ‘agg_fact’ argument.
3.5 Example: compare datasets using R
Last, because comparing datasets created by independent pairs of data extractors can be an overwhelming task, the compare_df() function allows us to easily visualize differences between two datasets. This function requires passing the two datasets, and indicating the desired output format (either an html document, or an excel, text or csv file). The function returns only the rows with differences between datasets, with grey values indicating consistent information, and colored information indicating differences between the two datasets. A noteworthy feature of this function is the ability of users to specify certain columns that will be employed to reorder the datasets before conducting comparisons. This process ensures that if two datasets differ in terms of their row count or sequence, the compare_df() function will detect this discrepancy and automatically align the datasets based on the identification of unique values within these specified columns (see Figure 4).
4 Discussion
Estimating an effect size is a crucial aspect of conveying the findings of scientific research in the sciences. This manuscript presents the R package metaConvert, which provides convenient access to a large number of formulas designed to estimate and convert between 11 effect size measurements. A web application with GUI interface complements the R package, facilitating access to the key functions without mastering the R language.
It may be argued that the approach we have developed for the handling of overlapping types of input data has direct implications for the design of certain forms of evidence synthesis. For example, an increasing number of works are striving to synthesize all data within a research field.Reference Sandbank, Bottema-Beutel, Crowley La Point, Feldman, Barrett and Caldwell 21 – Reference Dragioti, Karathanos, Gerdle and Evangelou 23 In particular, authors have proposed a novel form of evidence synthesis, namely MARDs (meta-analytical research domains),Reference Cuijpers, Miguel and Papola 24 with the aim of extracting and making accessible the information from all RCTs (randomized controlled trials) within a given field. One of the key objectives of MARDs is to provide a unified dataset for all future meta-analysts, thereby eliminating the need for them to re-extract data from RCTs that have already been identified in a MARD. This approach would promote consistency of results across independent meta-analyses, which has been pointed out as a major concern in many fields.Reference Gosling, Cartigny, Mellier, Solanes, Radua and Delorme 25 , Reference Ioannidis 26 However, if a MARD makes available only one type of input data per estimand (e.g., non-adjusted post-test means) while others are available (such as pre-test means, crude, or adjusted mean changes), this can give rise to exhaustiveness issues. It may therefore be advantageous to implement a system analogous to that proposed in metaConvert in MARDs, which would provide users with access to all types of input data available for a given estimand. This approach can also be advantageous in the context of umbrella reviews, which aim to synthesize systematic reviews and meta-analyses within a specific field.Reference Gosling, Solanes, Fusar-Poli and Radua 27 Variations in the selection of input data between meta-analyses could indeed be a potential source of inconsistency in overlapping meta-analyses.Reference Luo, Funada, Yoshida, Noma, Sahker and Furukawa 15 , Reference Khamis, El Moheb, Nicolas, Iskandarani, Refaat and Akl 28
The metaConvert tools have several notable strengths. First, the automatic and flexible process of the metaConvert tools is a direct response to the needs expressed by researchers carrying out meta-analyses,Reference Mahmić-Kaknjo, Tomić and Ellen 18 and enables researchers in many scientific fields to rely on this tool to easily estimate different effect size measures from a wide range of (potentially interdependent) input data without the risk of making calculation errors. Second, our innovative system addressing situations with overlapping input data represents the first concrete effort to mitigate the risk of cherry-picking when meta-analysts are faced with a choice between several types of input data to estimate the same effect. Last, because the metaConvert tools are freely accessible, they align with open science principles and facilitate its adoption by a broad community.
However, this suite comes with limitations. First, there are currently no universal methods or criteria to assess the consistency of effect sizes generated by overlapping input data. Given the growing interest in this issue,Reference Luo, Funada, Yoshida, Noma, Sahker and Furukawa 15 it is possible that new methods/criteria emerge in the future. Rapid implementation of these new methods in the metaConvert tools will be a priority. Second, while our tools make it possible to estimate 11 effect measures, many more effect measures were developed in the literature.Reference Aloe and Becker 29 In concertation with the users of our tools, we aim to make other effect size measures progressively accessible. Third, although we tried to be comprehensive in the synthesis of the formulas used to estimate/convert the 11 effect measures available in our tools, for feasibility reasons, we were not able to include all the formulas available in the literature (e.g., while our tool proposed six approaches to convert OR to RR, other approaches have been proposedReference VanderWeele 30 ).
Overall, the metaConvert tools will enhance end users’ ability to estimate effect sizes from various types of input data. Future developments of this suite—based on the needs expressed by our users and the community18—are planned to continue offering a tool that can be used at no cost by a very wide audience.
Author contributions
C.J.G.: Conceptualization; funding acquisition; writing—original draft; methodology; validation; visualization; software; formal analysis. S.C.: Validation; writing—review and editing; supervision. M.S.: Validation; writing—review and editing; supervision. B.H.: Conceptualization; writing—review and editing; data curation. E.V.: Writing—review and editing; validation. R.D.: Validation; writing—review and editing; supervision. P.F.-P.: Validation; writing—review and editing; supervision. J.R.: Conceptualization; writing—review and editing; validation; methodology; software; supervision; project administration.
Competing interest statement
E.V. has received grants and served as a consultant, advisor or CME speaker for the following entities: AB-Biotics, AbbVie, Adamed, Angelini, Biogen, Biohaven, Boehringer-Ingelheim, Celon Pharma, Compass, Dainippon Sumitomo Pharma, Ethypharm, Ferrer, Gedeon Richter, GH Research, Glaxo-Smith Kline, HMNC, Idorsia, Janssen, Lundbeck, Medincell, Merck, Novartis, Orion Corporation, Organon, Otsuka, Roche, Rovi, Sage, Sanofi-Aventis, Sunovion, Takeda, and Viatris, outside the submitted work. S.C. declares honoraria and reimbursement for travel and accommodation expenses for lectures from the following non-profit associations: Association for Child and Adolescent Central Health (ACAMH), Canadian ADHD Alliance Resource (CADDRA), British Association of Pharmacology (BAP), and grants from NIHR (NIHR203684, NIHR203035, NIHR130077, NIHR128472, RP-PG-0618-20003), European Research Agency (101095568-HORIZONHLTH-2022-DISEASE-07-03), and Solent NHS Trust (Research Capability funding, from 2018 to 2022).
Data availability statement
The data that support the findings of this study are openly available on Github at https://github.com/CorentinJGosling/metaconvert and https://github.com/cran/metaConvert.
Funding statement
This study has been carried out within the framework of the ANR-23-CE28-0019-01 EBIA-CT project awarded to C.J.G., and supported by the French National Research Agency. This study benefited from a government grant managed by the Agence Nationale de la Recherche under the France 2030 program, under the reference ANR-23-IAIIU-0010. The funder had no role in study design, data collection and analysis, decision to publish, or preparation of the manuscript. P.F.-P. is supported by #NEXTGENERATIONEU (NGEU), funded by the Ministry of University and Research (MUR), National Recovery and Resilience Plan (NRRP), project MNESYS (PE0000006)—A Multiscale integrated approach to the study of the nervous system in health and disease (DN. 1553 11.10.2022). Samuele Cortese, NIHR Research Professor (NIHR303122) is funded by the NIHR for this research project.
Supplementary material
To view supplementary material for this article, please visit https://github.com/CorentinJGosling/metaconvert.


 Open access