


Introduction
“People are divided into two camps. Those who feel a fascinated love and those who fear a new thing.”
–Bessie Head.Footnote 1Ethnic diversity in Africa is frequently associated with political instability, heightened risks of violent conflict, and is often portrayed as a structural impediment to development (Blanton et al. Reference Blanton, Mason and Athow2001, Reference Esteban, Mayoral and Ray2012b; Easterly and Levine Reference Easterly and Levine1997; Esteban et al. Reference Esteban, Mayoral and Ray2012a). However, such narratives overlook everyday forms of coexistence that cut across ethnic boundaries. One such example is interethnic marriage, which, while underexamined, remains a salient social practice across the continent. Drawing on data from the Demographic and Health Surveys (DHS), Bandyopadhyay and Green (Reference Bandyopadhyay and Green2021) find that nearly one in five marriages in Africa (19.4%) are interethnic. Their study, one of the first large-N quantitative analyses of interethnic unions in the region, shows that educational expansion, urbanization, and a decline in polygamy are positively associated with such marriages. These findings raise important questions about the social conditions under which ethnic boundaries are crossed and reconfigured in everyday life.
Despite the salience of ethnicity in African social and political life, there remains a notable lack of empirical research on public attitudes toward interethnic marriage. This study addresses that gap by drawing on the Ingroup Projection Model (IPM) and Afrobarometer survey data from 39 African countries (n ≈ 53,000). Specifically, it examines whether individuals who identify more strongly with their ethnic group than with the nation–state are less likely to approve of a family member marrying someone from a different ethnic background. To the best of my knowledge, this is the first study to explore this relationship systematically across the continent. Descriptive analysis indicates that nearly half of Africans (48%) express approval of interethnic marriage, while 11% oppose it, and 41% remain indifferent. Regression analysis further reveals a negative association between strong ethnic identification and support for interethnic unions, with the relationship being stronger among rural residents than their urban counterparts.
The remainder of this study is structured as follows: The next section introduces the theoretical framework and outlines the study’s main hypothesis. This is followed by a description of the data, a discussion of the variables used in the regression models, and a specification of the model’s general form. The fourth section presents and interprets the regression results, while the fifth and final section concludes the study.
Theoretical Considerations
The IPM offers valuable insight into the relationship between ethnic identification and attitudes toward interethnic marriage. This theory explains how ingroup favoritism and outgroup hostility can persist even among individuals who share a common superordinate identity (Mummendey and Wenzel Reference Mummendey and Wenzel1999; Waldzus et al. Reference Waldzus, Mummendey and Wenzel2005, Reference Waldzus, Mummendey, Wenzel and Weber2003; Wenzel et al. Reference Wenzel, Waldzus, Steffens, Sibley and Barlow2016; Wenzel et al. Reference Wenzel, Mummendey and Waldzus2007, Reference Wenzel, Mummendey, Weber and Waldzus2003). According to the IPM, individuals simultaneously identify with both their subgroup and a broader superordinate group. In the African context, for instance, ethnic groups may be understood as subgroups nested within the larger identity of “Africans.” Similarly, at the national level (e.g., in Nigeria), diverse ethnicities coexist within the overarching national identity of being Nigerian. A core mechanism of the IPM is the tendency for subgroup members to project their own values, norms, and characteristics onto the superordinate group. As a result, individuals begin to see their own subgroup as the prototypical representative of the larger collective identity. This projection process sets a standard against which other subgroups are evaluated. Groups perceived as aligning with the projected prototype are viewed more positively, while those that deviate from it are seen less favorably—thus reinforcing intergroup bias even within a shared national or cultural identity.
Empirical research has provided robust support for the IPM. For instance, a study by Waddell et al. (Reference Waddell, Wright, Waldzus and Stebner2024) in the U.S. found that individuals who strongly identified with a political party—such as the Democratic or Republican Party—were more likely to project their ingroup’s values onto the national identity. This projection, in turn, increased their likelihood of endorsing political violence against members of the opposing party. Similarly, Bell et al. (Reference Bell, Eccleston, Bradberry, Kidd, Mesick and Rutchick2022), also working in the U.S. context, found that when members of an opposing party were perceived as poorly aligning with the ingroup’s projected values, individuals were less supportive of bipartisan cooperation and reported lower levels of engagement in cross-party interactions. Further support for IPM comes from a study by Lie and Verkuyten (Reference Lie and Verkuyten2012), conducted among Turkish-Dutch Sunni Muslims. The authors found that individuals who actively practiced Islam were more likely to project their own religious practices onto the broader Muslim identity. This projection subsequently increased their bias against Alevi Muslims, whose practices diverged from those of Sunni orthodoxy.
I therefore expect that Africans with a strong sense of ethnic identification—who prioritize their ethnic identity over their national identity—should be more likely to project their ethnic group onto the broader superordinate identity, such as nationality. This projection may reduce their openness and tolerance toward individuals from other ethnic groups and increase their likelihood of opposing a marriage between a family member and someone from a different ethnic background. This logic underpins the following hypothesis that this study seeks to test:
H1: Strong ethnic identification negatively correlates with support for interethnic marriage
Methods
Data
This study draws on data from Round 9 of the Afrobarometer survey, conducted between 2021 and 2023 across 39 African countries (n = 53,444).Footnote 2 Table A3 in the Appendix lists the countries and the number of observations collected from each. Respondents were at least 18 years old, with men and women equally represented (50:50 ratio). Afrobarometer employs probabilistic sampling methods, making the data nationally representative for each country included in the sample.Footnote 3 The variables used to estimate the regression model are discussed below.
Measurements
Dependent Variable
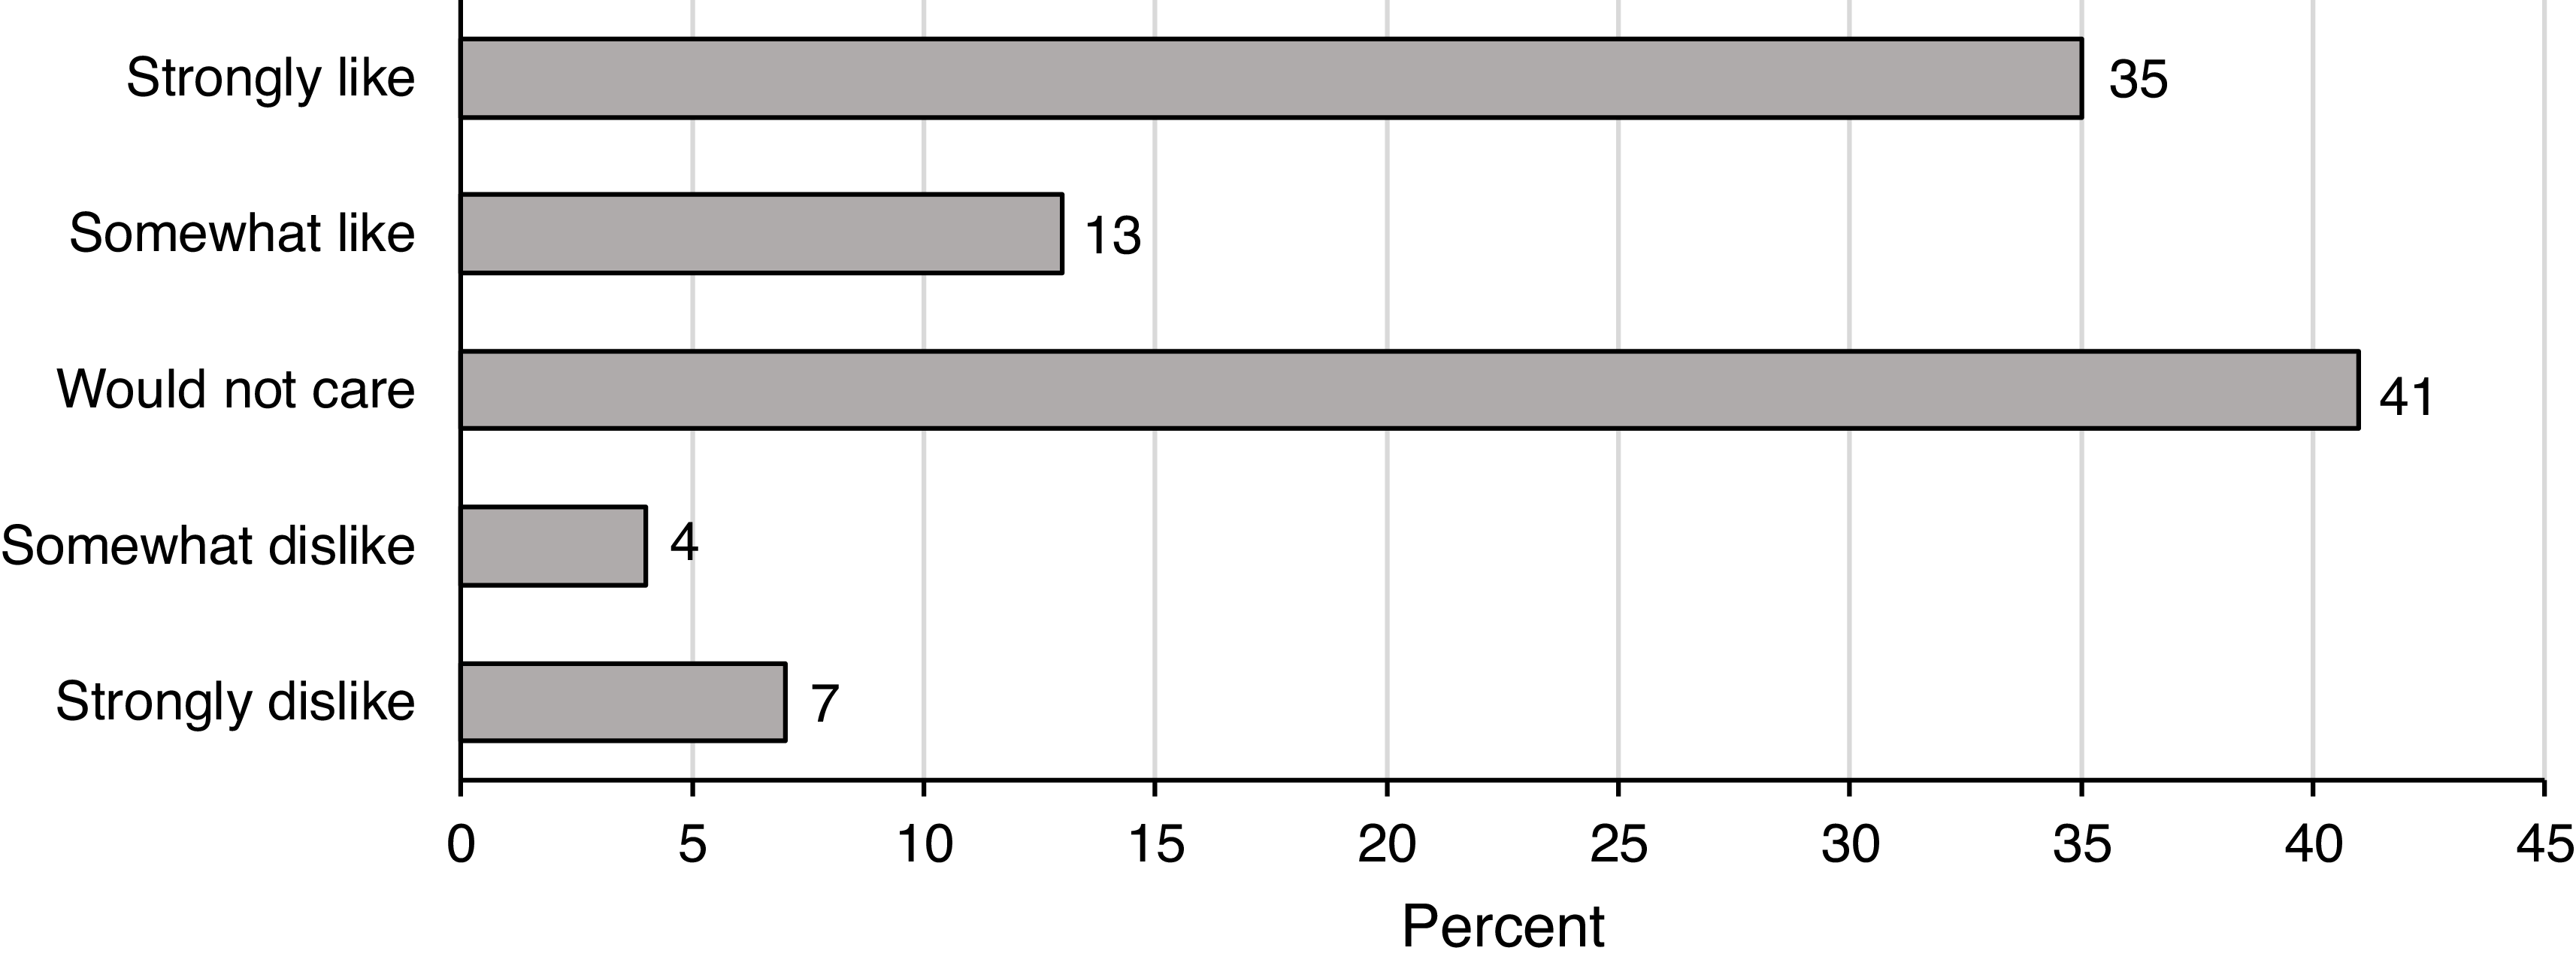
Marry from outgroup captures respondents’ approval of interethnic marriage. It is derived from the survey question: “Please tell me whether you would like having a family member marry a person from a different ethnic group, dislike it, or not care?” Responses were recorded on a five-point ordinal scale ranging from “1 = Strongly dislike” to “5 = Strongly like.” Responses such as “Don’t know,” “Not applicable,” and “Refused to answer” were treated as missing.
Figure 1 presents the distribution of these responses. The figure shows that most Africans are either indifferent or positively inclined toward interethnic marriage. Specifically, 48% of respondents indicated they would “Somewhat like” or “Strongly like” such a union, and 41% reported they “Wouldn’t care.” In contrast, only 11% expressed disapproval by selecting “Somewhat dislike” or “Strongly dislike.” A limitation of the dependent variable is its failure to capture the gender of the individual marrying into the ethnic outgroup. This is because research has shown that people are more willing to allow sons to marry an ethnic outgroup member than daughters (Shair-Rosenfield and Liu Reference Shair-Rosenfield and Liu2023). It is difficult to address this particular issue because this study relies on secondary data, which forces me to fit my research into the mold of pre-existing questions. Within the context of this study, I adopt a broad approach that captures all family members regardless of their gender.
Acceptability of interethnic marriage in Africa. Notes: The figure illustrates the degree to which respondents approve of a family member marrying an individual from a different ethnic group. The vertical axis shows the scale of approval, while the horizontal axis indicates the percentage. The figure is based on data from round 9 of the Afrobarometer survey, conducted between 2021 and 2023.

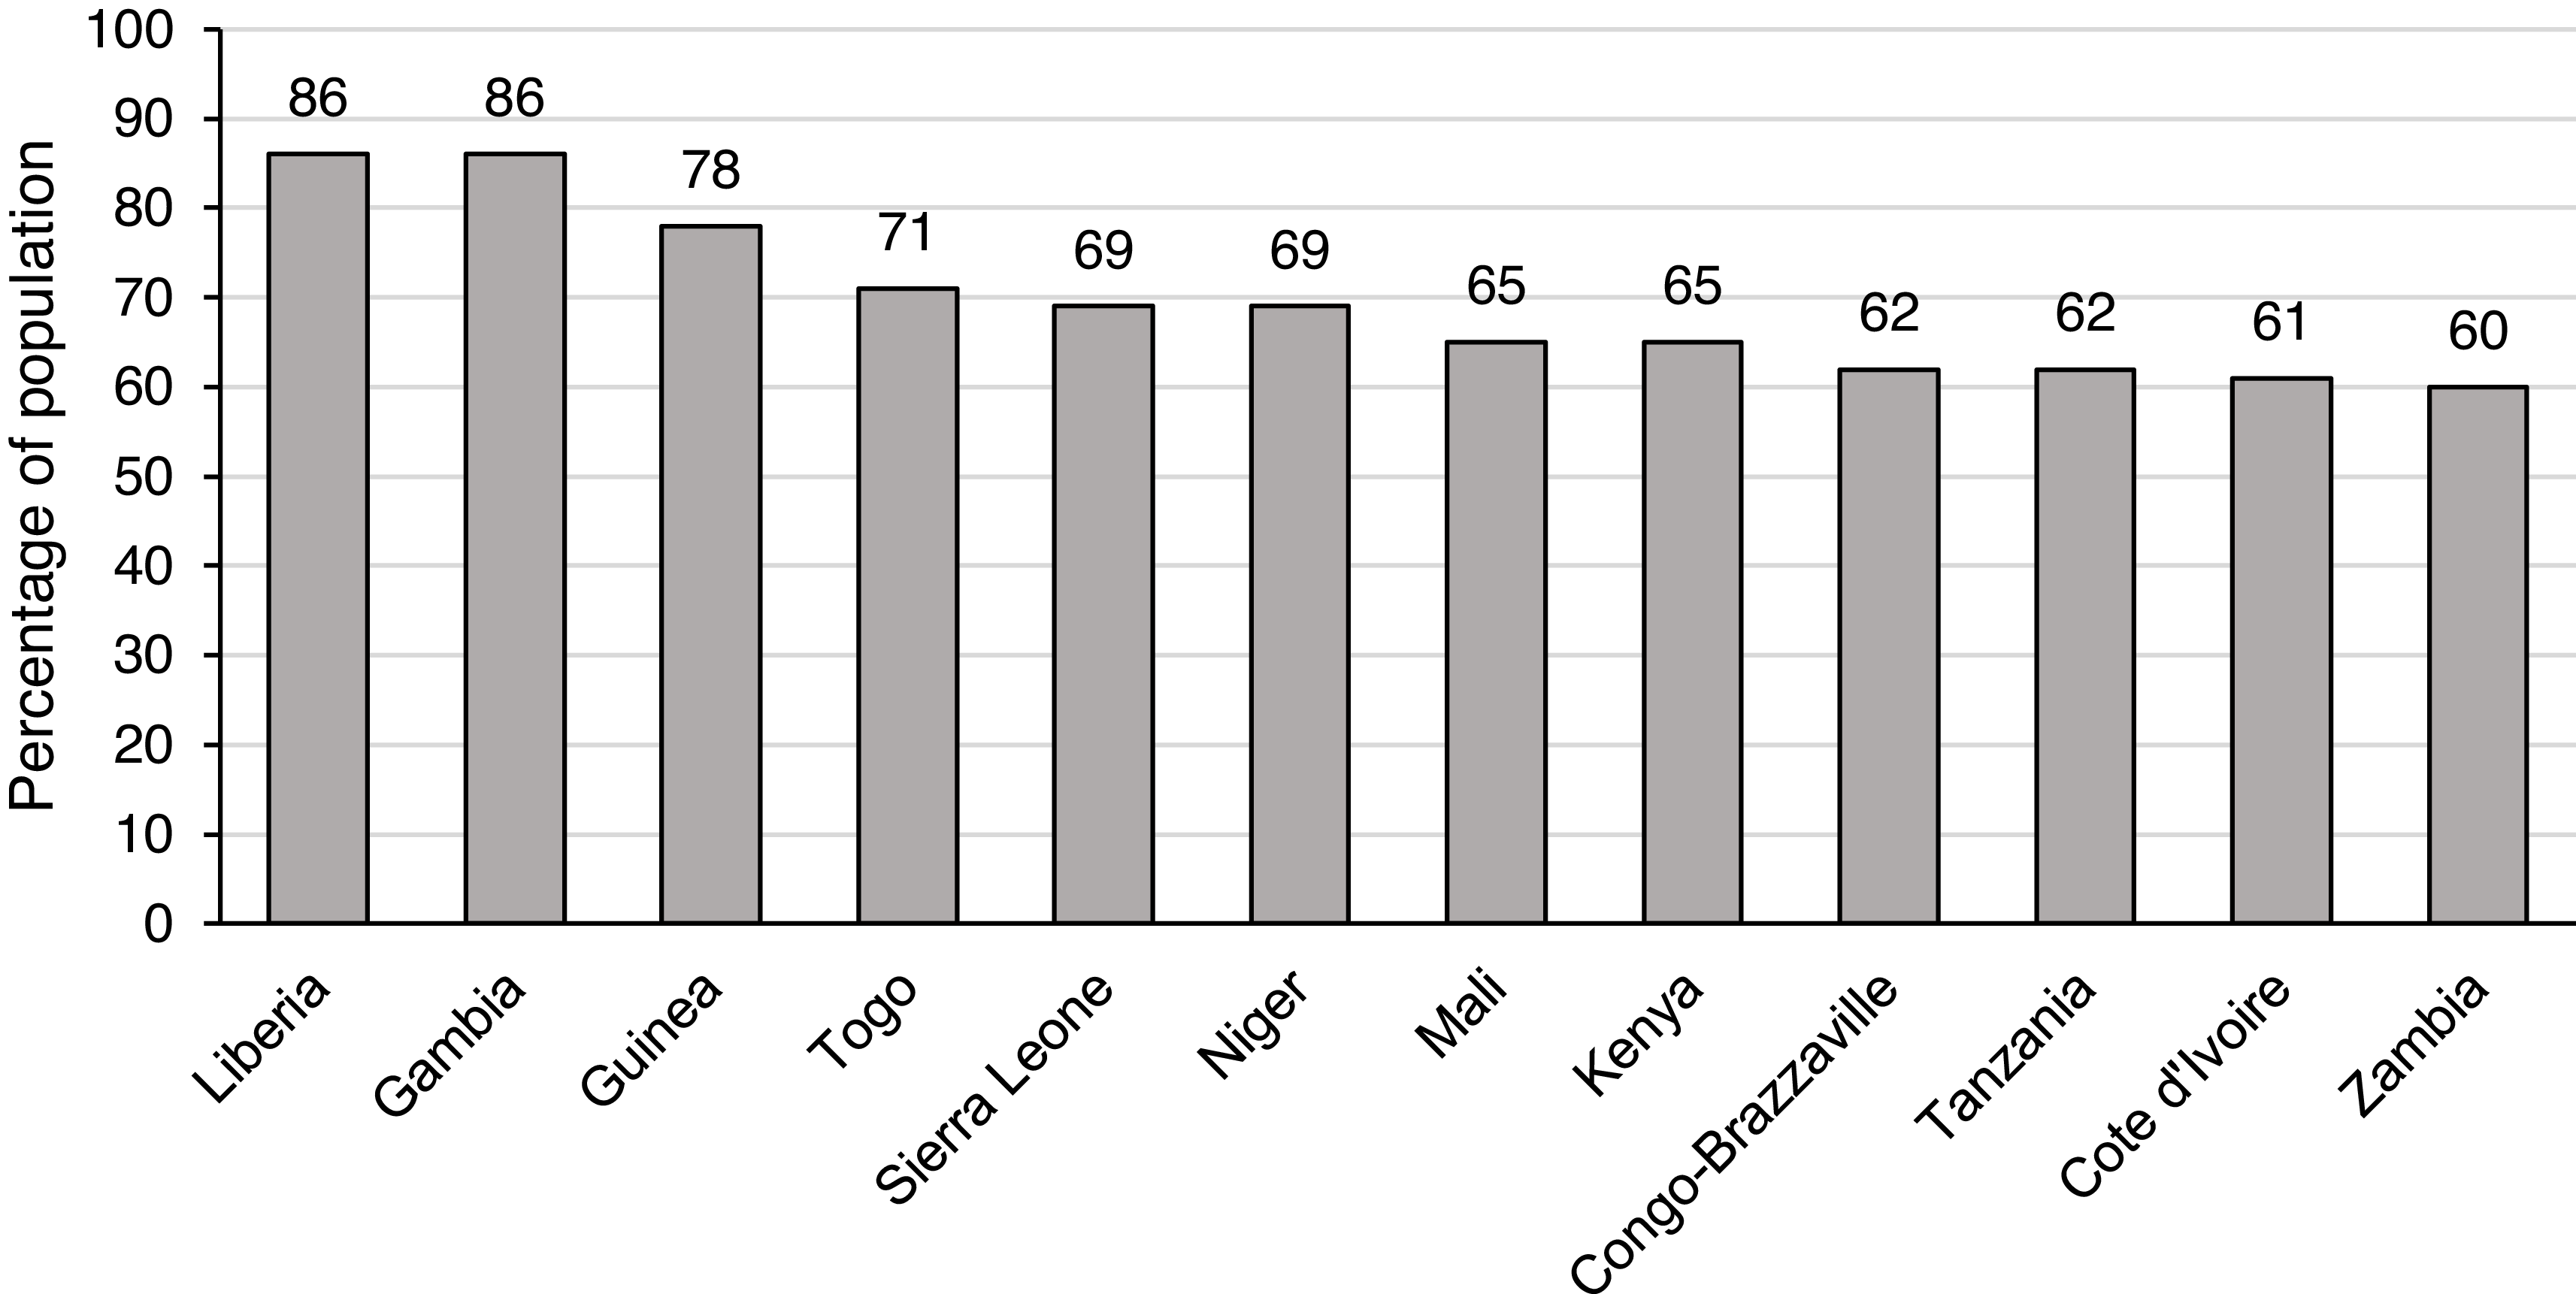
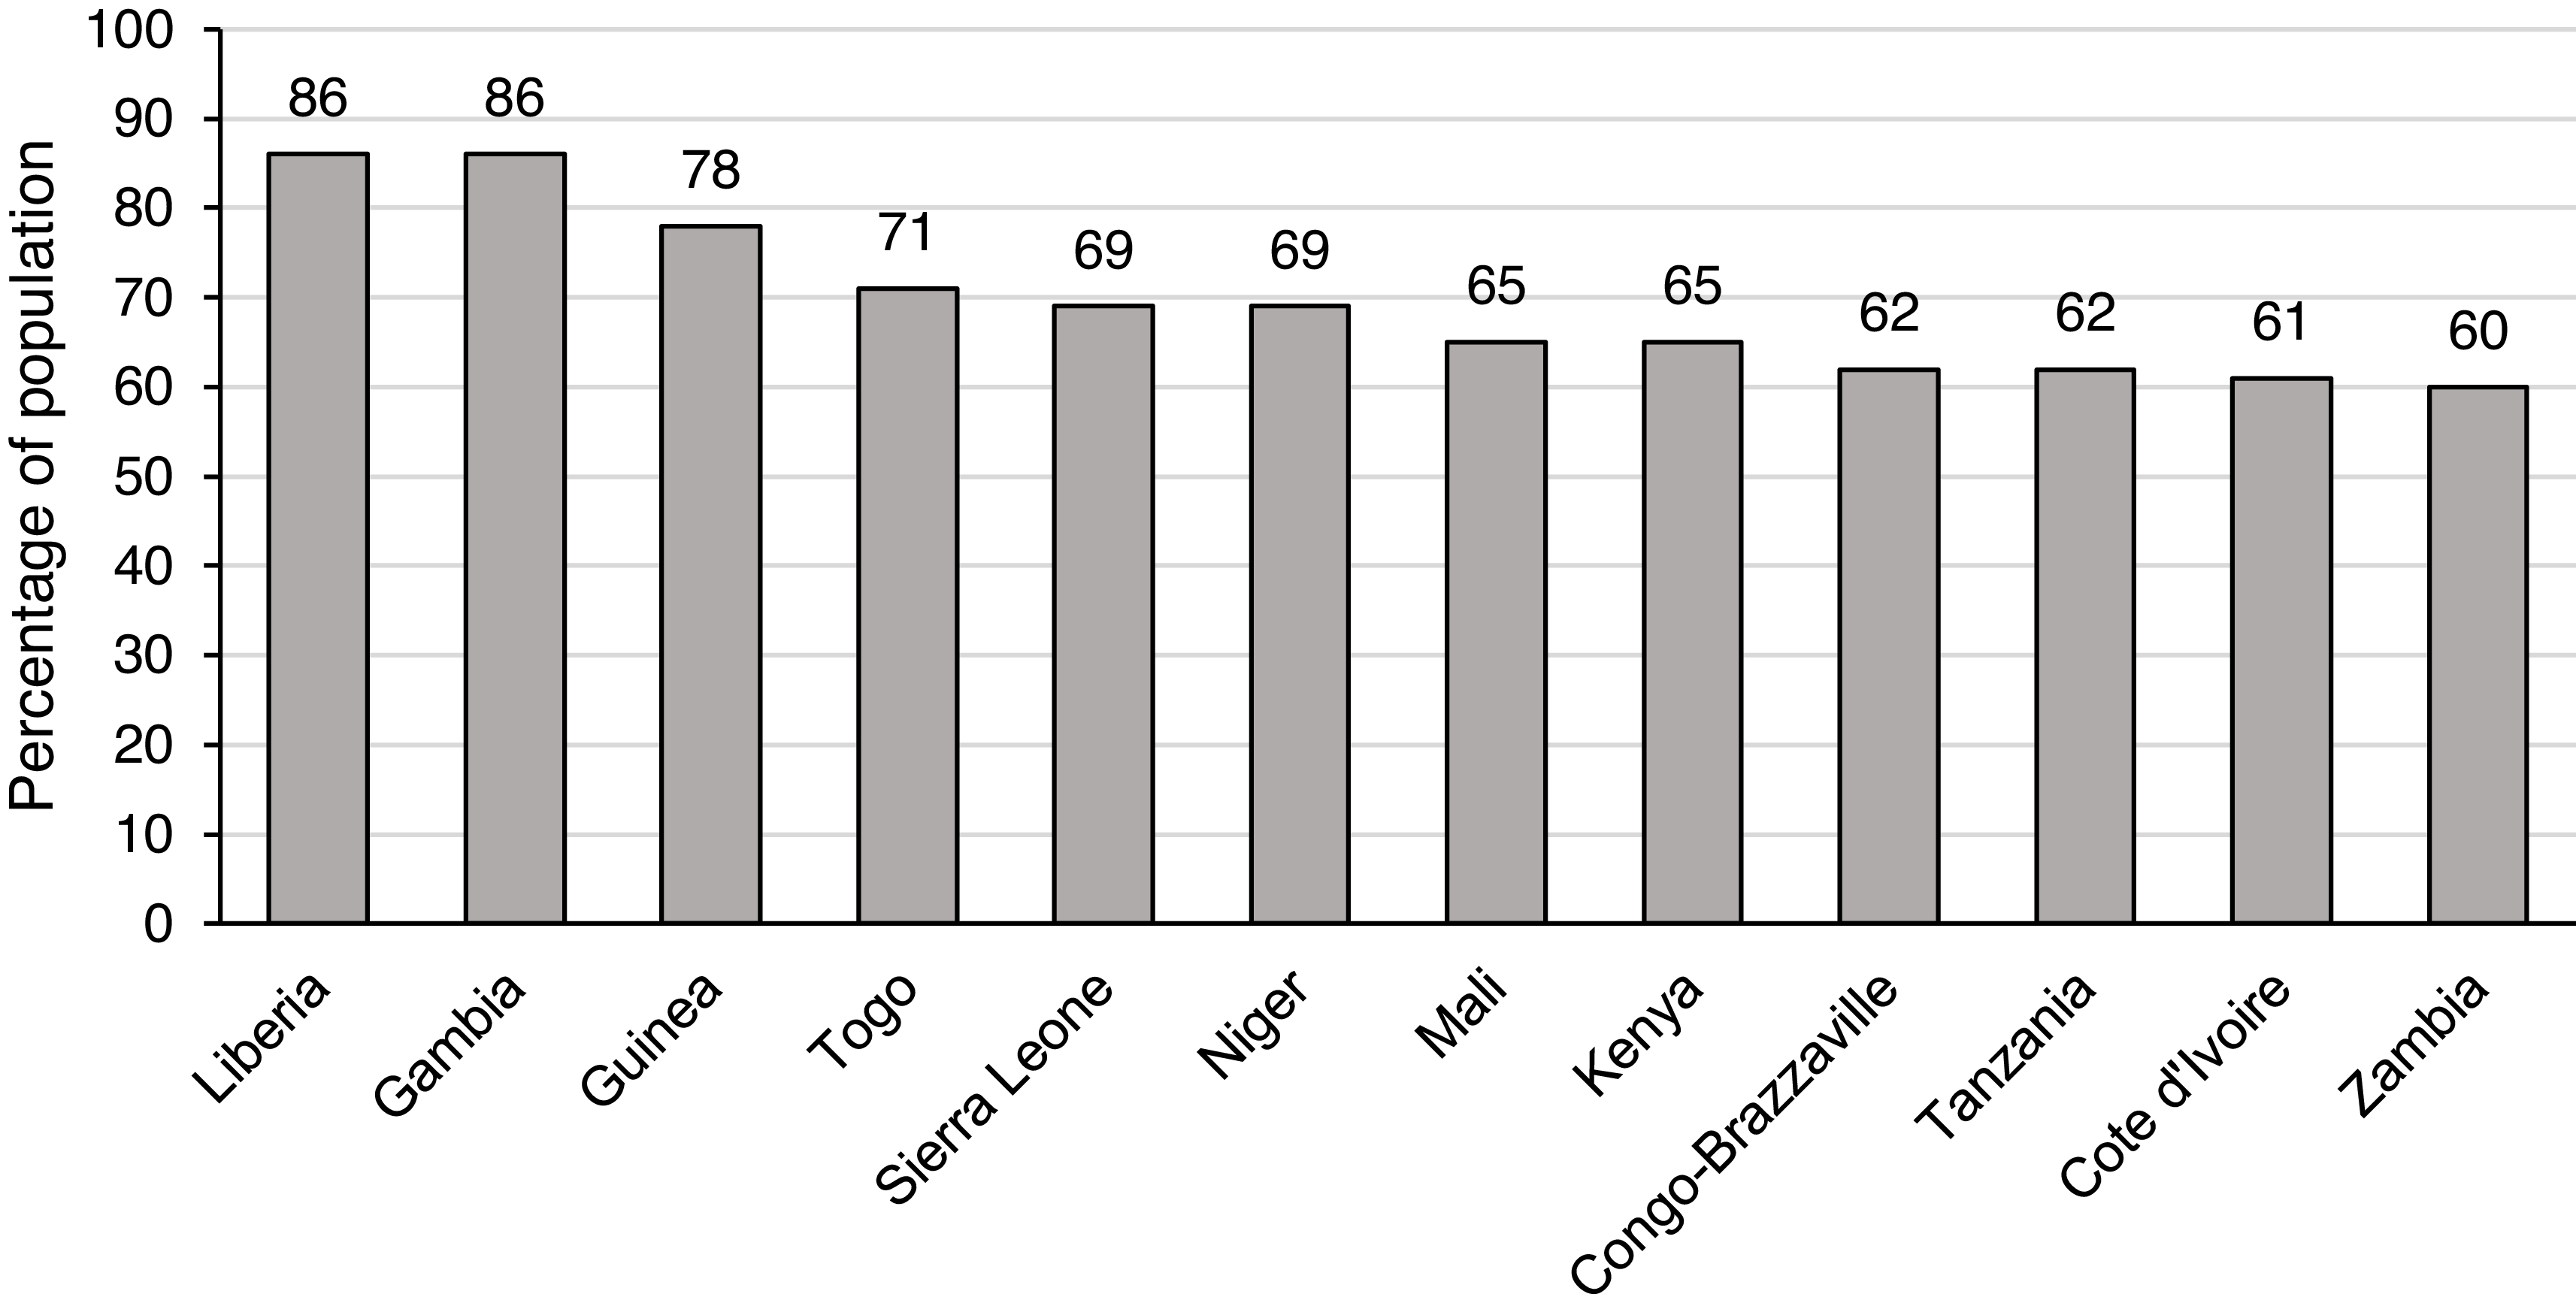
Figure 2 shows the twelve African countries recording the highest level of support for interethnic marriage. Liberia and The Gambia record the highest level of support, with 86% of their respective populations either strongly or somewhat liking the idea of a family member marrying an individual from a different ethnic group. Guinea comes in third place with 78%, while Togo and Sierra Leone/Niger come in fourth and fifth places, with 71% and 69% of their respective populations supporting such a union.
African countries seeing the highest levels of support for interethnic marriage. Notes: The vertical axis represents the percentage of the population in each country who would either “somewhat like” or “strongly like” a family member marrying an individual from a different ethnic group. The horizontal axis lists the 12 countries recording the highest levels of support for such a union. The data are drawn from round 9 of the Afrobarometer surveys conducted between 2021 and 2023.
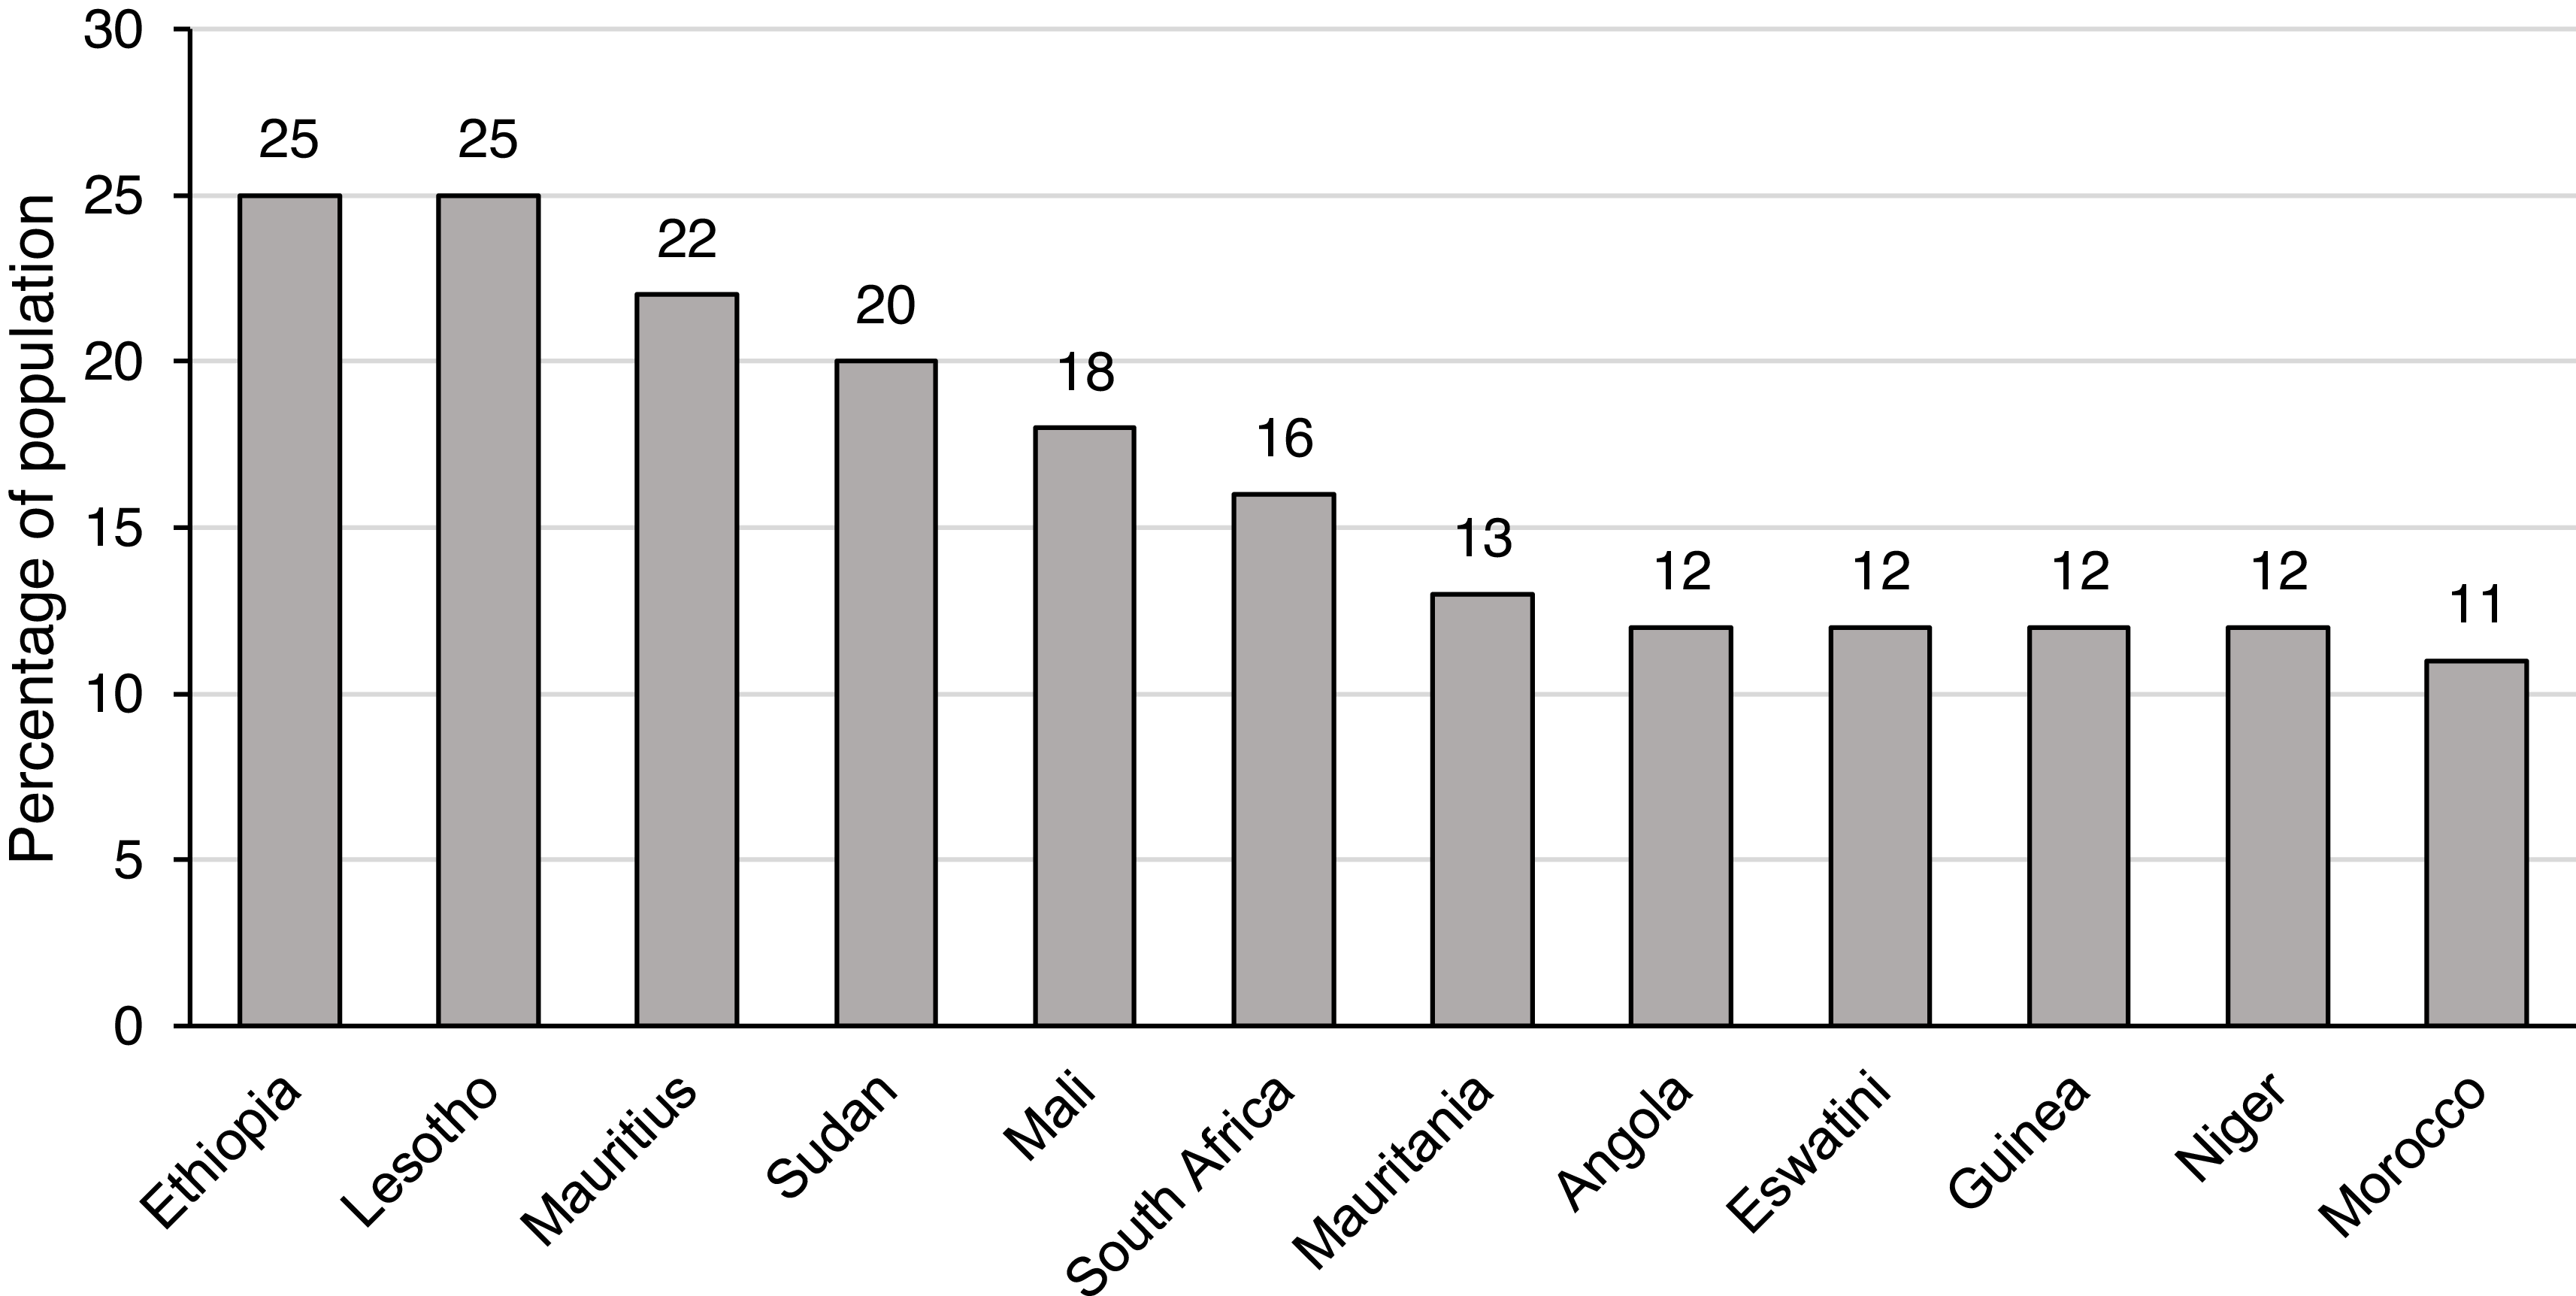
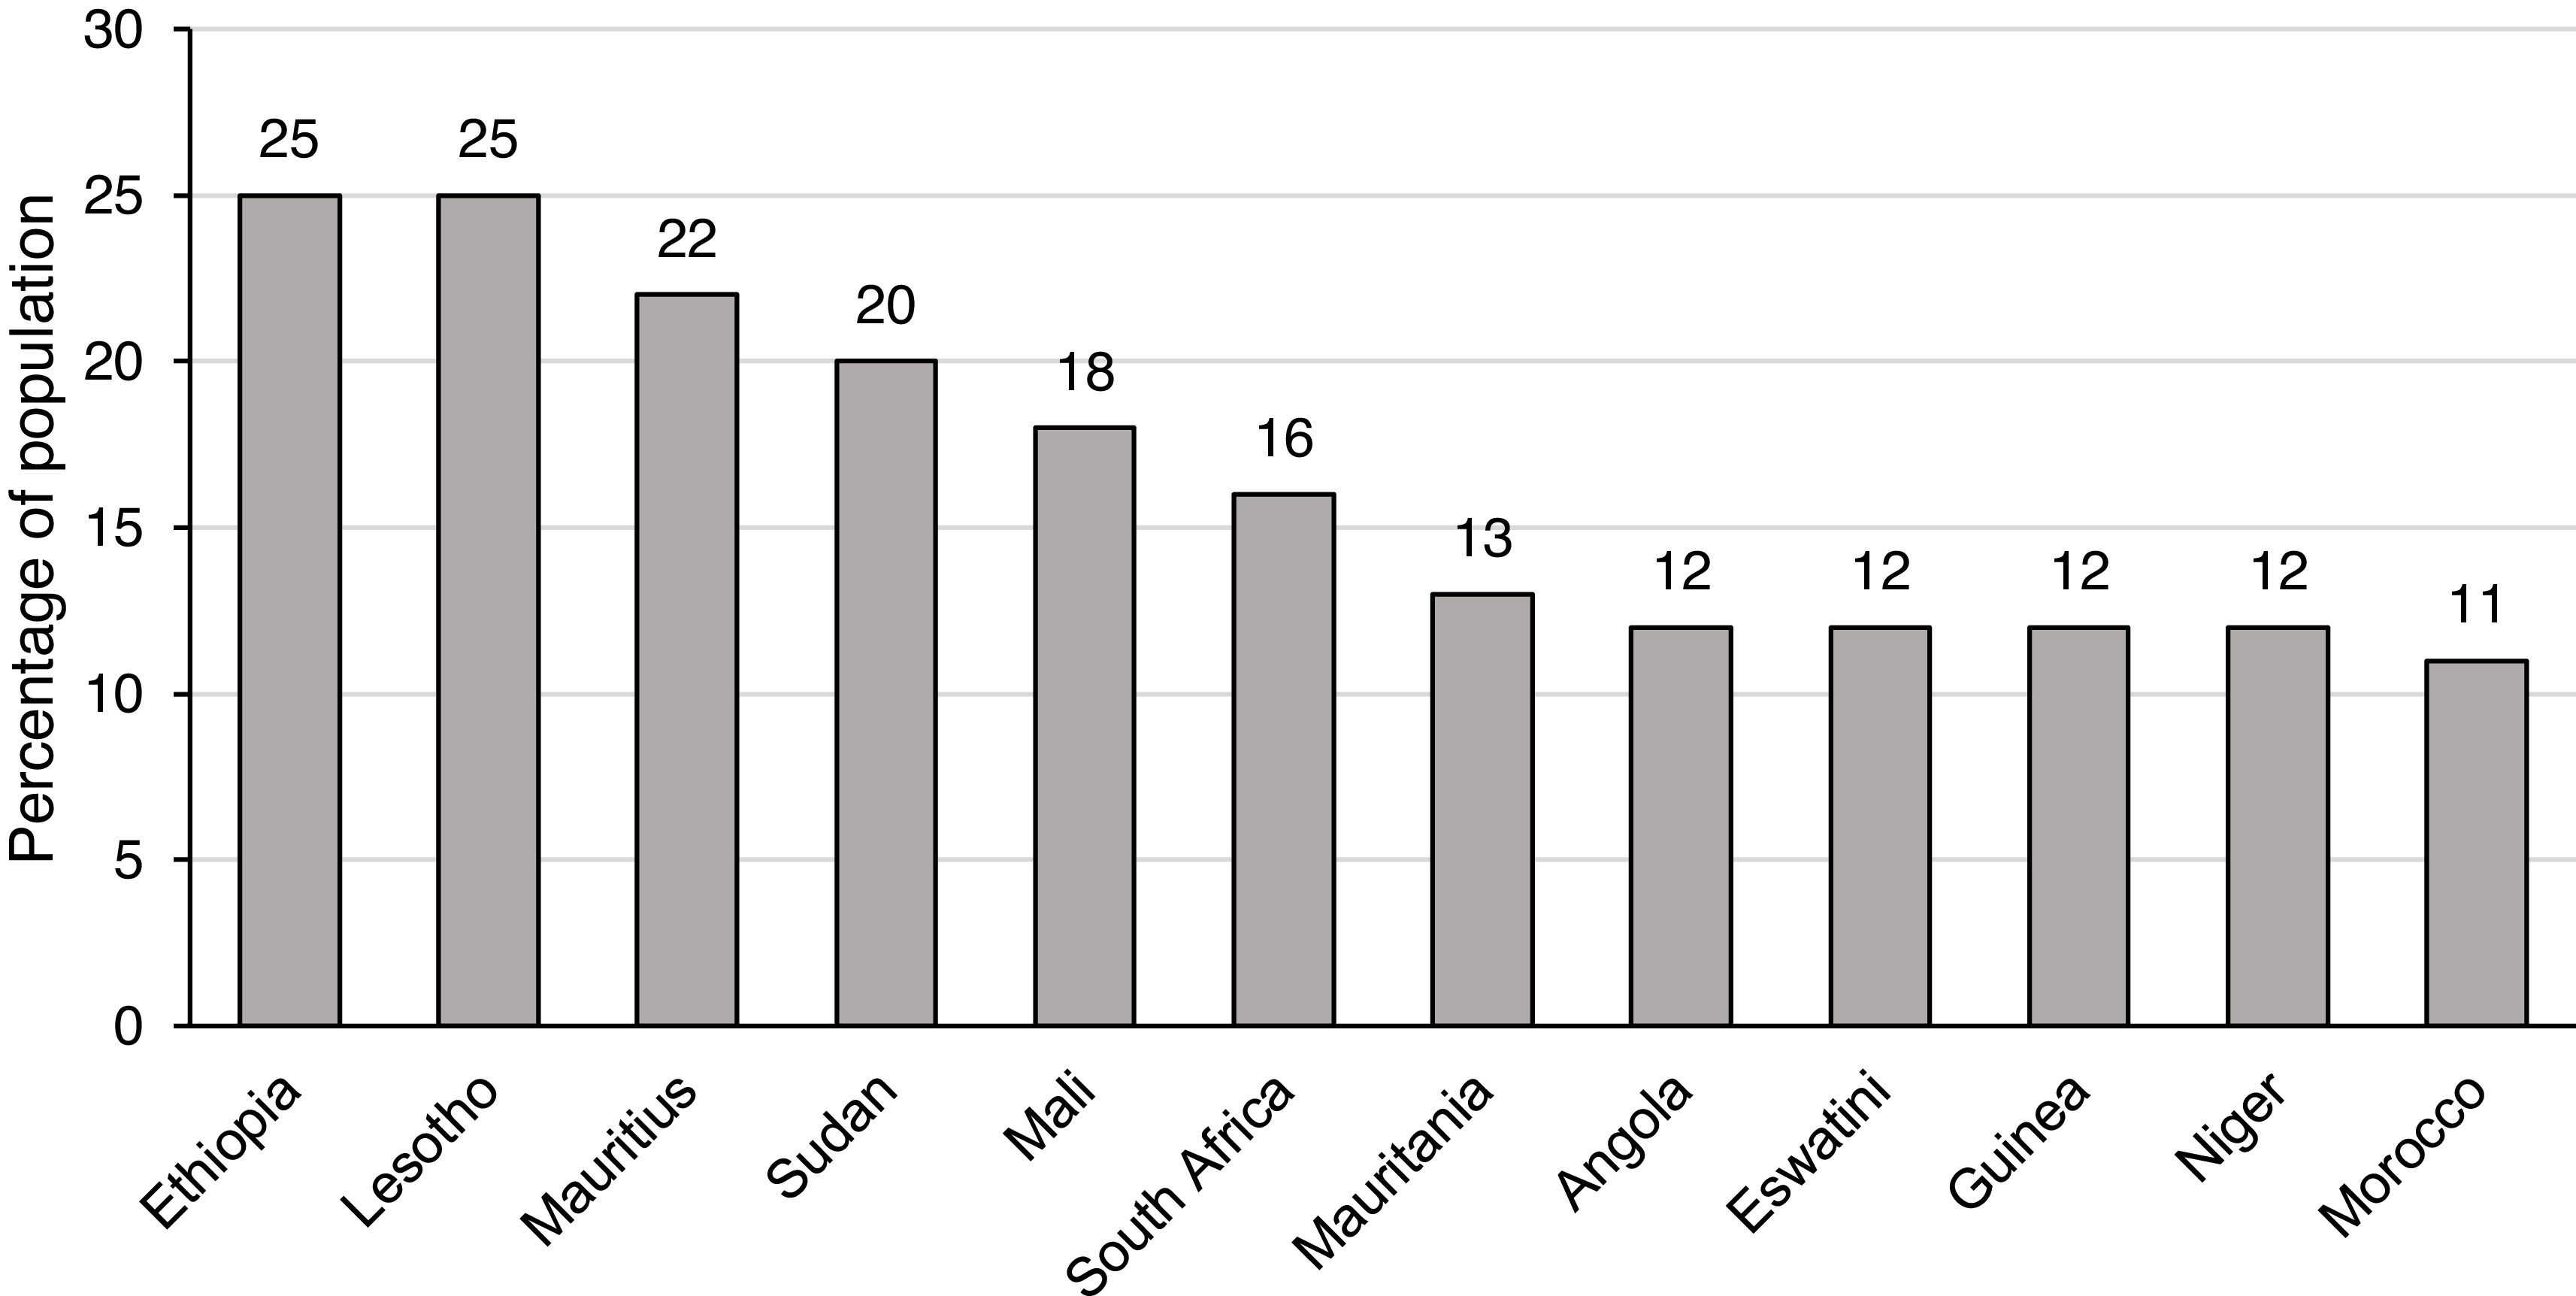
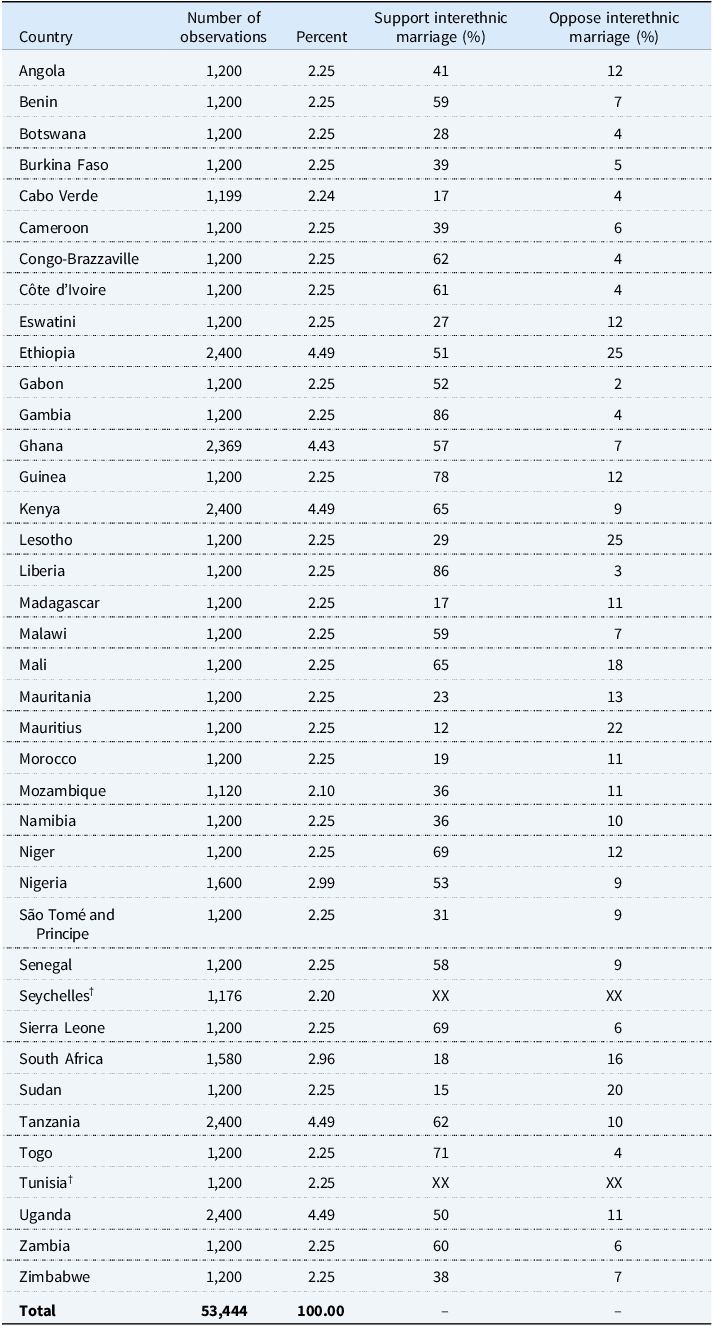
By contrast, Figure 3 shows the twelve countries recording the highest level of opposition to interethnic marriage. Ethiopia and Lesotho rank first, with 25% of their respective populations either strongly or somewhat disliking the idea of a family member marrying from an ethnic outgroup. Mauritius comes in third place with 22%, while Sudan and Mali come in fourth and fifth places, with 20% and 18%, respectively. Notably, support for interethnic marriage in all the countries was higher than opposition to it. Table A1 in the Appendix shows the percentage of support and opposition for interethnic marriage in all countries in the sample.
African countries seeing the highest levels of opposition to interethnic marriage. Notes: The vertical axis represents the percentage of the population in each country who would either “somewhat dislike” or “strongly dislike” a family member marrying an individual from a different ethnic group. The horizontal axis lists the 12 countries recording the highest levels of opposition to such a union. The data are drawn from round 9 of the Afrobarometer surveys conducted between 2021 and 2023.
Explanatory Variable
Ethnic identification is a dummy variable coded as 1 if respondents prioritize their ethnic identity over their national identity, and 0 otherwise. The variable is derived from the question:
Let us suppose that you had to choose between being a [Respondent’s nationality] and being a [Respondent’s ethnic group]. Which of the following statements best expresses your feelings?”
The responses were measured on the following five-point scale:
-
1 = I feel only [Respondent’s ethnic group]
-
2 = I feel more [Respondent’s ethnic group] than [Respondents nationality]
-
3 = I feel equally [Respondent’s nationality] and [Respondent’s ethnic group]
-
4 = I feel more [Respondent’s nationality] than [Respondent’s ethnicity]
-
5 = I feel only [Respondent’s nationality]
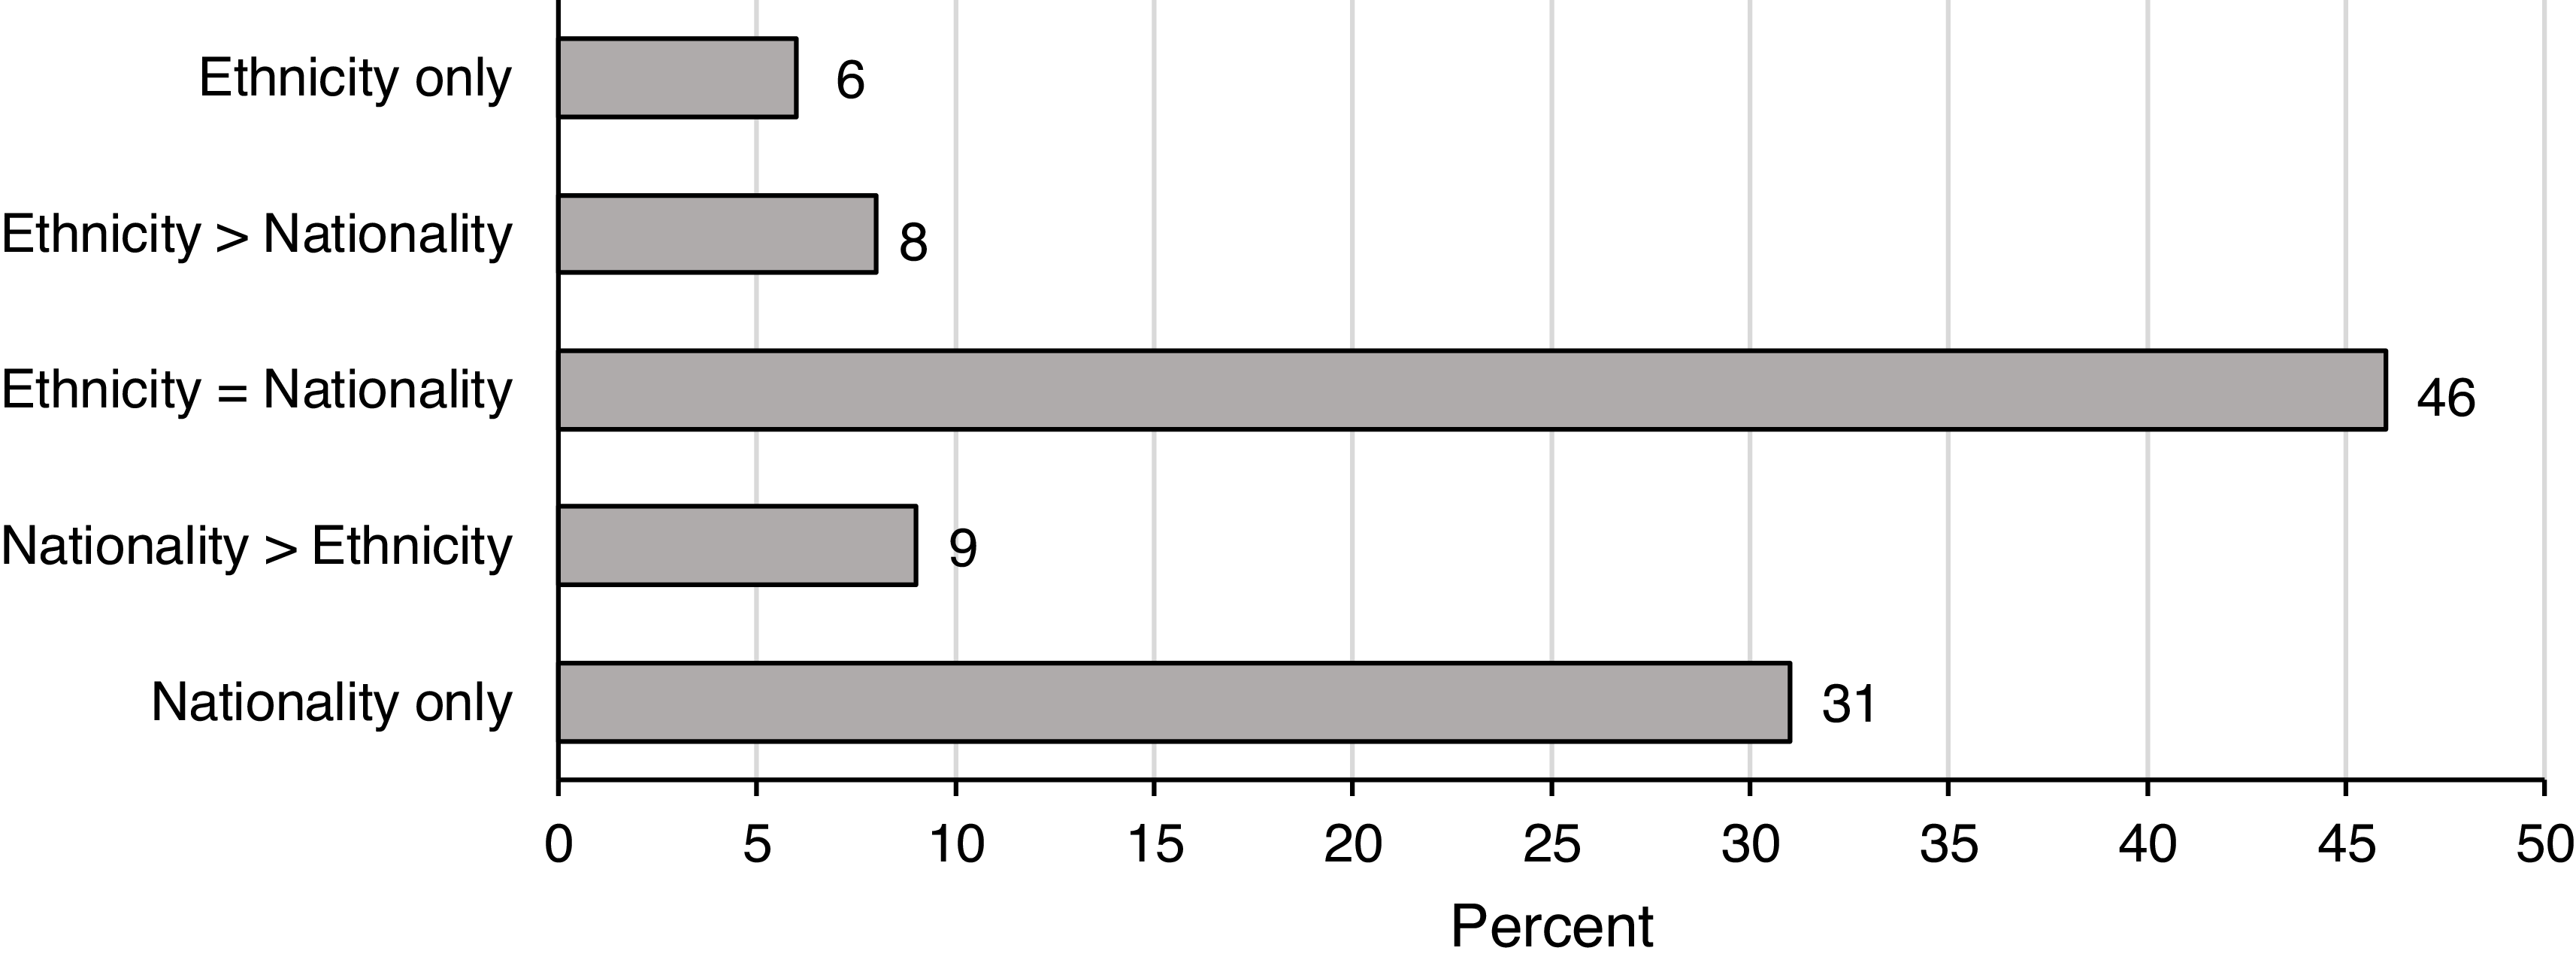
Figure 4 displays the explanatory variable on a bar chart. The data show that nearly half of the respondents (46%) identify equally with their ethnicity and nationality. Additionally, 31% identify exclusively with their nationality, and 9% identify more with their nationality than their ethnicity. In contrast, 6% identify exclusively with their ethnicity, and 8% identify more with their ethnicity than their nationality. To construct the explanatory variable, I assigned a code of 1 to respondents who prioritize their ethnic identity (those identifying exclusively or predominantly with their ethnicity) and 0 to all other categories. This binary coding isolates respondents who explicitly prioritize ethnic identity over national identity.
National versus ethnic identification in Africa. Notes: The figure shows the degree to which respondents identify with their ethnicity relative to their nationality. The vertical axis shows the scale of identification, while the horizontal axis shows the percentage. The figure is based on data from round 9 of the Afrobarometer survey, conducted between 2021 and 2023.

I created an alternative version of the explanatory variable—Ethnic Identification 2—in which I coded respondents as 1 if their ethnic identity is dominant or equal to their national identity. I coded those who identify predominantly or exclusively with their nationality as 0. This recoding allows me to clearly distinguish individuals for whom national identity is dominant from those for whom it is not. I used this variable to conduct a robustness check.
Control Variables
Lived poverty index captures the frequency with which respondents and their household members lacked access to five basic necessities during the past year: food, water, medical care, cooking fuel, and cash income. Responses were recorded on a five-point scale ranging from “0 = Never” to “4 = Always.” The values assigned to the responses were summed across the five items to create the index, ranging from 0 to 20, with higher scores denoting more poverty. The five items yielded a Cronbach’s alpha statistic of 0.78, which indicates strong internal reliability. Poverty may intensify prejudice toward ethnic outgroups, particularly when members of dominant groups or host communities perceive outgroups as competitors for limited state-provided resources. Such tensions can be further inflamed when political or community leaders scapegoat minority groups during periods of economic hardship (e.g., Courtin et al. Reference Courtin, Nellis and Weaver2023; Everatt Reference Everatt2011; Tuki Reference Tuki2026).
Economic development measures the mean annual nighttime light intensity (Ghosh et al. Reference Ghosh, Baugh, Elvidge, Zhizhin, Poyda and Hsu2021) within a 30 km radius of respondents’ dwellings in 2020. I developed this variable using QGIS software, as the raw nighttime light data is in raster format.Footnote 4 Values range from 0 to 63, with higher ones denoting greater levels of economic development. Notably, research has found that nighttime light is a robust proxy for economic activity (Mellander et al. Reference Mellander, Lobo, Stolarick and Matheson2015; Weidmann and Schutte Reference Weidmann and Schutte2017; Weidmann and Theunissen Reference Weidmann and Theunissen2021). The mechanisms through which economic development influences prejudice are similar to those of the poverty index, with the distinction that human well-being is measured here at the communal level rather than the individual level.
Education level is measured on a ten-point ordinal scale ranging from “0 = No formal education” to “9 = Postgraduate or higher.” Previous research has found a positive correlation between education and tolerance towards ethnic outgroups (e.g., Schlueter et al. Reference Schlueter, Masso and Davidov2019; Strabac et al. Reference Strabac, Aalberg and Valenta2013).
Conflict exposure measures the cumulative number of violent conflict incidents occurring within a 30-kilometer radius of respondents’ dwellings, from 1989 up to one year prior to the respective country surveys. For example, for surveys conducted in 2023, the variable captures incidents between 1989 and 2022. This one-year lag is introduced to attenuate the problem of reverse causation, while the extended time frame captures the cumulative legacy of violence. This approach is supported by research showing that past violence continues to influence contemporary behavior (e.g., Stojetz and Brück Reference Stojetz and Brück2023; Tuki Reference Tuki2024a).
The variable was constructed using QGIS software to merge georeferenced Afrobarometer survey data with conflict event data from the Uppsala Conflict Data Program’s Georeferenced Events Database (UCDP-GED) (Sundberg and Melander Reference Sundberg and Melander2013).Footnote 5 Notably, the UCDP-GED records only incidents resulting in at least one fatality for conflict dyads that have in any given year covered by the dataset reached 25 fatalities. Prior research suggests that such exposure makes intergroup boundaries salient, increasing prejudice toward ethnic outgroups (Tuki Reference Tuki2025a, Reference Tuki2024b).
Rural residence is coded as 1 if a respondent resides in a rural area and 0 if in an urban area. Some studies have shown that rural residents tend to exhibit greater prejudice than those living in urban centers (Bunn et al. Reference Bunn, Solomon, Varni, Miller, Forehand and Ashikaga2008; Chakraborti and Garland Reference Chakraborti and Garland2004).
Demographic covariates include gender and age. Gender is coded as 1 for female and 0 for male, while age is measured in years.
Religious affiliation constitutes a series of dummy variables for each of the five major religious categories (Muslim, Christian, Traditional/ethnic religion, Other religion, and No religion), coded as 1 if a respondent belongs to the religious group of interest and 0 otherwise. For instance, the dummy variable Christian is coded as 1 if a respondent identifies as a member of that group and 0 if they belong to any of the other four groups. I use No religion as the reference category in the regression models.
Notably, the category Other religion consists of respondents who belong to religious groups besides Islam, Christianity, and traditional religion. This includes Buddhists, Hindus, and Jews. These groups were combined into a single category because they constitute only a small fraction of the sample. The No religion category consists of agnostics, atheists, and individuals who explicitly stated that they do not have a religion. It is important to point out that Africans are typically either Muslims or Christians (Tuki Reference Tuki2025b).
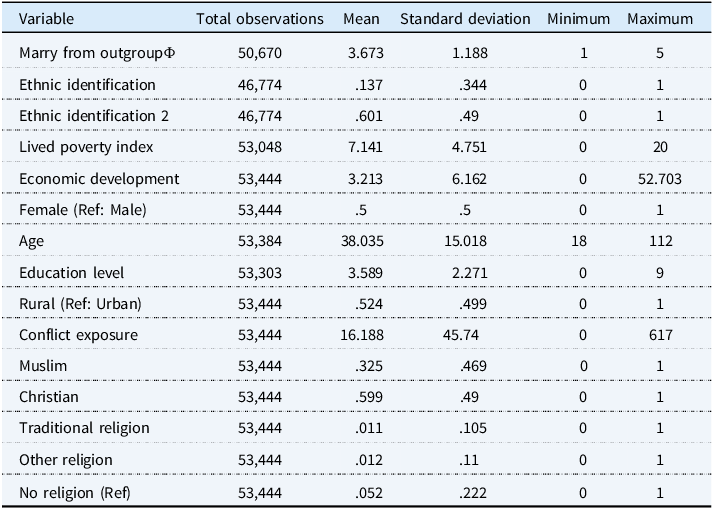
Table 1 presents the summary statistics of the variables used to estimate the regression model.
Descriptive statistics

Notes: Φ indicates the dependent variable. “Ref” denotes the reference category. The question from which the dependent variable “Marry from outgroup” was derived was not asked in Tunisia and Seychelles, while the question underlying the explanatory variable “Ethnic identification” was not asked in Tunisia, Sudan, and Seychelles. This, coupled with “Refused to answer” and “Don’t know” responses—which were treated as missing observations—exacerbated the problem of listwise deletion in the regression models.
Analytical Technique
To examine the relationship between national identification and attitudes toward interethnic marriage, I consider a model of the following general form:
 $${\gamma _{ijk}} = {\beta _0} + {\beta _1}Ethnic\ identificatio{n_i} + {\beta _2}{{\varphi '}_i} + {\Pi _j} + {\Omega _k} + {\mu _i}$$
In this equation, γ ijk is the dependent variable, which measures the extent to which Respondent i, who resides in Country j and belongs to ethnic group k, approves of a family member marrying an individual from a different ethnic group; φ′ i is a vector of control variables; β 0 is the intercept; β 1 is the coefficient for the explanatory variable, while β 2 is a vector of coefficients for the controls. Π j denotes country fixed effects, which account for time-invariant factors such as colonial history and cultural factors that are unique to the respective countries; Ω k denotes ethnic group fixed effects, which account for time-invariant factors unique to the respective ethnic groups, such as historical marginalization, group size, and group norms. Finally, μ i is the error term.
Because the dependent variable is measured on an ordinal scale, I estimated the model using an ordered logit (Ologit) regression. This approach is appropriate for ordinal outcomes because it accounts for the ranked nature of the dependent variable and allows for an examination of how the explanatory variable relates to each category of the outcome.
Results and Discussion
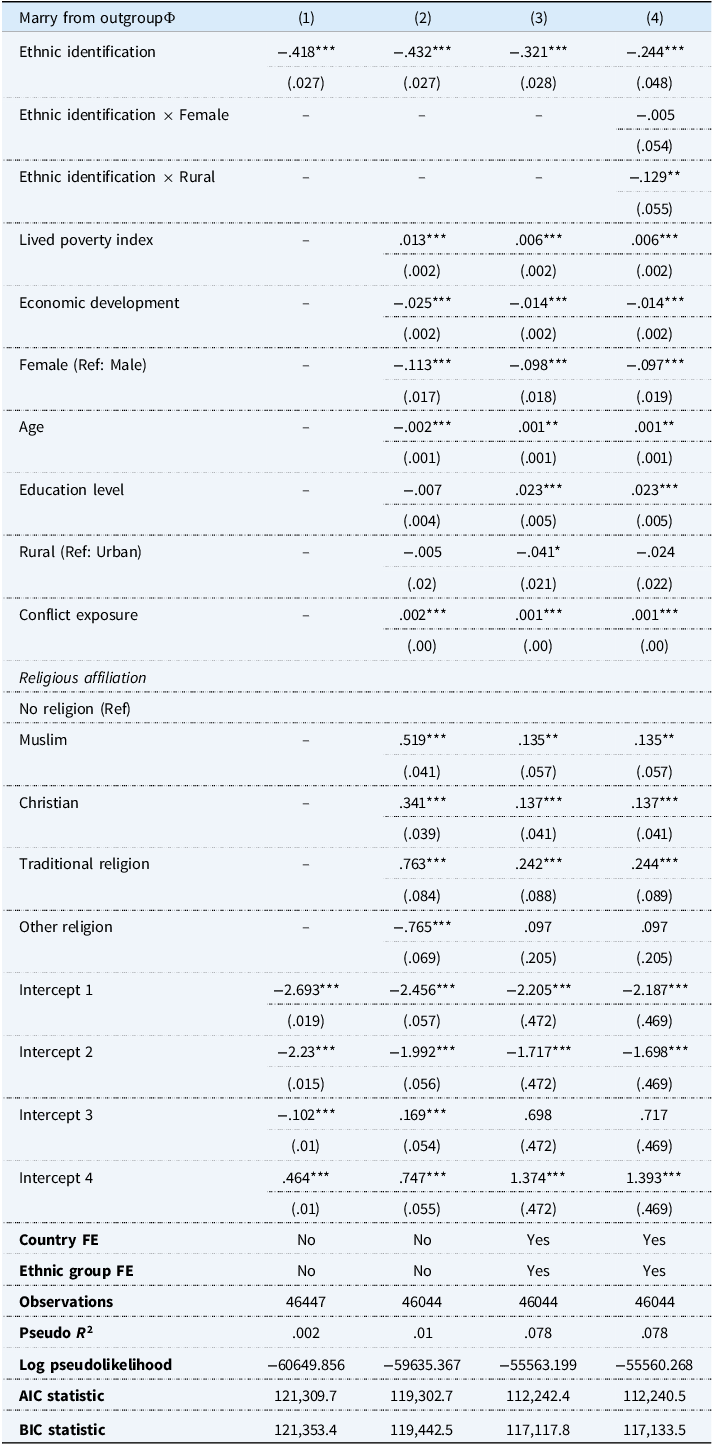
Table 2 presents the results of regression models examining the relationship between ethnic identification and attitudes toward interethnic marriage. I begin with a baseline specification (Model 1) that includes only the ethnic identification variable. Consistent with Hypothesis1, the coefficient is negative and statistically significant at the 1% level, indicating that individuals who prioritize their ethnic identity over their national identity are significantly less likely to approve of interethnic marriage compared to those who do not. As highlighted in the theoretical section, this observed pattern may be rooted in ingroup projection. Specifically, individuals who identify strongly with their ethnicity project their group norms, values, and characteristics onto the broader superordinate identity, such as nationality. These individuals use their subgroup as the yardstick to evaluate members of other ethnic groups. Groups perceived as aligning closely to the projected prototype are viewed favorably, while those who deviate from it are treated unfavorably—hence making an individual more likely to disapprove of a union between a family member and someone from a different ethnic group.
Ordered logit models regressing attitudes toward interethnic marriage on ethnic identification in Africa
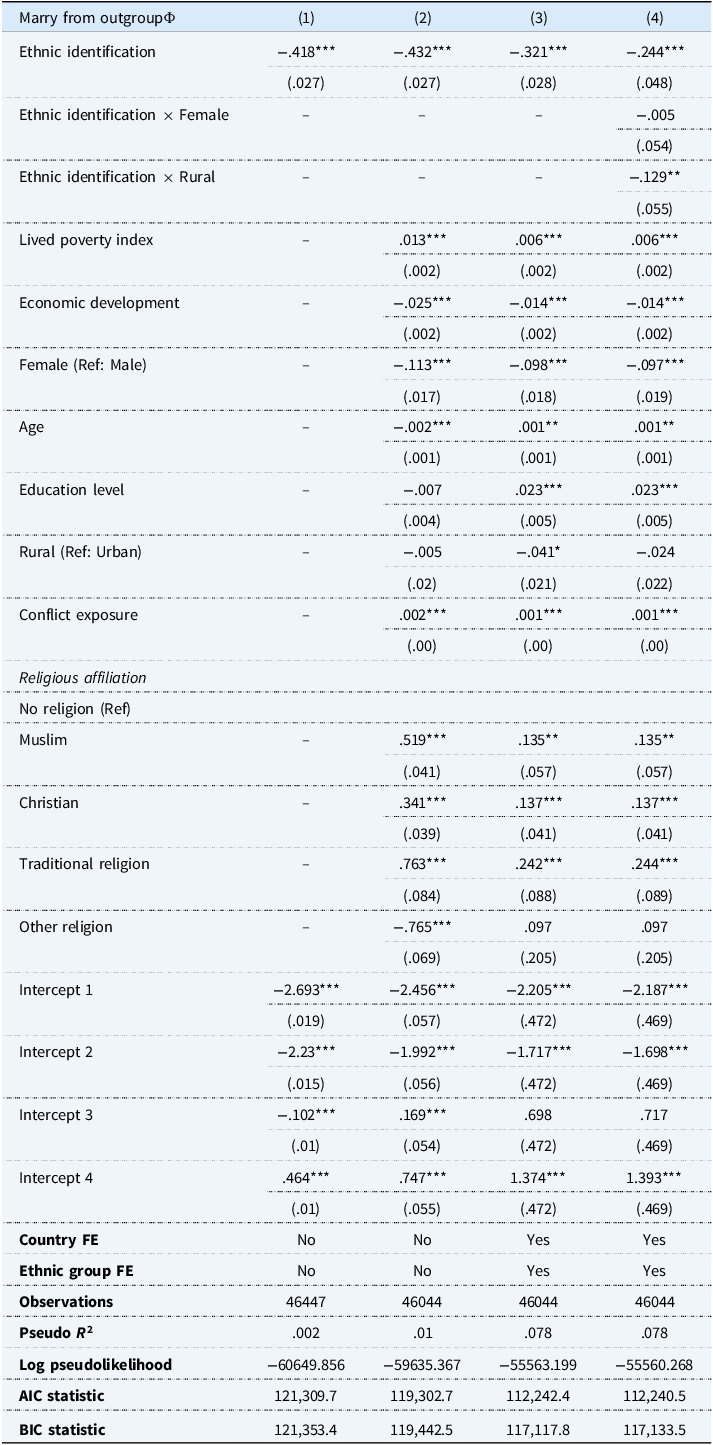
Notes: Φ indicates the dependent variable; “FE” denotes fixed effects; “Ref” indicates the reference category. Robust standard errors are in parentheses. *** p < .01, ** p < .05, * p < .10. All models are estimated using ordered logit regression. The dependent variable, measured on a five-point ordinal scale ranging from “1 = Strongly dislike” to “5 = Strongly like,” captures respondents’ approval of a family member marrying an individual from a different ethnic group. AIC = Akaike Information Criterion; BIC = Bayesian Information Criterion. The regression models are based on data from Round 9 of the Afrobarometer survey, conducted between 2021 and 2023.
The negative correlation observed in the baseline model remains robust after control variables are included (Model 2) and when country and ethnic group fixed effects are added (Model 3). All control variables are statistically significant, except for Other religion. The positive coefficient for the Lived poverty index suggests that poorer individuals are more likely to support interethnic marriage. Likewise, the negative coefficient for Economic development indicates that higher levels of development are associated with lower support for interethnic marriage. Together, these results contradict findings from studies reporting a positive correlation between poverty and prejudice (e.g., Courtin et al. Reference Courtin, Nellis and Weaver2023; Gordon Reference Gordon2015). One possible explanation is that ethnic ingroup favoritism functions as a mechanism for protecting access to material or symbolic resources. While wealthier individuals may perceive interethnic marriage as a threat to their social status or class position, individuals living in poverty may have fewer incentives to rigidly police ethnic boundaries, potentially fostering greater openness toward ethnic outgroups and interethnic unions.
Beyond socioeconomic status, demographic characteristics also reveal distinct patterns. Gender, in particular, is strongly associated with attitudes toward interethnic marriage, with women exhibiting lower levels of support than men. This finding contrasts with evidence from Europe, where women are typically found to express lower levels of prejudice toward cultural outgroups than men (e.g., Strabac and Listhaug Reference Strabac and Listhaug2008; Strabac et al. Reference Strabac, Aalberg and Valenta2013). A plausible explanation for this discrepancy lies in gendered patterns of socialization, which shape attitudes toward group loyalty, marriage, and cultural conformity in context-specific ways. In many collectivist societies, women are often socialized to prioritize group cohesion, uphold family honor, and conform to communal norms. These expectations may make women more cautious about crossing ethnic boundaries, particularly through intimate relationships such as marriage (Aboulhassan and Brumley Reference Aboulhassan and Brumley2019; Christianson et al. Reference Christianson, Teiler and Eriksson2020; Cooney Reference Cooney2014; Hasan Reference Hasan2002; Loza Reference Loza2022; Mosquera Reference Mosquera2016). Moreover, the social costs associated with interethnic marriage are often higher for women than for men, especially in patriarchal societies. Women who marry outside their ethnic group may face greater criticism, social stigma, or even rejection from their families. In contrast, men are typically granted greater latitude in partner choice, particularly in contexts where patriarchal norms allow them to “bring others in” without threatening the perceived integrity of the ethnic or family lineage.
Age also carries a negative coefficient, which is consistent with prior studies (e.g., Quillian Reference Quillian1995; Strabac and Listhaug Reference Strabac and Listhaug2008; Strabac et al. Reference Strabac, Aalberg and Valenta2013). By contrast, education exhibits a positive and statistically significant association with support for interethnic marriage. This result is consistent with the well-established view that education exerts a liberalizing effect by exposing individuals to diverse cultures, worldviews, and social norms, thereby fostering greater tolerance (e.g., Schlueter et al. Reference Schlueter, Masso and Davidov2019; Strabac et al. Reference Strabac, Aalberg and Valenta2013). Rural residence is negatively associated with support for interethnic marriage, suggesting that individuals living in rural areas are less supportive of such unions than their urban counterparts. This pattern likely reflects lower levels of ethnic diversity and intergroup contact in rural settings, as well as stronger adherence to traditional norms, including expectations of endogamous marriage.
Finally, the positive coefficient associated with conflict exposure indicates that greater exposure to violent conflict is associated with higher levels of support for interethnic marriage. This finding runs counter to studies arguing that violence heightens the salience of intergroup boundaries and fuels hostility toward ethnic outgroups (e.g., Rohner et al. Reference Rohner, Thoenig and Zilibotti2013; Schutte et al. Reference Schutte, Ruhe and Sahoo2023; Tuki Reference Tuki2025a). Instead, it aligns with research suggesting that experiences of violence can foster empathy and increase support for reconciliation and cooperation across group lines (e.g., Pham et al. Reference Pham, Weinstein and Longman2004). In addition, the coefficients for Muslim, Christian, and Traditional religious affiliation are all positive and statistically significant, indicating that adherents of these religions are more supportive of interethnic marriage than their non-religious counterparts. This contrasts with other studies which show that non-religious individuals exhibit more tolerance toward outgroup members than their religious counterparts (e.g., Galen et al. Reference Galen, Smith, Knapp and Wyngarden2011; Speed and Brewster Reference Speed and Brewster2021), and supports the findings from an Africa-wide study showing that, in the African context where religion is hegemonic, non-religious individuals might express more prejudice than Muslims, Christians, and practitioners of traditional religion (Tuki Reference Tuki2025b). This tendency may stem from resentment arising from perceived value imposition by religious individuals and from stigmatization directed toward non-religious individuals due to their non-belief in God.
Furthermore, religion may redefine acceptable marriage boundaries, thereby weakening ethnic endogamy. Religious individuals are typically embedded in social networks in which shared faith is more salient than ethnic identity, which can increase acceptance of interethnic unions. By contrast, non-religious individuals may lack such cross-cutting affiliations, leaving ethnicity as the primary axis of identity and potentially heightening the salience of ethnic boundaries.
In Model 4, I include two interaction terms. The first multiplies the explanatory variable by gender, while the second multiplies the explanatory variable by rural residence. The aim is to assess whether the relationship between ethnic identification and attitudes toward interethnic marriage is moderated by gender and place of residence. Of these, only the interaction between ethnic identification and rural residence is statistically significant. This term carries a negative coefficient, suggesting that individuals who both live in rural areas and prioritize their ethnic identity over their national one are less likely to support interethnic marriage.
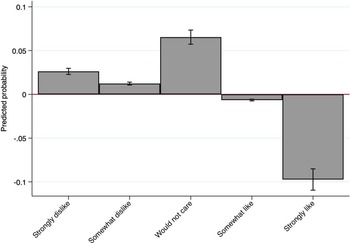
To aid in the interpretation of the ordered logit regression results, I plot the predicted probabilities for the direct association between ethnic identification and attitudes toward interethnic marriage in Figure 5. A glance at the figure shows that this association is most pronounced in the “Strongly like” category of the dependent variable. Moreover, the association is statistically significant across all categories of the outcome. Specifically, individuals who prioritize their ethnic identity over their national one are 9.7 percentage points less likely to “strongly like” the idea of a family member marrying someone from a different ethnic group, compared to those who prioritize their national identity or identify equally with their nationality and ethnicity. In contrast, they are 2.6 percentage points more likely to choose the “Strongly dislike” category and 6.5 percentage points more likely to express indifference.
Predicted probabilities showing the association between ethnic identification and attitudes toward interethnic marriage in Africa. Notes: The figure, based on Model 1 in Table 2, shows the direct association between ethnic identification and each category of the dependent variable, which measures the degree to which respondents approve of interethnic marriage. Confidence intervals are set at the 95% level. The figure is based on data from round 9 of the Afrobarometer survey, conducted between 2021 and 2023.

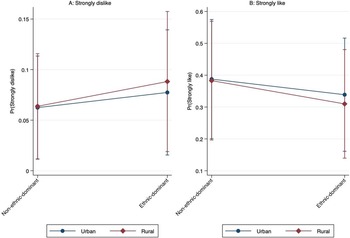
I also plot the predicted probabilities for the term interacting ethnic identification and rural residence, with a focus on how this relates to the probability of individuals choosing the extreme response categories of the dependent variable—i.e., “Strongly dislike” and “Strongly like” (Figure 6). The blue curves plot the predicted probabilities for urban residents, while the red ones do the same for rural residents. The curves in Panel A, which focus on the “Strongly dislike” category, both have a positive slope. This indicates that the probability of individuals living in urban and rural areas choosing to strongly dislike interethnic marriage is higher among those whose ethnic identity is more dominant than their national one, compared to those for whom this is not the case. A notable pattern in Panel A is that the predicted probability of strongly disliking interethnic marriage is similar between urban and rural residents when ethnicity is non-dominant. However, when the focus is shifted to those for whom ethnicity is dominant, a divergence occurs such that the predicted value for rural residents becomes significantly higher than that for urban residents.
Predicted probabilities of attitudes toward interethnic marriage by ethnic identification among rural vs. urban residents. Notes: The figure, based on Model 4 in Table 2, visualizes the relationship between the interaction term (Ethnic identification × Rural) and the extreme categories of the dependent variable—i.e., “Strongly like” and “Strongly dislike.” The vertical axis shows the predicted probabilities of identifying with the category of interest, while the horizontal axis shows respondents’ identification status. Confidence intervals are set at the 95% level. The figure is based on data from round 9 of the Afrobarometer survey, conducted between 2021 and 2023.

In contrast, the curves in Panel B, which focus on the “Strongly like” category, both have negative slopes. This suggests that among both urban and rural residents, the probability of strongly liking interethnic marriage is higher among individuals for whom ethnic identity is non-dominant than for those for whom it is dominant. Moreover, among individuals for whom ethnicity is non-dominant, the predicted probability of strongly liking interethnic marriage is similar between urban and rural residents. However, when the focus is shifted to those for whom ethnic identity is dominant, a divergence occurs, with urban residents recording a higher probability than their rural counterparts. The patterns observed in Panels A and B suggest that the urban–rural divide in attitudes is most pronounced among those with strong ethnic identities.
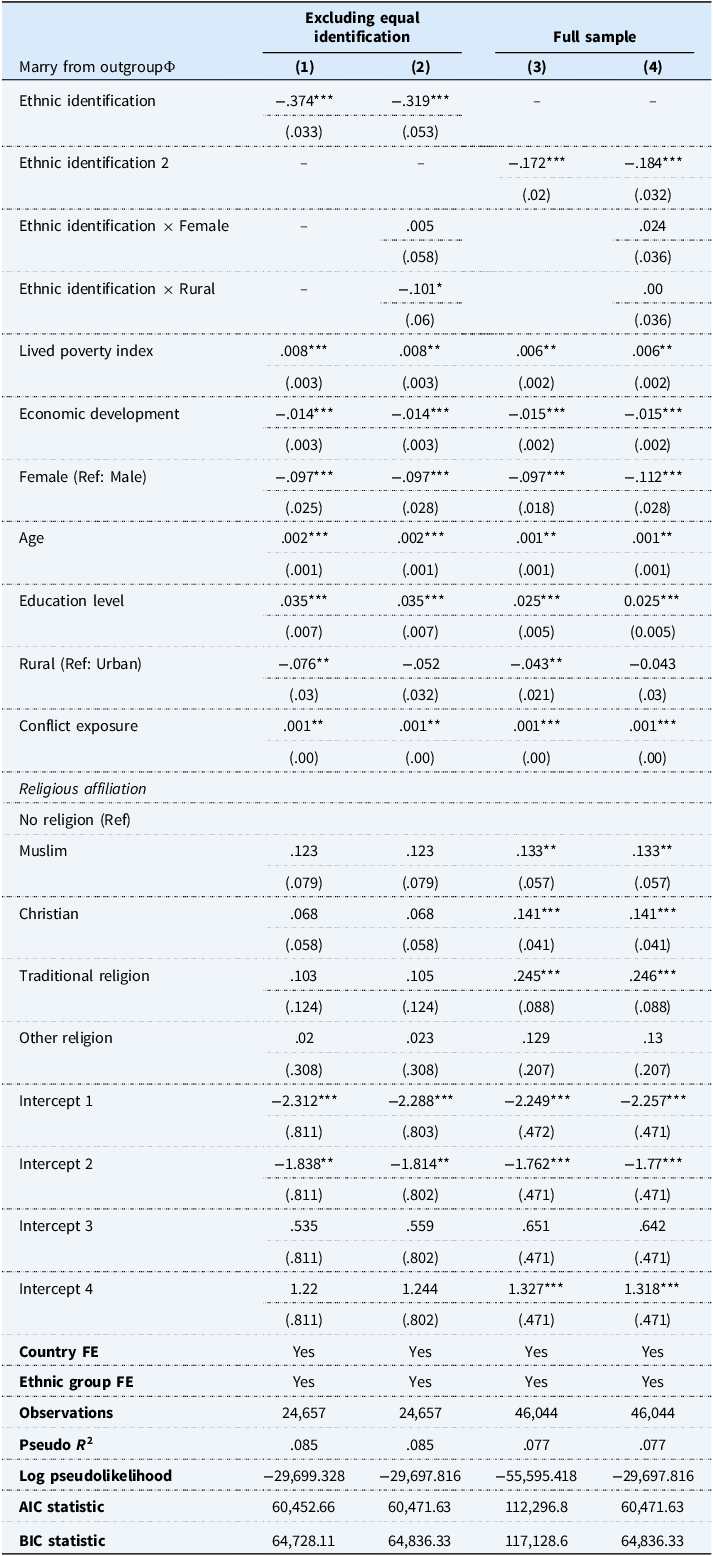
Finally, it is important to note that I conducted a series of robustness checks to determine the reliability of the results reported in Table 2. First, I re-estimated the models using ordinary least squares (OLS) regression as an alternative method. As shown in Table A1 in the Appendix, the results are largely consistent with those in Table 2. A potential challenge in operationalizing the explanatory variable—Ethnic identification—is the middle category in which individuals identify equally with their ethnicity and nationality. This particular category fails to distinguish between individuals who identify strongly with both or weakly with both. This prompted me to estimate a model in which I dropped this subsample, allowing for a clear distinction between individuals for whom ethnic identity is dominant and those for whom national identity is dominant. Although this results in a loss of over 22,000 observations, the findings remain robust and consistent with those observed in Table 2 (see Models 1 and 2 in Table A2).
Finally, I consider an alternative version of the explanatory variable—Ethnic Identification 2—in which I code individuals for whom ethnicity is dominant, as well as those who identify equally with both their ethnicity and nationality as 1. Those who identify more with their nationality, or exclusively with their nationality, are coded as 0. This recalibration allows me to clearly distinguish individuals for whom national identity is dominant from those for whom this is not the case. As shown in Models 3 and 4 in Table A2, the results remain largely consistent with the primary findings reported in Table 2.
Conclusion
This study offers new empirical evidence on the relationship between ethnic identification and attitudes toward interethnic marriage across over 30 African countries. The findings indicate that individuals who identify more strongly with their ethnic group than with the nation–state are significantly less likely to support interethnic unions. This suggests that strong ethnic attachments may inhibit social integration by reinforcing symbolic and relational boundaries between groups. Yet, the widespread indifference or support for interethnic marriage observed in the data also points to a more complex reality—one in which ethnic boundaries, while salient, are not always impermeable. These results underscore the importance of fostering an inclusive national identity and promoting intergroup contact through education, civic engagement, and public discourse. In contexts where ethnicity continues to shape political and social life, encouraging cross-ethnic ties at the interpersonal level may serve as a vital pillar of long-term peacebuilding and nation-building efforts.
A limitation of this study is the inability of the dependent variable to distinguish the gender of the individual marrying into the ethnic outgroup. This is crucial, especially in patriarchal societies where men often possess more agency than women. This represents a promising area for future research; experimental approaches, such as conjoint or factorial experiments, would be particularly suitable for isolating these causal effects.
Data Availability Statement
The replication files underlying the study are available in the Harvard Dataverse: https://doi.org/10.7910/DVN/R3I2AX
Acknowledgements
I thank the handling editor, Prof. Benjamin Gonzalez O’Brien, and two anonymous reviewers for their helpful comments.
Competing Interests
None.
Funding Statement
Funding from the state of Hessen, Germany, via the DynaRel project is gratefully acknowledged.
Appendix
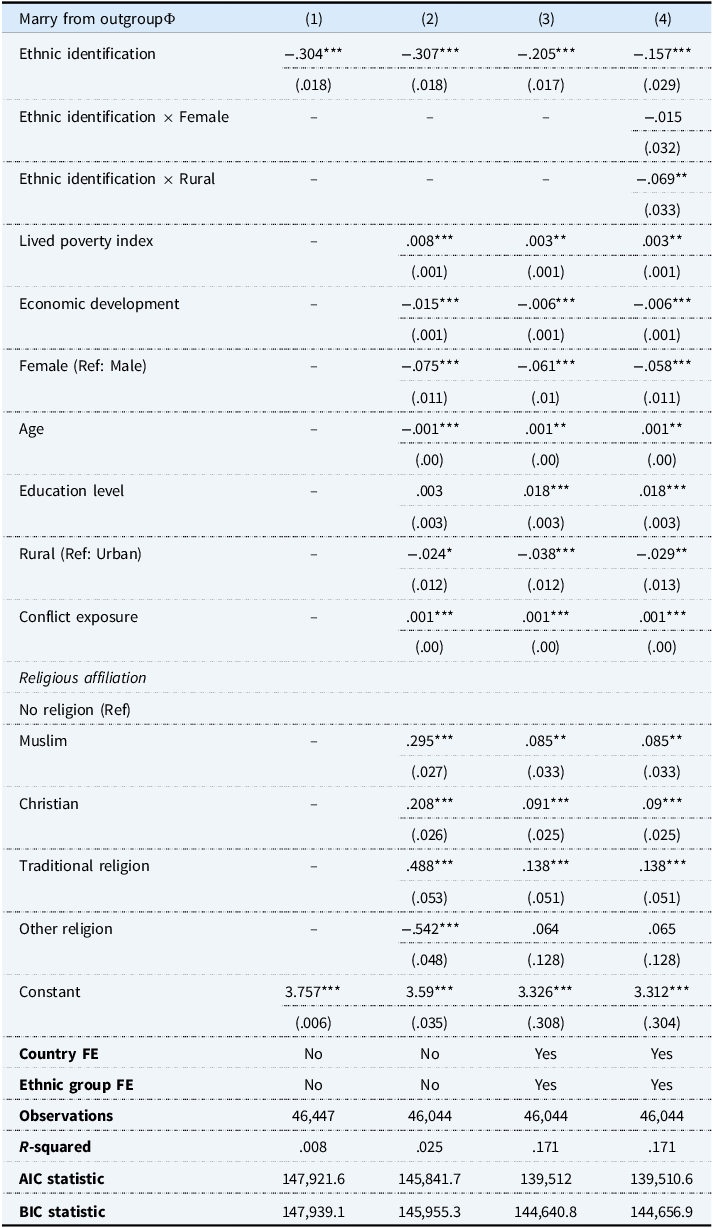
Replicating the results in Table 2 using OLS regression
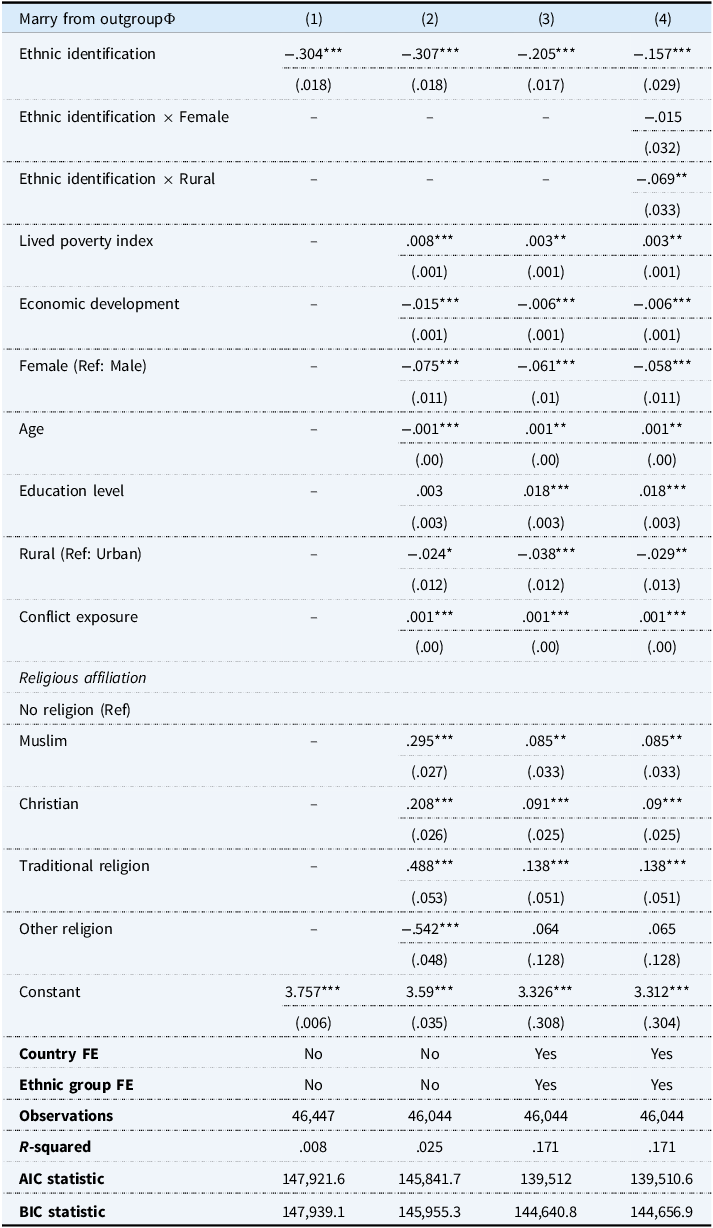
Notes: Φ indicates the dependent variable; “FE” denotes fixed effects; “Ref” indicates the reference category. Robust standard errors are in parentheses. ***p < 0.01, **p < 0.05, *p < 0.10. All models are estimated using ordinary least squares regression. The dependent variable, measured on a five-point ordinal scale ranging from “1 = Strongly dislike” to “5 = Strongly like,” captures respondents’ approval of a family member marrying an individual from a different ethnic group. AIC = Akaike Information Criterion; BIC = Bayesian Information Criterion. The regression models are based on data from Round 9 of the Afrobarometer survey, conducted between 2021 and 2023.
Robustness check excluding respondents who identify equally with their nationality and ethnicity, and using an alternative measure of ethnic identification
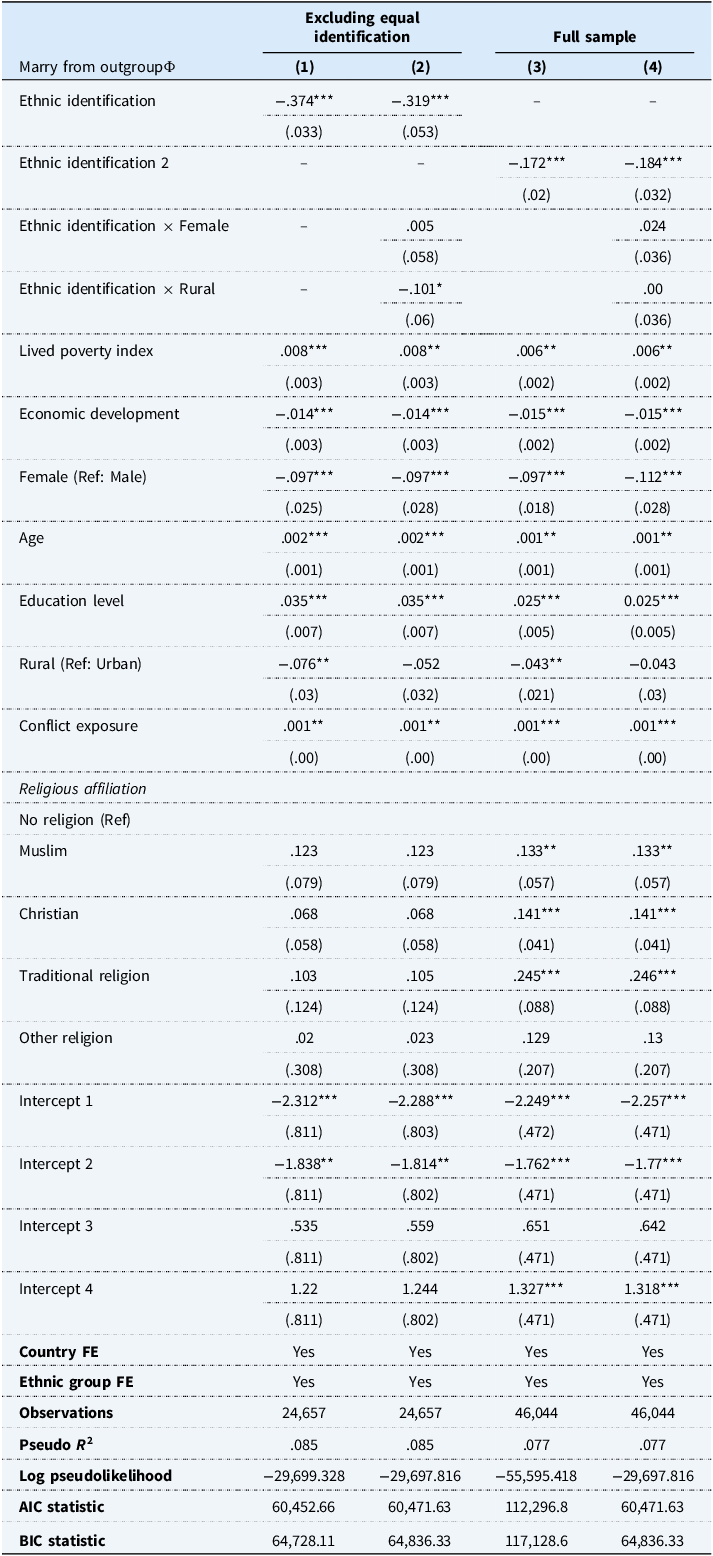
Notes: Φ indicates the dependent variable; “FE” denotes fixed effects; “Ref” indicates the reference category. Robust standard errors are in parentheses. *** p < .01, ** p < .05, * p < .10. All models are estimated using ordered logit regression. The dependent variable, measured on a five-point ordinal scale ranging from “1 = Strongly dislike” to “5 = Strongly like,” captures respondents’ approval of a family member marrying an individual from a different ethnic group. AIC = Akaike Information Criterion; BIC = Bayesian Information Criterion. The regression models are based on data from Round 9 of the Afrobarometer survey, conducted between 2021 and 2023.
List of countries surveyed and percentage their population who support and oppose interethnic marriage

Notes: The second and third columns list the number of observations from each country in the sample and the percentage of the total sample that the observations from the respective countries constitute. The fourth column shows the percentage of the population in the respective countries who would either “somewhat like” or “strongly like” for a member of their family to marry an individual from another ethnic group, while the fifth column shows those who either “strongly dislike” or “somewhat dislike” such a union. † denotes countries where the question on attitudes toward interethnic marriage was not asked. The table is based on data from Round 9 of the Afrobarometer survey, conducted between 2021 and 2023.

 Open access

