


Introduction
Social media are a convenient and frequently used instrument for politicians to communicate with voters. Representatives can share directly whom they have talked and listened to, where they have been, and to what concerns they have directed their attention. In brief, they can signal which issues, places and constituents they represent. Voters reward this activity as previous research has shown: social media activity, that is, frequent interaction on platforms such as Twitter, Facebook and Instagram leads to more electoral success (Bene, Reference Bene2018; Bode & Epstein, Reference Bode and Epstein2015; Kartsounidou et al., Reference Kartsounidou, Papaxanthi and Andreadis2022; Kovic et al., Reference Kovic, Rauchfleisch, Metag, Caspar and Szenogrady2017; Kruikemeier, Reference Kruikemeier2014; Reveilhac & Morselli, Reference Reveilhac and Morselli2023; Spierings & Jacobs, Reference Spierings and Jacobs2014). Yet, we still know relatively little as to what elements of social media communication exactly resonate with voters. Research on the relationship between the types of social media content and reactions by users has only begun to gain traction (e.g., Giger et al., Reference Giger, Bailer, Sutter and Turner‐Zwinkels2021; Munis & Burke, Reference Munis and Burke2023; Tromble, Reference Tromble2018).
In this article, we contribute to this literature by studying how voters perceive parliamentarians' use of local cues – clear and obvious messages in social media posts targeting local voters – and how it affects parliamentarians' electoral fortunes. To achieve this, we use both observational and experimental data to study this link between members of parliament (MPs) and their voters in the constituency, which is a key component of representative democracy. Constituency work is, next to legislative activities, the central task of parliamentarians (Fenno, Reference Fenno1978). However, signalling to local voters that their representatives care for them is challenging. Social media is therefore the ideal mode of communication for parliamentarians to signal engagement with local constituents and local issues.
Our approach to the study of local cues in social media posts consists of two steps. We first engage with previous findings linking electoral incentives to parliamentarians' use of local cues in social media communication. To this end, we present an observational study that examines when German and Swiss national parliamentarians signal localness to their voters in Tweets. In the second step, we conduct both an experimental and an observational study to gauge voters' reactions to local cues. A seven‐country survey experiment explores whether voters take notice of local cues in social media posts, and how these cues affect their self‐reported vote intention. The observational study then establishes whether the more frequent use of local cues contributes to parliamentarians securing more preferential votes in Swiss National Council elections.
Our results reveal a disconnect between the expectations that parliamentarians place in social media communication with local cues and how these local cues are actually perceived by voters. As expected, we find that parliamentarians signal more localness when they are out on the campaign trail. Yet, the hope for a corresponding electoral advantage is not fulfilled. We show that local cues register with voters, but – contrary to our expectations – do not make them feel more inclined to vote for the respective politician. Parliamentarians who use more local cues subsequently also fail to receive more preference votes at the polls.
Geographic representation on social media
Parliamentarians are elected to represent partisan voters and parties but also the geographically determined interests of their voters in the constituency. Traditionally, European parliamentary studies used to pay relatively little attention to geographic constituents because the majority of European parliamentary systems are dominated by strong parties and allow limited representation of local interests (Uslaner & Zittel, Reference Uslaner, Zittel, Rhodes, Binder and Rockman2006). Yet, more recently, scholarly attention has begun to veer more towards geographic representation, as there is a substantive share of electoral systems offering incentives to cultivate a personal vote (Carey & Shugart, Reference Carey and Shugart1995; Renwick & Pilet, Reference Renwick and Pilet2016; Zittel et al., Reference Zittel, Nyhuis and Baumann2019). However, given the strong role of parties in these electoral systems, parliamentarians mostly practice geographic or localized representation in a manner ‘designed to signal attention to geographic constituents without disrupting party unity’ (Zittel et al., Reference Zittel, Nyhuis and Baumann2019, p. 683) – both within and outside of parliament.
Politicians emphasize localness for anticipated electoral gains. Several studies show that voters value politicians with local roots (Boldrini, Reference Boldrini2023; Bolet & Campbell, Reference Bolet and Campbell2024; Campbell et al., Reference Campbell, Cowley, Vivyan and Wagner2019; Schulte‐Cloos & Bauer, Reference Schulte‐Cloos and Bauer2023), appreciate those who represent voters in the constituency (Dassonneville et al., Reference Dassonneville, Blais, Sevi and Daoust2021), balance national and constituency work (Vivyan & Wagner, Reference Vivyan and Wagner2016) or even prefer district‐focused representatives over nationally oriented ones (Doherty, Reference Doherty2013). Voters even reward MPs who dissent from the party line assuming they do so in response to constituency pressure (Bøggild & Pedersen, Reference Bøggild and Pedersen2020; Duell et al., Reference Duell, Kaftan, Proksch, Slapin and Wratil2023). Local roots, for example, being born and/or raised in the constituency are taken as a low‐cost cue by voters that a politician cares and acts for the constituency. This so‐called ‘behavioural localism’ (Campbell et al., Reference Campbell, Cowley, Vivyan and Wagner2019, p. 938) describes to which degree parliamentarians are perceived to represent the wishes of the local voters. Previous studies confirm that voters might be right in valuing this: MPs who are born and/or raised in the constituency have been found to generate on average more financial benefits for their geographical constituency (Carozzi & Repetto, Reference Carozzi and Repetto2016; Fiva & Halse, Reference Fiva and Halse2016).
For representatives, the function of behavioural localism is twofold. On the one hand, the goal is to mobilize one's own partisan voters. This view aligns with the perception that geographic representation is complementary, that is, non‐conflictual to partisan representation (Zittel et al., Reference Zittel, Nyhuis and Baumann2019). On the other hand, behavioural localism also functions as an appeal to supporters of other parties by promoting issues to the benefit of the entire constituency, such as bringing resources or infrastructure to the district, or by signalling a shared identity between politicians and voters (Munis & Burke, Reference Munis and Burke2023). Hence, we use the term geographic representation to describe how representatives make local interests present in the political arena outside and inside parliament. This can be achieved through descriptive representation, which describes the idea that representatives mirror characteristics of their voters (Mansbridge, Reference Mansbridge1999). Through behavioural localism, parliamentarians signal to voters in their communication that they want to make local interests present in the political arena. As we focus on geographical representation, we cannot be sure how constituents evaluate these signals – whether purely in descriptive or also in substantive terms.
Social media are a convenient instrument for politicians to communicate their local focus: with very low costs and no intermediary such as the traditional press or the party leadership, they can freely choose how to communicate their positions, their voter contacts and aspects of their professional and private lives to their voters in the constituency and beyond. It is easier and quicker for voters to use politicians' social media channels than to look up their representatives' roll‐call votes, their latest press releases on their websites or their media coverage. Politicians – and citizens – are increasingly using these channels to communicate (Jost, Reference Jost2023; Severin‐Nielsen, Reference Severin‐Nielsen2023; Sørensen, Reference Sørensen2016); also because it benefits the former electorally (Kelm et al., Reference Kelm, Angenendt, Poguntke and Rosar2023). Hence, social media such as Twitter constitute a suitable arena to investigate behavioural localism (Schürmann, Reference Schürmann2023; Schürmann & Stier, Reference Schürmann and Stier2023). Although Twitter tends to be used by elites such as journalists and those with a high level of political interest, the potential for Tweets to be amplified through retweets and shares (Popa et al., Reference Popa, Fazekas, Braun and Leidecker‐Sandmann2020; Silva & Proksch, Reference Silva and Proksch2022) or quoted in traditional media (Oschatz et al., Reference Oschatz, Gil‐Lopez, Paltra, Stier and Schultz2024) makes Twitter a useful tool for reaching a wide audience. Mentioning constituency places serves as an indicator of geographic representation (Martin, Reference Martin2011). Unlike roll call voting where localization can be influenced by the party (Tavits, Reference Tavits2009), social media messages provide an unfiltered representative–citizen communication channel as evidenced by Bauer et al. (Reference Bauer, Ecker, Imre, Landesvatter and Malich2023).
So far, legislative scholars have studied geographic representation with more traditional data: One strand of the literature has relied on parliamentarians' assessment, that is, survey data (e.g., Deschouwer et al., Reference Deschouwer, Depauw, André, Deschouwer and Depauw2014) to ascertain which groups of citizens – voters in the country, the voters of the party, or the voters in their geographic constituency – parliamentarians claim to represent. Other scholars of substantive geographic representation have focused on legislative behaviour inside parliament and have analysed mentions and references to their constituency in parliamentary questions (Chiru, Reference Chiru, Cross, Katz and Pruysers2018; Martin, Reference Martin2011; Papp, Reference Papp2016; Zittel et al., Reference Zittel, Nyhuis and Baumann2019) or private members' bills Däubler (Reference Däubler2020). Others have studied geographic representation outside of parliament by analysing personal websites of parliamentarians (Pedersen & vanHeerde Hudson, Reference Pedersen and vanHeerde Hudson2019), focused on time spent in the constituency (André & Depauw, Reference André and Depauw2013; Fenno, Reference Fenno1978) or investigated responsiveness to constituency demands (Giger et al., Reference Giger, Lanz and De Vries2020; Thomsen & Sanders, Reference Thomsen and Sanders2020). Until now, only few studies have addressed geographic representation by parliamentarians in social media: Two studies focusing on Germany show that directly elected MPs use more regional references in their social media posts than MPs elected on party lists (Schürmann & Stier, Reference Schürmann and Stier2023), particularly in competitive districts (Schürmann, Reference Schürmann2023). At the same time, recent evidence on US senators suggests that localized appeals on Facebook are appreciated by voters and an effective strategy to win over out‐partisans (Munis & Burke, Reference Munis and Burke2023).
We assume that MPs' geographic representation efforts are impacted by the incentives of the electoral system, as certain studies highlight how constituency focus (Heitshusen et al., Reference Heitshusen, Young and Wood2005; Pilet et al., Reference Pilet, Freire and Costa2012) varies according to the incentive to cultivate a personal vote (Carey & Shugart, Reference Carey and Shugart1995). Politicians cultivate this personal vote by signalling local connectedness, including in social media posts. The idea is supported empirically by studies demonstrating that directly elected German MPs (i.e., elected under a first‐past‐the‐post system) use more local cues in their social media posts than those elected on party lists (Schürmann & Stier, Reference Schürmann and Stier2023; Schürmann, Reference Schürmann2023). Yet, geographic representation has also been found in electoral systems in (de facto) closed list proportional systems without an incentive to cultivate a personal vote, for example, in Israel (Itzkovitch‐Malka, Reference Itzkovitch‐Malka2021), Italy (Viganò, Reference Viganò2024), Germany (Geese & Martínez‐Cantó, Reference Geese and Martínez‐Cantó2023; Rehmert, Reference Rehmertin press), Spain (Geese & Martínez‐Cantó, Reference Geese and Martínez‐Cantó2023), Norway (Fiva et al., Reference Fiva, Halse and Smith2020) and Portugal (Borghetto et al., Reference Borghetto, Santana‐Pereira and Freire2020).
Variation across electoral systems could, however, also be the result of other unobserved differences caused by the professionalism of their campaign. Arguably, a better test of the assumed strategic dynamic is to leverage within‐MP variation over time and gauge whether signalling to geographic constituents is particularly pronounced when MPs perceive it to matter the most: during campaign season. Previous research suggests that primarily during the run‐up period to an election, MPs use different internet campaigning styles (Angenendt & Bukow, Reference Angenendt and Bukow2024; Silva et al., Reference Silva, Schürmann and Proksch2024) dependent on the election system (Zittel, Reference Zittel2009) and tend to spend more time in their constituency (Johnston et al., Reference Johnston, Cowley, Pattie and Stuart2002). In a similar vein, we can therefore expect parliamentarians to also use more local cues in social media posts when they are out on the campaign trail (Schürmann & Stier, Reference Schürmann and Stier2023). After all, signalling local connectedness seems to be a sensible strategy considering that voters value local MPs (Arzheimer & Evans, Reference Arzheimer and Evans2012; Campbell & Cowley, Reference Campbell and Cowley2014). This leads us to formulate the following hypothesis:
Hypothesis 1 In contrast to other periods, parliamentarians use more local cues in their social media posts during campaign season.
We – just as politicians themselves – expect parliamentarians to be rewarded at the polls for incorporating local cues into their social media content. These references do not supplant a candidate's other campaign strategies; rather, they act as a complementary means of appealing to voters in national elections.
Social media behaviour matters in elections. Previous research shows that politicians' general activity on social media affects their electoral fate (e.g., Bene, Reference Bene2018; Bode & Epstein, Reference Bode and Epstein2015; Kartsounidou et al., Reference Kartsounidou, Papaxanthi and Andreadis2022; Kovic et al., Reference Kovic, Rauchfleisch, Metag, Caspar and Szenogrady2017; Kruikemeier, Reference Kruikemeier2014; Reveilhac & Morselli, Reference Reveilhac and Morselli2023; Spierings & Jacobs, Reference Spierings and Jacobs2014). Indeed, German constituency candidates' use of social media has been found to be positively associated with their election results (Kelm et al., Reference Kelm, Angenendt, Poguntke and Rosar2023).
Using local cues on social media is a complementary strategy among many. We do not claim that such references overshadow a candidate's party label or ideological stance; rather, localness likely acts as a subtle cue – one of several personal attributes that voters may weigh, especially in tight races or where co‐partisan candidates vie against each other. Even in multi‐member or open‐list proportional representation systems, small edges in personal appeal can accumulate into significant differences in preference votes. Local ties thus serve as one micro‐level mechanism by which candidates differentiate themselves from their fellow party contenders.
Local cues likely have this effect because they tap into deeper identification dynamics, leading citizens to trust and favour politicians who appear rooted in their own community. Cues that signal localness can serve as a helpful heuristic or shortcut for voters (see, e.g., Colombo & Steenbergen, Reference Colombo and Steenbergen2020). Advocating local roots is a signal of shared identification, which in turn raises the perception that the candidate will defend local voters' interests (Campbell et al., Reference Campbell, Cowley, Vivyan and Wagner2019). Furthermore, these references can foster trustworthiness in the sense of ‘someone from my hometown will not betray me’ (Gimpel et al., Reference Gimpel, Karnes, McTague and Pearson‐Merkowitz2008). Just as ethnic minority voters sometimes prefer candidates who share their ethnic background in national elections, geographically grounded voters might appreciate candidates from their hometown. Both phenomena operate under the principle of descriptive representation – candidates ‘like me’ may be better placed to understand and defend my interests.
Although these local cues are a subtle way for a parliamentarian to show they are connected to their community, they are chosen carefully because space in a social media post is limited. They are easy for readers to understand, and it is clearer than using pictures where it might not be obvious if the photos are from the local area. Moreover, such posts are easier to communicate for MPs in contrast to the amount of time spent in the constituency as sometimes used in studies analysing constituency service (Fenno, Reference Fenno1978).
While many aspects influence candidate choice, and extensive literature documents these (e.g., Fisher et al., Reference Fisher, Fieldhouse, Franklin, Gibson, Cantijoch and Wlezien2018), we argue that localness as a candidate characteristic matters in addition to other, more fundamental considerations such as party ideology. We contend that the fact that a candidate is from the area can make a difference, particularly in electoral systems with intra‐party competition. Previous empirical work supports this image and confirms that voters value MPs from their constituency in national elections (Arzheimer & Evans, Reference Arzheimer and Evans2012; Campbell & Cowley, Reference Campbell and Cowley2014; Campbell et al., Reference Campbell, Cowley, Vivyan and Wagner2019; Schulte‐Cloos & Bauer, Reference Schulte‐Cloos and Bauer2023) and usually reward themFootnote 1 for spending an adequate amount of time in the constituency (Vivyan & Wagner, Reference Vivyan and Wagner2016; Wolak, Reference Wolak2017).
Overall, our assumption that voters reward local cues in social media messages is supported by the finding that MPs who have local roots, for example, being born and/or raised in the constituency, tend to generate more financial benefits for their geographical constituency, as shown in a previous study on Italian municipalities (Carozzi & Repetto, Reference Carozzi and Repetto2016). This suggests that voters may have the right intuition – even if they cannot know for sure – that voting for local candidates helps their interests to be better represented.
We therefore hypothesize that local cues on social media benefit politicians electorally.
Hypothesis 2 Voters reward parliamentarians electorally for local cues in their social media posts.
Empirical strategy and data
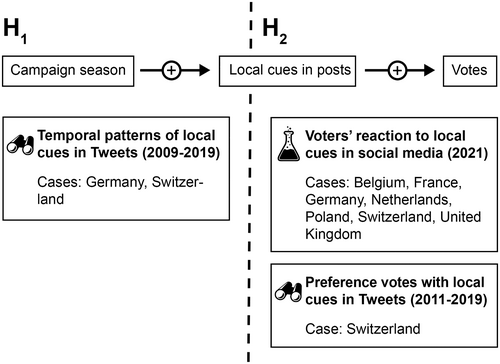
We proceed to test our two hypotheses with three separate analyses (Figure 1). First, we study observational data that capture MPs' Twitter behaviour over a long time period, that is, since they started to tweet. This approach contrasts with the standard practice in this literature which tends to study single elections at one point in time. This enables us to examine whether there is an increased use of local cues in social media posts during campaign periods. Here, we focus on explicit local cues: the explicit mentioning of geographic places (e.g., names of cities, towns, fields, squares, monuments, rivers, etc.).
Overview of the empirical strategy.

This first analysis relies on Twitter data from 2009 until 2019 on members of the German Bundestag and the Swiss National Council (lower house). Taken together, these two cases introduce a wide range of different candidacy types, covering open list and closed list proportional representation, plurality voting and combinations thereof. Notwithstanding this, both the German mixed‐member electoral system – where most MPs run as both list and district candidates – and the open‐list proportional representation system of the Swiss lower house provide overall strong incentivesFootnote 2 to cultivate a personal vote. This renders these two countries most likely cases for finding evidence for the hypothesized campaign season effect on the use of local cues while introducing broad variation in electoral incentives.
Our second analysis examines whether Tweets and social media posts on other platforms with local cues have the intended effect on voters. We conduct this test in a controlled experimental setting to isolate the effect of a local cue on self‐reported likelihood to vote for an otherwise similar politician. In spring 2021, we fielded a survey experiment in seven European countries, which enabled us to obtain data for electoral systems with varying incentives to cultivate a personal vote. The selected cases range from countries where parliaments (lower houses) are elected with single‐member plurality representation with one round (United Kingdom) and two rounds (France) to mixed‐member proportional representation with closed lists (Germany) to proportional representation with closed lists (the Netherlands), semi‐open lists (Belgium) and open lists (Poland, Switzerland). These experimental data permit us not only to measure voters' reaction to local cues but also allow us to gauge whether voters from different electoral contexts detected the presence of the local cue in the first place.
In the third analysis, we turn our attention to a subset of the observational data from the first analysis where the electoral incentive to signal localness is greatest. We focus on the brute force effect of social media messages (for an earlier application to Swiss national elections, see Kovic et al., Reference Kovic, Rauchfleisch, Metag, Caspar and Szenogrady2017). To that end, we relate the frequency of MPs' use of local cues on Twitter to their performance in three Swiss lower house elections (2011, 2015 and 2019). We limit our analysis to the Swiss data as it allows us to focus not only on preference votes that MPs receive from voters of their own party but also from voters of other parties. Switzerland's open‐list proportional representation system leads to both competition among parties and among co‐partisans (Selb & Lutz, Reference Selb and Lutz2015). Voters can distribute up to two preference votes per candidate, and the overall number of votes is limited to the seats in their canton (district). Preference votes can be given to candidates from multiple parties. Local cues are therefore a way to garner votes from both partisan and non‐partisan supporters.Footnote 3 Voters' ability to reward candidates both from their own and other parties makes the Swiss lower house elections therefore a most likely case for finding an impact of local cues on preference votes.
Our focus on Twitter in the first and third analyses has some ramifications. We chose this approach because of our interest in how politicians use local cues to signal to their entire geographic constituency: while platforms such as Facebook serve more to ‘preach to the choir’, that is, mobilize citizens in line with the politician's views, Twitter is a tool to address broader audiences (Stier et al., Reference Stier, Bleier, Lietz and Strohmaier2018) and is widely used by the politicians in our data (a total of roughly 1.3 million Tweets was posted by the elected MPs during our observation window). That said, the recent study by Schürmann and Stier (Reference Schürmann and Stier2023) shows no discernible difference between the two platforms. Notwithstanding this, Twitter is often criticized for being an elite communication network where politicians, journalists and academics communicate amongst each other. Yet, in most Western political systems, the number of people who follow politicians on Twitter has been steadily growing (Kousser, Reference Kousser2019). In both Germany and Switzerland, Twitter is the fifth most widely used social media platform (Newman et al., Reference Newman, Fletcher, Schulz, Andi, Robertson and Nielsen2023). The Twitter activity is also amplified by journalists (Oschatz et al., Reference Oschatz, Stier and Maier2021) who refer to Tweets in traditional media such as newspapers and TV outlets, resulting in the majority of politicians using social media to an increasing degree (Bernhard et al., Reference Bernhard, Dohle and Vowe2016). For studying how MPs address their geographic constituents at large, Tweets therefore constitute a suitable data source.
Geospatial dictionary‐based detection of local cues
Our observational data comprises 1,316,458 Tweets. Due to this volume, we used an automated procedure to identify local cues instead of hand coding. Inspired by the approach of Zittel et al. (Reference Zittel, Nyhuis and Baumann2019), we relied on spatially referenced vector data to construct dictionaries that contain geographic terms specific to each constituency. To obtain the relevant geographic markers (municipalities, fields, rivers, monuments, etc.) that refer to MPs' districts, we used two geospatial datasets: one compiled by the German Federal Agency for Cartography and Geodesy and the other one from the Swiss Federal Office of Topography (Swisstopo). The German GN250 datasetFootnote 4 contains about 120,000 georeferenced polygons, and its Swiss counterpart swissNames3D about 380,000 georeferenced points, lines, and polygons.Footnote 5 An overview of all categories of geographic markers can be found in the online Appendix (Table A1).
At the same time, we also collected geospatial information on the boundaries of electoral districts. Given that redistricting occurs in Germany every 4 years, we downloaded time‐sensitive district boundaries from the German Federal Returning Officer. In Switzerland, district boundaries were provided by Swisstopo. To obtain district‐specific geographic terms, we intersected the spatially referenced markers with the district boundaries, thus giving us lists of geographic terms at the level of the district‐electoral period in Germany and the district level in Switzerland.
These dictionaries were used to automate the detection of local cues in Tweets, that is, whether they contain local cues (1) or not (0). For the purpose of this study, local cues therefore entail obvious, map‐related signals: geographic locations, buildings and facilities, as well as mentions of the geographic constituency. They do not include more subtle signals such as people, organizations, events (see Martin, Reference Martin2011, p. 264), linked content or pictures that refer to constituencies.
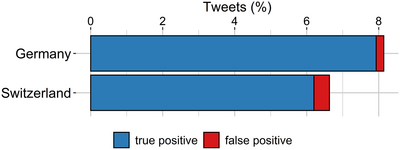
All detected local cues (positives) were checked by human coders and false positives were removed. Figure 2 shows that only a fraction of all automatically coded Tweets (Germany 0.2 per cent, Switzerland 0.4 per cent) were initially incorrectly classified as local cues. Further information on the dictionary approach is provided in online Appendix B.
Success rate of our geospatial dictionary‐based detection of local cues.
Note: Full sample (100 per cent) for Germany = 874,338 Tweets and Switzerland = 466,967 Tweets.

The detected local cues in Tweets constitute signals of engagement with issues relevant to the district. While these are not necessarily political in nature, politicians consciously decide whether or not to pay attention to them on social media. Using this approach, 67,347 German Tweets (7.9 per cent) and 28,953 Swiss Tweets (6.2 per cent) were found to contain local cues (true positives). When we compare these percentages to previous findings, we observe that they are similar to MPs' geographic constituency signalling behaviour in parliament. Using the same dictionary‐based coding approach, 6.2 per cent of parliamentary questions in the German Bundestag were found to contain references to MPs' districts (Zittel et al., Reference Zittel, Nyhuis and Baumann2019).
Is there a campaign season effect? Observational evidence
The first step of our research aims to investigate whether politicians use local cues on social media strategically before elections. To answer this question and test H1, we compiled a new dataset that compares the use of local cues in the lower incentive context (outside of campaign season) with its higher incentive counterpart (during campaign season).
Our observation window ranges from June 2009 (the early days of Twitter) to November 2019, when we collected our data. Our unit of analysis is MP‐months. An MP who maintained a Twitter account for this entire 10+ year (125‐month) period appears 125 times in our data.Footnote 6
The sample selection entailed two steps. In the first step, MPs were included based on having held a seat at some point in the German Bundestag or Swiss national parliament (both houses) between June 2009 and November 2019.Footnote 7 From this population, we sampled all (N = 433, the full population) of the Swiss MPs. For Germany, we selected a random sub‐sample of the exact same size. In the second step, all MPs who posted a Tweet at least once during this period were selected. This was a deliberate decision: including MPs without a Twitter presence as zero cases would lead our estimates to, at least partially, predict overall Twitter use. The resulting sample contains a total of N = 437 MPs (188 Swiss, 249 German) and N = 19,485 MP‐months. The measurements for these observations were calculated using 1,316,458 Tweets.
The analysis combines data from two sources: (1) comprehensive biographical and electoral information on Swiss and German MPs (2009–2019) from the Parliaments Day‐By‐Day Data (Turner‐Zwinkels et al., Reference Turner‐Zwinkels, Huwyler, Frech, Manow, Bailer, Goet and Hug2022) and (2) all the Tweets for MPs who maintained a Twitter account during our observation window, which were collected using the Twitter API v2. The Tweets were coded using the automated local cue detection procedure outlined in the previous section.
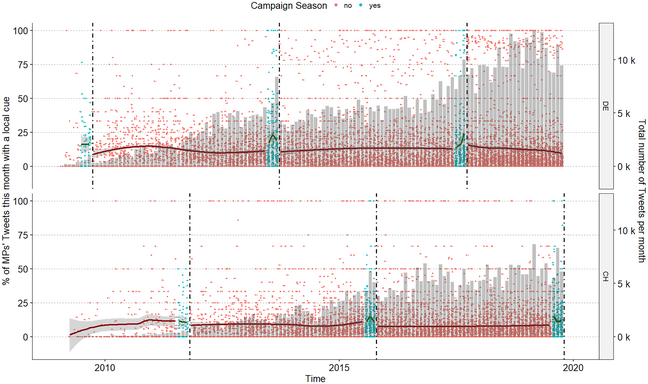
We evaluate H1 using both descriptive and inferential statistics. In the descriptive part, we inspect a scatter plot that shows the percentage of local Tweets sent per month per MP. The colours indicate whether the numbers differ between non‐campaign season (red) and campaign season (blue). A pattern where the percentage of local Tweets is higher during campaign season would provide support for the campaign season hypothesis (H1).
A descriptive inspection of the hypothesized campaign season effect
Figure 3 examines the percentage of local Tweets sent by an MP per month, comparing the use of local cues during non‐campaign seasons to campaign seasons. A trend where the percentage of local Tweets is higher during campaign seasons can be seen as supporting Hypothesis 1.
The percentage of Tweets that contains a local cue outside of and during campaign season.
Note: The major y‐axis represents the percentage of local tweets per MP per month, while the x‐axis represents time. The points indicate the percentage of Tweets per month per MP. Blue observations correspond to the campaign season. The points are jittered to reveal the distribution of the observations. The loess‐smoothed regression lines are fitted separately for the consecutive periods. The bars and the secondary y‐axis represent the total number of Tweets in each month.

Figure 3 descriptively suggests a slight increase in the use of local cues on social media during campaign seasons compared to non‐campaign seasons. This observation, evident from the linear regression lines for consecutive (non‐)campaign seasons, aligns with H1. MPs seem to post a higher percentage of Tweets with local cues during campaign seasons. The averages calculated here, however, are based on a Loess smoothing approach and should be interpreted with caution due to their sensitivity to local data distributions, which the inferential model that follows is better able to handle.
An inferential inspection of the hypothesized campaign season effect
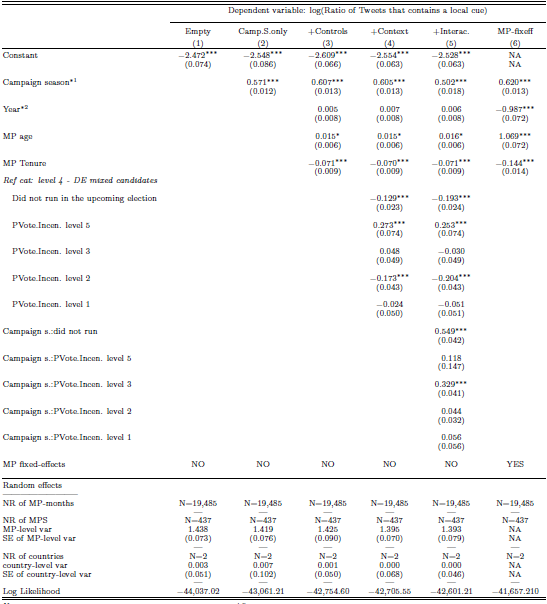
Our inferential evidence builds on the binomial regression modelsFootnote 8 presented in Table 1. These models predict the ratio of Tweets posted by a politician that contain a local cue. The key predictor variable is the campaign season (0/1). To ensure that the observed effects are not indirectly picking up differences in the electoral context between Germany and Switzerland or the different modes of candidacy in both countries (i.e., MPs that run for district or list seats), we opted to include an ordinal measurement of ‘the need to get personal votes’ in the model. This scale (five levels, from 1 [highest incentive] to 5 [lowest incentive]) measures the extent to which the context incentivizes the need to cultivate a personal vote.Footnote 9 This variable inadvertently also serves the role of a country fixed effect, albeit in a more nuanced way, as it also controls for different modes of candidacy, such as MPs running for district or list seats. Although using this scale complicates the model construction, its inclusion allows us to establish that the measured campaign season effect is not country‐ or candidate‐specific, thereby improving the generalizability of the results in an important way. Another viable – perhaps somewhat bold, yet effective – method for controlling potential confounders is to use an MP fixed‐effect model. We include this as our final model to ensure robustness. In all models, we control for time‐varying individual‐level factors like age and tenure in parliament. A Tweet is deemed campaign‐related if posted within 3 months before a general election. Results remain consistent with alternative time‐frames (6 and 9 months) (see online Appendix D).
Multi‐level linear regression model estimating the ratio of local cues outside and during campaign season in different electoral contexts.

Note: Unit of analysis: MP/months; time frame: June 2009–November 2019.
a
Three months before the election.
b
Centered, reference is 2014.
*
p  0.1;
0.1;  p
p  0.05;***p
  0.01.
0.01.
It is evident from the estimates in Table 1 that parliamentarians include local cues in their Tweets on a relatively frequent basis. When we calculate this percentage properly, given the distribution of the data, we find that around 7 per cent of all their Tweets contain a local cue. More importantly, the results also provide clear evidence for H1, as parliamentarians use more local cues in their Tweets during campaign seasons. The estimated effect of campaign season on the use of local cues on social media is stable at around 0.5 on the log scale, which translates to a ratio of roughly 1.75.Footnote 10 This implies that, all else equal, the chance of a random Tweet in Germany and Switzerland 3 months before an election (i.e., during campaign season) to contain a local cue is around a factor of 1.75 higher than outside of campaign season. Note that as these are binomial models, the estimates are corrected for the fact that the total number of Tweets per month is higher during campaign season than outside of it,Footnote 11 This means that the total relative exposure to Tweets with local cues for the respective MPs on Twitter during campaign season is even higher. All in all, these results lend support to H1.
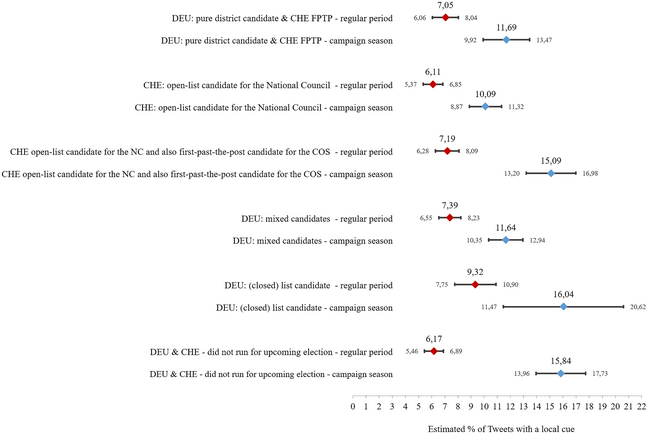
The results in Figure 4 present the estimated changes in the percentage of local cues used in different electoral contexts, which were analysed as an exploratory test. The analysis aims to investigate the robustness of a campaign season effect across different electoral contexts. This check is relevant given that in some contexts (e.g., German MPs that only ran on a closed list seat), MPs have a relatively low incentive to cultivate a personal vote.
The percentage of Tweets that contains a local cue outside of and during campaign season.
Note: Presented estimates are based on Model 5 in Table 1. The lines represent contexts from the highest incentive to cultivate a personal vote (top) to the lowest incentive (bottom). The confidence intervals around these recalculated estimates are calculated using the Delta Method Casella and Berger (Reference Casella and Berger2002) with the function ‘DeltaMethod’ in the R‐package ‘car’. NC = National Council (lower house). COS = Council of States (upper house).

The results in Figure 4 show a clear and significant campaign season effect in all contexts, as the non‐overlapping confidence intervals indicate. We can conclude from this that there is a robust campaign season effect across different electoral contexts. Something we did not expect to find is the relatively large ‘campaign season effect’ for those who did not run in the upcoming elections. Further analysis shows that MPs in this group tweet a lot less (an average of 32.00 Tweets) than those in the other groups (with an average of 61.51 Tweets).
In sum, this observational analysis of a decade of MP Tweets in Germany and Switzerland (2009–2019) revealed that MPs regularly post Tweets with local cues (around 7 per cent of the time) and provides evidence that they increase this usage during campaign seasons by roughly a factor 1.7, meaning that 12 per cent of all monthly Tweets contain a local cue. MPs do this in all electoral contexts, seemingly independent of the extent to which these contexts offer an incentive to cultivate a personal vote. All in all, these results support the idea that politicians use local cues strategically on social media to increase their electoral chances during campaign seasons.
Do voters appreciate local cues? Experimental evidence
To examine whether voters appreciate local cues in social media posts (H2), we included an experiment in a cross‐national survey. This online survey was fielded in spring 2021 and included respondents from seven Western and Central European countries (Belgium, France, Germany, the Netherlands, Poland, Switzerland and the United Kingdom). It features at least 2000 respondents per country, with 16,291 observations in total.Footnote 12 Quotas regarding region, gender and education were implemented to assure the representativeness of the responses with respect to socio‐demographic characteristics of the respective countries.Footnote 13 The variety of countries renders it possible to study the effect of local cues in electoral systems with varying incentives to cultivate a personal vote. The selected cases range from countries where parliaments (lower houses) are elected with single‐member plurality representation with one round (United Kingdom), and two rounds (France), to mixed‐member proportional representation with closed lists (Germany), to proportional representation with closed lists (the Netherlands), semi‐open lists (Belgium) and open lists (Poland, Switzerland).
The experiments probed whether voters appreciate social media posts with local cues with the following setup: they first saw a social media post by a politician that either showed a statement with a local cue (1) or the same statement without a local cue (0). To manipulate the localness of the social media post, we either included or did not include the region that the respondent had named earlier in the survey as their current region of residence.Footnote 14 The intervention mimics a local cue, that is, a reference to geographical location and renders localness prominent in the treatment condition. In effect, the treatment presents a low‐cost cue to voters that a politician cares and acts for the constituency while at the same time ensuring that the treatment is realistic and practical across our seven countries.
The intervention focuses on the topic of economic development. The economy is generally considered as a valence issue (Clarke et al., Reference Clarke, Kornberg, Scotto, Reifler, Sanders, Stewart and Whiteley2011; Pardos‐Prado & Sagarzazu, Reference Pardos‐Prado and Sagarzazu2016), meaning that everybody agrees that economic development and growth is a good thing and little ideological fight exists on this general notion. Also, economic issues are usually highly salient topics (see, e.g., Singer, Reference Singer2011; Traber et al., Reference Traber, Giger and Häusermann2018) which further strengthens the external validity of the experiment.Footnote 15 So in sum, the treatment should work equally for respondents of varying ideology and party preference and be of importance to large shares of the electorate. Importantly, in the database for study 1 we find a lot of Tweets about the economy,Footnote 16 which further strengthens the external validity of the experiment.
To further enhance the generalizability and the external validity of the experiment, several other factors were varied that are not of core theoretical interest here. First, the picture and name of the fictitious politician in the post were either male or female. The names of politicians were kept constant within country‐language combinations, and the pictures of two average‐looking individuals were kept constant across countries.Footnote 17 Their names were chosen to reflect very common first and last names according to respondents' country and language to ensure the realism of the experiment. Second, we also randomly varied the background of the social media post to resemble Facebook, Twitter, Instagram, or a neutral background to ensure that our findings generalize across different media channels. We introduce controls for these two factors in the regressions. Figure 5 shows two examples of the intervention in the Twitter format.
An example of the experimental manipulation.

After having been exposed to either the local (with cue) or non‐local (without cue) version of the social media post, respondents had to indicate how much they agreed with three separate statements on a scale from 0 to 10. These inquired about the probability to vote for the politician (1), their trustworthiness (2) and warmth (3). Since all three items yield very similar results, we focus on the item about vote intention in the remainder of this paper. Another subsequent question served as a manipulation check and asked whether respondents thought that the politician grew up close to where they lived.
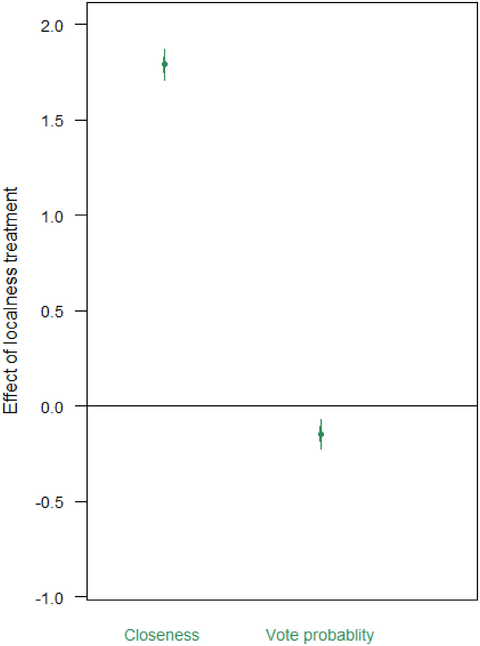
Before we turn to the effects of a local cue (0/1) in a social media post on candidate evaluation, it is worthwhile to first inspect the result of the manipulation check whether the politician is perceived as close to where they live. Figure 6 shows that our intervention was successful in moving respondents' perceptions of the ‘localness’ of the displayed politician: the difference is nearly 2 points on the 10‐point scale and highly significant. We were thus able to manipulate how local or not a politician is perceived by the respondents.Footnote 18
Experimental results.
Note: Presented estimates are based on Models 1 and 2 in online Appendix Table A7. Closeness represents the manipulation test, the probability to vote the main dependent variable.

In the second column of Figure 6, the effect of being shown a local cue vs a non‐local cue on the probability to vote for a politician is displayed. Contrary to our expectations, we do not find the effect specified in H2: if anything, being exposed to a local cue lowers the self‐reported probability to vote for the respective candidate but the size of the effect is minuscule. If we look at country‐specific results (see online Appendix Table A9 and Figure A6), it turns out that in three countries the effect is significantly negative (Switzerland, Germany and the Netherlands), in another three cases it is non‐significant (Belgium, France and the United Kingdom) while in Poland it appears to be positive. This means that our results do not seem to follow contextual variation in electoral system designs with the two open‐list systems displaying contrasting findings, for example. Given these non‐consistent effects, we thus believe it is safest to conclude that there is no systematic effect of signalling localness on candidate choice.
Several exploratory analyses also revealed that there are no large subgroup differences, for example, regarding ideological orientation, the personal salience of the economy or between the variations of the treatment (see online Appendix Tables A10 and A11).
Our results hence indicate that voters do not appreciate politicians who put local cues in their social media posts. If anything, they exert a negative effect in some circumstances. Importantly, this is not due to the intervention not working as expected. The manipulation check indicates a consistent and large effect: Respondents who were in the treatment group perceived the politician to live closer to them, which suggests that our manipulation of localness was successful (Figure 6).
Do local cues help MPs win votes? Observational evidence
The third and last analysis aims to assess the impact of the number of local cues in Tweets sent during campaign season on the preference votes MPs obtain (H2). To this end, we rely on the Swiss subset of the data from the first analysis (H1 on the campaign season effect) to zoom in on the national elections of 2011, 2015 and 2019. Swiss (national) lower house elections use an open‐list proportional representation system where voters can assign (1) preference votes to candidates equal to the number of seats in their district – with two being the maximum per candidate – and (2) a single party (list) vote. We focus on two specific cases of preference votes where we expect electoral benefits from the use of local cues to materialize. First, we look at the number of preference votes that MPs obtained from amended lists of their own party, that is, where it was voters' deliberate choice of how many votes (0, 1 or 2) they gave to a candidate of their own party (list). Second, we inspect the appeal of MPs to voters of other parties, that is, when they do not vote for the party (list) of the candidate in question but still write their name on said list.
We estimate linear regression models with fixed effects for the party, canton (electoral districts) and election period and a random term for politician clustering.Footnote 19 Four different measures for electoral performance, two for intra‐party and two for inter‐party preference votes, are regressed on the number of Tweets with local cues sent during campaign season. For intra‐party preference votes, we use (1) the total number of votes a candidate received from amended versions of their party's list and (2) the share of these votes as a percentage of allFootnote 20 their preference votes. For inter‐party preference votes, we rely on (3) the total number of votes a candidate obtained from other parties' lists, and (4) the share of these votes as a percentage of all their preference votes.
The results in Table 2 replicate the null findings from the survey experiment for the impact of local cues on citizens' vote intention (see Figure 6). The number of Tweets with local cues sent during the 3‐month campaign season (and also the total number of Tweets sent during that period) relates neither to the number and share of intra‐party nor the number and share of inter‐party preference votes. In addition, the effect size is negligibly small and even negative in models 1 and 2. This lack of effect is also mirrored in the lack of an effect of politicians' local roots in their constituency. We included a control for localness developed by Ortega et al. (Reference Ortega, Oñate and Martín2023). The measure reflects, on a scale from 0 to 1, how many years candidates have lived in their district relative to their age.
The effect of Tweets with local cues on preference votes

Note: Unit of analysis = politicians/election period.  = within‐cluster variance,
  = between‐cluster variance, ICC = intraclass correlation coefficient. Continuous variables are mean‐centred.
a
Baseline: Only Lower House candidacy.
 p
p  0.05;
0.05;  p
p  0.01;
0.01;  p
p  0.001.
As with the previous analyses, other results in Table 2 also provide face validity to the general approach we took. We observe that incumbent and experienced parliamentarians obtain a premium for their legislative service among voters of other parties. We see that parliamentarians obtain 8.9 per cent more preference votes, or 5278 on average in absolute terms from voters of other parties compared to challengers. Similarly, each additional year of tenure increases their number of votes by 258 in absolute or 0.7 per cent in relative terms. In contrast, these politicians fare less well with voters of their own party. Their own voters are prone to striking incumbents off the ballot paper. Current MPs obtain significantly fewer preference votes, 2269 on average or 2.6 per cent relatively speaking, from their partisan voters, and are also punished for higher tenure. We therefore contend that as with the experimental part of our study, the obtained non‐effect reflects a true null finding.
Discussion and conclusion
For many candidates and holders of elected public office, talking about localness and signalling engagement with local topics in social media is an essential part of how they signal representation of their constituency. While politicians exhibit this behavioural localism – referring to geographic locations in their constituency – particularly during campaign season with the expectation to be electorally rewarded, the findings of this article cannot provide evidence for the fulfilment of these hopes. We demonstrate that parliamentarians indeed use local cues particularly in social media posts when they are campaigning (boosting the percentage of Tweets with local cues from roughly 7 per cent to roughly 12 per cent). However, voters, while conscious of these signals, do not reward them. Contrary to our expectation, citizens do not view MPs more favourably for using local cues. Citizens are not more intent to vote for them – and MPs subsequently do not experience any boost at the polls. This highlights the existence of a clear divide between parliamentarians' expectations and voters' perceptions of MPs' behaviour.
Our finding that hope and reality diverge so much when it comes to parliamentarians' use of local cues in social media is surprising. In the observational context, one might have expected the effect of frequently using local cues to be even conflated with what they reference: the impact of mentions of the constituency is likely in part driven by MPs' actual constituency work. However, as we do not observe the expected positive brute force effect of local cues even in the most likely observational scenario of Switzerland, there is little reason to believe that local cues in other contexts would yield different results. Rather, our multi‐country survey experiment with citizens further reinforces this result: local cues in social media do not suffice to improve one's odds with voters. Our non‐result is also remarkably stable across the different electoral contexts of our survey experiment which differ in terms of incentives to cultivate a personal vote. Together with the same non‐significant finding of study 3 focusing on the case of Switzerland where the incentive to cultivate a personal vote is particularly accentuated, makes these findings even more noteworthy in our view.
These findings suggest that cues of localism are not very relevant to voters. On the one hand, citizens may doubt the evidence of a link between signalling localness and actual interest in the local constituency. They would therefore assume that the cue they receive is not an accurate signal for attention and therefore refuse to respond to it. On the other hand, we can also imagine that geographic representation may not be something that voters care much about, either because they feel that in a globalized world local action is not having a lot of impact (see also Hellwig, Reference Hellwig2008) or because they value other forms of representation more (see, e.g., Bengtsson & Wass, Reference Bengtsson and Wass2010; Von Schoultz & Papageorgiou, Reference Von Schoultz and Papageorgiou2021).Footnote 21
Although our study is based on a wide range of evidence, it has certain limitations. The number of countries studied in Parts I and III is relatively small. While the experimental results in Part II suggest some generalizability, a more comprehensive study covering additional countries and a longer time span would be highly valuable. Moreover, the experiment on voters' reactions in Part II is limited in two important ways. First, it examines only one specific method of signalling localness, and, second, it focuses exclusively on the economy as a valence issue. Future research should not only explore how different substantive messages affect localness cues but also ensure that the length of both the treatment and control group interventions is balanced, while gathering more detailed information on whether the treatment worked as intended.
It is conceivable that different types of local cues elicit different reactions from voters. After all, signals of localism can take different forms (Martin, Reference Martin2011). One should therefore be aware that while our automated approach is able to reliably detect strong local cues, it is more difficult to capture more subtle signals. Future research could explore how different types of local cues – for example referring only to events or actual locally targeted policy instruments– are received by voters. Local cues that emphasize descriptive local representation – the politician highlighting their ties to the district – might work differently from substantive local representation where the MP uses policy‐related local cues in the sense of pork‐barrel politics. In a similar vein, the context for the use of cues might also affect how citizens associate signalling localness with a genuine interest to act for the local constituency. Cues might be valued differently depending on whether they are used in social media, in parliamentary speeches, or in policy‐relevant initiatives in parliament.
Moreover, one might imagine that perceptions of what is perceived as local vary from one individual to another. While we apply a high‐resolution approach to localness, this cannot address the heterogeneity in local identity. The specificity of high‐resolution local cues may be too high for someone with a very narrow definition of what they consider local, for example, only their neighbourhood. As previous literature has already established that geographical distance matters (Arzheimer & Evans, Reference Arzheimer and Evans2012), it may be interesting for future work to further disentangle the concept of political localness. Similarly, there is a lack of weighting for how broadly the terms appeal to the electorate in a given constituency. Cues referring to cities and larger areas are used more frequently, presumably to appeal to more voters. It would therefore be a fruitful but challenging task to quantify the catchment area of cues in order to define their electoral relevance and apply weights.
Furthermore, it is also possible that local cues on social media function differently across platforms. Our article focused on Twitter as a way of engaging citizens politically. The platform favours a mode of communication in which the messages from political elites are presented to followers and amplified on the platform (Popa et al., Reference Popa, Fazekas, Braun and Leidecker‐Sandmann2020; Silva & Proksch, Reference Silva and Proksch2022) and through traditional media (Oschatz et al., Reference Oschatz, Gil‐Lopez, Paltra, Stier and Schultz2024). Other social media, such as TikTok and Instagram, arguably involve more direct forms of engagement with the audience, where the development of a unique persona or the creation of viral videos is crucial (Moir, Reference Moir2023). Particularly in an observational setting,Footnote 22 it would be worth testing whether local cues are more effective when reaching more voters without or with fewer intermediaries.
While it would hence be too early to discount signals of localism in social media as a useless campaigning tool, our study highlights the need for further theory building. If there is an effect, it is likely circumstantial, not directly tied to frequencies, or limited to a specific subset of local cues or subconstituencies. And given MPs' continued use of this tactic, particularly before elections, it is also a tactic worth exploring further.
Acknowledgements
The authors would like to thank Eri Bertsou, Tom Louwerse, the participants of the panel ‘Personalization in Contemporary Political Communication’ at the ECPR General Conference 2020, the STAFF colloquium at the University of Geneva and the Work in Progress seminar at the Department of Sociology at Tilburg University, as well as three anonymous reviewers for their incredibly helpful comments on earlier versions of this paper. They also gratefully acknowledge financial support for this research from the Swiss National Science Foundation (grant no. 183248).
Open access funding was provided by the University of Vienna/KEMÖ.
Data availability statement
The data and code to replicate the three component studies of this article are available online at https://github.com/TomasZwinkels/ProjectR036_localcues, https://github.com/TomasZwinkels/ProjectR036_localnotlocalexperiment and https://github.com/TomasZwinkels/ProjectR036_localcues.
Online Appendix
Additional supporting information may be found in the Online Appendix section at the end of the article:
Data S1



 Open access

