


Introduction
A person’s chronological age is not always closely related to his/her biological age. Biological ageing occurs predominantly at cellular level as a result of accumulating cellular damages, caused by several molecular mechanisms, including mitochondrial dysfunction, oxidative stress, accumulation of aberrant proteins, somatic mutations, DNA damage and telomere shortening.Reference Kirkwood1,Reference Franzke, Neubauer and Wagner2 These mechanisms are strongly regulated by the defence and repair systems, which maintain the cellular balance and functionality.Reference Ioannidou, Goulielmaki and Garinis3 Impairment of cellular maintenance pathways or increased accumulation of cellular damage due to extrinsic hazards compromises the cell function, leading to an increased velocity of biological ageing.Reference Kirkwood1
Chronological age is the strongest unmodifiable risk factor for mortality and major non-communicable diseases, including cancer, cardiovascular and neurodegenerative diseases.Reference Niccoli and Partridge4 Evidence on environmental influences on the rate of accumulation of cellular damage, and therefore biological ageing, suggests that some of the adverse effects of aging could be, at least partially, modified.Reference Sniderman and Furberg5 To date, numerous biomarkers to predict the biological age have been developed, starting from physical functions and anthropometric measurements to molecular and DNA-based biomarkers.Reference Wagner, Cameron-Smith, Wessner and Franzke6,Reference Horvath and Raj7 Two of the most promising DNA-based age biomarkers are DNA methylation and telomere length, and several different methods to quantify the biological age using these biomarkers have been developed.Reference Horvath and Raj7–Reference Sanders and Newman10
Horvath’s multi-tissue DNA methylation clockReference Horvath8 is the most widely used age biomarker in humans, with a strong correlation with chronological age (Pearson rho >0.90 in studies with a wide age range). The epigenetic age acceleration (AA), that is, the difference between epigenetic and chronological age, has been consistently associated with overall mortality and many chronic conditions, including cardiovascular diseases and cancer.Reference Marioni, Shah and McRae11–Reference Perna, Zhang, Mons, Holleczek, Saum and Brenner14 Although the molecular mechanisms behind the epigenetic AA are largely unknown, epigenetic AA is one of the most popular measures of biological ageing.
Early life programming, induced by environmental factors at different stages of prenatal and early postnatal life, likely involves life-long alterations in the epigenetic programming and the regulation of gene transcription.Reference Burdge, Hanson, Slater-Jefferies and Lillycrop15 In fact, emerging evidence supports the role of environmentally induced epigenetic variations in linking early life exposures to long-term outcomes. Epigenetic age and gestational age accelerations at birth and in childhood have been associated with both early life environment, including maternal characteristics, socio-economic conditions and perinatal outcomes,Reference Khouja, Simpkin and O’Keeffe16–Reference Simpkin, Hemani and Suderman20 and numerous childhood health outcomes.Reference Simpkin, Hemani and Suderman20–Reference Peng, Cardenas and Rifas-Shiman24
Socio-economic differences in health have been widely documented, and low socio-economic position (SEP) is known to be one of the most important risk factors for ageing-related chronic diseases. Although parental SEP, early life and current socio-economic disadvantage have been reported to leave epigenetic signatures at birth,Reference Alfano, Guida and Galobardes25 during childhood and in adulthood,Reference Alfano, Guida and Galobardes25–Reference Austin, Chen and Ross27 findings on epigenetic AA are less consistent. For example, epigenetic AA has been associated with a low educational level in adulthood in a multi-cohort study,Reference Fiorito, Polidoro and Dugué28 but not with low SEP in two UK cohorts of adult womenReference Lawn, Anderson and Suderman17 and in two studies based on children from the UK ALSPAC birth cohort.Reference Khouja, Simpkin and O’Keeffe16,Reference Simpkin, Hemani and Suderman20
In addition to SEP, adverse pregnancy outcomes, such as low birthweight, preterm birth and delivery by caesarean section, are known to leave long-term health effects and found to be associated with specific epigenetic marks.Reference Küpers, Monnereau and Sharp29–Reference Cruickshank, Oshlack and Theda31 The ALSPAC study, in their cord blood analysis, reported epigenetic AA associated with caesarean delivery, but not with birthweight and gestational age.Reference Simpkin, Hemani and Suderman20 In the same study, peripheral blood epigenetic AA in childhood and adolescence was associated with birthweight, but with the opposite direction of the association. Also, gestational AA of the offspring at birth in a Finnish study of 814 mother–newborn pairs was associated with several maternal risk factors and birth outcomes, including lower birth size and 1-min Apgar score.Reference Girchenko, Lahti and Czamara18 On the contrary, another study conducted within the ALSPAC cohort (N = 863) found greater cord blood gestational AA to be associated with larger birth size.Reference Khouja, Simpkin and O’Keeffe16
As few studies used biological samples other than blood to estimate epigenetic age in infancy, and given conflicting findings on the associations of SEP and pregnancy outcomes with early life epigenetic AA, we estimated, in the NINFEA (Nascita ed INFanzia: gli Effetti dell’Ambiente) birth cohort, saliva epigenetic age in children aged 7–17 months, and then investigated whether parental socio-economic status, pregnancy outcomes and caesarean section are associated with infant saliva epigenetic AA.
Methods
Study population
Data were taken from an epigenome-wide case–control study on early childhood wheezing, nested within the NINFEA birth cohort.Reference Popovic, Fiano and Fasanelli32 The NINFEA study is an Italian web-based birth cohort that, during the period 2005–2016, recruited approximately 7500 pregnant women who had access to the Internet, enough knowledge of Italian to complete online questionnaires, and volunteered to participate (https://www.progettoninfea.it).Reference Richiardi, Baussano and Vizzini33 Women completed the baseline questionnaire at enrolment, and children are currently followed up with six questionnaires completed by mothers 6 and 18 months after delivery, and when children turn 4, 7, 10 and 13 years of age. At the end of the 6-month questionnaire, participating mothers were invited to collect their and their child’s saliva samples, using the Oragene™ DNA self-collection kit (Infant Sponge Kit, CS-1, and OG-250, DNA Genotek, Inc., Ottawa, Ontario, Canada). Mothers who did not respond to this initial invitation were invited again at the end of the 18-month and 4-year questionnaire. Only children with saliva samples collected between 7 and 17 months of age were considered in this study.
The original case–control study was conducted within the subset of the NINFEA children who met the following criteria: (i) singleton child, (ii) saliva sample collected between 6 and 18 months after birth, (iii) residence in the Province of Turin and (iv) born to mother who did not have asthma during the index pregnancy. A total of 72 cases with at least one reported episode of wheezing between 6 and 18 months of age were matched to 72 controls by sex, age at sampling and seasonality/calendar year of sampling. Although information on children ethnic background was not available in the NINFEA cohort, almost the entire study population has both parents born in Italy, and only few study children have one of the parents born in other European countries. Therefore, the ethnic background of the children included in the study is, if not entirely, largely European.
Saliva DNA methylation
Saliva samples are stored in a biobank at −80 °C. Genomic DNA was extracted from the selected 144 saliva sponge samples by using the OrageneTM Purifier Solution (DNA Genotek, Inc., Ottawa, Ontario, Canada). Genomic DNA was bisulphite converted using the EZ DNA Methylation-GoldTM Kit (Zymo Research, CA, USA) following the manufacturer’s protocol. The methylation status of over 485,000 probes was measured using the Infinium HumanMethylation450 BeadChip array (Illumina, Inc., San Diego, CA). The matched pairs were placed on the same chip to minimise confounding by batch. DNA methylation for each probe was expressed as beta-value (ratio of methylated probe intensity to overall intensity, representing 0%–100% methylation at each probe). Pre-processing steps and quality control were described before.Reference Popovic, Fiano and Fasanelli32,Reference Popovic, Fasanelli, Fiano, Biggeri and Richiardi34 After quality control checks and probes filtering, three samples with more than 1% of the CpGs with detection p > 0.01 were excluded, resulting in a total of 141 samples and 421,782 probes included in this study.
Saliva is known to have a heterogeneous cellular composition, mostly composed of buccal epithelial cells and leucocytes.Reference Theda, Hwang, Czajko, Loke, Leong and Craig35,Reference Langie, Moisse and Declerck36 In the absence of saliva reference methylomes, we used the Houseman’s reference-free method (RefFreeEWAS package in R)Reference Houseman, Kile, Christiani, Ince, Kelsey and Marsit37 to estimate proportions of putative cell types based on their underlying methylomes. From the 10,000 most variable CpGs, we identified two latent variables as the optimal number of surrogates for cell-type mixture, which is in accordance with previously reported saliva cell heterogeneity profiles in older children.Reference Theda, Hwang, Czajko, Loke, Leong and Craig35,Reference Langie, Moisse and Declerck36 We then used the 421,782 CpGs to estimate the proportion of the two cell types per sample.
Exposures
We analysed the following socio-economic factors: parental educational level (low – primary school or less/medium – secondary school, and high – university degree), parental unemployment (employed and unemployed) at the time of conception, family size (including the index child; 2 members, 3–4 members, and 5 and more members), maternal age at delivery and an indicator of the equivalised total disposable household income at birth (the highest three quintiles vs. the lowest two quintiles of the entire NINFEA cohort distribution). The equivalised total disposable household income indicator at birth has been developed within the European Horizon 2020 LifeCycle project and it uses external data from the pan-European surveys ‘European Union Statistics on Income and Living Conditions’ (EUSILC) and internal household and parental characteristics available within cohorts.Reference Pizzi, Richiardi and Charles38 For the NINFEA cohort, the income indicator has been constructed using the following parental and household baseline characteristics: cohabitation with partner, family size (number of children and adults in the household), dwelling type, number of rooms in the house, maternal age and country of birth, parental education and occupation and maternal job coded using the ISCO-88 (International Standard Classification of Occupations) classification.Reference Pizzi, Richiardi and Charles38
Pregnancy outcomes included birthweight (grams), gestational age (weeks), size for gestational age (small, appropriate and large for gestational age, based on the 10th and the 90th percentile of the World Health Organization birthweight for sex and gestational age charts)Reference Kiserud, Piaggio and Carroli39 and mode of delivery (vaginal delivery vs. caesarean section). All variables were measured through questionnaires completed by mothers either during pregnancy (socio-economic factors) or 6 months after delivery (pregnancy outcomes).
Statistical analysis
We estimated DNA methylation age for each infant saliva sample by applying the Horvath’s method to raw beta-values.Reference Horvath8 Horvath used 8000 samples from 82 Illumina DNA methylation array data sets, across an extensive range of ages and tissue samples, to identity 353 DNA methylation sites predictive of chronological age.Reference Horvath8 Two outliers in the NINFEA dataset were removed as their predicted epigenetic age estimates were 4 standard deviations [SDs] above the sample mean, which resulted in a total of 139 samples for the subsequent analyses.
As the Horvath’s age estimation method was developed using samples across wide age ranges, a new method for measuring DNA methylation age in children, named the Pediatric-Buccal-Epigenetic (PedBE) clock, has been recently developed.Reference McEwen, O’Donnell and McGill40 This method was developed using buccal samples of individuals between 0 and 20 years of age, and it uses weighted DNA methylation values at 94 CpG sites to predict chronological age.Reference McEwen, O’Donnell and McGill40 Given the large predominance of buccal epithelial cells in saliva samples, especially in young children,Reference Theda, Hwang, Czajko, Loke, Leong and Craig35,Reference Langie, Moisse and Declerck36 we additionally estimated DNA methylation age using the PedBE clock, but decided to present these results only as a supplementary analysis (Supplementary Table S1; Supplementary Fig. S1), as in the NINFEA dataset there was an extremely high correlation between the age estimated using the PedBE clock and the cell-type proportions estimated using the Houseman’s reference free method (Supplementary Fig. S2), Thus, studying the epigenetic age would have been the same as studying the proportion of buccal cells in the saliva.
The Pearson’s correlation, the R2 and the median absolute difference (‘median error’) between the predicted and chronological age were used to assess the performance of the Horvath’s age predictor. The individual epigenetic AA was defined as the residual from the linear regression of epigenetic age on chronological age. This measure of AA is independent of chronological age, with, relative to the chorological age, positive values indicating epigenetic age acceleration and negative values indicating epigenetic age deceleration.
Using linear regression models, we tested the associations of parental SEP and pregnancy outcomes with the epigenetic AA (in months). For all analyses we fitted two models for each independent variable: (i) Model 1 adjusted for child’s sex, technical batch (chip), the two estimated saliva cell-type proportions and child wheezing at age 6–18 months, as the indicator of being a case or a control in the original case–control study; and (ii) Model 2 additionally adjusted for maternal age and parity in the analyses of socio-economic factors, and for maternal age, parity, maternal education and pre-pregnancy body mass index (BMI) in the analyses of pregnancy outcomes. The Model 2 for maternal age at delivery was adjusted for maternal education, occupation, parity and pre-pregnancy BMI. Birthweight and gestational age were also mutually adjusted in Model 2. In the NINFEA cohort, an equivalised total disposable household income indicator was predicted using, as one of the predictors, maternal age, so we excluded maternal age from the adjusted model of household income. Although maternal smoking during pregnancy is strongly associated with pregnancy outcomes and with offspring DNA methylation, the prevalence of smoking in our sample was rather low (N = 3; 2.2%), so we did not adjust for maternal smoking in our analyses.
Finally, to assess the relative contribution of individual CpG sites from the Horvath’s DNA methylation predictor to infant saliva epigenetic age estimates, we ranked all 353 CpG sites according to their weight metric (%) calculated by multiplying each CpG interquartile range with the absolute value of the Horvath’s training coefficient for that CpG site. We compared the top ranked CpG sites with those reported in another epigenetic age study based on newborn saliva samples.Reference Phang, Ross and Raythatha41
All the analyses were performed using the computing environment R version 3.6.1 (R Development Core Team, 2019).
Results
The characteristics of the 139 children included in the analyses are shown in Table 1. The mothers were on average 34.5 years old at delivery, the two-thirds were nulliparous and 14.5% were obese or overweight before pregnancy. In the study sample, 72.5% of the mothers were highly educated (university degree or higher), more than 90% of the mothers and almost all the fathers (97.8%) were employed, while the average predicted equivalised total disposable household income was 1768.6 euros per month. Among children, the mean gestational age at delivery was 39.5 weeks, the mean birthweight was 3241 g, and 36.7% were delivered by caesarean section.
Characteristics of the study population (N = 139)

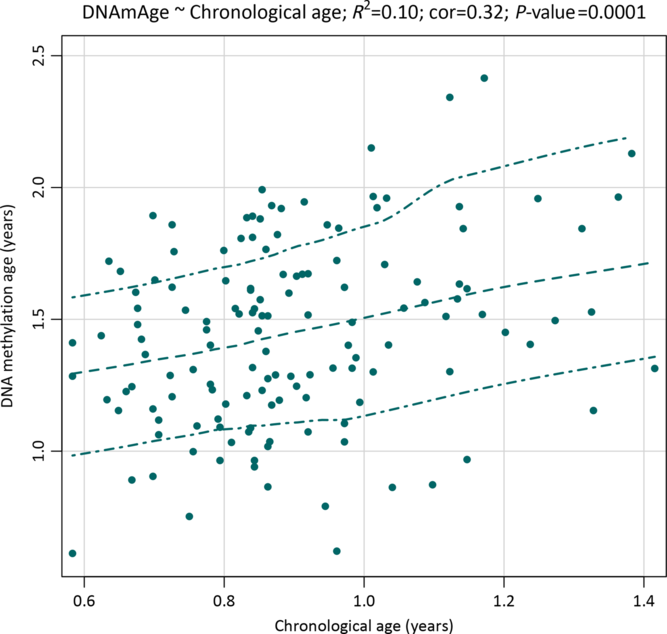
The mean age at saliva sampling was 10.8 months (SD 2.2; range 7–17), while the mean Horvath’s DNA methylation age was 17.5 months (SD 4.4; range 7.3–34.3) (Table 2). There was a positive association between chronological age and DNA methylation age (Pearson’s r = 0.32, p = 0.0001; Fig. 1). The correlation was moderate compared with the one reported in the original Horvath’s study (r > 0.90 in most of the tissues and cell types)Reference Horvath8 due to the much narrower chronological age range of our sample (7–17 months). Several studies with restricted sample age ranges reported analogous correlations between the estimated Horvath’s epigenetic age and chronological age.Reference Lawn, Anderson and Suderman17,Reference Suarez, Lahti and Czamara19,Reference Simpkin, Howe and Tilling21–Reference Binder, Corvalan and Mericq23 The median absolute difference (median error) between DNA methylation age and chronological age was 6.8 months (mean 6.9; SD 3.9).
Chronological age and predicted Horvath’s DNA methylation age in the NINFEA sample
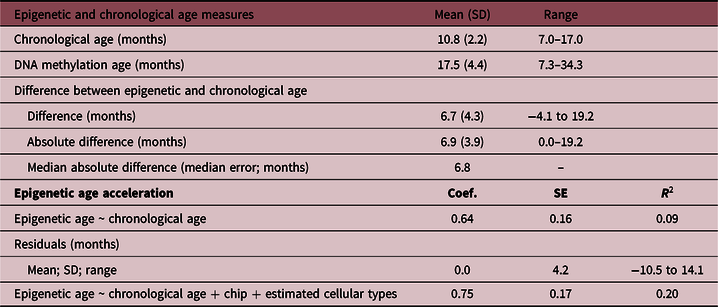
SD, standard deviation; Coef., linear regression coefficient; SE, standard error; R 2, coefficient of determination.
A scatterplot with a smoothed regression line and 95% CIs showing associations between saliva DNA methylation age and chronological age in infants from the NINFEA birth cohort.
Using the weighting metric described in ‘Methods’ section, the 20 top ranked CpG sites, that is, the strongest CpG predictors from the Horvath’s epigenetic clock in our study, contributed collectively to the 25.9% of the total weight metric. Among these, 11 CpGs overlapped with the 20 most influential CpG sites in the newborn saliva study by Phang et al.,Reference Phang, Ross and Raythatha41 adding to 14.9% of the total weight in our study and 21.0% in the study by Phang et al. The 11 overlapping CpG in studies on newborn/infant saliva map to the following genes: NHLRC1, CSNK1D, PPP1R14A, FZD9, FXN, RASSF4, BCMO1, SCGN, PAWR, RXRA and DPP8. The complete list of CpG sites, with their rankings and functional characteristics, is shown in Supplementary Table S2.
In the NINFEA saliva samples, the PedBE clock had weaker correlation with chronological age compared with Horvath’s epigenetic clock (Pearson’s r = 0.24 for PedBE clock, r = 0.32 for Horvath’s epigenetic clock), and showed slightly higher saliva epigenetic age compared with Horvath’s epigenetic age method (Supplementary Table S1; Supplementary Fig. S1).
Parental socio-economic characteristics, pregnancy outcomes and offspring saliva epigenetic AA
The associations of parental socio-economic characteristics and pregnancy outcomes with the offspring epigenetic AA are shown in Table 3 and Fig. 2. Overall, there was a suggestion of an association between the indicators of low SEP and epigenetic AA, but the evidence for each indicator was weak, also due to large confidence intervals (CIs) and low SEP-associated heterogeneity in the study sample. In particular, infants born to unemployed mothers or mothers with low or medium educational level had on average 1 month higher epigenetic age compared with infants of mothers with high education and employment (coefficient 0.78 months, 95% CIs: −0.79 to 2.34 for maternal low/medium educational level, and coefficient 0.96, 95% CI: −1.81 to 3.73 for maternal unemployment). Similar estimates were also found for a low total household income (first and second quintile compared with the highest three quintiles 0.74, 95% CI: −0.95 to 2.43) and large family size (>4 members compared with 3–4 members 0.86; 95% CI: −2.02 to 3.75). The estimate observed for paternal unemployment status (2.82 months; 95% CI: −2.23 to 7.88) should be interpreted with caution as in our sample only three children had fathers who were unemployed (Table 1).
Associations of familial socio-economic status and pregnancy outcomes with saliva epigenetic AA in infants
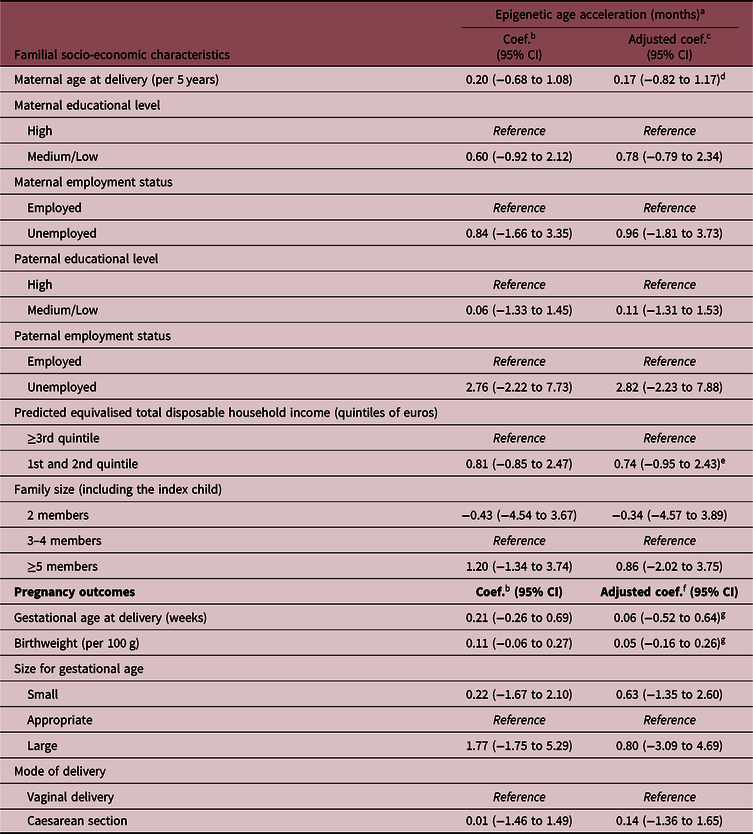
Coef., regression coefficient; CI, confidence intervals.
a Unstandardised residual regressing DNA methylation age on chronological age.
b Adjusted for child sex, technical batch (chip), estimated saliva cell count types and child wheezing.
c Adjusted as b and additionally adjusted for maternal age and parity.
d Adjusted as b and additionally adjusted for maternal education, occupation, parity, and pre-pregnancy BMI.
e Adjusted as b and additionally adjusted for maternal parity.
f Adjusted as b and additionally adjusted for maternal age, parity, maternal education and maternal BMI.
g Gestational age and birthweight were mutually adjusted.
Coefficient estimates with 95% CIs for the association of parental and familial socio-economic characteristics and pregnancy outcomes with infant saliva epigenetic age acceleration (months). Reference groups: parental high education (university or higher), parental employment, high income (ranked to ≥ 3rd quintile), 3–4 family members in the household, vaginal delivery. Model 1 adjustment (red): child’s sex, technical batch (chip), estimated saliva cell count types and child wheezing as a selection factor; Model 2 adjustment (blue): as Model 1 and additional adjustment for maternal age and parity in analyses of socio-economic characteristics, and for maternal age, parity, maternal education and maternal pre-pregnancy BMI in analyses of pregnancy outcomes. Gestational age and birthweight were mutually adjusted in Model 2.

In our study, there was no evidence for associations of gestational age, birthweight or delivery by caesarean section with infant saliva epigenetic AA estimated using Horvath’s epigenetic clock (Table 3, Fig. 2).
Similarly, we found no association of parental SEP or pregnancy outcomes with infant PedBE AA (data not shown).
Discussion
Using saliva samples from 139 infants of the NINFEA birth cohort study, we examined epigenetic DNA methylation age, its correlation with chronological age and the associations of parental socio-economic characteristics and pregnancy outcomes with epigenetic age acceleration/deceleration. We found a moderate association between epigenetic and chronological age in the first 1.5 years of life, and only an indication of an accelerated epigenetic aging in infants from lower socio-economic backgrounds. This study did not identify associations of gestational age, birthweight or delivery by caesarean section with the rate of early life epigenetic AA.
The sample analysed in our study had a quite narrow age range (7–17 months, SD 2.2 months), so the correlation between the estimated epigenetic and chronological age was moderate (Pearson’s r = 0.32), with the mean difference between epigenetic and chronological age of approximately 6 months. This is, however, expected and in line with other studies that analysed samples with low SDs in chronological age.Reference Horvath8,Reference Lawn, Anderson and Suderman17,Reference Suarez, Lahti and Czamara19,Reference Simpkin, Howe and Tilling21–Reference Binder, Corvalan and Mericq23
Most of the previous studies focused on the effects and causes of accelerated/decelerated epigenetic age in adult populations,Reference Ryan, Wrigglesworth, Loong, Fransquet and Woods42 and some studies reported that a difference between DNA methylation age and chronological age may already occur at birth as a consequence of unfavourable prenatal environment.Reference Khouja, Simpkin and O’Keeffe16,Reference Girchenko, Lahti and Czamara18,Reference Suarez, Lahti and Czamara19 To our knowledge, no studies looked at these changes in infancy. We showed that Horvath’s epigenetic clock predicts the chronological age in the first months of life, with a similar performance of studies based on saliva samples collected at later ages,Reference Davis, Humphreys and McEwen22,Reference Jovanovic, Vance and Cross43 and can be used to explore epigenetic AA in infancy.
Previous findings on socio-economic status and epigenetic ageing are conflicting. An accelerated epigenetic ageing has been found in adults with early life or current socio-economic disadvantage,Reference Austin, Chen and Ross27,Reference Fiorito, Polidoro and Dugué28 but not all studies confirmed these associations,Reference Lawn, Anderson and Suderman17,Reference Hughes, Smart and Gorrie-Stone44 and no such epigenetic signatures were observed at birth or in childhood.Reference Khouja, Simpkin and O’Keeffe16,Reference Simpkin, Hemani and Suderman20,Reference Sumner, Colich, Uddin, Armstrong and McLaughlin45 We used several maternal, paternal and household SEP measures, as well as the predicted equivalised total disposable household income, which captures yet another dimension of SEP, namely, the material property in the country-specific context. Our findings support previous findings of no strong association between parental SEP and the rate of offspring epigenetic ageing in the first years of life. Nevertheless, the direction of the association observed in our and other studies based on children may indicate that the changes observed in adults may initiate early in life and that these small effects may then accumulate as a result of life-long deprivation. It should be, however, acknowledged that despite the existing contrast between medium and high socio-economic level in our sample, few children came from very low socio-economic background, and therefore the effect of severe early childhood deprivation might not have been captured in this study.
The lack of association between gestational age and epigenetic AA is consistent with previous studies that assessed epigenetic AA either at birth from cord blood or later in childhood from peripheral blood samples, where there was nearly no association between Horvath’s epigenetic AA and gestational age.Reference Girchenko, Lahti and Czamara18,Reference Simpkin, Hemani and Suderman20 Horvath’s DNA methylation age was designed to estimate chronological age and its consistent weak association with gestational age could reflect different postnatal age-specific changes unrelated to prenatal development. In fact, several tissue-specific gestational age predictors have been developed using DNA methylation from umbilical cord blood or blood spot samples,Reference Knight, Craig and Theda46,Reference Bohlin, Håberg and Magnus47 but only few CpG sites from these predictors overlap with the Horvath’s epigenetic age predictor. Despite these differences, gestational epigenetic age acceleration and deceleration have also been associated with some of the maternal characteristics and pregnancy and birth outcomes.Reference Khouja, Simpkin and O’Keeffe16,Reference Girchenko, Lahti and Czamara18 In particular, the directions of the associations were mixed for birthweight, where a negative association with gestational AA was observed in a Finish study,Reference Girchenko, Lahti and Czamara18 while a positive association was reported in a UK study.Reference Khouja, Simpkin and O’Keeffe16 Inconsistent findings on birthweight were also found using the Horvath’s method in another UK study based on the same cohort, where birthweight was not associated with epigenetic AA at birth, while the association was in the opposite direction in the analyses conducted in childhood compared with those conducted in adolescence.Reference Simpkin, Hemani and Suderman20 Similarly, we found no association between birthweight and saliva epigenetic age acceleration in infancy.
In contrast with two previous studies,Reference Khouja, Simpkin and O’Keeffe16,Reference Simpkin, Hemani and Suderman20 we did not find an accelerated epigenetic age in children born by caesarean section. It should be, however, noted that in both previous studies there was only a marginal positive association with caesarean delivery at birth, and that it disappeared later in childhood.
Epigenetic AA can be seen as a proxy of adverse environmental exposures and a mechanism through which these exposures influence later disease risk, or as a consequence of adverse health outcomes. In fact, it has been associated both with prenatal and early postnatal environmental adversity and with later health outcomes, such as high BMI, asthma and mortality.Reference Marioni, Shah and McRae11–Reference Perna, Zhang, Mons, Holleczek, Saum and Brenner14,Reference Khouja, Simpkin and O’Keeffe16–Reference Fiorito, Polidoro and Dugué28 Despite mainly weak associations, epigenetic AA has been linked with multiple exposures and outcomes, which makes complicated the understanding of what is actually measured with DNA methylation clock. It could be seen as an overall epigenetic shifting in response to adverse events, not exclusive of any specific insult, but an intrinsic response of an organism to unfavourable environment in general. If so, it is not unexpected that the associations reported so far with single adverse factors operating early in life are relatively small in magnitude and often inconsistent. However, even small-magnitude effect sizes are important and could have functional relevance for later childhood and adulthood health.
The lack of associations with parental SEP and pregnancy outcomes in our study may be due to several factors. First, most of the previous studies that found associations with these two groups of exposures estimated DNA methylation age using cord or peripheral blood samples. It is well established that epigenetic mechanisms are cell-type specific, so it might be well possible that pregnancy outcomes and SEP-related changes in epigenetic AA are not present in all tissues and cell types. Second, the potential epigenetics marks of prenatal exposures that are present at birth may be reversible (or, conversely, might further accumulate) postnatally. Due to the extensive growth and development in the first months of life, it is expected that the dynamic of epigenetic changes is particularly rapid in infancy, and thus the epigenetic marks of prenatal exposures might have already disappeared by the first year of life. Third, some of the characteristics analysed in our study, for example, paternal unemployment, small family size and large for gestational age, had less than 10 exposed children available for the analyses. The sample size was thus relatively small, and our results should be seen in the overall context of the available and the future literature rather than a single ultimate study with high statistical power.
Conclusions
We have provided evidence that, using the Horvath’s method, DNA methylation age can be fairly accurately predicted from saliva samples already in the first months of life. This is important as saliva represents one of the most easily accessible non-invasive biological samples for DNA methylation analyses in large population studies, especially at young ages. Horvath’s epigenetic clock indicates only a suggestion of an accelerated epigenetic aging in infants from lower socio-economic backgrounds, and no evidence of association between epigenetic AA and pregnancy outcomes, including gestational age, birthweight and mode of delivery.
Supplementary material
To view supplementary material for this article, please visit https://doi.org/10.1017/S2040174420000380
Acknowledgements
The authors are grateful to all the participants of the NINFEA cohort.
Financial Support
The NINFEA study was partially funded by the Compagnia San Paolo Foundation. This research was partially funded by the Italian Ministry for Education, University and Research (Ministero dell’Istruzione, dell’Università e della Ricerca – MIUR) under the programme “Dipartimenti di Eccellenza 2018–2022”, and by the European Union’s Horizon 2020 research and innovation programme under grant agreement no. 733206, LIFE-CYCLE project.
Conflicts of Interest
None.
Ethical standards
The authors assert that all procedures contributing to this work comply with the ethical standards and with the Helsinki Declaration of 1975, as revised in 2008. The NINFEA study protocol and subsequent amendments have been approved by the Ethical Committee of the San Giovanni Battista Hospital – CTO/CRF/Maria Adelaide Hospital, Turin, Italy (approval no. 0048362). All women gave their informed consent at recruitment and when donating saliva samples.


 Open access