Introduction
Tuberculosis (TB), an airborne bacterial infection caused by the organism Mycobacterium tuberculosis (Mtb), has surpassed HIV/AIDS as the leading cause of death due to a single infectious organism worldwide [1]. It primarily attacks the lungs but can also infect other areas of the body [2, 3]. Those exposed to Mtb often develop latent TB infection (LTBI) and have a 5–10% lifetime risk of progressing to active TB [4, Reference Horsburgh5]. Worldwide, 2–3 billion people are infected with TB; an estimated 10.4 million people developed active TB disease in 2015 [4]. Major innovations in strategies and tools to monitor the success of new strategies are needed to achieve the World Health Organisation (WHO)’s ENDTB goals of reducing TB deaths by 95% and new cases by 90% by 2035 [4].
The reproductive number and serial interval (SI) are two key quantities in describing transmission of an infectious disease. The reproductive number is defined as the average number of secondary cases a primary infectious case will produce. In a totally susceptible population, it is referred to as the basic reproductive number (R 0); it is referred to as the effective reproductive number (R e) if the population includes both susceptible and non-susceptible persons [Reference Biggerstaff6]. An R e > 1 indicates that the disease will continue to spread while an R e < 1 indicates that the disease will eventually die out. Although the reproductive number is usually defined as the average number of secondary cases, it is occasionally defined as the average number of secondary infections [Reference Furuya, Nagamine and Watanabe7–Reference Gumel and Song10], a distinction that is important for a disease with a long incubation period (the time between infection and developing symptomatic disease) and/or only a fraction of infections progressing to disease. Depending on the setting, the reproductive number can be expressed as a function of parameters such as infection rate, contact rate, recovery rate, making it useful in determining whether or not a disease can spread through a population.
The serial interval (SI), defined as the time between disease symptom onset of a case and that of its infector [Reference Boëlle11], is a surrogate for the generation interval – an unobservable quantity defined as the time between the infection of a case and the time of infection of its infector [Reference Moser12]. The SI is an important quantity in the interpretation of infectious disease surveillance data, in the identification of outbreaks and in the optimisation of quarantine and contact tracing.
These two quantities have been used to inform control policies during outbreaks [Reference Fraser13] by quantifying the transmission of infectious diseases such as influenza A (H1N1) [Reference Boëlle11, Reference Moser12, Reference White14], Severe Acute Respiratory Syndrome (SARS) [Reference Moser12, Reference Riley15] and Ebola [Reference White and Pagano16, Reference Chowell17], where progression to disease upon transmission occurs quickly. For example, Wallinga and Teunis [Reference Wallinga and Teunis18] in 2004 demonstrated the impact of the first global alert against SARS on the change of the effective reproductive number.
TB has a slower transmission rate due to its much longer incubation period. Of the 5–10% of infections that develop into active (symptomatic and infectious) TB disease, it is thought that the majority occur within the first 2 years after infection [2, Reference Horsburgh5, Reference Hartman-Adams, Clark and Juckett19], although active TB disease can develop decades after initial infection [Reference Lillebaek20]. This is much longer than the aforementioned infectious diseases where cases show symptoms within days of infection. Although there is an increasing consensus that some transmission events may occur before the infector shows symptoms, many likely occur after the infector is symptomatic, therefore, the longer the incubation period is, the longer the SI (Fig. 1).
Important infectious disease intervals. The time between a and c is the serial interval; the time between b and c is the incubation period.

Development of TB disease can be caused by de novo infection, reactivation of the same bacterial strain as a previous infection [Reference Horsburgh5, Reference Lambert21] or by infection with a bacterial strain different from the original infection (reinfection TB). This complicates estimation of the serial interval, unless molecular techniques are used to distinguish reinfection and reactivation [Reference Lambert21]. To our knowledge, there has been no systematic review of methods to estimate the serial interval and reproductive number for TB. Therefore, in this paper we systematically review the literature to examine the methods applied to the estimation of TB transmission parameters and the estimates obtained from these methods. This compilation informs the gaps in our understanding of TB and identifies areas where further research is needed to develop methods to better understand TB transmission.
Methods
We conducted two searches in PubMed for publications in English – one for TB and serial interval; one for TB and reproductive number.
Tuberculosis and serial interval
(‘Tuberculosis’[MeSH] OR ‘Mycobacterium tuberculosis’[MeSH] OR ‘tuberculosis’[TI]) and (‘serial interval’[tiab] or ‘generation interval‘[tiab] or ‘serial distribution’ [tiab] or ‘secondary infections’ [tiab] or ‘secondary cases’ [tiab]).
TB and reproductive number
(‘Tuberculosis’[MeSH] OR ‘Mycobacterium tuberculosis’[MeSH] OR ‘tuberculosis’[TI] OR ‘pulmonary, tuberculosis [MeSH]’) and (‘reproductive number’[tiab] or ‘reproduction number’[tiab] or ‘reproductive rate’[tiab] or ‘reproduction rate’[tiab] or ‘reproduction ratio’[tiab] or ‘reproductive ratio’[tiab] or ‘reproduction value’[tiab] or ‘reproductive value’[tiab] or ‘R 0’[tiab] or ‘secondary infections’[tiab] or ‘secondary cases’[tiab]).
Titles and abstracts of the publications referenced in the articles we found were reviewed for inclusion for either parameter. For the SI, as limited number of publications met our inclusion criteria, we also reviewed the titles and abstracts of publications that cited the serial interval articles that we included in a full-text review.
Two reviewers (two of YM, HEJ, LFW) independently screened all titles and abstracts, resolving discrepancies by consensus. Each publication was then independently reviewed by two reviewers (two of YM, HEJ, LFW) for inclusion. From the included articles, the same pairs of reviewers extracted the following details for all parameter estimates (if available): point estimates, confidence intervals, ranges, sample size and location/setting. We summarised the methods for analysis and aggregated those with similar estimation approaches.
Results
Serial interval
The serial interval query returned 171 articles (Fig. 2), of which 163 were excluded as they did not present any estimates. Leung et al. [Reference Leung22] reported the serial interval as the time from identification of primary case to secondary case as median 1.4 years (range: 0.4–5.2 years). This study used household transmission data from Hong Kong and focused on MDR- and XDR-TB. Vynnycky and Fine [Reference Vynnycky and Fine23] analysed a population of white males in England and Wales in the 20th century using a mathematical compartmental model to estimate the SI as dependent on the age when infection occurred, distinguishing reinfection and reactivation in the model. In this model, the risk of developing disease was calibrated on incidence data. The estimates were presented as a frequency distribution. The most frequent time to develop disease was estimated at: between 20 and 30 years due to reinfection for those infected in the first year of life; between 10 and 14 years due to reinfection for those infected at age 10; <5 years due to recent infection for those infected at age 20 and those infected at age 40. ten Asbroek et al. [Reference ten Asbroek24] analysed genetic data for a Dutch sample from 1993 to 1996 to link infectors and infected people using DNA fingerprinting based on restriction fragment length polymorphism (RFLP) and estimated the serial interval at a geometric mean of 0.57 years (95% confidence interval (CI) 0.44–0.73). In this 4-year study, the probability of observing both the infector and the infected person depended on the time interval between isolates – the shorter this time interval was, the more likely that this couple was observed. Therefore, the observed serial intervals were weighted by the inverse of the difference between the length of the study period and the time between isolates of the infector and the infected person, allowing a rough correction for underrepresentation of longer SIs (Table 1).
Flow diagram of articles included in the search of estimates of the serial interval.
Estimates of the Serial Interval
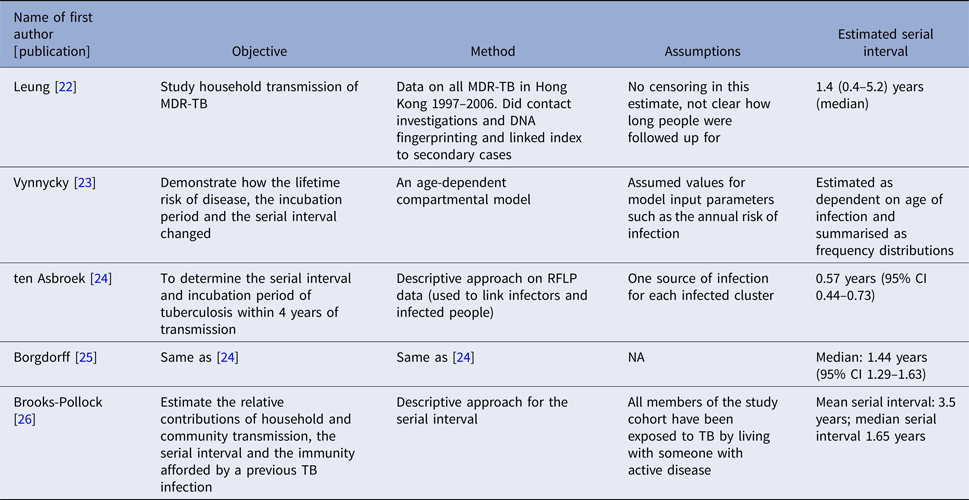
Two articles that cited the articles that met our inclusion criteria in the PubMed search reported estimates of the SI and were included for full-text review. Borgdorff et al. [Reference Borgdorff25] used the same method on genetic data as [Reference ten Asbroek24] to estimate the median SI as 1.44 years (95% CI 1.29–1.63 years) for a Dutch sample from 1993–2007. Brooks-Pollock [Reference Brooks-Pollock26] in 2011 analysed cross-sectional household data for a sample in Lima, Peru from 1996 to 2002 and reported the time between the diagnosis of the infector and the infected person as an estimate for the SI with mean at 3.5 years and the median at 1.65 years.
Reproductive number
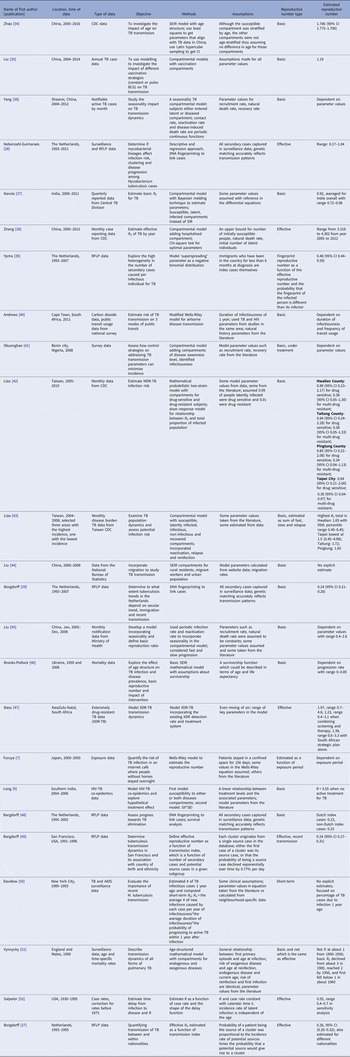
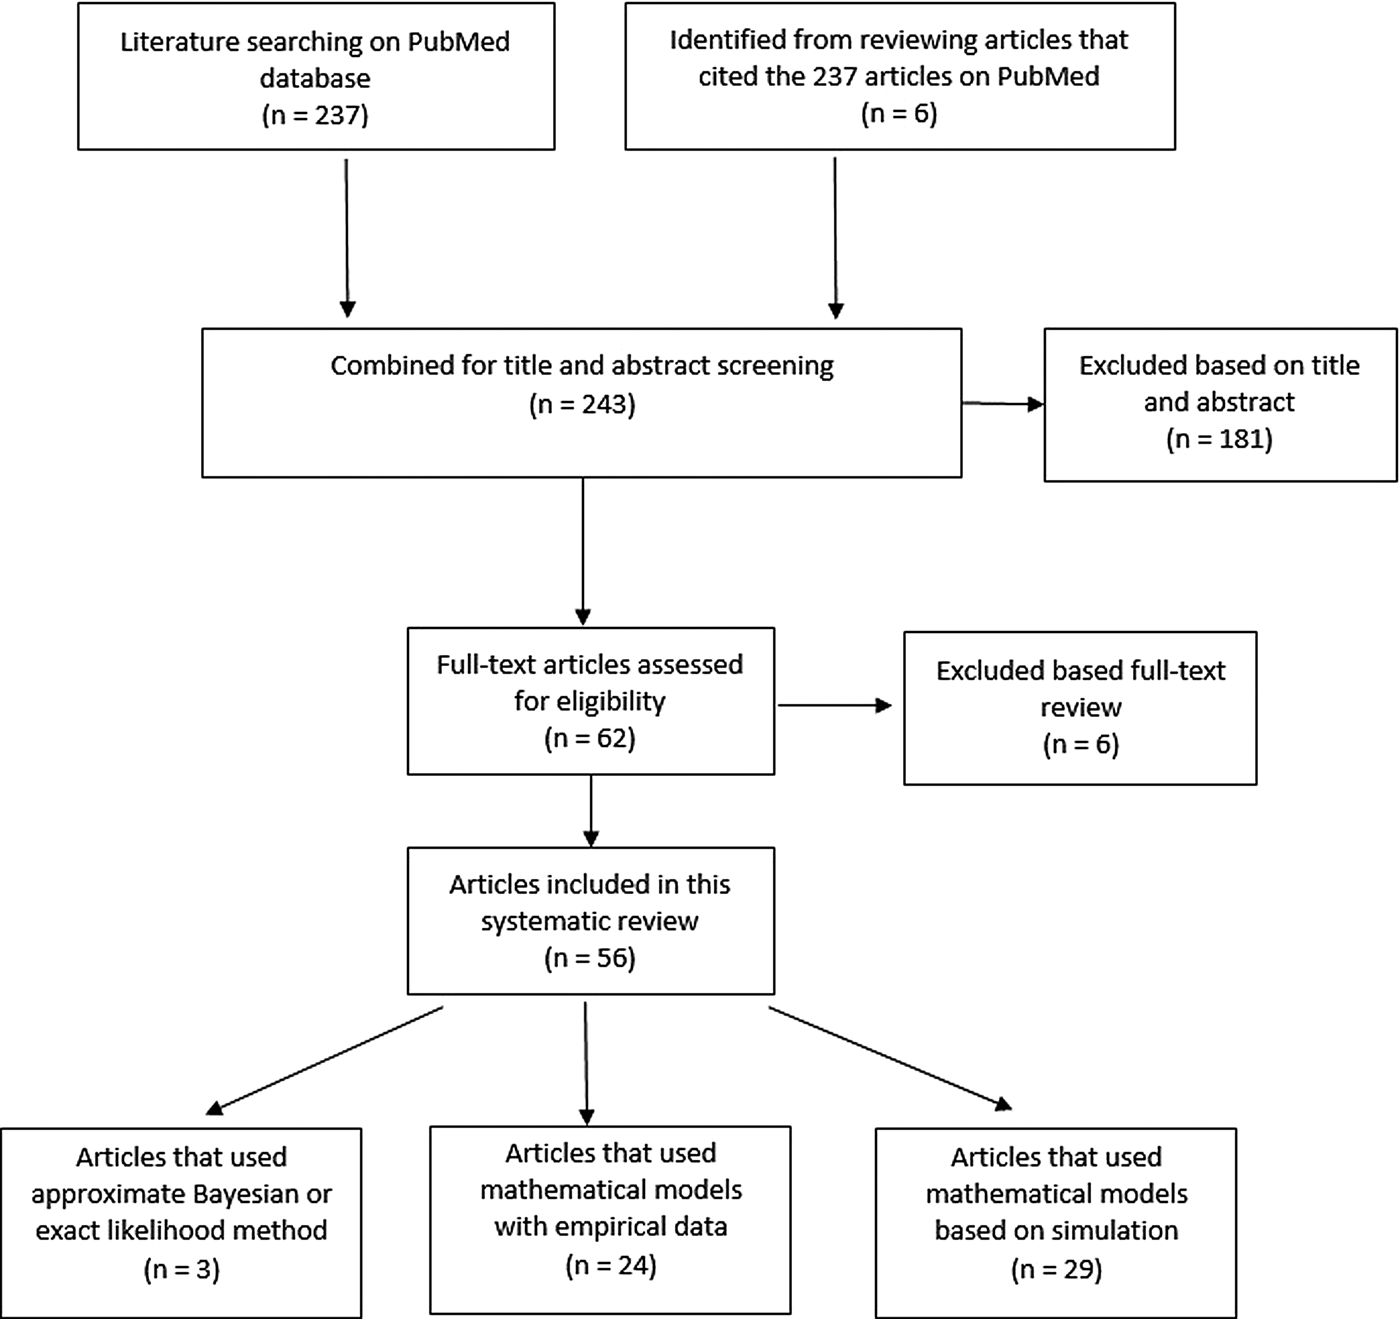
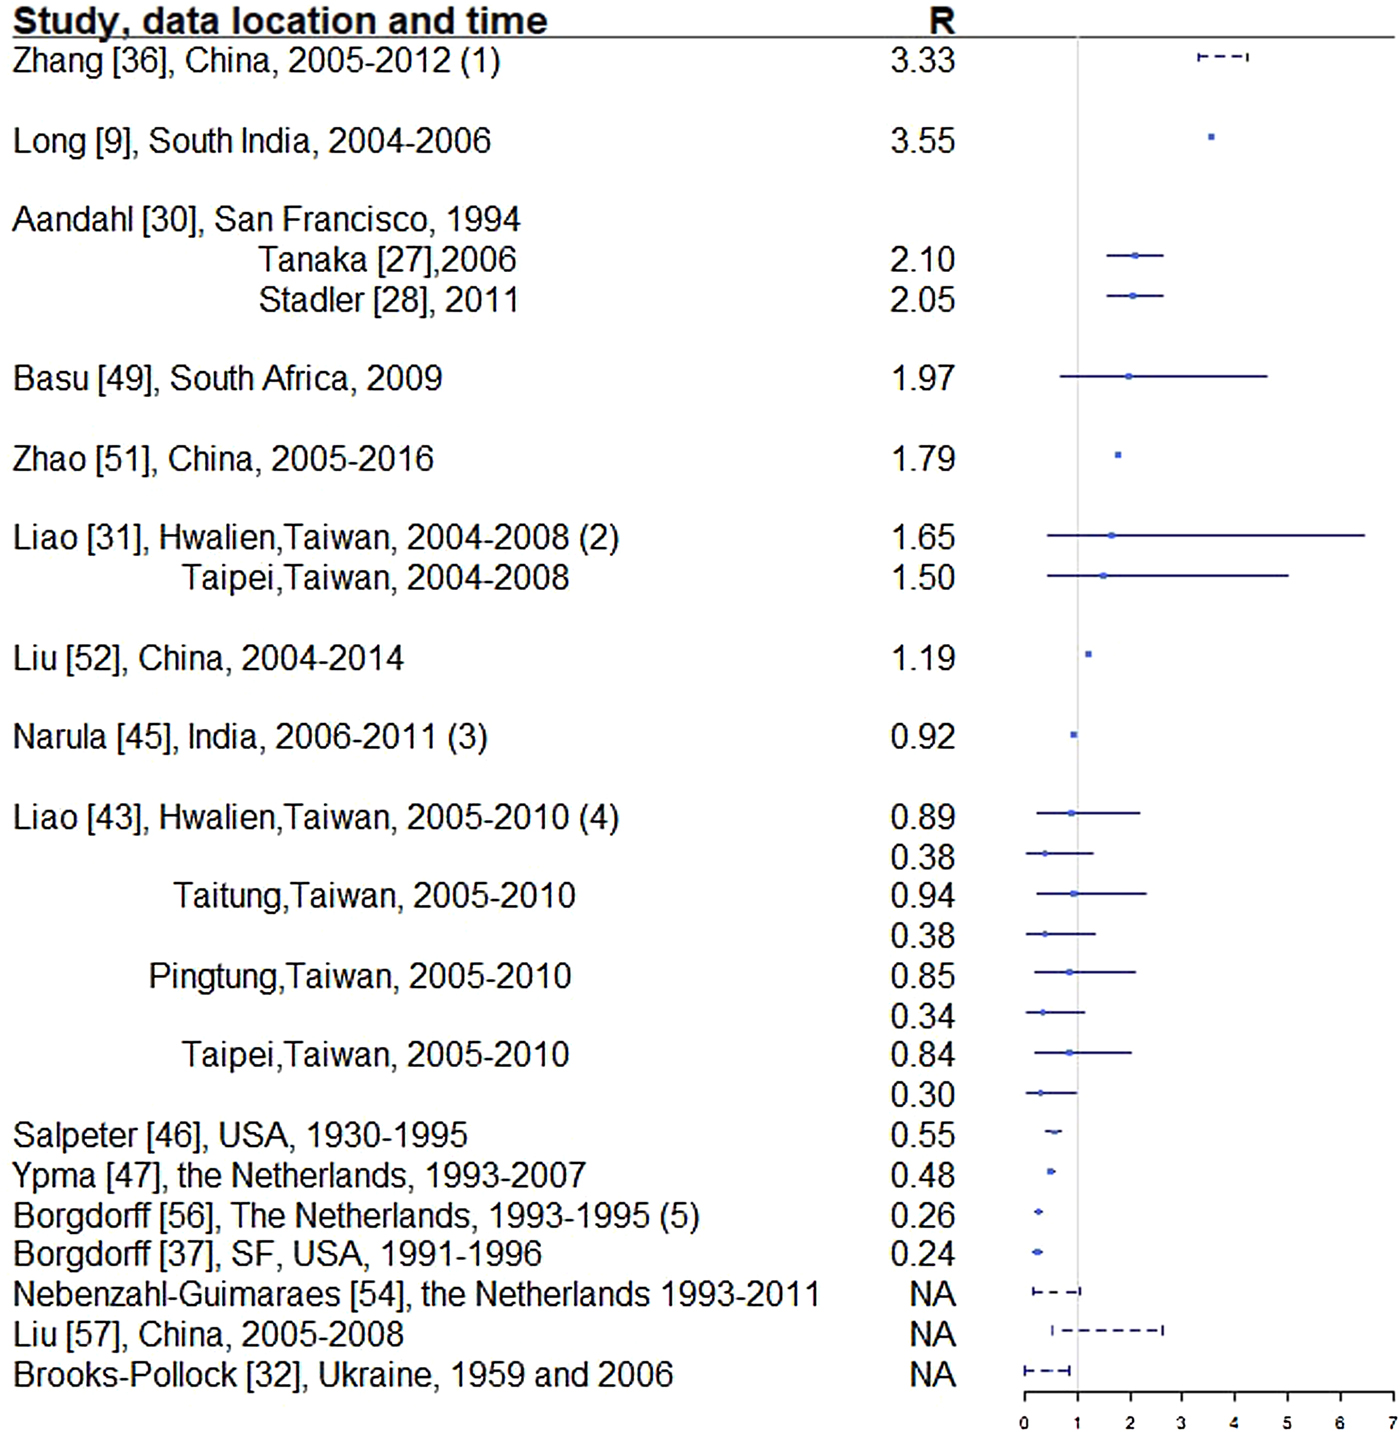
Two hundred and thirty-seven articles were identified for the reproductive number of TB. Additionally, six articles were included based on reviewing titles and abstracts of the articles that were referenced in the 237 articles, making the total number of articles 243. Fifty-six articles met our inclusion criteria and are described below. Three articles used either approximate Bayesian or exact likelihood methods, 24 articles used either a mathematical model fit with empirical data or a descriptive/regression approach on empirical data, and 29 articles used a simulation-based mathematical model (Fig. 3). Explicit estimates were extracted and summarised in Fig. 4. The estimates range from as low as 0.26 for the Netherlands in 1993–2007 to as high as 4.3 in China in 2012.
Flow diagram of articles included in the search of estimates of the reproductive number.
Reproductive number from studies with explicit R estimate from empirical data. Notes: (1) The range is for years 2005-2012, with the reproductive number estimated at 3.33, 3.72, 3.38, 3.97, 4.29, 3.32, 3.92 and 4.30, respectively. (2) For each location, the first R corresponds to drug-sensitive population and the second correspond to drug-resistant population. (3) R estimated for 35 states and union territories of India with estimates ranging from 0.72 to 0.98; 0.92 is the overall estimate for India. (4) For each location, the first R corresponds to drug-sensitive population and the second correspond to drug-resistant population. (5) Bordgorff in [Reference Borgdorff27–Reference Borgdorff29] estimated the reproductive number for the Netherlands from 1993 to 2007 at around 0.26 with lower bound of the 95% CI around 0.20 and upper bound around 0.32. (6) Broken lines indicate range; solid lines indicate 95% confidence interval. (7) Vynnycky and Fine [Reference Vynnycky and Fine23] in 1998 estimated the basic reproductive number to decline from about 3 in 1900 to 2 in 1950 and to below 1 in about 1960 for England and Wales, which is not included in this graph.
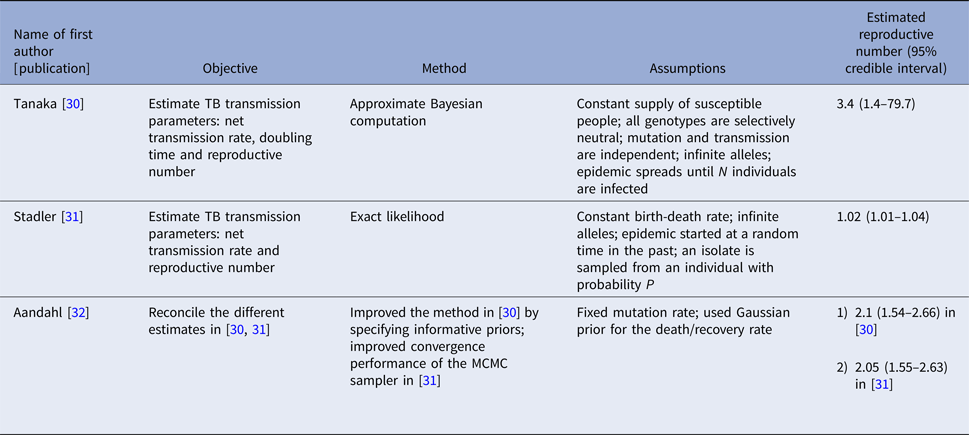
Three articles (Table 2) used the same genetic RFLP data from TB diseased individuals during an outbreak in San Francisco in 1991–1992 [Reference Small33]. They all estimated the effective reproductive number in a Bayesian framework. Tanaka et al. [Reference Tanaka30] used an approximated computation method to obtain an estimate of 3.4 (95% CI 1.4–79.7). Stadler [Reference Stadler31] in 2013 used an exact likelihood method to obtain an estimate of 1.02 (95% CI 1.01–1.04) and claimed that the difference from the estimate in [Reference Tanaka30] was due to the lack of precision in the approximation of the posterior distribution in [Reference Tanaka30]. Aandahl et al. [Reference Aandahl32] in 2014 reconciled the two methods by specifying an informative prior for two parameters in [Reference Tanaka30] and improving the convergence performance of the Markov chain Monte Carlo (MCMC) sampler in [Reference Stadler31]. The reconciled estimates were: 2.1 (95% CI 1.54–2.66) for the approximate method in [Reference Tanaka30] and 2.05 (95% CI 1.55–2.63) for the exact method in [Reference Stadler31]. These papers used the same model but differed in the methods used to obtain the estimates. The assumptions of the model are listed in Table 2.
Estimates of the reproduction number using approximate Bayesian computation and exact likelihood methods (all methods used data from San Francisco on cases reported in 1994)
Twenty-four articles analysed the reproductive number with empirical data (Table 3). Seventeen articles reported explicit estimates, with five estimating the effective reproductive number and 12 estimating the basic reproductive number. The majority of these articles used mathematical compartmental models with different variations in structure and parameterisation to address issues such as seasonality [Reference Liao43], the effect of age [Reference Brooks-Pollock, Cohen and Murray46, Reference Vynnycky and Fine51] and HIV–TB co-epidemics [Reference Long and Brandeau9].
Estimates of the reproductive number from mathematical models with empirical data
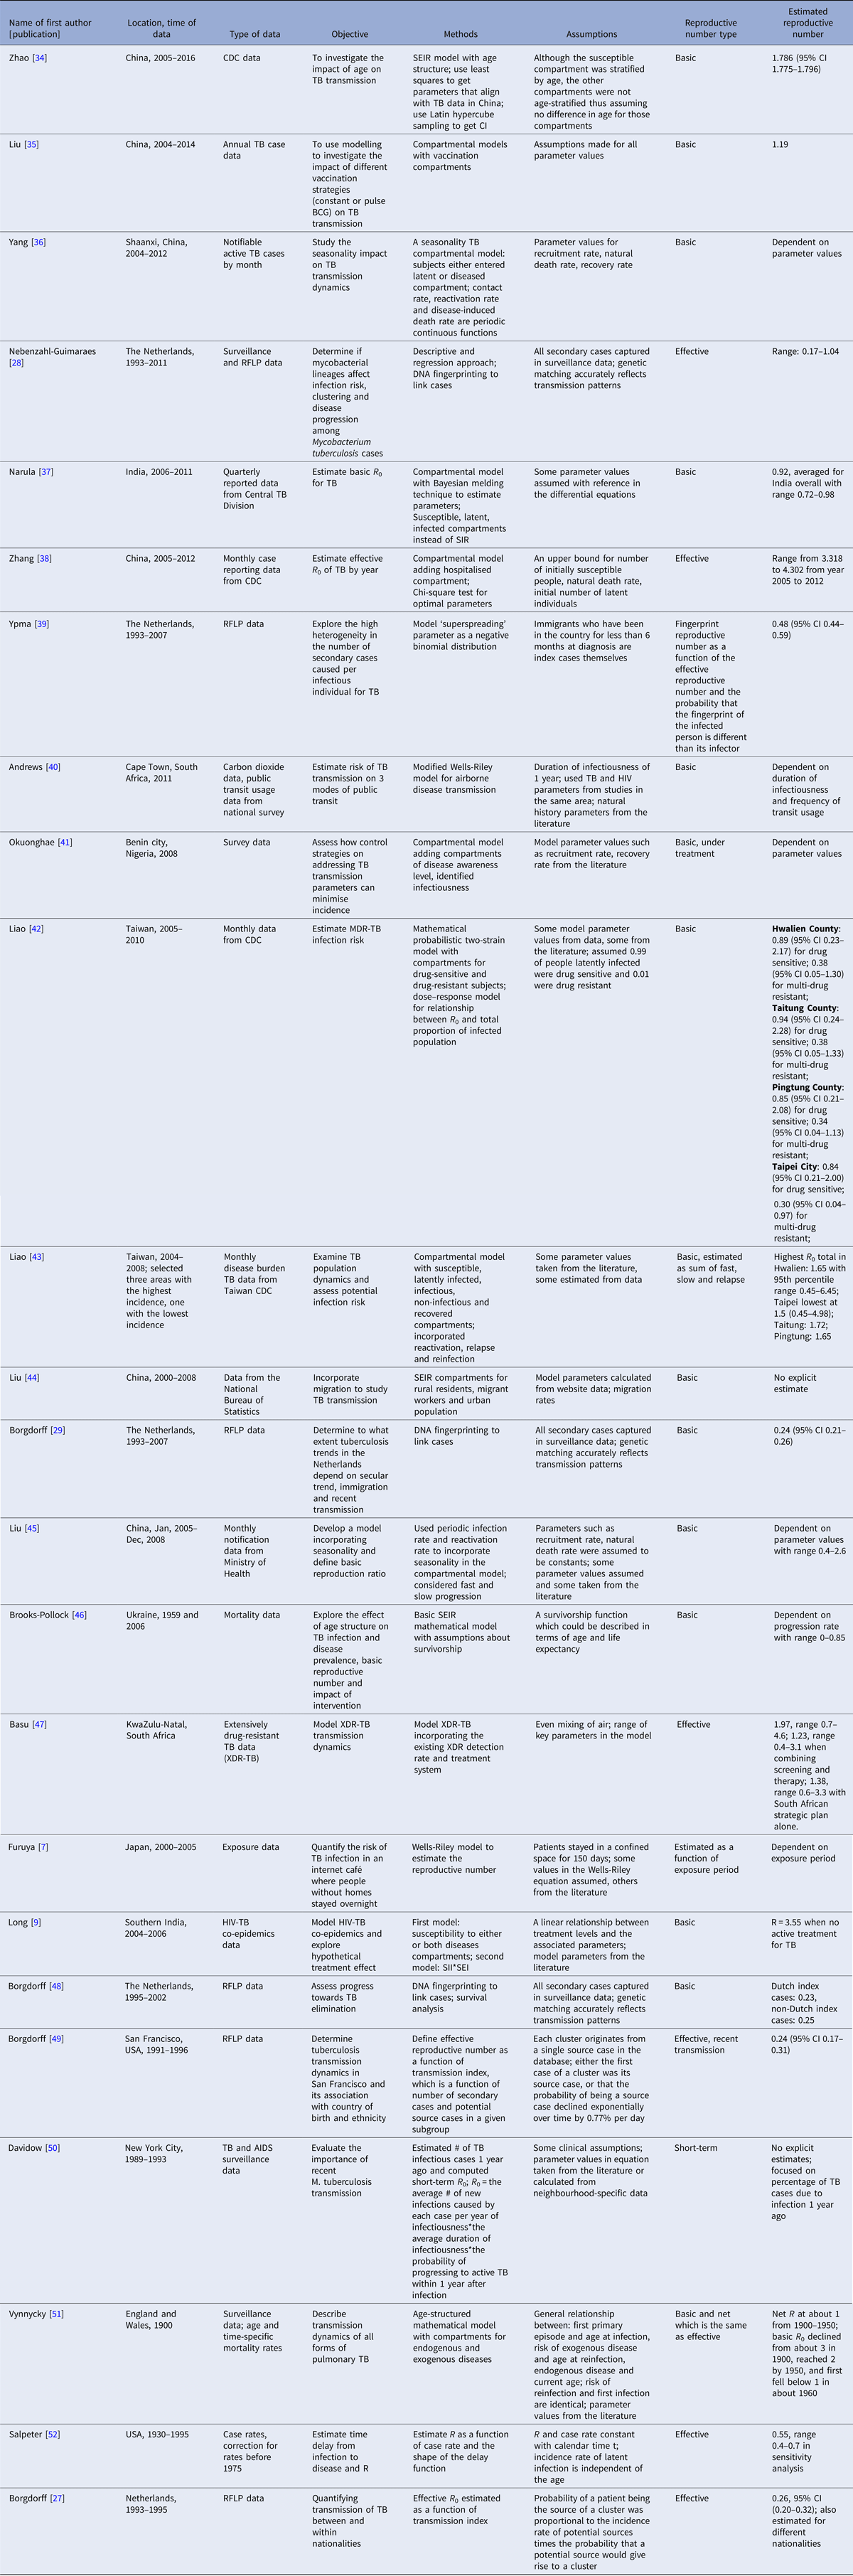
Two articles [Reference Furuya, Nagamine and Watanabe7, Reference Andrews, Morrow and Wood40] used the Wells–Riley model or a modified version of the model. In these models, the reproductive number was expressed as a function of infection risk, which was further expressed as proportionate to environmental factors such as the number of infectious people in a given space, per-person breathing rate and inversely proportionate to germ-free ventilation rate. One article derived the reproductive number as a function of the transmission index – defined as the ratio of the number of secondary cases to the sum of the number of source cases (infectors) and non-clustered cases where clusters are defined as groups of patients that had isolates with identical fingerprints [Reference Borgdorff27]. The largest reproductive number (effective) was estimated in [Reference Zhang, Li and Zhang38] using the Chinese Centre for Disease Control and Prevention (CDC) data from 2005 to 2012, where the annual reproductive number ranged between 3.33 and 4.30 for years 2005–2012 in China. The lowest (effective) reproductive number was estimated at 0.24 (95% CI 0.17–0.31) using RFLP data in San Francisco, USA from 1991 to 1996 [Reference Borgdorff49]. Vynnycky and Fine [Reference Vynnycky and Fine51] in 1998 used an age-structured mathematical model and estimated the effective reproductive number to be around 1 from 1900 to 1950 in England and Wales; the basic reproductive number was estimated to have declined from about 3 in 1900 to 2 by 1950, and first fell below 1 in about 1960. The assumptions of these models are listed in Table 3.
One article defined the reproductive number as the number of secondary infections caused by an infectious case [Reference Furuya, Nagamine and Watanabe7]. As only a fraction of the infected people develops active disease, the estimated reproductive number was larger than those in the other papers. The median of the reproductive number in this article ranged from 14 to 45 as exposure time increased from 1 to 5 months.
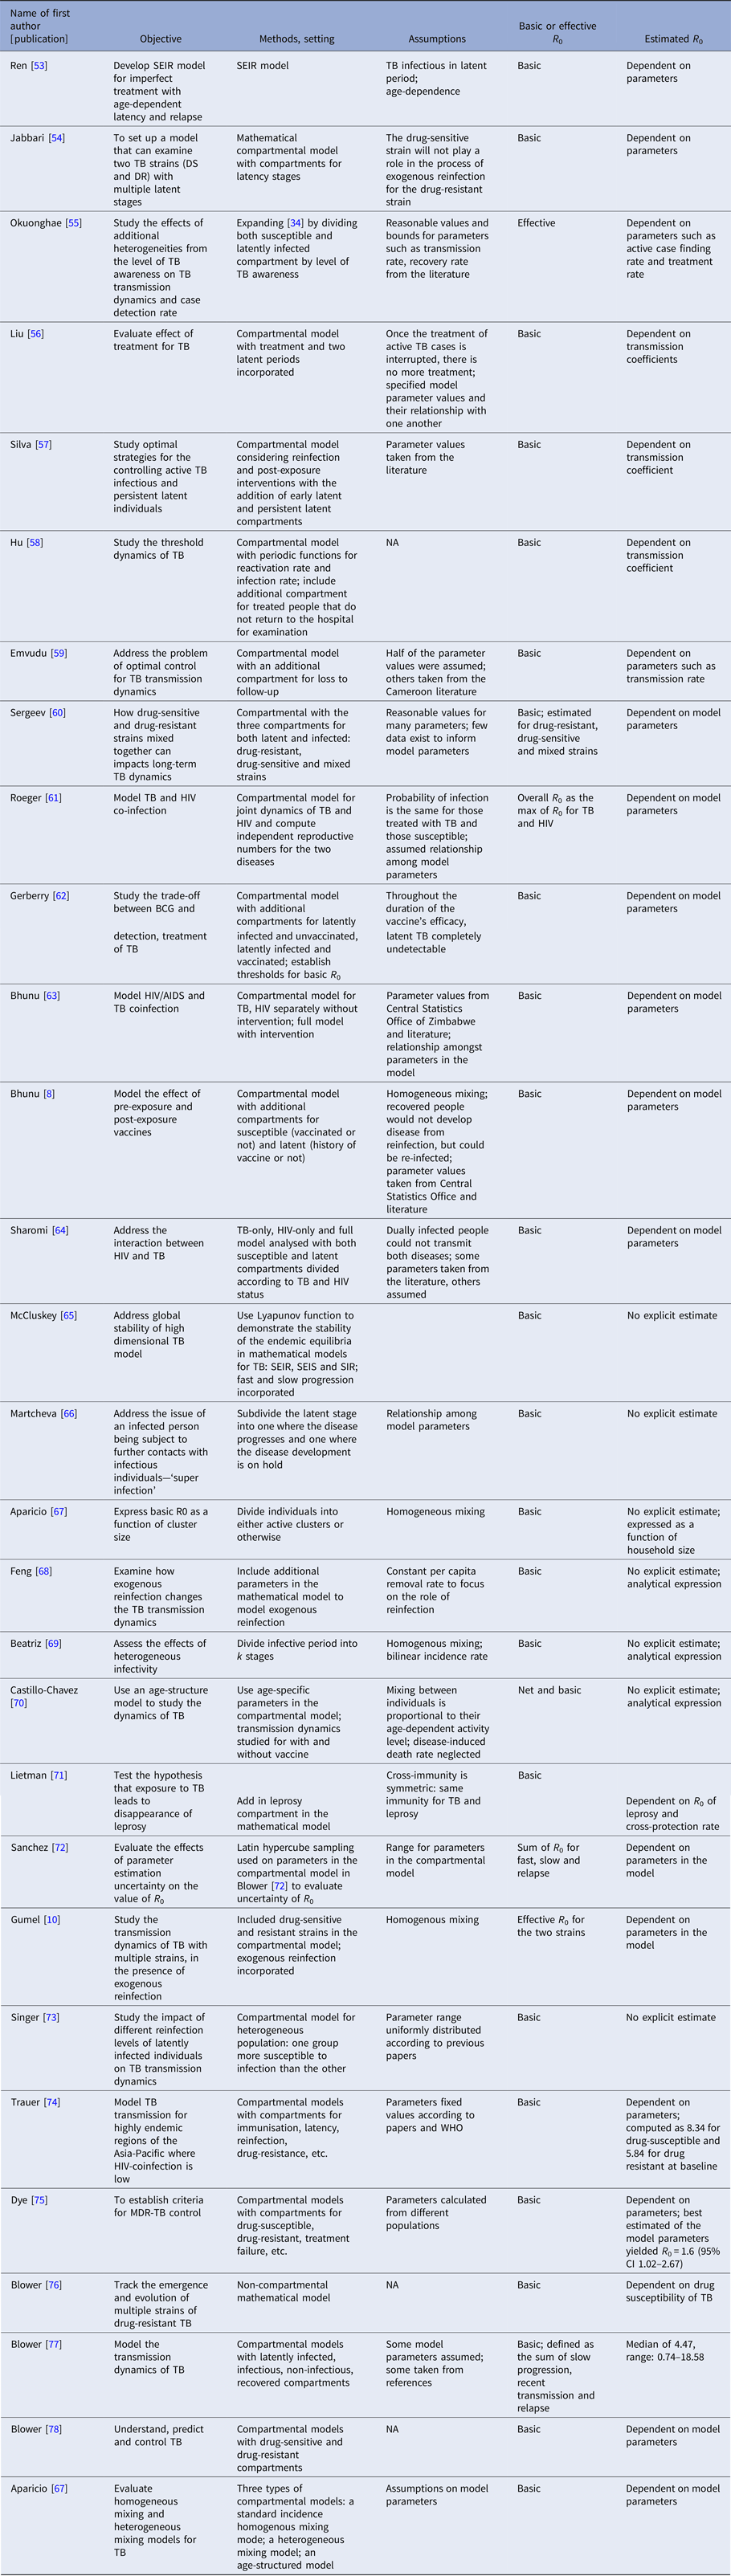
Twenty-nine articles analysed the reproductive number through simulation based on a mathematical modelling framework (Table 4). These articles all used mathematical compartmental models with different variations to address issues such as reinfection [Reference Feng, Castillo-chavez and Capurro68], the interaction between HIV and TB [Reference Sharomi and Podder64], and drug-resistant and drug-sensitive TB [Reference Sergeev, Colijn and Cohen60]. The majority of them focused on studying the effect of these issues on TB transmission dynamics through simulations that were not based on a specific population. In this case, parameters for the model were based on estimates from studies performed in diverse settings or sampled over a range of feasible values. The analytical expression of the basic reproductive number was derived to study the disease-free equilibrium and endemic-persistent state of TB in these papers. Five articles [Reference Gumel and Song10, Reference Sergeev, Colijn and Cohen60, Reference Sharomi and Podder64, Reference Singer and Kirschner73, Reference Blower and Chou76] included drug-resistant TB cases as a compartment and four articles [Reference Hu58, Reference Feng, Castillo-chavez and Capurro68, Reference Sanchez and Blower72, Reference Dye and Williams75] included HIV + TB cases as a compartment.
Estimates of the reproductive number from mathematical models based on simulation
Discussion
We found very few publications that reported estimates for the serial interval of TB. Estimates of the reproductive number were limited to seven countries, with the majority of the publications using mathematical compartmental models that did not base estimates on actual data. This indicates a need for a better understanding of these crucial parameters of TB transmission, which can help inform public health decisions in order to reach the WHO's End TB goals [4] of reducing TB deaths by 95% and incident cases by 90% by 2035.
Serial interval
We found only five articles that discussed the estimation of the SI for TB and presented explicit estimates. ten Asbroek [Reference ten Asbroek24] estimated the serial interval over 4 years as a geometric mean of 0.57 years (95% CI 0.44–0.73). Using the same method over a longer study period (15 years compared with 4 years in [Reference ten Asbroek24]), the estimated median was 1.44 years, which is comparable with the median serial interval of 1.65 years in [Reference Brooks-Pollock26] with a 6-year study period. This indicates that the study period could potentially bias the serial interval estimates, even though the method in [Reference ten Asbroek24] corrected for the underrepresentation of longer serial intervals. In contrast with other infectious diseases that progress much faster and have SIs measured in days, the SI of TB can be weeks, years and even decades [Reference Vynnycky and Fine23]. This unique feature of TB makes it difficult to obtain an unbiased estimate of the SI as lengthy follow-up is required to observe the long period between presence of symptoms of the infector and the infected person. Additionally, uncertainty regarding the presence and impact of multiple infection events further complicates the observation of this interval. Currently, the most common way of monitoring TB is by looking at annual incidence rates in studies that are often no longer than 5 years [Reference Morrison, Pai and Hopewell79, Reference Fox80]. This creates two issues: right censoring as symptoms of the infected people can develop long after the end of studies, and interval censoring as the symptom onset time can fall during long intervals between two observed time points. Another issue is patients’ and doctors’ delay. Patients may not seek medical assistance immediately after symptoms develop and diagnosis may require lab-processing time which causes delay in establishing the diagnosis [Reference ten Asbroek24], creating a left censoring issue. Survival analysis techniques can be considered to address these issues but may need substantial modification. Further ambiguity exists due to the inconsistent availability of genetic typing of strains to link cases, and the further uncertainty about how to best link strains when genetic information is available, as such information may not account for mutation rate, or infection with multiple bacterial strains.
Reproductive number
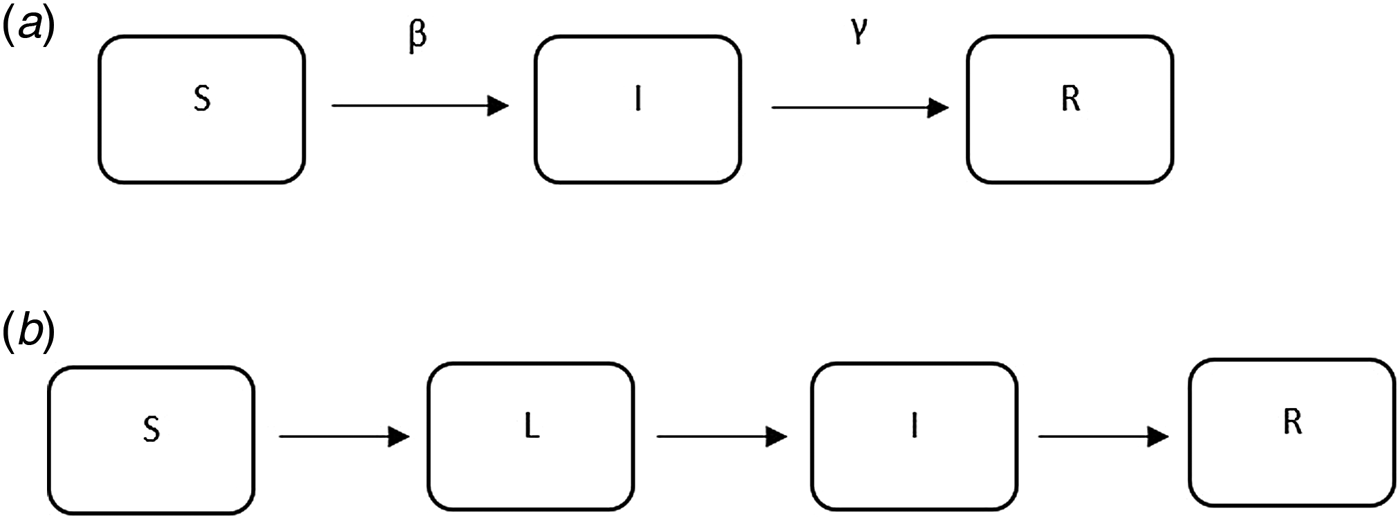
The majority of the articles used mathematical compartmental models (a brief introduction can be found in the appendix) to describe the transmission dynamics of TB. These models have been widely used to understand the dynamics of infectious diseases including SARS, influenza and TB, and they either use empirical data to estimate the parameters in the model or are based on simulation.
The compartmental models using empirical data are distinguished from simulation-based models in two key ways. First, empirical models use data to estimate some of the model parameters, while others are taken directly from the literature or assumed. Simulation-based models do not use empirical data to parameterise the models. For example, in [Reference Liao and Lin42] where empirical data was used, the mortality rate due to drug susceptible TB was estimated from Taiwanese Centre of Disease Control data and the effective contact rate for TB was estimated based on the literature; in [Reference Okuonghae and Omosigho41] where simulation was used, the recruitment rate was taken from the literature and awareness rate of TB was estimated from data.
A second distinction between models based on empirical data and simulation-based models is that the former often report explicit estimates of the reproductive number for a specific region, while the latter usually focus on studying the impact of a certain feature on TB transmission dynamics. For example, in [Reference Narula, Azad and Lio37] where empirical data were used, the reproductive number was reported for India overall and by regions; in [Reference Sergeev, Colijn and Cohen60] where a simulation-based approach was used, the impact of drug-sensitive and drug-susceptible strains mixed together on TB transmission dynamics was studied.
In developed countries, the reproductive number was sometimes estimated to be well below 1: for example, 0.55 in the USA from 1930 to 1995 [Reference Salpeter and Salpeter52] and 0.26 in the Netherlands from 1993 to 1995 [Reference Borgdorff27]. In developing countries, the reproductive number was as high as 4.3 in China in 2012 [Reference Zhang, Li and Zhang38] and 3.55 in Southern India from 2004 to 2006. In the Netherlands, the reproductive number has been consistently estimated at well below one, ranging from 0.24 [Reference Borgdorff49] to 0.48 [Reference Ypma39].
The same dataset in San Francisco, USA in 1991–1992 (published in 1994) was used to estimate the effective reproductive number in two separate studies [Reference Tanaka30, Reference Stadler31] that yielded disparate results. The estimates from these two papers were reconciled in [Reference Aandahl32] to an estimated effective reproductive number of approximately 2.1 by specifying an informative prior for two parameters in [Reference Tanaka30] and improving the convergence performance of the MCMC sampler in [Reference Stadler31]. One can contrast this estimate with other estimates for the USA to see the range of values obtained. A study of the entire USA in [Reference Salpeter and Salpeter52] estimated the reproductive number to be 0.55 using case rates of active TB in USA from 1955 to 1994. As shown in [Reference Higashi81], TB incidence in San Francisco peaked between 1991 and 1993, due to the TB/HIV co-epidemic, which is consistent with the higher estimated reproductive number (around 2.1) in [Reference Tanaka30–Reference Aandahl32]. When using TB case rates in the entire USA from 1955 to 1994 as in [Reference Salpeter and Salpeter52], the potential geographical and temporal heterogeneity in the estimates is not well represented, resulting in an estimated reproductive number of 0.55. We would expect a lower reproductive number, and in particular, a reproductive number below one, when using data from 1955 to 1994 because by 1955, effective antibiotics were in use and BCG had also been developed, both leading to a reduction in TB incidence across the USA. In addition, Borgdorff [Reference Borgdorff49] reported an effective reproductive number of 0.24 using RFLP data in San Francisco from 1991 to 1996. In this paper, the ratio of secondary cases and source cases was used to estimate the reproductive number, which may be an oversimplified estimator of the reproductive number. Issues such as linking the secondary cases and the sources cases have not been addressed. These divergent results indicate the need for the use of whole genome sequencing (WGS), which can be used to effectively link source and secondary cases.
Similar to the more statistical analysis of the San Francisco and the entire USA data, we observe that mathematical models lead to inconsistent results, at least partially attributable to the varying assumptions they make in their structure and parameterisation. For example, even though both [Reference Zhang, Li and Zhang38] and [Reference Liao and Lin42] used mathematical compartmental models with different variations for similar regions (China and Taiwan), they have quite different estimates: between 3.3 and 4.3 in China from 2005 to 2012 as compared with 0.9 for drug-sensitive TB, around 0.38 for multidrug-resistant TB (defined as a TB strain resistant to at least isoniazid and rifampicin) in Taiwan from 2005 to 2010. Both articles used incidence data from Chinese and Taiwanese CDC but formulated the compartments in the models differently. In [Reference Zhang, Li and Zhang38], compartments ‘exposed’, ‘infectious and hospitalised’ and ‘infectious but not hospitalised’ were included; in [Reference Liao and Lin42], compartments ‘latent’, ‘infected’ were used for two sub-populations: drug-sensitive and multidrug-resistant. The model parameters were also differently specified: in [Reference Zhang, Li and Zhang38], some parameters were assumed while others were estimated using minimum sum of square; in [Reference Liao and Lin42], some parameters were given a probabilistic distribution and estimated with a root-mean-squared error method while others were assumed. The difference between the estimated reproductive numbers produced from these two modelling exercises is striking, as the two regions and populations are quite comparable in terms of demographics, economic status and access to healthcare. One could similarly contrast the modelling approaches and estimates obtained in [Reference Zhao, Li and Yuan34] and [Reference Liao43], two other studies from China and Taiwan from similar time periods that produced different estimates. The differing model structures, as well as the parameter estimates, including the recruitment rate, incidence rate, and mortality rate, likely drive these observed differences. It is difficult to say which model might be a more accurate reflection of reality.
The example above illustrates the challenges of interpreting and using mathematical models for estimation of the reproductive number. However, most estimates to date make use of this approach. One shortcoming of these models is that they require assumptions about parameter values that may be difficult to estimate, such as the transmission rate, the treatment rate and the recovery rate, which are often unobservable and not reliably estimated. As a result, most of the articles assume values for the parameters in the model based on evidence in the published literature, where it exists, sometimes without measures of uncertainty (e.g. standard errors). Model structure also varies substantially from study to study, with no generally agreed upon approach to model TB and estimate parameters. For example, in [Reference Liu35], compartments of different vaccine strategies were included in the model and in [Reference Zhang, Li and Zhang38], a compartment of hospitalisation was included in the model. These models also often require assumptions about the parameters used to run the models, which are likely to differ by country and time period. Sometimes sufficient data are unavailable to parameterise a model and generalisations need to be made that may not always be appropriate. The majority of the existing publications use mathematical compartmental models, which are not often ideal for statistical inference and estimation due to strong assumptions for the model structure and parameters used to run the models. While these models have the flexibility of using different compartments to evaluate the impact of policies, they are not ideal for real-time analysis where the appropriate model structure and parameter values required fitting the model may not be clear. The complexity of the natural history of TB and important factors such as HIV and drug resistance complicate these models and require additional parameters for which the data are sometimes not available. We believe that it is important to develop, as a complementary approach to compartmental models, likelihood-based data-driven analytic tools. Ideally, these estimators can be used with datasets using minimal assumptions. In addition, as WGS data become more ubiquitous [Reference Wyllie82], it will be important to develop methods that use these data to estimate the reproductive number (Fig. 5).
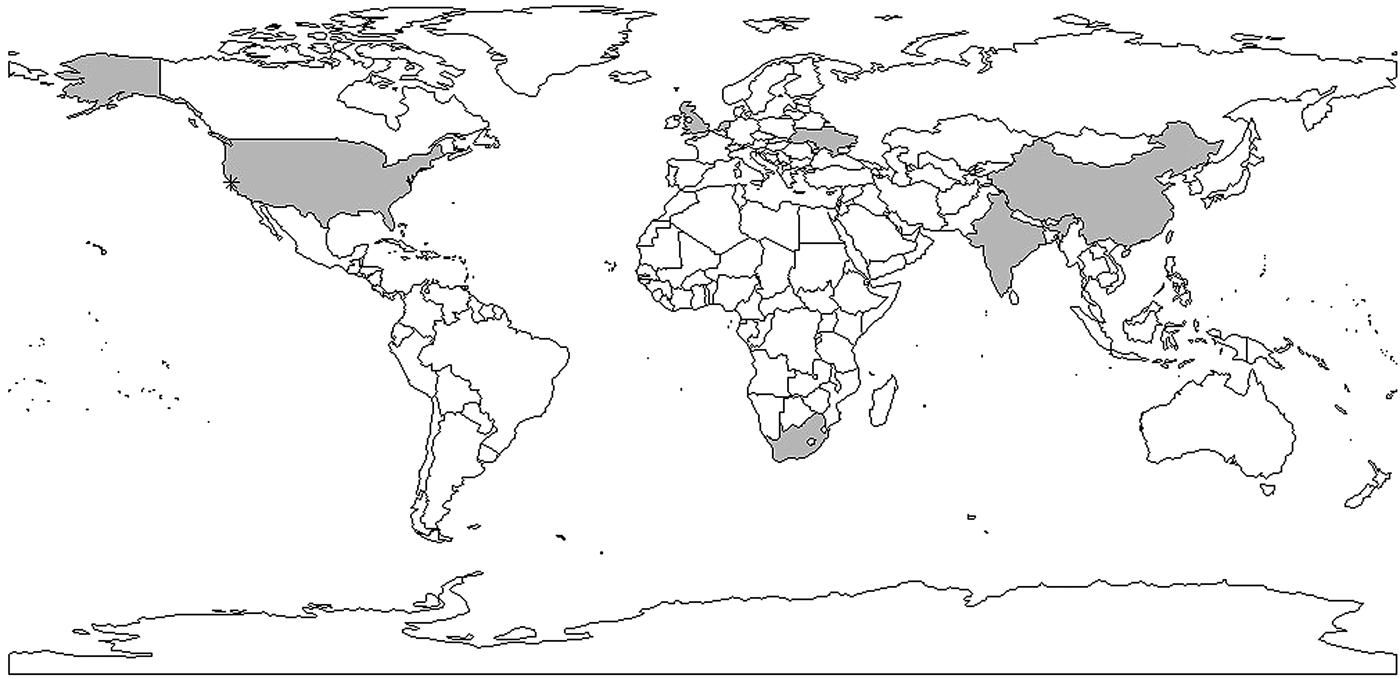
Shaded areas and stars indicate countries and cities with reproductive number estimates. Multiple estimates: China, Taiwan, USA, India; one estimate: Ukraine, the Netherlands, South Africa, the UK. *indicates San Francisco corresponding to data used in [Reference Tanaka30–Reference Aandahl32].
This review found that the reproductive number estimates for TB are very divergent – in reality, we would expect different results in different parts of the world, reflecting diversity in TB epidemics geographically. Therefore, it is important to have estimates from a wide range of settings. An ultimate goal of methods to estimate the reproductive number should be to use routinely collected data (including potentially WGS data) to be able to monitor the reproductive number in ‘real-time’ and evaluate interventions through this process.
Our review is subject to a number of limitations. It is possible that some useful papers could have been excluded due to our selection of search terms and our inclusion of reports in only English. These limitations are difficult to avoid in systematic reviews, in which the potential for increased yield from a wider search must be weighed against the increased feasibility of a tighter search. Additionally, our query was limited to searching in abstracts and titles, making it possible that we excluded articles where the keywords only appear in the text [Reference Borgdorff25].
In conclusion, a limited number of studies have yielded explicit estimates for the serial interval and reproductive number of TB. When estimating the serial interval, it is difficult to observe the symptom onset of the infector and infected person with precision. Estimates of the reproductive number were limited geographically (Fig. 6) with estimates only available for seven countries. Settings with high TB burdens, especially high drug-resistant TB burdens such as the former Soviet Union [Reference Olson, English and Claiborne83] are not included in these papers. In addition, there was only one estimate from a high TB and high HIV burden country [Reference Basu47]. The lack of estimates could be because incidence and mortality rates are currently used to monitor TB control. These rates are not suitable for monitoring transmission; reductions in mortality could be attributed to improvements in treatment outcomes rather than any change in transmission and, due to the long incubation period of TB, changes in transmission could take years to impact incidence rates. In contrast, the reproductive number can provide a direct estimate of TB transmission itself. Most studies used mathematical models with various assumed model structures and parameters, making it difficult to compare the estimates and draw useful conclusions about the TB transmission dynamics by evaluating the reproductive number.
Examples of mathematical compartmental models.
The WHO End TB goals [4] include reducing TB deaths by 95% and incident cases by 90% by 2035. To achieve these goals, it is necessary to obtain improved estimates of the reproductive number and the SI as they can be used for monitoring and evaluating the effect of interventions on TB transmission. For example, the serial interval of TB can be used to determine how long one must monitor contacts of an infectious TB case to see if they will develop symptoms [Reference Vink, Bootsma and Wallinga84]. The effective reproductive number can be used to monitor the efficacy of interventions in reducing transmission. As interventions decrease transmission, estimates of the reproductive number should correspondingly decrease [Reference Okuonghae and Omosigho41]; in particular, if the reproductive number can be maintained below one, the disease can potentially be eliminated.
The limited number of articles that we found and the lack of geographic representation, demonstrate a substantial gap in our understanding of these crucial parameters of TB transmission in diverse settings.
Supplementary material
The supplementary material for this article can be found at https://doi.org/10.1017/S0950268818001760
Acknowledgements
This work was supported by the National Institute of Allergy and Infectious Diseases of the National Institutes of Health under Award Number U19AI111276; and by the Providence/Boston Center for AIDS Research (P30AI042853). HEJ was supported by the U.S. National Institutes of Health (US NIH K01AI102944 award). LFW was supported by U.S. National Institutes of Health (R01GM122876). The content is solely the responsibility of the authors and does not necessarily represent the views of the U.S. National Institute of Allergy and Infectious Diseases or the U.S. National Institutes of Health.
Conflict of interest
None.
Ethical standards
The authors assert that all procedures contributing to this work comply with the ethical standards of the relevant national and institutional committees on human experimentation and with the Helsinki Declaration of 1975, as revised in 2008.