


1. Introduction
Each year, 295,000 women die during and just after pregnancy, and 2.4 million babies die in the first month of their lives every year.Footnote 1 These deaths are terrible tragedies for the individuals, families, and communities involved. They also represent a significant loss in global welfare. In 2019, 2,160,000 neonatal deaths and 275,000 maternal deaths occurred in low-income and lower-middle-income countries alone. This translates to a welfare loss equivalent to $426 billion and $36 billion or 5 and 0.5 % of GDPs for neonatal and maternal deaths, respectively.Footnote 2 The total loss was therefore $462 billion or 5.5 % of the GDP in low-income and lower-middle-income countries.
The aim of this article is to conduct a benefit-cost analysis of interventions to address maternal and neonatal mortality. Drawing upon a previous analysis commissioned by the Copenhagen Consensus Center for Merck for Mothers (Friberg & Weissmann, Reference Friberg and Weissmann2020), we identify basic emergency obstetric and newborn care (BEmONC) combined with increased family planning services as the package of interventions with the highest benefit-cost ratio (BCR). If scaled up from current coverage levels (68 %) to 90 % across 55 low- and-lower-middle-income countries, the intervention would avert 161,000 maternal deaths and 1.2 million newborn deaths annually, a welfare gain of $278 billion per year. It would also generate a demographic dividend benefit equivalent to $25 billion per year. At a cost of $2.3 billion annually, the BCR is 87.
The article also provides an historical perspective on maternal and neonatal mortality progress and funding, with a particular focus on the millennium development goals (MDGs) period. This analysis highlights the substantial improvements in both maternal and neonatal mortality since 2000, partially driven by a large concurrent increase in funding for the sector. Further improvement will require a modest amount of additional funding (from approximately $17 billion now to $20 billion) for an intervention package that has typically been under-considered in the MDG era, but could yield substantial benefits for the remainder of the sustainable development goals (SDGs).
2. An historical perspective on maternal mortality
Historically, pregnancy, specifically childbirth, has been risky for women (see Figure 1). Through most of the 1800s, the average pregnancy had a 0.5–1 % chance of maternal mortality. Surprisingly, poverty and malnutrition played little part in determining the rate of maternal mortality: maternal mortality rates tended to be higher in the upper as compared to the lower social classes (Loudon, Reference Loudon2000). In fact, the data indicate that higher maternal mortality were mostly due to unnecessary interference from physicians, especially in hospitals.
Maternal mortality rate 1800–2017, with 2015 millennium development goal target of 0.096 % and 2030 sustainable development goal target of 0.07 %. Data from Gapminder (2010), Roser and Ritchie (Reference Robinson, Hammitt and O’Keeffe2013), and WHO (2015, 2019). On the current trajectory, 2030 global maternal mortality will be 0.16 % (McArthur et al., Reference McArthur, Rasmussen and Yamey2018).
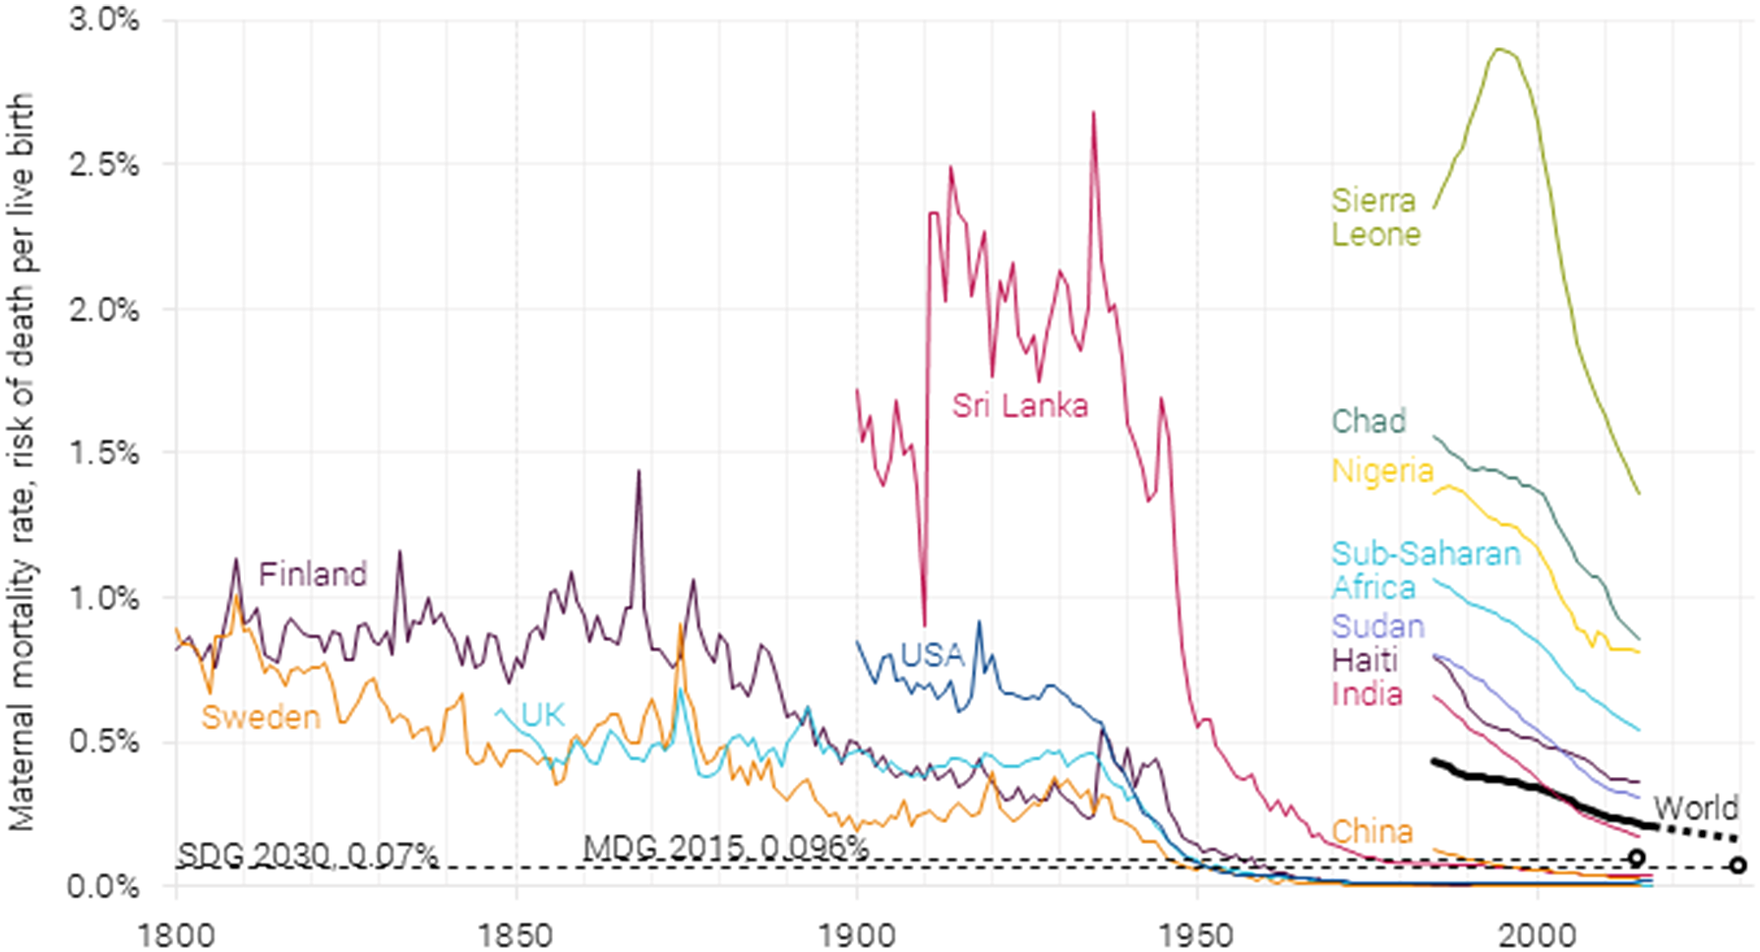
Sri Lanka stands out as one of the only developing countries with a long statistical record of maternal deaths, starting in the mid-1800s (Karunatilake, Reference Karunatilake1986). It shows that pregnancy in Sri Lanka in the early part of the 1900s was even more dangerous than in the UK, Finland, or Sweden a century earlier, killing 1 to 2 % of women during a pregnancy.
All countries with data (including Belgium, the Netherlands, and Ireland, which are not shown here) have seen a dramatic and consistent decline in maternal mortality starting in the 1930s. This was mostly due to the introduction of sulfonamides, the first broadly effective antibacterial. These could effectively treat puerperal fever, which in England and Wales in the early 1930s still caused almost half of all maternal deaths, but just 10 years later, caused less than 1-in-10 deaths (Loudon, Reference Loudon2000, see Figure 3). To further drive down maternal mortality, other factors were introduced gradually, such as ergometrine (causing contractions in the uterus to treat heavy vaginal bleeding), blood transfusions, penicillin, better training, better anesthesia, improved organization of obstetric services, and less interference in normal labors. For most developed nations, maternal mortality is now below one death for every 10,000 pregnancies or lower than 0.01 % per pregnancy.
Family planning also played a role. With a decline in fertility and fewer children born to each mother, the overall risk of women dying from pregnancy and childbirth was reduced. With a higher mortality risk in younger and older women, as is the case in first pregnancy and those of higher parity, most countries reported a reduction in mortality rates by promoting family planning. Family planning also impacted mortality by preventing unwanted pregnancies and therefore the need for abortion services that could be fatal. Given the stigma around abortion, most were performed illegally and in unsafe conditions, leading to unnecessary deaths (Loudon, Reference Loudon1992).
Unfortunately, the same degree of progress has not been shared in most countries in the developing world. While reliable data for most countries before 1985 are lacking, the world average was at 0.44 % in 1985. Low-income countries, on the other hand, were at 1.01 % in 1990 – or one maternal death for every 100 pregnancies. Increasingly, maternal deaths have been concentrated in sub-Saharan Africa. While sub-Saharan Africa accounted for a third of the almost 600,000 maternal deaths in 1985, it accounted for two-thirds of the much lower 300,000 in 2015. Essentially, sub-Saharan Africa has seen almost no decline in absolute numbers of maternal deaths, although with about twice as many births, the maternal mortality rate has halved.
In total, it is estimated that the lifetime risk of maternal death – the probability that a 15-year-old girl will eventually die from a maternal cause – is 1-to-38 for sub-Saharan Africa (WHO, 2019, p. 89). This means that almost three of every 100 women will die from pregnancy-related complications in sub-Saharan Africa as compared to less than two in 10,000 in wealthier regions of the world.
3. An historical perspective on neonatal mortality
Neonatal mortality, defined as death within the first 28 days after birth, used to kill one-in-six of all newborns in the 1800s (Figure 2). About a quarter of all children in the 1800s would die within their first year, and more than 40 % would die before their fifth birthday (Roser et al., Reference Roser, Ritchie and Dadonaite2019; Gapminder, 2020).
Global neonatal mortality rate 1800–2019, with a prediction for 2030, along with MDG (1.22 %) and SDG (0.89 %) targets. The rate from 1800 to 1990 is estimated as a fixed fraction of under-5 mortality. Data are from Gapminder (2020) and World Bank (2021). The 2030 estimate is from Paulson et al. (Reference Paulson, Kamath, Alam, Bienhoff, Abady, Abbas and Abbasi-Kangevari2021).
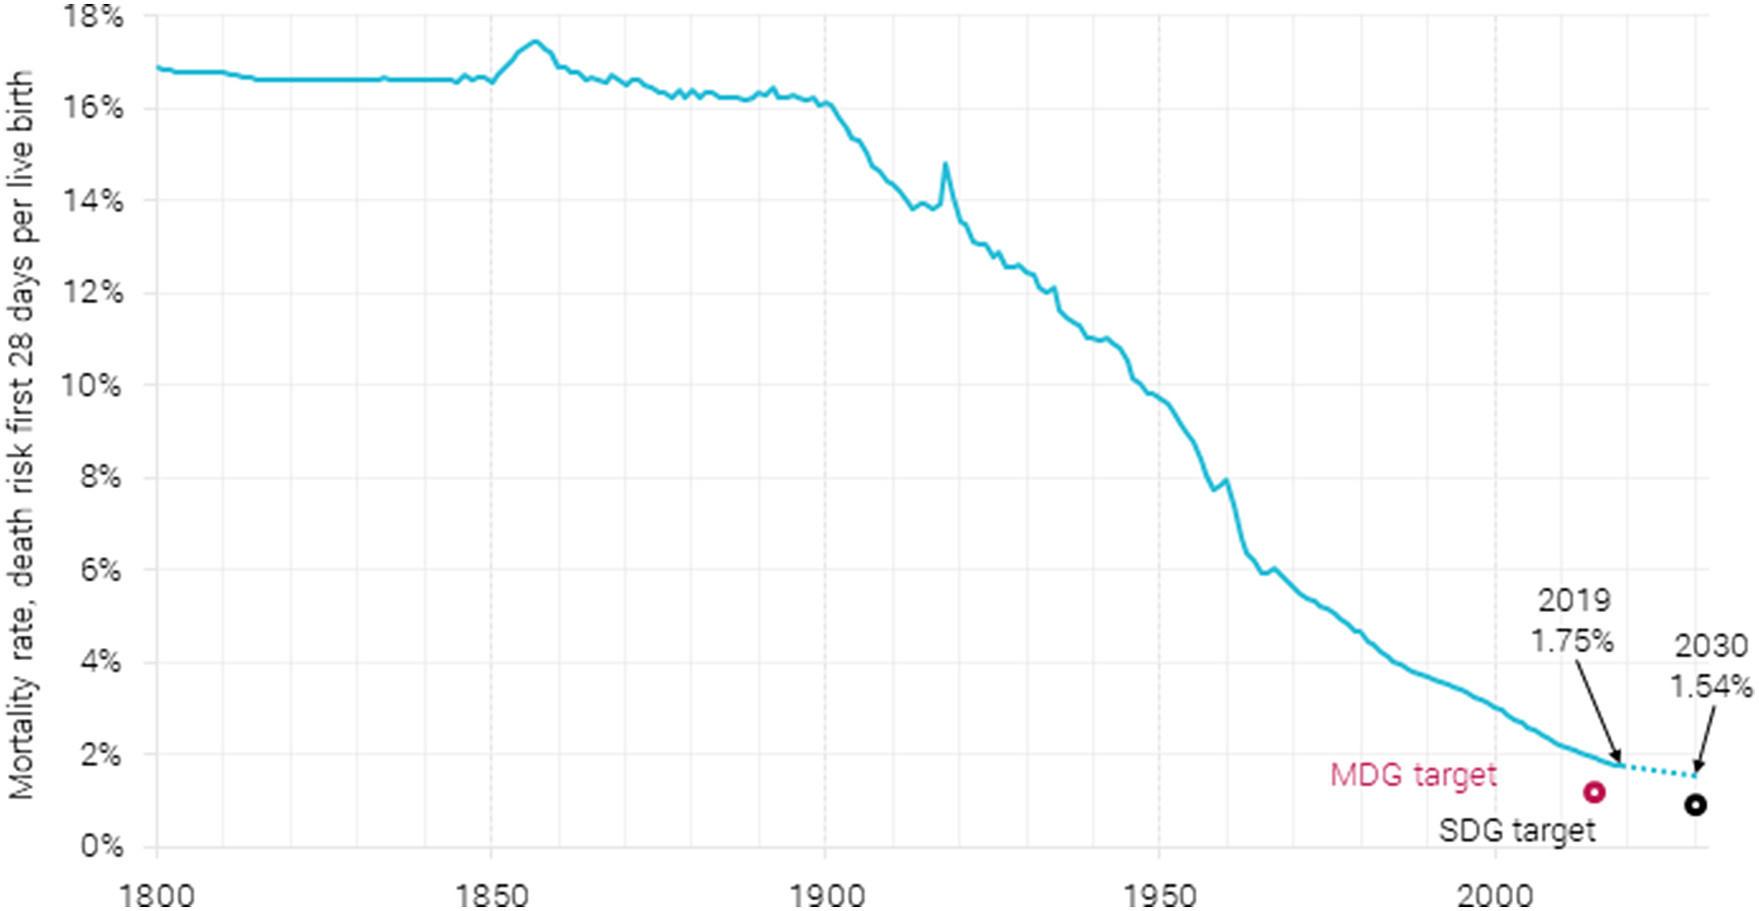
Neonatal mortality has drastically declined since 1900, dropping in 2019 to less than 1.75 % of live births ending in death after less than a month. This is due in a large part to better treatment opportunities like antibiotics and improved supervision by medical personnel. It is also because of cultural factors like the care shown toward infants, extended breastfeeding, and the increasing awareness over the 20th century that infant lives can indeed be saved: infants need not die (Pozzi & Fariñas, Reference Pozzi and Fariñas2015). In the wealthier areas of the world, neonatal mortality has more than halved since 1990 to 0.4 % in 2019, and for sub-Saharan Africa, it has been reduced by more than one-third from 4.5 % in 1990 to 2.75 % in 2019 (https://data.worldbank.org/indicator/SH.DYN.NMRT?locations=ZG-OE).
Of the 2.4 million annual deaths within the first 28 days, 1 million happen within the first 24 h and an additional 800,000 deaths over the next 6 days (https://www.who.int/news-room/fact-sheets/detail/newborns-reducing-mortality). In sub-Saharan Africa, the first week is crucial and almost entirely determined by neonatal complications like preterm birth, asphyxia, trauma, and sepsis (http://ihmeuw.org/5n3x). The following 21 days are less determined by neonatal complications and more by infections like diarrhea, malaria, HIV, and meningitis (http://ihmeuw.org/5n3y).
4. Progress since 1990, through the MDGs and into the SDGs: more resources, accelerating reductions, targets still missed
Maternal and child mortality have one goal each in the MDGs. Goal 5 aimed to “improve maternal health” and goal 4 to “reduce child mortality” (UN, 2015, pp. 32, 38). This brought together a strong international commitment to focus on maternal and child health. Under the MDG era, reproductive health services aimed at both mother and child increased significantly globally, including for the poor and vulnerable, thus, greatly improving access and availability to reproductive health services.
Consequently, development assistance spending on maternal and newborn health increased dramatically between 1990 and 2015, although data are difficult to separate out the two precisely. It is likely that spending on maternal health tripled from about $ 0.5 billion (2020 USD) in the early 1990s to $1.5 billion in the early 2010s (cf. GHFP, 2021, Figure B). Spending on all categories, from maternal health, family planning, health system strengthening to human resources, more than doubled from $2 billion annually to $4–5 billion.
Similarly, development assistance spending on newborn and child health increased 10-fold from less than 1 billion 2020$ annually in 1990 to almost $8 billion in the 2010s (cf. GHFP, 2021, Figure E). However, most of the spending went toward child nutrition and immunization, which while very useful, does little for neonatal mortality.
This increase in spending likely made up much of the MDGʼs progress from 1990 to 2015, possible even if both specific targets were missed. For maternal health, the MDGs set a target of a 75 % reduction of maternal mortality from 1990 to 2015, equivalent to a reduction from 0.38 to 0.096 % of live births (UN, 2015, p. 38). The actual reduction was substantial but smaller at 44 to 0.21 % of live births. For child mortality, the MDGs promised a two-thirds reduction in under-5 mortality from 1990 to 2015, or a reduction from 9.3 to 3.1 % of births. Again the actual reduction was substantial but smaller at 54 to 4.3 % of births (https://data.worldbank.org/indicator/SH.DYN.MORT). The MDGs did not set a specific target for neonatal mortality, which is likely part of the reason neonatal mortality decreased slightly less at 48 %. The MDG target shown in Figure 2 assumes a similar two-thirds reduction in neonatal mortality from 1990 to 2015.
The pace in reduction in both maternal and child mortality accelerated significantly in the MDG era, with the annual rate of reduction in under-5 mortality for low-income countries almost doubling (McArthur & Rasmussen, Reference McArthur and Rasmussen2018, Table 1). At least 10.1 million and as many as 19.4 million additional children and mothers’ lives are estimated to have been saved in the first 15 years of the 2000s compared with pre-MDG trajectories, with many of the biggest improvements occurring in sub-Saharan Africa.
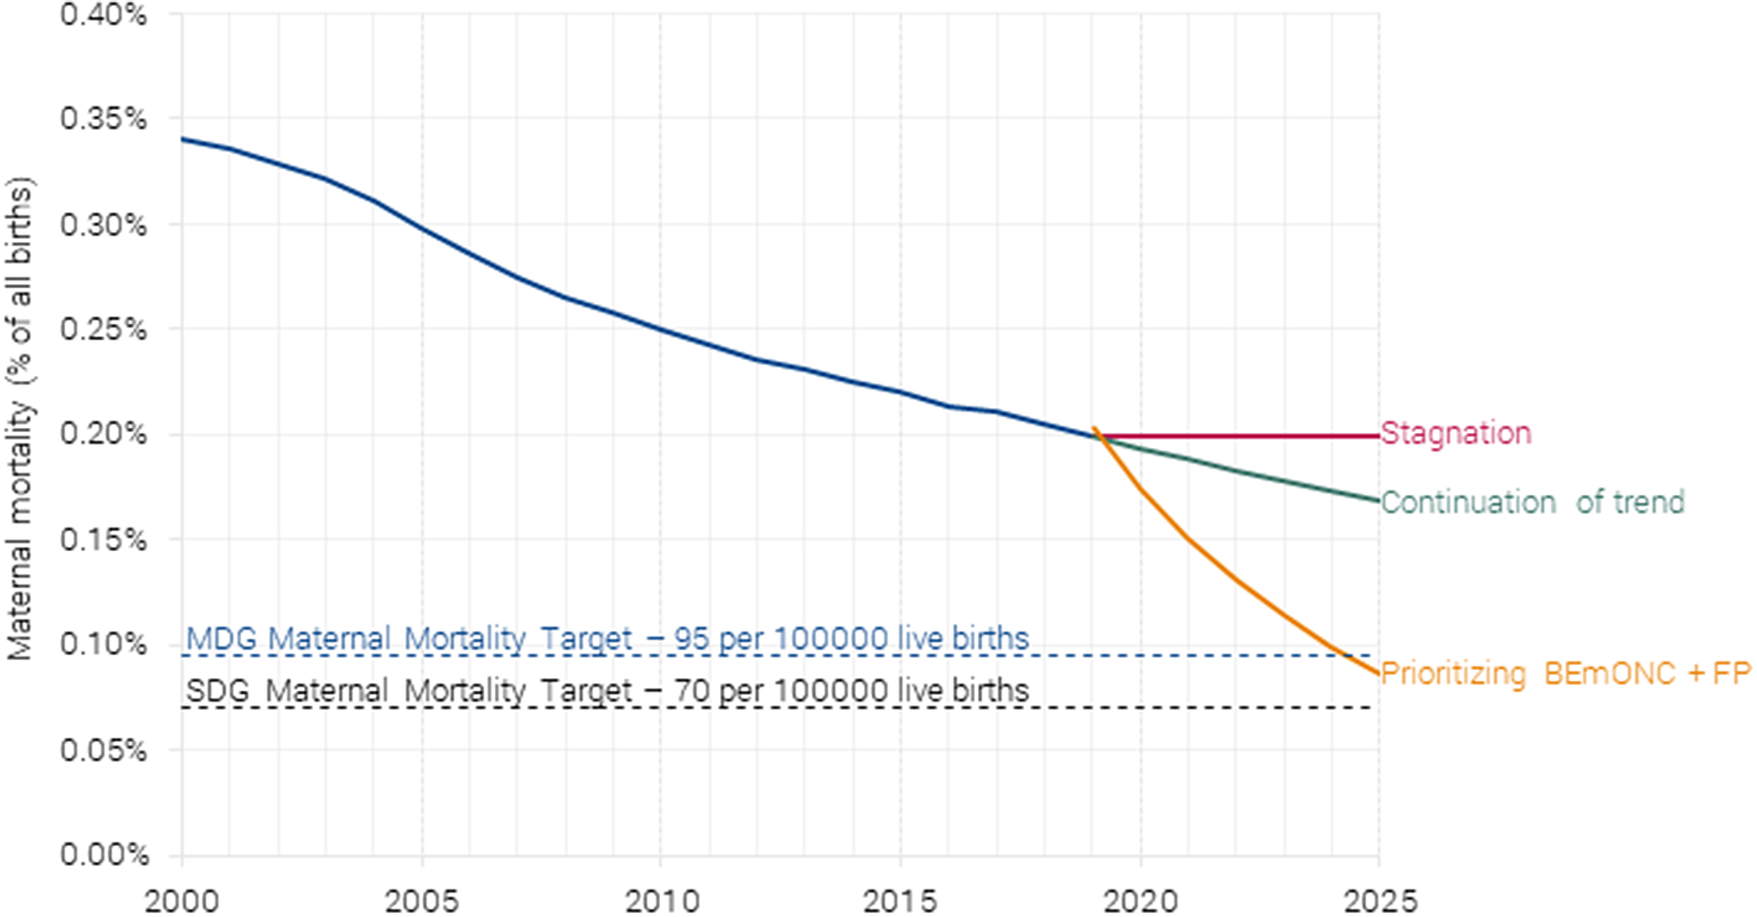
The SDG target 3.1 calls for a global maternal mortality ratio below 0.07 % by 2030, or a 68 % reduction from 2015. It will take a much greater focus on maternal mortality to achieve this target. Based on the current trajectory, maternal mortality will likely drop from 0.22 to 0.16 % in 2030 (see Figure 1), only achieving a 25 % reduction over the 15 years (McArthur et al., Reference McArthur, Rasmussen and Yamey2018). The annual reduction in maternal mortality is actually slowing down because most of the world’s births take place in countries with high maternal deaths and slow rates of decline. From 2005 to 2015, the annual maternal mortality reduction was 2.7 %, but on the current trajectory, the reduction from 2016 to 2030 will be just 1.9 %. To achieve the SDG target, an annual reduction of 7.3 % or an additional 5.4 percentage points is required. In the past, only 11 countries have achieved such a feat.
The UN offers three scenarios for forecasting the world population, high, medium, and low variants, and because global births will remain constant to 2030 in the UN Population Division’s medium variant, all reductions in absolute deaths will come from reduced maternal mortality. If the SDG maternal mortality target is reached in 2030, it will mean almost 200,000 fewer maternal deaths each year, with just under 100,000 mothers still dying every year. On the current trajectory, the annual number of saved maternal lives will more likely be 66,000, with the annual loss of maternal life in 2030 still at 229,000.
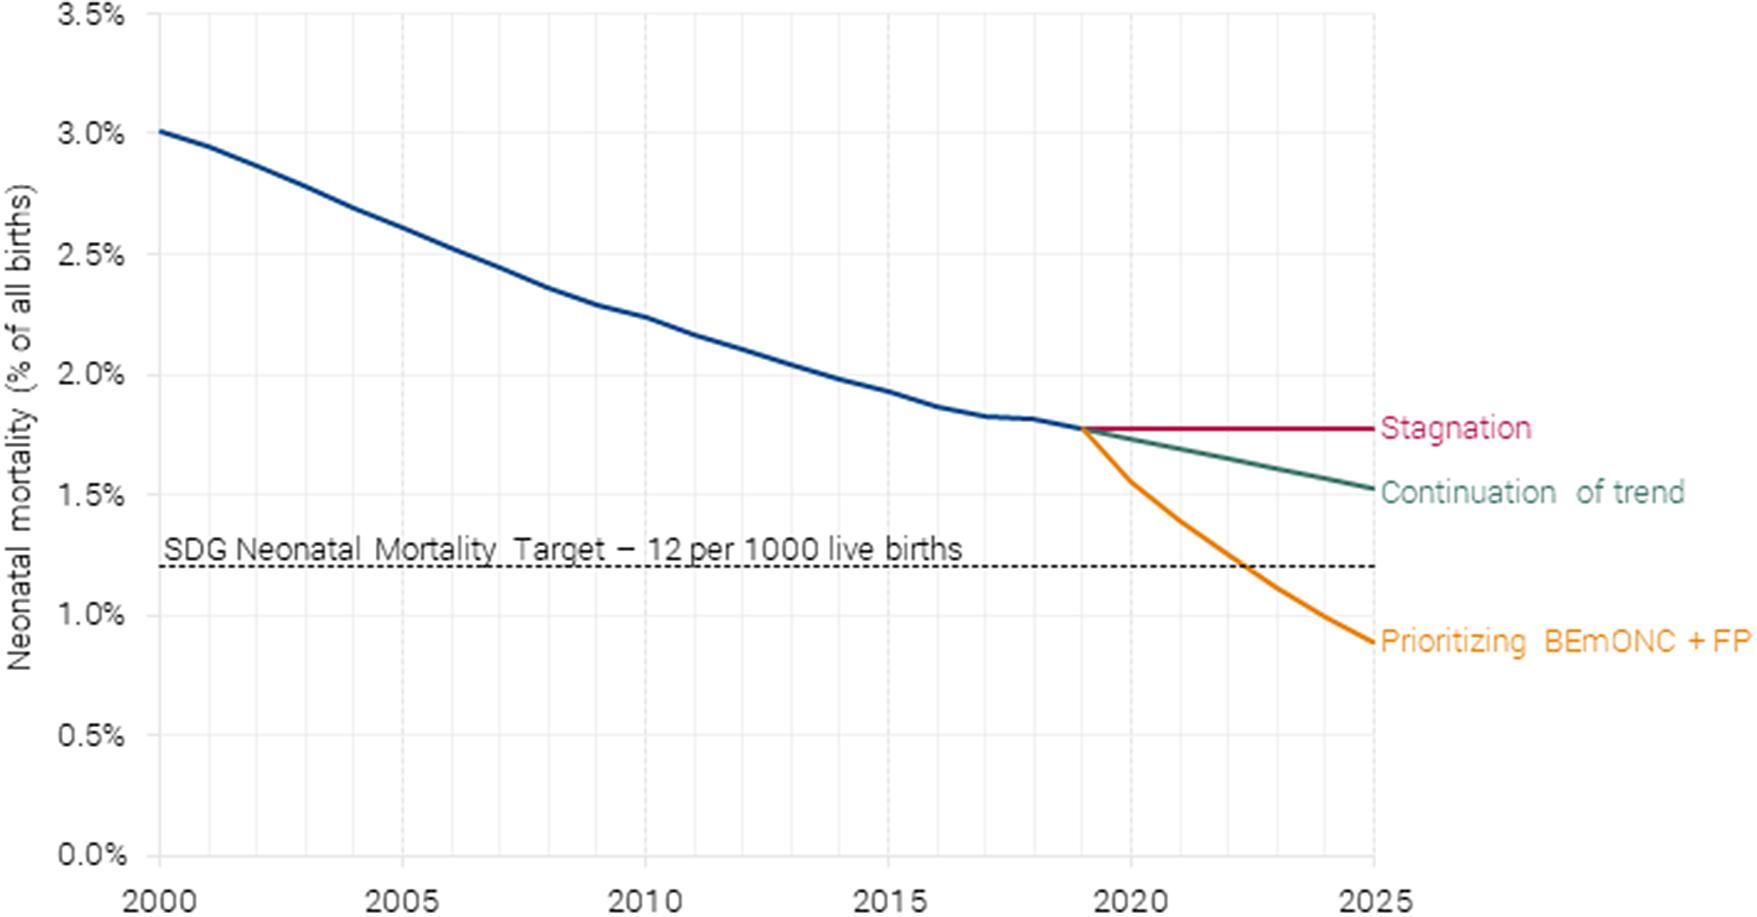
The SDG target 3.2 calls for a reduction in neonatal mortality so that every country’ sneonatal mortality prevalence will be below 1.2 % in 2030. Because many countries are already well below this level, the global target for 2030 is 0.89 %. This accounts for countries reducing neonatal mortality to the 1.2 % target, and other countries already below this target maintaining their current levels. On the current trajectory, it is likely the world will only reduce neonatal mortality from 1.92 % in 2015 to 1.54 % in 2030 (Paulson et al., Reference Paulson, Kamath, Alam, Bienhoff, Abady, Abbas and Abbasi-Kangevari2021), widely missing the neonatal mortality target, as is evident in Figure 2.Footnote 3
If the SDG neonatal mortality target is reached in 2030, it would avoid 1.2 million newborn deaths each year, with about 1.2 million still dying every year. Based on the current trajectory, the annual number of saved neonatal lives will more likely be around 400,000, with the annual loss of newborn lives in 2030 still at 2 million.
If the world is to speed up the necessary mortality reduction, more focus and resources will be necessary. It is hard to estimate the total current spending on maternal and neonatal health, not the least of which is because different estimates include different spending categories beyond the narrow maternal and neonatal spending, such as nutrition and vaccinations along with STD treatments (especially for HIV). One estimate of the cost of current and future sexual and reproductive health comes from the Guttmacher Institute’s Adding It Up project (Sully et al., Reference Sully, Biddlecom, Darroch, Riley, Ashford, Lince-Deroche, Firestein and Murro2020). A previous version of these estimates formed the cost basis for the Guttmacher-Lancet report (Starrs et al., Reference Starrs, Ezeh, Barker, Basu, Bertrand, Blum and Coll-Seck2018). Here, they find the total 2019 cost of the current level of contraceptive care, pregnancy-related and newborn care along with STD care for low-income and lower-middle-income countries to be $17 billion per year (Sully et al., Reference Sully, Biddlecom, Darroch, Riley, Ashford, Lince-Deroche, Firestein and Murro2020, data annex 18 and 19) or an average cost of $4.53 per person per year in the low-income and lower-middle-income countries ($3.40 for low-income and $4.79 for lower-middle-income countries).
Using the WHOs Global Health Expenditure Database (WHO, 2021), we reach a reasonably good estimate for sub-Saharan Africa, but coverage of the rest of the world is much more spotty. Looking at just sub-Saharan Africa without South Africa, the database has costs for 83 % of the population, with an average cost of reproductive health at $7.55 per person. While this estimate is somewhat higher than the Guttmacher estimate, it is useful because it allows separation of payments on the part of governments and donors as well as out-of-pocket for individuals. In this estimate, the government pays 30 % of the costs, donors 23 % and mothers themselves 47 %.
If this cost distribution is similar across all the low- and lower-middle-income countries, and the total cost is estimated at $17 billion per year, it means average costs per person for the government is $1.34, development organizations is $1.05, and private out-of-pocket is $2.14 (although the real cost per woman is much higher since most mothers in the population do not contribute). In total, the costs are split with $5 billion from governments, $4 billion from donors, and $8 billion from the mothers.
5. Policies to address maternal and neonatal deaths: Lives Saved Tool
Programs to address maternal and neonatal mortality should be targeted in low- and lower-middle-income countries because this is where most of the problems are concentrated. Sub-Saharan Africa accounts for almost 66 % of global maternal mortality and 42 % of neonatal mortality, with South Asia contributing around 22 and 37 %, respectively. The top five countries with the highest number of maternal deaths in 2017 include Nigeria, India, Ethiopia, the Congo, and Tanzania. A woman giving birth in Nigeria is 1.5 times more likely to die than a woman giving birth in sub-Saharan Africa, 4.5 times more likely than in South Asia, and 200 times more likely than in Sweden.
Likewise, a child born in sub-Saharan Africa is 10 times more likely to die in the first month of life than is a child born in a high-income country. Based on current trends, an estimated 24 million newborns will die between 2020 and 2030, and 80 % of these deaths will occur in sub-Saharan Africa and South Asia. Improving the mortality rates to meet SDG targets in these two regions alone will reduce the global burden by more than 5 million between 2020 and 2030 (UNIGME, 2020, p. 16).
The starting point of this analysis is the Lives Saved Tool or LiST (Walker et al., Reference Walker, Yvonne and Friberg2013). This analytical tool has been widely used to calculate the impact of scaling up maternal, neonatal, and child health interventions for program planning and multi-country estimation, for instance, in the Lancet Series on Childhood Pneumonia and Diarrhea (Bhutta et al., Reference Bhutta, Das, Rizvi, Gaffey, Walker, Horton, Webb, Lartey and Black2013b) and in the Lancet Series on Maternal and Child Nutrition (Bhutta et al., Reference Bhutta, Das, Walker, Rizvi, Campbell, Rudan and Black2013a). LiST is a module within the Spectrum suite of modeling tools. It is used to project the number of maternal, newborn, and child deaths and stillbirths that would be saved through an increase in coverage of individual health interventions. The module uses the most recently available data on women’s health status (mortality and nutrition), causes of death, and cause-specific effectiveness of the different interventions.
It is also possible to capture the costs of scaled up interventions using LiST for an estimation of both the cost and impact of maternal and newborn interventions in low-income and lower-middle-income countries to determine which are the most effective investments (Bollinger et al., Reference Bollinger, Sanders, Winfrey and Adesina2017). The tool includes all stages of interventions, from before conception (family planning) through periconceptual, antenatal, childbirth, and postpartum periods, as is listed in Table 1.
LiST interventions across the continuum of care for maternal and neonatal health.

6. Cost-benefit analysis of 40+ interventions
In 2020, the Copenhagen Consensus Center completed an analysis in LiST focusing on ways to improve maternal health (Friberg & Weissmann, Reference Friberg and Weissmann2020). The study was a comprehensive analysis of maternal and neonatal health interventions delivered individually and in packages across 59 low-and-middle-income countries where 90 % of maternal deaths and 86 % of neonatal deaths occur. The study investigated the costs (Table 2) and benefits of a broad range of interventions implemented either individually or combined together in packages at different stages along the continuum of the entire reproductive process. The research findings provide representative BCRs for investment along the continuum of maternal and neonatal care for low- and lower-middle-income countries.
The results of Friberg and Weissmann (Reference Friberg and Weissmann2020) are recalculated here reflecting the standardized approach for all Best Investment Papers in this series, so it is comparable with all other investments in the Halftime project. This means presenting the main results for the subset of 55 low-income and lower-middle-income countries. Leaving out four upper-middle-income countries that were included by Friberg and Weissmann (Reference Friberg and Weissmann2020), namely, Botswana, Gabon, Guyana, and South Africa, does not substantially change the main finding of BEmONC plus family planning being the intervention with the highest return.
The model tests 42 separate interventions in different phases of pregnancy from distribution of condoms in family planning to iron supplementation in periconception, antenatal care visits, and diabetes case management during pregnancy to assisted vaginal delivery during birth.Footnote 4 While estimating costs and benefits of individual interventions is valuable in demonstrating the potential and scale of direct impacts and the cost efficiency of a single intervention, it is not reflective of the way in which health services typically deliver interventions because interventions such as these tend to be grouped together and delivered either at a single visit, such as antenatal care, or at a single time point, such as childbirth.
Grouping interventions together into combined packages compounds the benefits to each recipient, lowering the time and costs of the women receiving treatment as well as the salaried time and costs of the person administering the treatments.Footnote 5 Moreover, more comprehensive treatment, as provided in such packaged approaches, accounts for the interdependency of multiple factors within pregnancy, lowering the overall likelihood of complications arising throughout and following the pregnancy and the associated demands on the health system those complications may create.
The analysis includes cost-benefit analysis of both separate interventions and packages of interventions, although the focus here is on the more realistic packages. These packages were created by grouping those interventions that could be delivered at specific points in time (family planning, the periconception period, and antenatally), as part of routine delivery care (clean birth environment, immediate drying and additional stimulation, thermal protection, clean cord care, and controlled cord traction), BEmONC (routine care plus antibiotics for preterm or prolonged premature rupture of membranes, parenteral administration of antibiotics, assisted vaginal delivery, neonatal resuscitation, parenteral administration of uterotonics, removal of retained products of conception, induction of labor for pregnancies lasting over 41 weeks, and antenatal corticosteroids for preterm labor) or comprehensive emergency obstetric care (CEmONC), which includes all childbirth interventions. Antenatal care attendance and facility delivery were not included as interventions per se but as delivery vehicles for the interventions when delivered as part of the packages. Finally, upon review of the results, additional packages were created that could be feasible to implement and that could maximize cost-effectiveness,
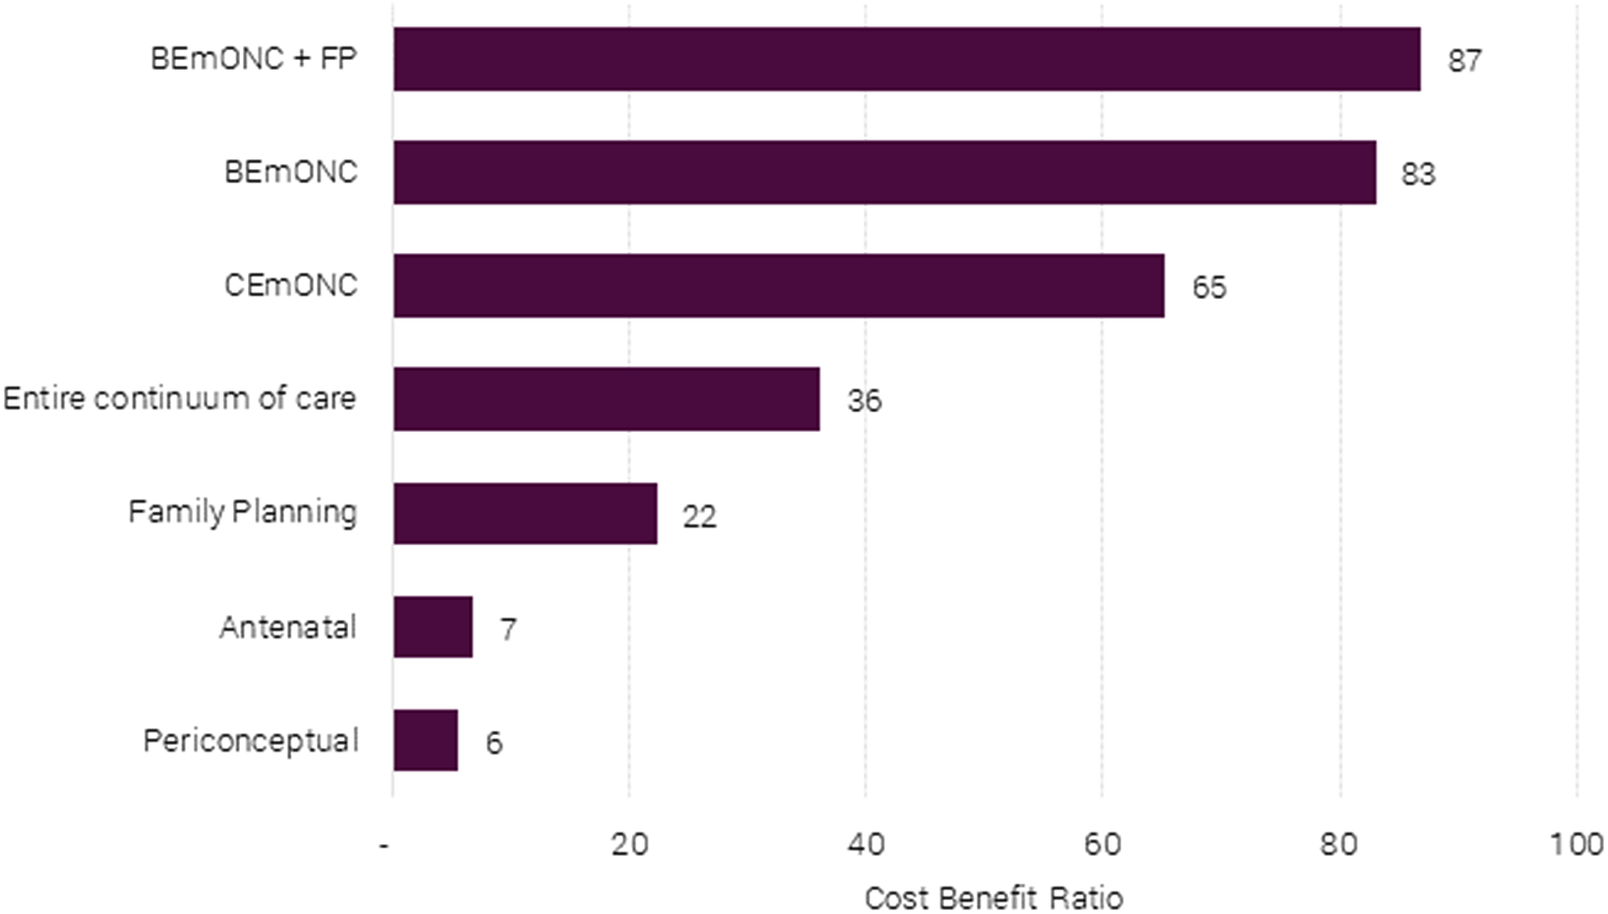
Figure 3 shows the social returns per dollar spent on packages or combinations of packages. The best overall package is one that invests in both basic emergency obstetric care and family planning, namely, BEmONC+FP. This package returns $87 of social benefits (mostly avoided death) for every dollar spent. This package is of an order of magnitude more cost-effective than a package focusing on antenatal care (BCR = 7) or periconception care (BCR = 6), and more than twice as cost-effective as implementing all interventions along the continuum of care (BCR = 36).
Benefit-cost ratios of different maternal and neonatal health packages for 55 LICs and LMICs.
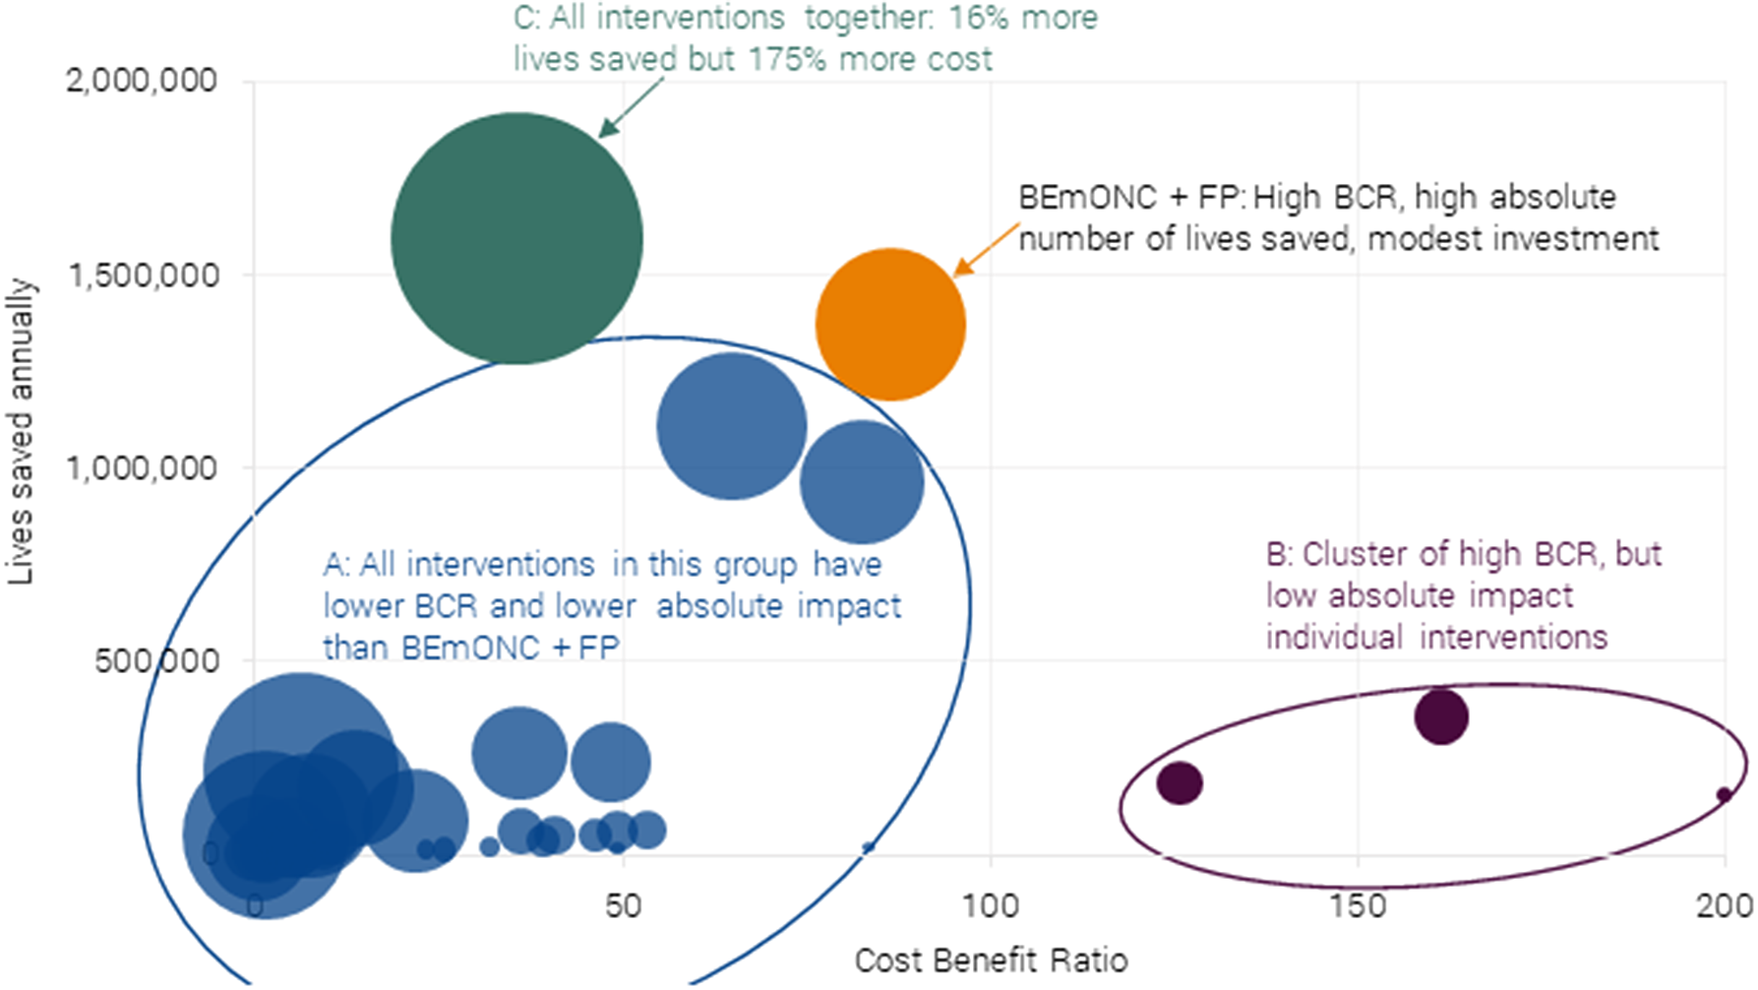
Looking across all interventions (individual and packages), a care package focusing on BEmONC+FP represents the best balance of high efficiency and impact, as can be seen in Figure 4. Thirty-five of the interventions considered have both lower BCRs and a lower number of lives saved (Cluster A).
Chart of 40 maternal and neonatal health interventions and packages on their effectiveness (BCR) and total impact (lives saved) for 55 LICs and LMICs. Authors’ calculations adopted from Friberg and Weissmann (Reference Friberg and Weissmann2020). The size of bubble = annual investment required. Note the intervention with a BCR of 200 in the graph actually has a BCR of 920 (neonatal resuscitation), but the data point has been rescaled so that the dispersion in the remaining interventions is more apparent.
All care related to the birth process is good and effective, and therefore CEmONC is also a great investment. However, given that it costs almost as much as the BEmONC+FP package with a lower impact in terms of mortality avoided, it makes a better case to invest in the latter first.
Four individual interventions have higher BCRs, but they address a relatively small share of the problem, and these interventions are all delivered individually, which is atypical of health systems (Cluster B).Footnote 6 Crucially, these four interventions are part of the BEmONC+FP package.
Last, one could argue for investment in all interventions (Cluster C). This has a 15 % higher impact in terms of lives saved, but requires investment of more than 200 % of BEmONC+FP. Therefore, it has a BCR of much less than half of the optimal package.
Therefore, for this best investment paper, the focus and recommendation is the package of BEmONC+FP because it has:
-
(i) An excellent BCR, larger than other individual interventions and packages.
-
(ii) Its absolute impact on maternal and neonatal deaths avoided is one of the greatest.
6.1. Cost-benefit analysis of the recommended BEmONC+FP package
The recommended intervention is the scale up of a package of BEmONC+FP interventions to 90 % of the population. All figures are expressed in 2020 US$. Since all costs (consumables, staff time, supervision, and overheads) are incurred in the same year as the benefits are obtained, the discount rate does not impact the results. Here, figures for 55 low-income and lower-middle-income countries combined are presented.
The BEmONC+FP package would ensure there are sufficient staff and resources available to deliver the following capabilities in health facilities:
-
(i) health facility delivery;
-
(ii) clean birth environment;
-
(iii) immediate drying and additional stimulation;
-
(iv) thermal protection;
-
(v) clean cord care;
-
(vi) uterotonics;
-
(vii) controlled cord traction/removal of placenta;
-
(viii) parenteral administration of anticonvulsants;
-
(ix) antibiotics for preterm or prolonged premature rupture of membranes;
-
(x) parenteral administration of antibiotics;
-
(xi) assisted vaginal delivery;
-
(xii) neonatal resuscitation;
-
(xiii) removal of retained products of conception;
-
(xiv) induction of labor for pregnancies lasting over 41 weeks;
-
(xv) antenatal corticosteroids for preterm labor; and
-
(xvi) family planning services including pills, condoms, injectables, implants, intrauterine devices, and male and female sterilization.
Baseline coverage of interventions was drawn from LiST for all 55 countries and represents the most current data up to 2018. From this baseline, coverage was scaled up to 90 % of the target population requiring the intervention. The analysis was run over a 5-year period (2020–2025) to ensure that the full effect of the interventions was achieved.
6.2. Costs are $3.2 billion per year
Three different types of costs are considered in the package: (i) costs incurred by the provider, such as staff, consumables, equipment, and overheads; (ii) beneficiary costs such as travel; and (iii) the cost of demand generation to ensure more women give birth in health facilities.Footnote 7 Service provision and costs to women were calculated in the context of interventions being delivered as packages, which substantially reduced the number of visits, staff, and travel time required. This is shown in Figure 5.
Annual costs after full scaling up of BEmONC+FP to 90 % coverage in 55 countries.
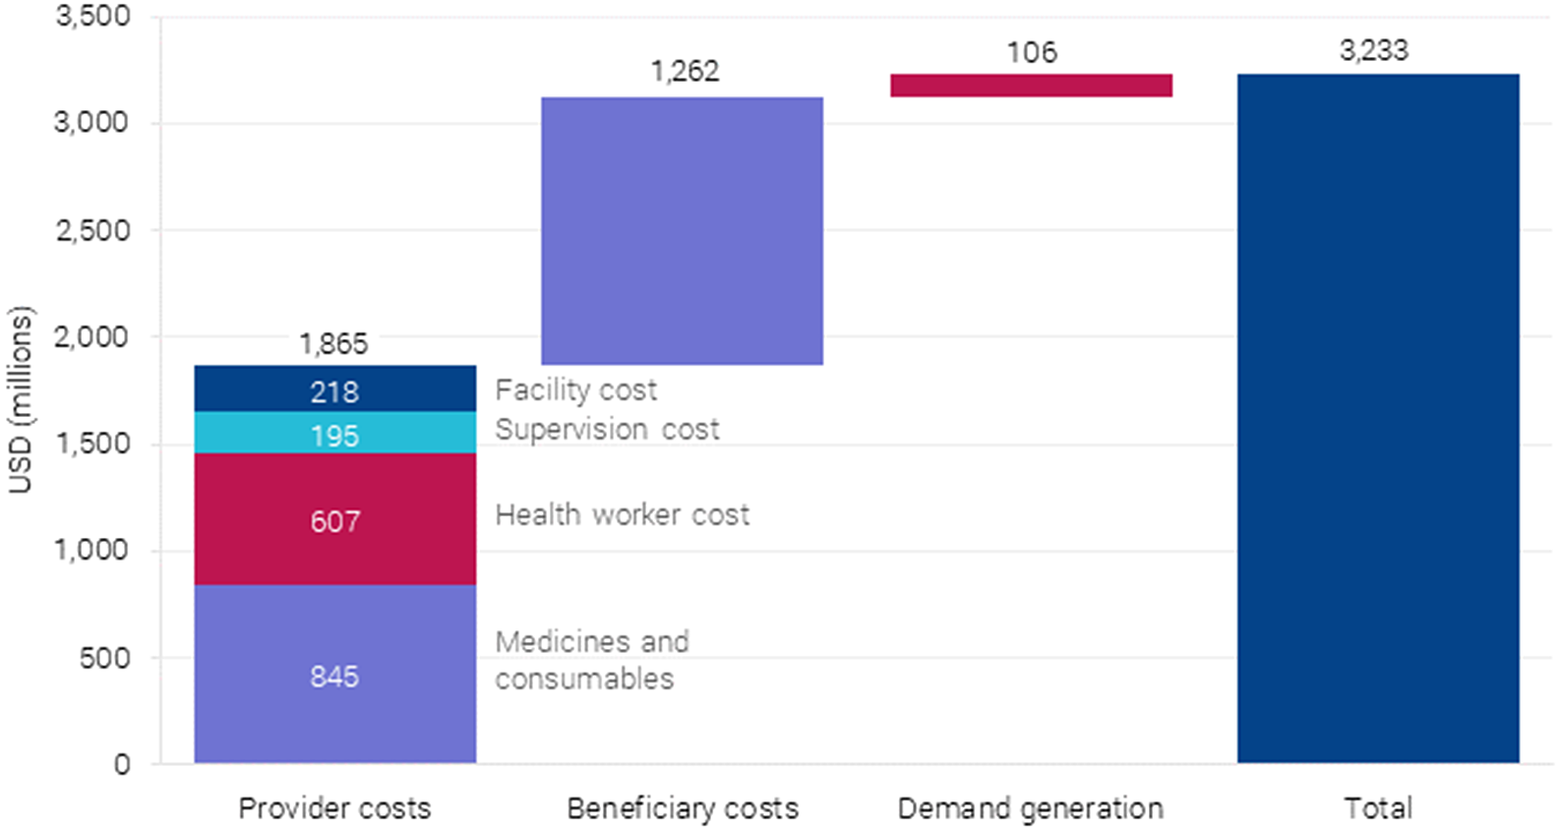
6.2.1. Provider costs
Costs were calculated using bottom-up costing, based on need for drugs, supplies, and the time required by medical staff per case for each of the interventions drawn from the UNICEF supply catalog as reported in Friberg and Weissmann (Reference Friberg and Weissmann2020). Medical staff and salaries, facility overhead costs, and ambulatory care provided at the health center level, and 15 % was added to the direct cost of service provision for supervision. The latter is a critical activity required to ensure that services are provided according to national standards and with high quality. It was assumed that all outpatient maternal interventions, such as antenatal care, would be provided at the health center (no beds) level, while all delivery-related intervention would take place at a primary-level hospital able to carry out emergency obstetric care (EmOC) functions.
6.2.2. Beneficiary costs
In addition to provider costs, the social costs to women accessing this care are also included. Travel times to health centers and hospitals were estimated for women in both rural and urban areas, including average waiting time at the health facilities. The analysis assumed a trip to the health center would take 30 min (round trip) in urban areas, 1 h in rural areas and trips to a hospital/EmOC facility would take 1 and 4 h, respectively. These times were then multiplied by a factor of 3 (health center) and 2 (hospital), respectively, to account for often substantial waiting times at the health facilities. The beneficiary time was monetized using individual country gross national income (GNI) per capita.Footnote 8
6.2.3. Demand generation
To account for the cost of stimulating demand and care seeking, the cost of a financial incentive program, based on India’s Janani Surakhsa Yojana program for deliveries at facilities, including costs for the 37 countries whose current delivery rate at facilities was below 70 %. It is assumed that this would increase the rate up to the target rate of 90 %. In addition to the cost of the incentives, 30 % add-on cost for the administration of the program was included. This cost was also assumed to incentivize increased ANC visits as per the design of Janani Suraksha Yojana.
Overall, provider costs make up the largest portion at $1.86 billion per year, followed by beneficiary costs at $802 million per year. Demand generation costs are the lowest at $106 million per year. Considering provider costs, $850 million is required for medicines and consumables, and $689 million for health workers with the rest as overhead (see Figure 6).
Monetized benefits after complete scaling up BEmONC+FP to 90 % coverage in 55 countries.
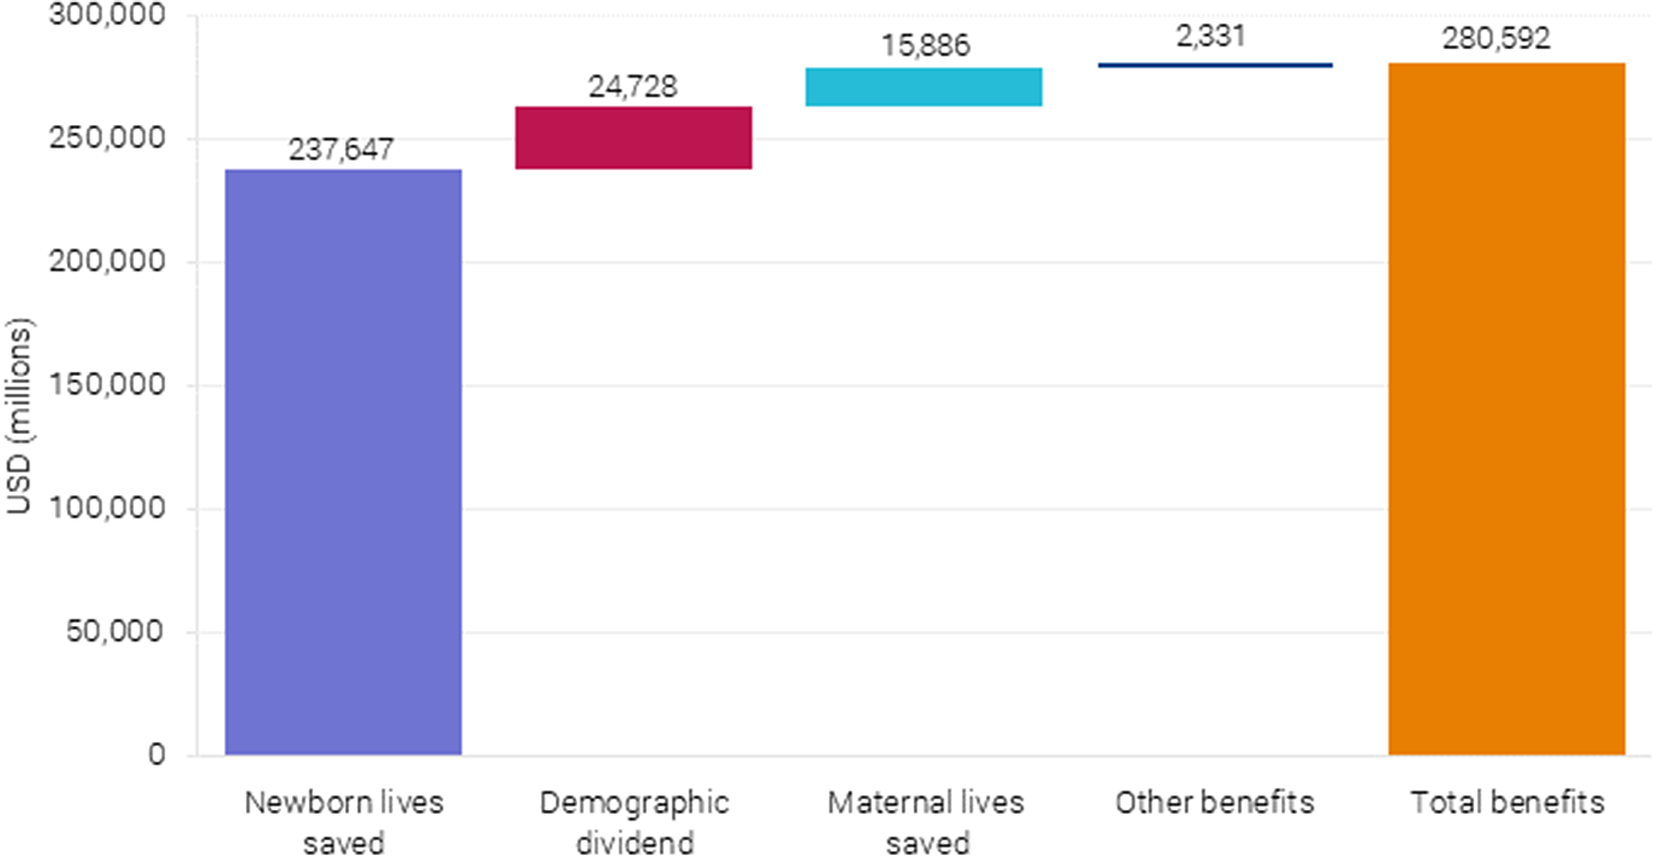
6.3. Benefits are $281 billion per year
Three types of benefits linked to the scaling up of the health interventions were included in the analysis: (i) lives saved, (ii) demographic dividend from reduced fertility, and (iii) morbidity and treatment costs averted. The analysis shows that lives saved generate the largest benefit, particularly neonatal lives saved, as seen in Figure 6. These benefits represent $238 billion out of the estimated $281 billion in benefits per year and are based on the projected neonatal mortality (Figure 7).
Projected neonatal mortality under different scenarios. Authors’ calculations based on Friberg and Weissmann (Reference Friberg and Weissmann2020).
6.3.1. Lives saved
Lives saved were calculated using the LiST, a module within the Spectrum suite of modeling tools, including Fam-Plan (family planning) and AIM (the AIDS impact model), which projects the number of maternal, newborn, and child deaths and stillbirths that would be saved through an increase in coverage of individual health interventions. The BEmONC+FP intervention is expected to avoid 1.20 million newborn deaths and 161,000 maternal deathsFootnote 9 in the first year when fully scaled in 2025.
Avoided mortality is monetized by first calculating the number of life years saved across all the 55 countries and multiplying it by the project’s value of statistical life years (VSLY) for low-income and lower-middle-income countries (VSLY = $2,983). Newborn lives saved generates the largest welfare impact by far, with an estimated benefit of $238 billion per year. The benefit from averting maternal mortality is $16 billion per year (see Figure 6), based on the projected maternal mortality (Figure 8).
Projected maternal mortality under different scenarios. Authors’ calculations based on Friberg and Weissmann (Reference Friberg and Weissmann2020).
6.3.2. Demographic dividend
A reduction in mortality and fertility can lead to a potentially significant increase in income per capita, also known as the demographic dividend. As described in Ashraf et al. (Reference Ashraf, Weil and Wilde2013), a decrease in population generates numerous benefits throughout a country and into the future. For example, if fertility rates decline, children make up a lower share of the total population, decreasing the dependency effect and increasing the available income per family and society overall. A higher proportion of the total population in the workforce leads to higher productivity and savings. Having fewer children lowers the amount of time women spend on child rearing, freeing time to participate in the labor market. Following Ashraf et al. (Reference Ashraf, Weil and Wilde2013), the impact on projected GDP per capita from the fertility reduction associated with family planning scale up is modeled. Specifically, a 0.5 reduction in total fertility rate (TFR) leads to 5.6 % increase in GDP per capita after 20 years and a 11.9 % increase in 50 years.
To estimate the benefit, we first construct the baseline (without additional family planning) time series of population, GDP and GDP per capita are sourced from the International Institute of Applied Systems Analysis database (Shared Socio-Economic Pathways 2 – middle-of-the-road scenario) as discussed in Riahi et al. (Reference Riahi, van Vuuren, Kriegler, Edmonds, O’Neill, Fujimori and Bauer2017).
LiST provides the reduction in the number of births as a result of family planning, and we assume the % reduction in births equates to the same % reduction in TFR in the long run. We source current TFR for all countries from UN Data (http://data.un.org/Data.aspx?d=PopDiv&f=variableID%3A54), and apply the % reduction in TFR to estimate the absolute reduction in TFR. For example, if the current TFR is 2.5 and family planning reduces the number of births by 10 %, we estimate the absolute reduction in TFR at 0.25.
For every 0.5-point reduction in TFR, we set a 5.6 % increase in GDP per capita for 20 years into the future, and an 11.9 % increase in GDP per capita 50 years into the future. For example, a 0.25-point reduction in TFR would lead to a 0.25*5.6 %/0.5 = 2.8 % boost to GDP per capita in 20 years and a 0.25*11.9 %/0.5 = 5.95 % boost in 50 years. In the intervening years, we linearly interpolate the expected GDP per capita boost. This provides a stream of GDP per capita % multipliers for the next 50 years. To estimate the demographic dividend benefit in year t, we multiply the GDP per capita boost in year t by the baseline GDP per capita and the population in year t, where population is adjusted downward to account for the avoided births in the previous years. This results in a stream of GDP increases, that is, the demographic dividend benefit across 50 years.
The present value of the demographic dividend at an 8 % discount rate is then annualized for the purposes of this benefit-cost analysis – a 1-year model of costs and benefits in 2025. This annualized demographic dividend represents the average annual benefit that generates the same present value of the demographic dividend benefit over the long term. In reality, the demographic dividend benefit will be smaller than this annualized value in the early years and higher in the later years.
6.3.3. Treatment costs averted
An estimate of the number of pregnancy and delivery complications averted is also included where applicable. Family planning in particular has a significant impact on the incidence of maternal complications and deaths, especially in countries with high maternal mortality rates by reducing the number of women who become pregnant and are exposed to the risk of dying in pregnancy and childbirth in the first place. These benefits are valued using monetized disability-adjusted life year (DALY) approach, where each DALY avoided is valued at VSLY plus provider and patient costs attributable to treating these sequelae.Footnote 10
6.3.4. Incentives
The incentives paid to women to encourage them to give birth at facilities equipped to provide safe and clean delivery services and give them access to life-saving emergency obstetric care when needed constitutes a benefit to the women who receive them. The money they receive can be spent on travel to the facility and cover any potential treatment costs as well as any additional purposes as needed. As noted above, the incentive payment also counts as a cost to the government.
7. Discussion and conclusion
7.1. How much more good will BEmONC+FP achieve?
Investing in BEmONC+FP would have significant impacts. Once coverage is scaled to 90 % by 2025, the intervention would reduce neonatal mortality by 1,200,000. Focusing on just the 55 low-income and lower-middle-income countries, the SDG target is binding for almost all countries, so it requires neonatal mortality to reach 1.2 %. The BEmONC+FP would achieve this already in 2025.
For maternal mortality, the intervention would save 161,000 women’s lives by 2025. This would achieve the MDG goal (albeit 10 years later than hoped) and be well on the way to the SDG goal of 0.07 % by 2030.
More importantly, the package represents an excellent use of resources with substantial benefits relative to costs. Why is this package such a good use of funds? The basic argument is that at this time in history, many women are already giving birth in facilities, so the challenging and costly work of building sufficient infrastructure, hiring staff, and incentivizing women to have facility births has been achieved. This leaves one natural leverage point through which a substantial number of health outcomes can be affected. The procedures in the recommended package are relatively inexpensive, can be delivered by nurses and midwives (as opposed to more costly doctors), and have the potential to save many lives.
For example, neonatal resuscitation requires only a hand pump or resuscitator, which costs around $65. If used 25 times in a year, the cost per use is $2.60. Adding health worker time, the total provider cost per child is in the order of $5. Neonatal resuscitation can avoid 30 % of deaths associated with asphyxia, one of the leading causes of newborn mortality (Lee et al., Reference Lee, Cousens, Wall, Niermeyer, Darmstadt, Carlo, Keenan, Bhutta, Gill and Lawn2011). Another example is kangaroo mother care, which requires skin-to-skin contact between mother and baby, a simple act that could reduce mortality in premature children by 50 % (Lawn et al., Reference Lawn, Mwansa-Kambafwile, Horta, Barros and Cousens2010).
7.1.1. Why has the intervention (BEmONC+FP) not already been implemented ?
If investment in maternal and newborn health is so effective, a natural question is, “Why hasn’t the world already invested in it?” Actually, it has, but with the focus on just increasing the rate of delivery in health facilities, investments have not been as effective.
Many countries have implemented programs to explicitly incentivize institutional deliveries, for example, India’s Janani Suraksha Yojana program that built facilities and then provided conditional cash transfers to mothers to give birth in them. While evidence cited during the MDG era (WHO, 2005) emphasized the benefits of institutional delivery (or the highly correlated indicator, the rate of births with skilled birth attendants), more recent and arguably more robust evidence shows that institutional births are not necessarily enough to bring down maternal and infant mortality.
For example, while India’s incentive scheme did increase the proportion of women giving birth in facilities, the impact on maternal and neonatal mortality was not significant (Powell-Jackson et al., Reference Powell-Jackson, Mazumdar and Mills2015). This is primarily because while the incentive program increased the uptake of facility births, the quality of maternity services offered at these facilities remained poor. In effect, while health facilities were available and the incentives ensured that pregnant women reached the facilities to deliver their babies, it was at the next stage that the shortfall existed, namely, the availability of all the components that allow for emergency obstetric care (Sen et al., Reference Sen, Chatterjee, Khan and Mohanty2020).
The reason for this historical disconnect between what was emphasized in MDG era documents and what transpired perhaps lies in the fact that policy makers assumed that what happened in the past would happen in the future. Institutional births in high-income countries and for the first section of women to avail themselves in developing countries (typically those of higher socio-economic status) are usually equated to having the right staff, materials, and equipment to deliver emergency care. However, as the goal of more institutional births was attempted in developing countries, the quality of healthcare services did not meet this historical mark (Banerjee & Duflo, Reference Banerjee and Duflo2006). Some of the reasons for this may be facilities being understaffed (Carvalho & Rokicki, Reference Carvalho and Rokicki2018); a lack of trained health personnel with nurses, especially auxiliary nurse-midwives; a lack of adequate training and skills in offering emergency obstetric care services (Creanga et al., Reference Creanga, Srikantiah, Mahapatra, Das, Sonthalia, Moharana, Gore, Daulatrao, Durbha, Kaul, Galavotti, Laterra, Pepper, Darmstadt and Shah2020); and/or shortages in emergency obstetric-care facilities and a lack of drugs, diagnostics, and essential medicines needed for basic obstetric care (Gupta et al., Reference Gupta, Fledderjohann, Reddy, Raman, Stuckler and Vellakkal2018).
While there have been some gains in investing in MNH across the world, certain aspects along the continuum of care have received inadequate attention, with BEmONC being one of them. This seems to be the crucial missing link. Even with countries having health infrastructure and facilities in place and pregnant women being incentivized and reaching these facilities for delivering their babies, what seems to be lacking is a focus on quality emergency obstetric care. This is a critical and crucial input for lowering both maternal and neonatal mortality rates.
7.1.2. Impact of COVID-19
COVID-19 has severely disrupted essential health and nutrition services globally, resulting in widening inequalities that could result in a reversal of decades long progress made in maternal and neonatal health. More than one-third of all countries faced declines of 10 % and more for coverage of maternal health services by the end of October 2020 as compared to 2019 (UNICEF, 2020). According to a recent study (Sachs et al., Reference Sachs, Schmidt-Traub, Kroll, Lafortune, Fuller and Woelm2021), if routine healthcare is disrupted and access to food is decreased, the increase in child and maternal deaths could be devastating: 118 low- and lower-middle-income countries could see an increase of 9.8 to 44.8 % in under-5 deaths per month and an 8.3 to 38.6 % rise in maternal deaths per month over a period of 6 months.
However, while the increased number of deaths resulting from the pandemic would be a huge setback, it would also mostly be transitory, as is evident in, for example, the 2021 prognoses from the Gates Foundation (https://www.gatesfoundation.org/goalkeepers/report/2021-report/progress-indicators/neonatal-mortality/ and https://www.gatesfoundation.org/goalkeepers/report/2021-report/progress-indicators/maternal-mortality/). Thus, it is likely that this will not substantially change the long-term trajectory. Moreover, if anything, COVID-19 is yet another reminder that there is too little funding for all good efforts in the healthcare system. This emphasizes, once again, the imperative of financing the best investments for improving maternal and neonatal mortality, and more particularly, BEmONC+FP.
Acknowledgments
The authors would like to thank Carol Levin, University of Washington; Eva Weissman, School of International and Public Affairs, Columbia University; Ingrid Friberg, Tacoma-Pierce County Health Department; and Bjorn Lomborg, Copenhagen Consensus Center for their valuable comments that supported this analysis. All responsibility for the content remains with the authors.
Appendix
Coverage and costing assumptions for 55 countries, BEmONC + family planning.
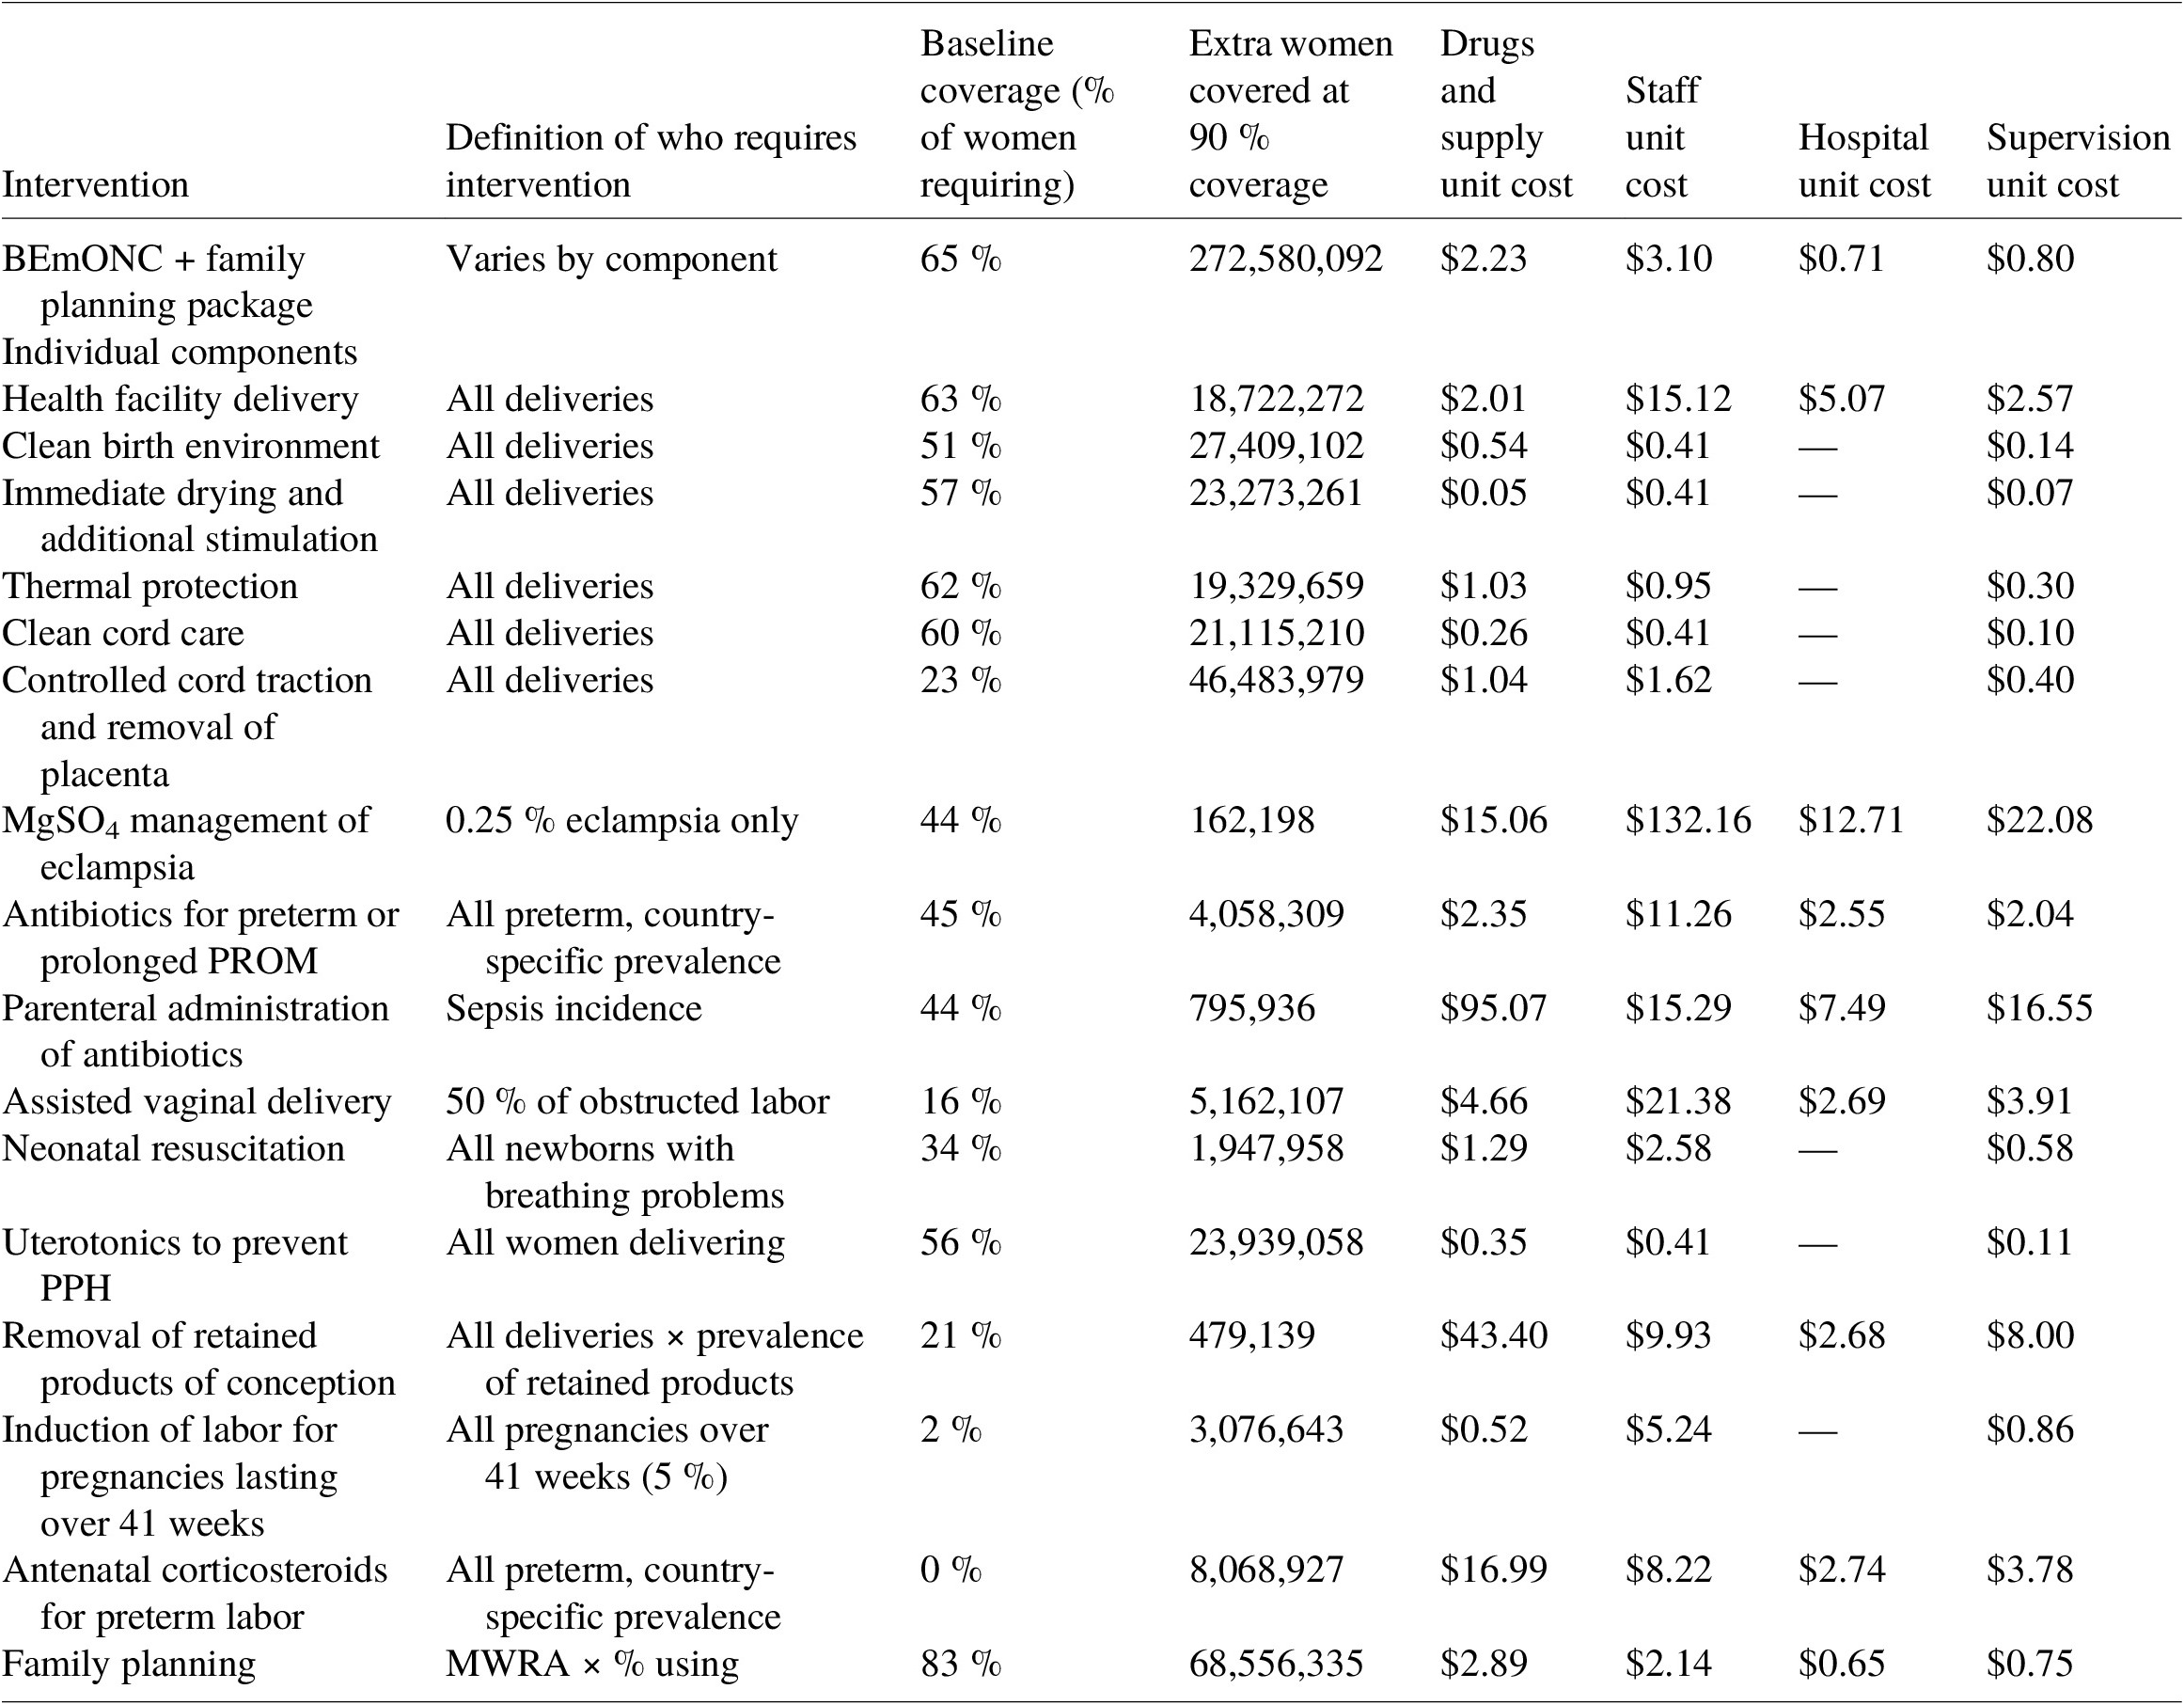
Sources: Number of women giving birth from UN Data, coverage assumptions from LiST, definition of who requires intervention and unit cost assumptions from Friberg and Weissman (Reference Friberg and Weissmann2020) based on requirements under WHO guidelines. Only interventions requiring extra nights’ stay in hospitals, relative to a standard health facility delivery, attract facility costs.


 Open access