


1. Introduction
Disability income insurance (DII), also known as income protection insurance, provides regular payments to replace lost income during a period of sickness or disability for the policyholder. Payments normally commence being paid to the insured person after a continuous period of sickness or disability, known as the waiting period or deferment period. A three-month deferment period is common. If the claimant recovers from sickness or disability, the payments stop. Most insurance companies use regression models to predict the frequency and duration of DII claims where explanatory variables are selected from a range of policyholder characteristics. As an example, the official UK predicted DII claim incidence rates depend on the sex, age, and occupation class of the policyholder, and the deferment period built into the policy (Continuous Mortality Investigation, 2000). In contrast, in Germany, simpler models where predicted claim rates depend only on the policyholder’s sex and age are common (Deutsche Aktuarsvereinigung e.V., 2022). Several studies have shown that economic conditions significantly influence DII claims experience. Some studies claim that an improving economy leads to higher losses for insurance companies (pro-cyclical relationship), while others suggest the opposite (counter-cyclical relationship).
Studies proposing a pro-cyclical relationship argue that during periods of economic growth, the demand for workers increases, leading to more workplace accidents and mental illnesses due to pressure and long hours, resulting in more DII claims (Nordberg & Røed, Reference Nordberg and Røed2009; Schriek & Lewis, Reference Schriek and Lewis2010). This may also be accompanied by insurance companies relaxing claims management to protect their reputation and policyholders avoiding returning to work (Audas & Goddard, Reference Audas and Goddard2001; Askildsen et al. Reference Askildsen, Bratberg and Nilsen2002; Leigh, Reference Leigh1985; Schriek & Lewis, Reference Schriek and Lewis2010). The case for a counter-cyclical relationship is stronger in the literature. In periods of economic downturn, studies have found that more policyholders claim DII benefits (e.g., Doudna, Reference Doudna1977 and Smoluk & Andrews, Reference Smoluk and Andrews2009 for the United States, Service & Ferris, Reference Service and Ferris2000 and Khemka et al., Reference Khemka, Roberts and Higgins2017 for Australia, Donnelly & Wüthrich, Reference Donnelly and Wüthrich2012 for Switzerland, and Schriek & Lewis, Reference Schriek and Lewis2010 for South Africa). These studies demonstrate higher levels of unemployment are most commonly associated with heightened DII claim rates (Doudna, Reference Doudna1977; Khemka et al., Reference Khemka, Roberts and Higgins2017; Schriek & Lewis, Reference Schriek and Lewis2010; Service & Ferris, Reference Service and Ferris2000; Smoluk & Andrews, Reference Smoluk and Andrews2009). As unemployment rises, policyholders fear losing their jobs and income, making DII benefits more attractive. “Hidden disabled” insureds who technically qualify for DII benefits but continue working may claim benefits once the utility of DII benefits exceeds their expected income (Doudna, Reference Doudna1977; Schriek & Lewis, Reference Schriek and Lewis2010; Smoluk & Andrews, Reference Smoluk and Andrews2009). Employers may also initiate claiming for disability, particularly during economic downturns, by fraudulently confirming workers’ disability status as a socially acceptable means for canceling unwanted employment contracts (Doudna, Reference Doudna1977; Schriek & Lewis, Reference Schriek and Lewis2010). Schriek & Lewis (Reference Schriek and Lewis2010) suggest that the relationship between the economic variables, principally the level of unemployment, and DII risk is largely dependent on the level of social and economic development in the studied country, with developed countries more likely to observe a counter-cyclical relationship. This could be due to higher workplace standards that prevent accidents from increasing during times of greater economic activity.
The above-mentioned studies confirm that it is essential to consider economic variables, such as the unemployment rate, when predicting DII claims experience. This paper is the first we are aware of to develop an investment strategy that aims to hedge the risk of heightened claim rates in periods of economic recession. First, statistically validated relationships between claim rates and economic indicators are quantified. Second, we construct asset portfolios to align with the most influential economic indicators. The effectiveness of such economic tracking portfolios is well established in the literature, e.g., Lamont (Reference Lamont2001), Boys et al. (Reference Boys, Hu and Jagannathan2005), Stotz (Reference Stotz2018), and Renz & Stotz (Reference Renz and Stotz2021). The novelty of our approach lies in combining the statistical models from the first step and the idea of economic tracking portfolios from the second step to derive an investment strategy for DII insurers to hedge economic risk.
The rest of the paper is structured as follows. In Section 2, we propose our three-step process to quantify and hedge economic risk in DII portfolios. In Section 3, we illustrate our approach using UK data and then analyze its potential benefits in a forward-looking simulation study (Section 3.4). Section 4 concludes. Note that the terms inception and incidence both refer to newly authorized DII claims, and the term recovery to an active claim where payments cease because the claimant has recovered and returned to work.
2. Methods for quantifying and hedging economic risk
The liability profile for a DII portfolio is influenced by economic conditions. It is, therefore, prudent to explore the construction of asset portfolios to support these liabilities where the performance is also linked to the same economic conditions. We therefore propose a three-step process for reducing overall risk in DII portfolios, which takes into account the impact of economic conditions on both the claims liabilities and the associated asset portfolios that support these liabilities. We first quantify the influence of economic indicators on DII claims experience using statistical models. Second, we set up economic tracking portfolios for the identified economic indicators. Finally, we use our economic tracking portfolio for assets, and our knowledge of the association between DII claims liabilities and economic conditions to develop a partial hedging strategy for the economic risk in a DII portfolio.
2.1. Identification and quantification of economic risk
We propose a modeling framework to measure the impact of economic indicators on DII claim incidences and recoveries. We will assume the typical setting an insurance company has, namely, that there already is a statistical model in place based on demographic factors only. This model, whether it is developed solely by the company itself or from an industry-wide model like those produced by the Continuous Mortality Investigation in the UK, will provide predictions of claim inception and recovery rates, grouped by demographic factors.
Grouping policyholders according to the same demographic factors, insurance companies derive the expected number of DII claims and recoveries. If demographic factors were sufficient to explain DII claims experience, then the residuals, i.e., the difference between the actual claim experience and the expected claim experience would exhibit a random scatter without any pattern.
Previous studies have shown that these residuals vary in systematic ways with economic variables. We, therefore, propose to build a regression model with these residuals as the response variable and economic indicators as covariates. The choice of economic indicators is based on a combination of experience and historical evidence. The unemployment rate is the most common economic indicator used in the relevant literature, so we use it. The regression variables can be selected and transformed in order to formulate a reliable statistical model linking economic variables to DII claims experience. We explore both multiple linear regression models and generalized linear models (GLMs). In each case, the exposure associated with each grouped data point is related inversely to its weight in the fitting algorithms employed. This is discussed in the literature in this context (see, for example, Khemka et al., Reference Khemka, Roberts and Higgins2017).
Once the economic indicators have been identified and their impact quantified, we can proceed with step two of our methodology where we construct economic tracking portfolios for these indicators.
2.2. Constructing tracking portfolios for economic indicators
The aim of this section is to construct a portfolio of assets, including both risky assets and bonds, which tracks, through time, as accurately as possible, the level of an economic indicator, such as the unemployment rate. The ability of assets to track macroeconomic variables has been proven extensively in previous work, see Lamont (Reference Lamont2001), Boys et al. (Reference Boys, Hu and Jagannathan2005), Stotz (Reference Stotz2018), Renz & Stotz (Reference Renz and Stotz2021), Conrad et al. (Reference Conrad, Schoelkopf and Tushteva2023), Kroner (Reference Kroner2023), and Fromentin (Reference Fromentin2022). The methodology in this section is mainly based on Lamont (Reference Lamont2001) and Breeden et al. (Reference Breeden, Gibbons and Litzenberger1989).
Let $x\,=\,(x_{1,2},\dots, x_{n,n+1})'$
denote the relative changes of an economic indicator over
$x\,=\,(x_{1,2},\dots, x_{n,n+1})'$
denote the relative changes of an economic indicator over $n$
time periods. Further, let
$n$
time periods. Further, let $R_{t-1,t}^{(j)}$
be the returns from time
$R_{t-1,t}^{(j)}$
be the returns from time $t-1$
to
$t-1$
to $t$
of asset
$t$
of asset $j,\ j = 1,\dots, m$
. We seek portfolio weights
$j,\ j = 1,\dots, m$
. We seek portfolio weights $b_{1},\dots, b_{m}$
, such that
$b_{1},\dots, b_{m}$
, such that
 \begin{align*} x_{t-1,t} \approx \sum _{j=1}^{m} b_{j} R_{t-1,t}^{(j)}, \end{align*}
To achieve this, we regress the vector $x$
on the corresponding past asset returns using ordinary least squares regression, which yields coefficient estimates
$x$
on the corresponding past asset returns using ordinary least squares regression, which yields coefficient estimates $\hat{\beta }_{j}$
. We now reinterpret these estimates as portfolio weights, which, however, must sum up to 1. We, therefore, normalize the coefficient estimates and use
$\hat{\beta }_{j}$
. We now reinterpret these estimates as portfolio weights, which, however, must sum up to 1. We, therefore, normalize the coefficient estimates and use
 \begin{align} b_{j} &\,:\!=\, \lambda ^{-1} \hat{\beta }_{j}, \nonumber \\[3pt] \lambda &\,:\!=\, \sum _{j=1}^m \hat{\beta }_{j}, \end{align}
as portfolio weights. Note that the consequence of normalizing with $\lambda$
is that our tracked economic variable is also multiplied by the same factor. This will be a consideration when defining the amount to invest in the hedging portfolio
$\lambda$
is that our tracked economic variable is also multiplied by the same factor. This will be a consideration when defining the amount to invest in the hedging portfolio $b$
.
$b$
.
Finally, we note that we are dealing with highly correlated covariates as several asset returns are used in the regression. Therefore, multicollinearity issues arise, and relying on single coefficient estimates is not appropriate. Hence, using regression to quantify the influence of single index returns on the key variable might not be valid, but the least squares estimation itself is not biased (Willis & Perlack, Reference Willis and Perlack1978). Given that we are interested only in using the resulting portfolio weights, we can still proceed with the implied tracking portfolio.
2.3. Developing the hedging strategy
We now combine the results from Sections 2.1 and 2.2 to develop a hedging strategy that offsets DII portfolio claims liabilities arising from economic changes. First, we quantify DII payments from the perspective of an insurer, where we define losses as all claim payments made by the insurer. The losses in year $t$
, denoted by
$t$
, denoted by $L_t$
, are equivalent to the previous year’s losses plus the cost of new claims less the reduction in costs due to recoveries,
$L_t$
, are equivalent to the previous year’s losses plus the cost of new claims less the reduction in costs due to recoveries,
 \begin{align*} L_t = L_{t-1} + c \times (A_{I,t} - A_{R,t}). \end{align*}
where $A_{I}$
and
$A_{I}$
and $A_{R}$
denote actual inceptions and recoveries, respectively, and we assume that each claim leads to the same cost
$A_{R}$
denote actual inceptions and recoveries, respectively, and we assume that each claim leads to the same cost $c$
per year. Insurance companies can apply their individual, more complex cost structures here, e.g., using insurance group-specific costs. Using conventional DII rates, which depend on demographic factors only, an insurance company can compute the expected claims experience
$c$
per year. Insurance companies can apply their individual, more complex cost structures here, e.g., using insurance group-specific costs. Using conventional DII rates, which depend on demographic factors only, an insurance company can compute the expected claims experience $\mathrm{E}_I$
and
$\mathrm{E}_I$
and $\mathrm{E}_R$
. Assuming that the insurer has allowed for the expected costs, we calculate the excess loss arising as the difference between expected and actual inceptions and recoveries, respectively. We denote this amount we want to hedge by
$\mathrm{E}_R$
. Assuming that the insurer has allowed for the expected costs, we calculate the excess loss arising as the difference between expected and actual inceptions and recoveries, respectively. We denote this amount we want to hedge by $H$
, that is,
$H$
, that is,
 \begin{align*} H_t = L_{t-1} + c \times (A_{I,t} - A_{R,t}) - (L_{t-1} + c \times (E_{I,t} - E_{R,t})) = c \times (A_{I,t} - E_{I,t} + A_{R,t} - E_{R,t}). \end{align*}
Note that in step one of our methodology, we found a model that quantifies the influence of economic variables on the difference between actual and expected claims experience. Let us denote the relative changes of the $k \in \mathbb{N}$
economic indicators used in these models by
$k \in \mathbb{N}$
economic indicators used in these models by $x_{t-1,t}^{(l)}$
,
$x_{t-1,t}^{(l)}$
, $l = 1,\dots, k$
. Using the underlying model formulations enables us to approximate our hedging amount
$l = 1,\dots, k$
. Using the underlying model formulations enables us to approximate our hedging amount $H$
as a linear function of these economic indicators, that is,
$H$
as a linear function of these economic indicators, that is,
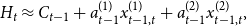
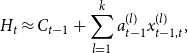 \begin{align} H_t \approx C_{t-1} + \sum _{l=1}^k a_{t-1}^{(l)} x_{t-1,t}^{(l)}, \end{align}
with parameters $C_{t-1}$
and
$C_{t-1}$
and $a_{t-1}^{(l)}$
. The values of
$a_{t-1}^{(l)}$
. The values of $C_{t-1}$
and
$C_{t-1}$
and $a_{t-1}^{(l)}$
depend on the model in step one, and we will show an example in Section 3.3.
$a_{t-1}^{(l)}$
depend on the model in step one, and we will show an example in Section 3.3.
The aim of the hedging strategy is to set reserves and investments at time $t-1$
, such that we end up with
$t-1$
, such that we end up with $L_t$
at time
$L_t$
at time $t$
.
$t$
. $C_{t-1}$
and the
$C_{t-1}$
and the $a_{t-1}^{(l)}$
are known at time
$a_{t-1}^{(l)}$
are known at time $t-1$
; however, the relative changes in the economic indicators,
$t-1$
; however, the relative changes in the economic indicators, $x_{t-1,t}^{(l)}$
, are unknown. This is where the tracking portfolios from Section 2.2 are employed. If the tracking is perfect, then by investing the amounts
$x_{t-1,t}^{(l)}$
, are unknown. This is where the tracking portfolios from Section 2.2 are employed. If the tracking is perfect, then by investing the amounts
 \begin{align*} a_{t-1}^{(l)} \times \lambda ^{(l)} \times x_{t-1,t}^{(l)},\ \ l = 1,\dots, k, \end{align*}
in the corresponding portfolios, we end up with $H_t$
at time
$H_t$
at time $t$
, where
$t$
, where $\lambda ^{(l)}$
is the normalization factor from Equation (1). We note that, in practice, the tracking portfolios will rarely be able to perfectly track the economic indicators. This directly impacts the quality of the hedge, and hence, the process provides a partial hedge. However, as we show in the example in the following section, the partial hedge still has significant implications on the insurer’s reserves.
$\lambda ^{(l)}$
is the normalization factor from Equation (1). We note that, in practice, the tracking portfolios will rarely be able to perfectly track the economic indicators. This directly impacts the quality of the hedge, and hence, the process provides a partial hedge. However, as we show in the example in the following section, the partial hedge still has significant implications on the insurer’s reserves.
In summary, we quantified the relationship between DII losses and economic variables in Section 2.1. In Section 2.2, we developed economic tracking portfolios, which yield returns that approximately match the losses attributable to economic factors. Finally, we developed a hedging strategy in Section 2.3. In the next section, we will illustrate the methodology explained here using UK DII claims and economic data.
3. Results
In this section, we apply our methodology to UK data from 2004 to 2016,Footnote 1 following the three steps outlined in Section 2. The data used in this paper are provided by the UK Continuous Mortality Investigation (CMI). The CMI has provided us access to their data and associated working paper series. In Appendix A, we provide a more detailed introduction to this data set.
3.1. Quantifying economic risk
Using the methods explored in Section 2.1, we now aim to model the effect of economic variables on the difference between expected and actual claim inceptions and recoveries, $A - E$
. In our case, the expected rates are provided by the CMI. These rates were estimated using Poisson GLMs, allowing for the effects of the factors sex, age, occupation class, deferment period, and claim duration (see Appendix A).
$A - E$
. In our case, the expected rates are provided by the CMI. These rates were estimated using Poisson GLMs, allowing for the effects of the factors sex, age, occupation class, deferment period, and claim duration (see Appendix A).
We consider the following UK economic indicators: the unemployment rate grouped by the same age groups as our DII data, the net domestic product, the Business Confidence Index, and the Consumer Confidence Index. Our two main data sources are the UK Office for National Statistics (Office for National Statistics, 2021, 2022) and the Organization for Economic Co-operation and Development (Organisation for Economic Co-operation & Development 2022a, 2022b). The choice of the indicators is inspired by prior literature as well as statistical evidence of the relationship between the indicators and model residuals, $A-E$
.
$A-E$
.
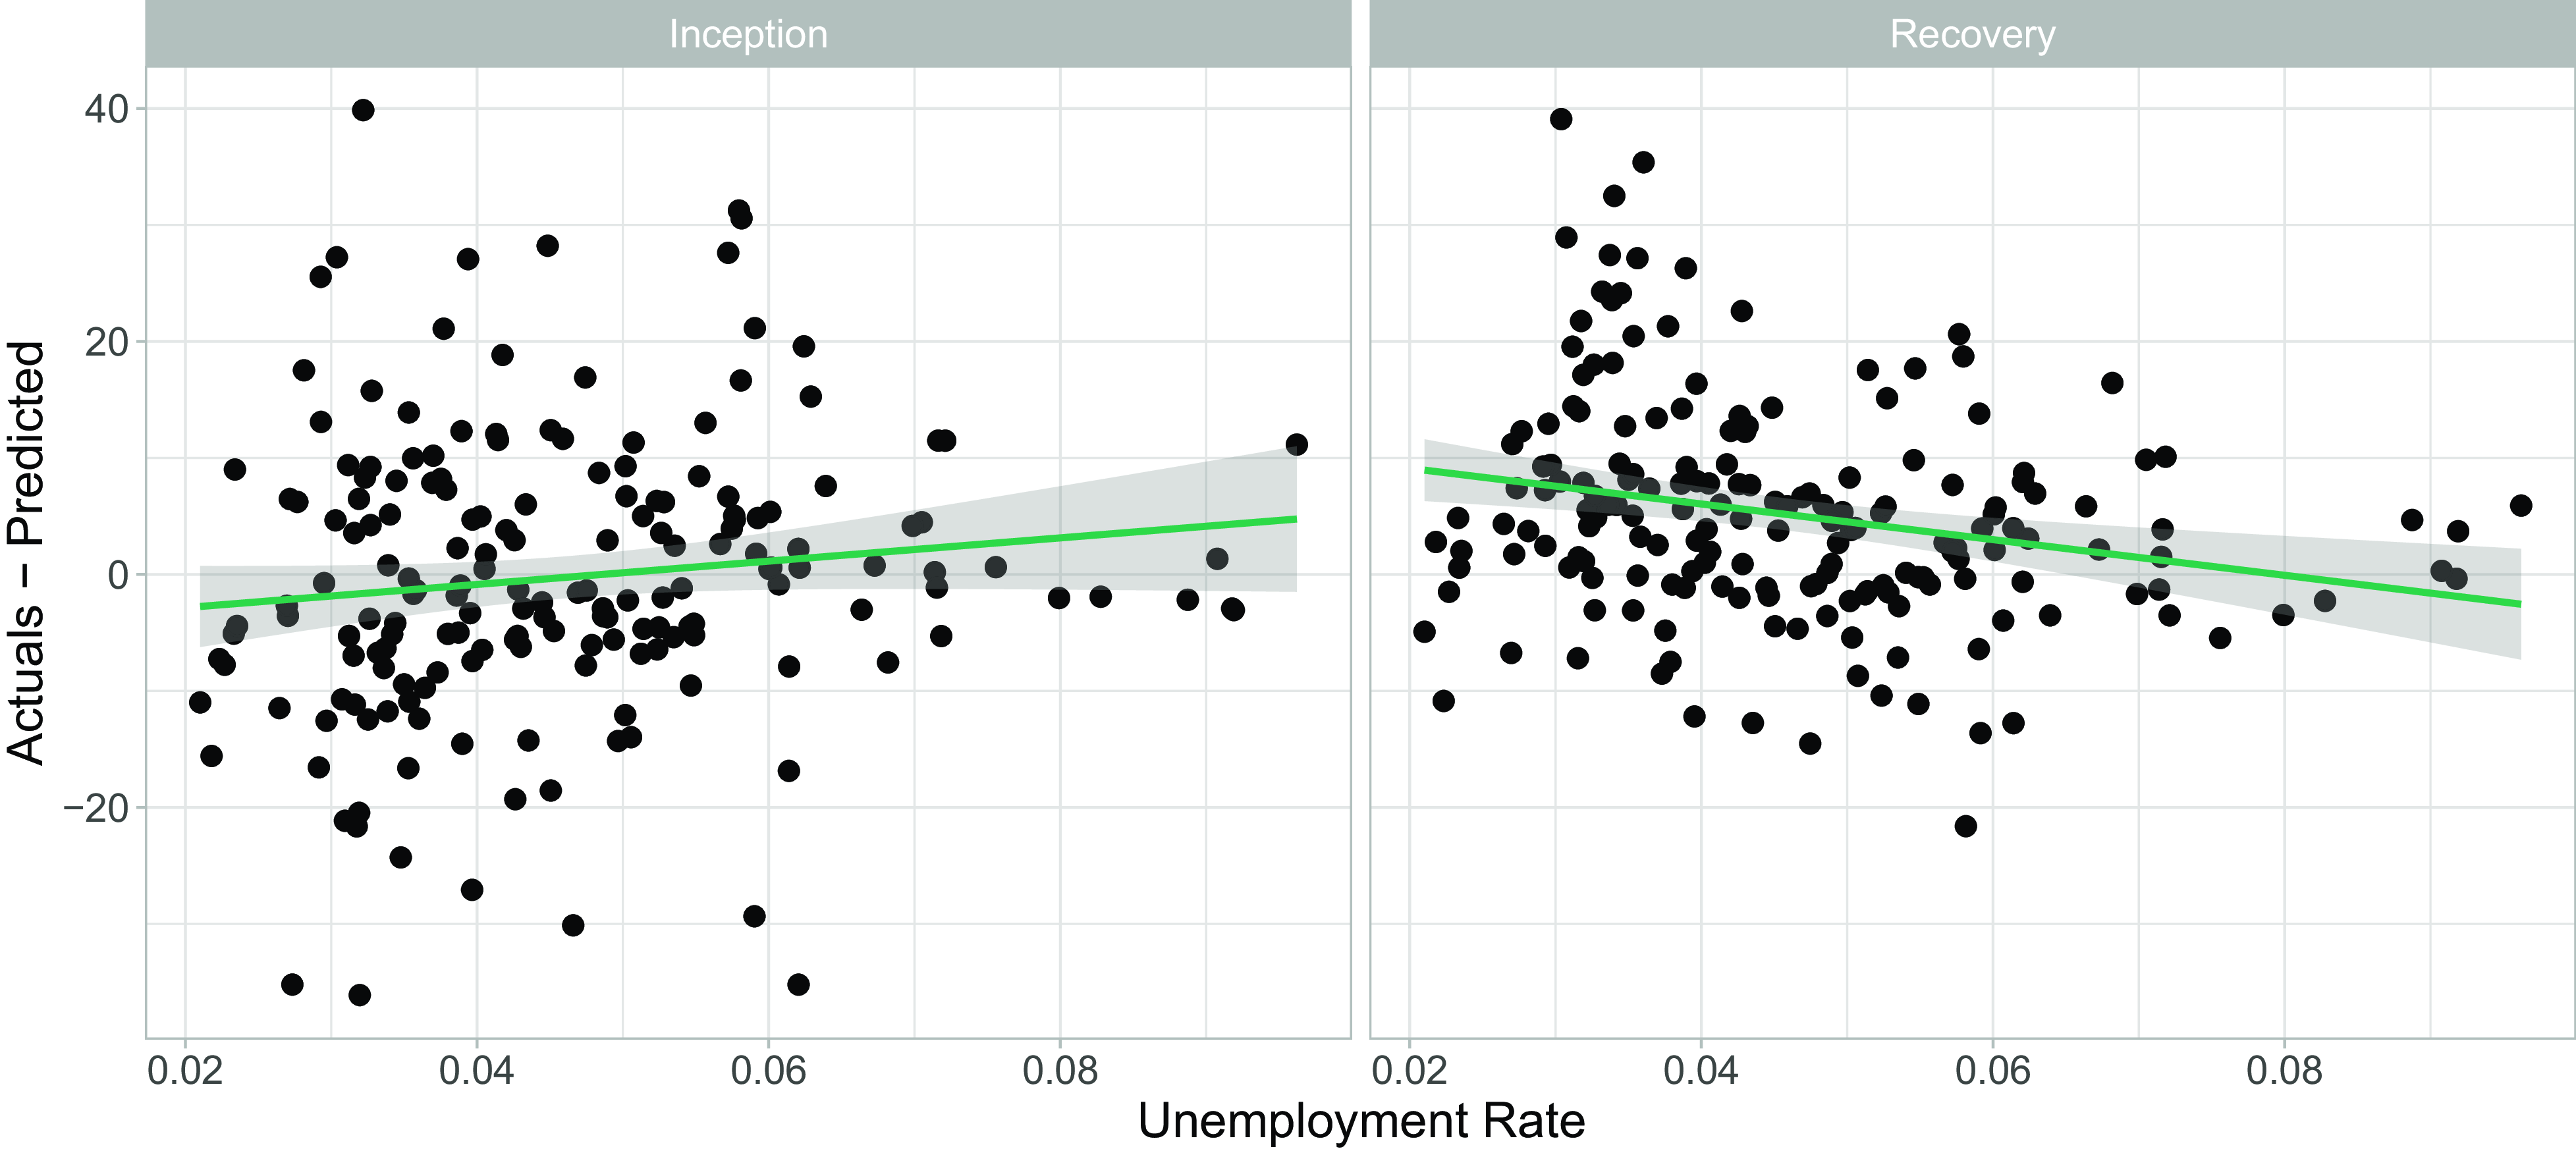
Figure 1 shows the relationship between the unemployment rate and the difference between observed claim numbers and those expected under the CMI model. We observe a clear counter-cyclical relationship (Khemka et al., Reference Khemka, Roberts and Higgins2017): when unemployment rises, more insurance policyholders than expected claim for DII payments, and fewer claimants than expected recover.
Illustration of the relationship between the unemployment rate and Continuous Mortality Investigation model residuals.
We build a regression model, where the response variable is $A-E$
and explanatory variables are economic indicators and a time covariate, to capture possible variations in overall claim inceptions and recoveries over time in the form of a time trend or as time-fixed effects.
$A-E$
and explanatory variables are economic indicators and a time covariate, to capture possible variations in overall claim inceptions and recoveries over time in the form of a time trend or as time-fixed effects.
When building the regression model, there are several decisions to make:
-
• Assumed distribution and transformation of the response variable $y$
: We found that the normal distribution is the best distribution for inceptions and recoveries, where distributional assumptions were fulfilled best when using
$y=\log (A/E)$
for claim inceptions and
$y=A/E$
for claim recoveries.
$y$
: We found that the normal distribution is the best distribution for inceptions and recoveries, where distributional assumptions were fulfilled best when using
$y=\log (A/E)$
for claim inceptions and
$y=A/E$
for claim recoveries. -
• Form of the covariates: Besides the default form of the economic indicators (level or index), we also allowed for the relative changes of economic indicators and for 1-year lagged versions of indicators to account for delayed effects of economic changes.
-
• Allowance for multicollinearity: Economic indicators are often correlated, making it inappropriate to include them in the same regression model. We choose economic indicators where the Pearson correlation coefficient is
$\lt$
0.4 in a given regression model.Footnote
2


As we use grouped data (by age), different observations have different underlying exposures. We estimate model parameters by using weighted linear regression, where the weights are inversely proportional to the associated exposure. We assume that the variance $\sigma ^2_i$
associated with data point
$\sigma ^2_i$
associated with data point $i$
is inversely proportional to its weight:
$i$
is inversely proportional to its weight:
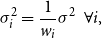 \begin{align*} \sigma ^2_i = \frac{1}{w_i} \sigma ^2 \ \ \forall i, \end{align*}
for some $\sigma ^2 \gt 0$
, where
$\sigma ^2 \gt 0$
, where
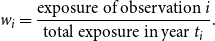 \begin{align*} w_i = \frac{\mathrm{exposure\ of\ observation}\ i}{\mathrm{total\ exposure\ in\ year}\ t_i}. \end{align*}
We construct a number of models with all possible forms of the response variable and combinations of the covariates. This resulted in 171 different models. We use the Bayesian Information Criterion (Burnham & Anderson, Reference Burnham and Anderson1998) to select the best model.
Inception model summary
* $p$
$p$ $\lt$
0.05, **
$\lt$
0.05, ** $p$
$p$ $\lt$
0.01, ***
$\lt$
0.01, *** $p$
$p$ $\lt$
0.001
$\lt$
0.001
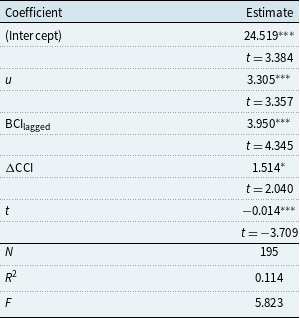
Table 1 shows the model summary of the claim inception model. $u$
is the UK unemployment rate grouped by age,
$u$
is the UK unemployment rate grouped by age, $\mathrm{BCI_{lagged}}$
is the Business Confidence Index of the previous year, and
$\mathrm{BCI_{lagged}}$
is the Business Confidence Index of the previous year, and $\Delta$
CCI is the relative change in the Consumer Confidence Index from the last year to the current year.
$\Delta$
CCI is the relative change in the Consumer Confidence Index from the last year to the current year. $t$
is a continuous time effect.
$t$
is a continuous time effect.
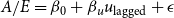
Final Inception Model. The statistical model we derived for claim inceptions is given below. The corresponding summary can be found in Table 1, where we display parameter estimates, corresponding coefficient $t$
-statistics, the
$t$
-statistics, the $F$
-statistic, the coefficient of determination
$F$
-statistic, the coefficient of determination $R^2$
, and the sample size
$R^2$
, and the sample size $N$
.
$N$
.
 \begin{align*} \log (A / E) = \beta _{0} + \beta _{u}u + \beta _{\mathrm{BCI}} \mathrm{BCI_{lagged}} + \beta _{\mathrm{CCI}} \Delta \mathrm{CCI} + \beta _{\mathrm{year}} t + \epsilon \end{align*}
We observe that the unemployment rate has a significant positive effect on the response variable. Rising rates of unemployment are associated with more claims from policyholders than expected for DII. We see that the predicted effect of a 1% increase in the unemployment rate leads to a 3.4% ( $\exp{(3.305\times 0.01)}-1=3.4\%$
) increase in expected claims inception. This is in accordance with our earlier discussion that in response to increasing unemployment, policyholders may make claims on their DII policies to forestall financial need.
$\exp{(3.305\times 0.01)}-1=3.4\%$
) increase in expected claims inception. This is in accordance with our earlier discussion that in response to increasing unemployment, policyholders may make claims on their DII policies to forestall financial need.
We also found, perhaps surprisingly, that the lagged Business Confidence Index has a significant positive influence on DII claim inceptions. To interpret this, suppose that last year, business confidence was high. Companies would likely have made large investments and employed more people. However, this year, a decrease in business confidence forces these employers to reduce their number of employees, so unemployment rises, leading to an increase in claims.
We observe a marginally significant positive effect of the relative change in the Consumer Confidence Index on expected DII claim inceptions. One interpretation of this is that an increasing Consumer Confidence Index may be associated with higher spending, leading to inflationary pressures in the economy (Bronfenbrenner & Holzman, Reference Bronfenbrenner and Holzman1963). The resulting central bank actions, namely increasing interest rates to cool down the economy, may lead to fear of job losses and higher associated claims under DII.
Finally, we found that DII claims tend to decrease over the years. This is consistent with Continuous Mortality Investigation (2019) in that insurance companies are reported to have tightened their claims management over time and improved their underwriting in general.
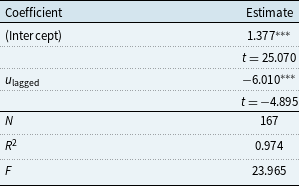
Final Recovery Model. The final statistical model for recoveries is given below. The corresponding summary can be found in Table 2.
 \begin{align*} A / E = \beta _{0} + \beta _{u}u_{\mathrm{lagged}} + \epsilon \end{align*}
We observe a highly significant negative effect of the lagged unemployment rate on claim recoveries. Decreases in the level of unemployment in the previous year are associated with increased rates of recovery. Our model predicts that a 1% increase (from 5% to 6%) in the unemployment rate is associated with a decrease in claim recoveries of 5.6% ( $\frac{1.377 - 6.010 \times 0.06}{1.377 - 6.010 \times 0.05} - 1 \approx -0.056$
).
$\frac{1.377 - 6.010 \times 0.06}{1.377 - 6.010 \times 0.05} - 1 \approx -0.056$
).
Recovery model summary
* $p$
$p$ $\lt$
0.05, **
$\lt$
0.05, ** $p$
$p$ $\lt$
0.01, ***
$\lt$
0.01, *** $p$
$p$ $\lt$
0.001
$\lt$
0.001
Table 2 shows the model summary of the recovery model. $u_{\mathrm{lagged}}$
is the age-grouped UK unemployment rate from last year.
$u_{\mathrm{lagged}}$
is the age-grouped UK unemployment rate from last year.
Overall, our inception and recovery models showed that rising unemployment (and thus economic risk) in the UK leads to an increase in new claims and a reduction of recoveries. Similar patterns were found with closely associated economic variables. Model assumptions were checked using standard diagnostics and were shown to hold.
3.2. Tracking of UK economic indicators
In the models outlined in the previous section, we identified the unemployment rate, the Business Confidence Index, and the Consumer Confidence Index as our economic indicators of interest. For our hedging strategy, we, therefore, want to replicate these quantities with an economic tracking portfolio. However, as explained later in Section 3.3, it is not necessary to provide tracking for the lagged Business Confidence Index. Only the unemployment rate and the Consumer Confidence Index are therefore tracked.
To build an economic tracking portfolio, we again perform regression analysis. As described in Section 2.2, we need a reasonable set of asset returns that broadly represent the financial market. Hence, following Lamont (Reference Lamont2001), we use index returns instead of single assets. To represent all of the main UK industries, we choose return indices in accordance with the FTSE Industry Classification Benchmark (see FTSE Russell, 2022) and complement it with an overall UK market index (FTSE All Share). For bond indices, we use UK Government bonds of different maturities (long: $\gt$
10 years, intermediate: 5–7 years, short: 1–3 years) and a low-grade (grade BBB) corporate bond. All data were downloaded from the Refinitiv workspace (Refinitiv, 2023). We use data from 1999 to 2016, which matches the period over which we have DII claims data. Details regarding the economic tracking portfolios are available from the authors upon request.
$\gt$
10 years, intermediate: 5–7 years, short: 1–3 years) and a low-grade (grade BBB) corporate bond. All data were downloaded from the Refinitiv workspace (Refinitiv, 2023). We use data from 1999 to 2016, which matches the period over which we have DII claims data. Details regarding the economic tracking portfolios are available from the authors upon request.
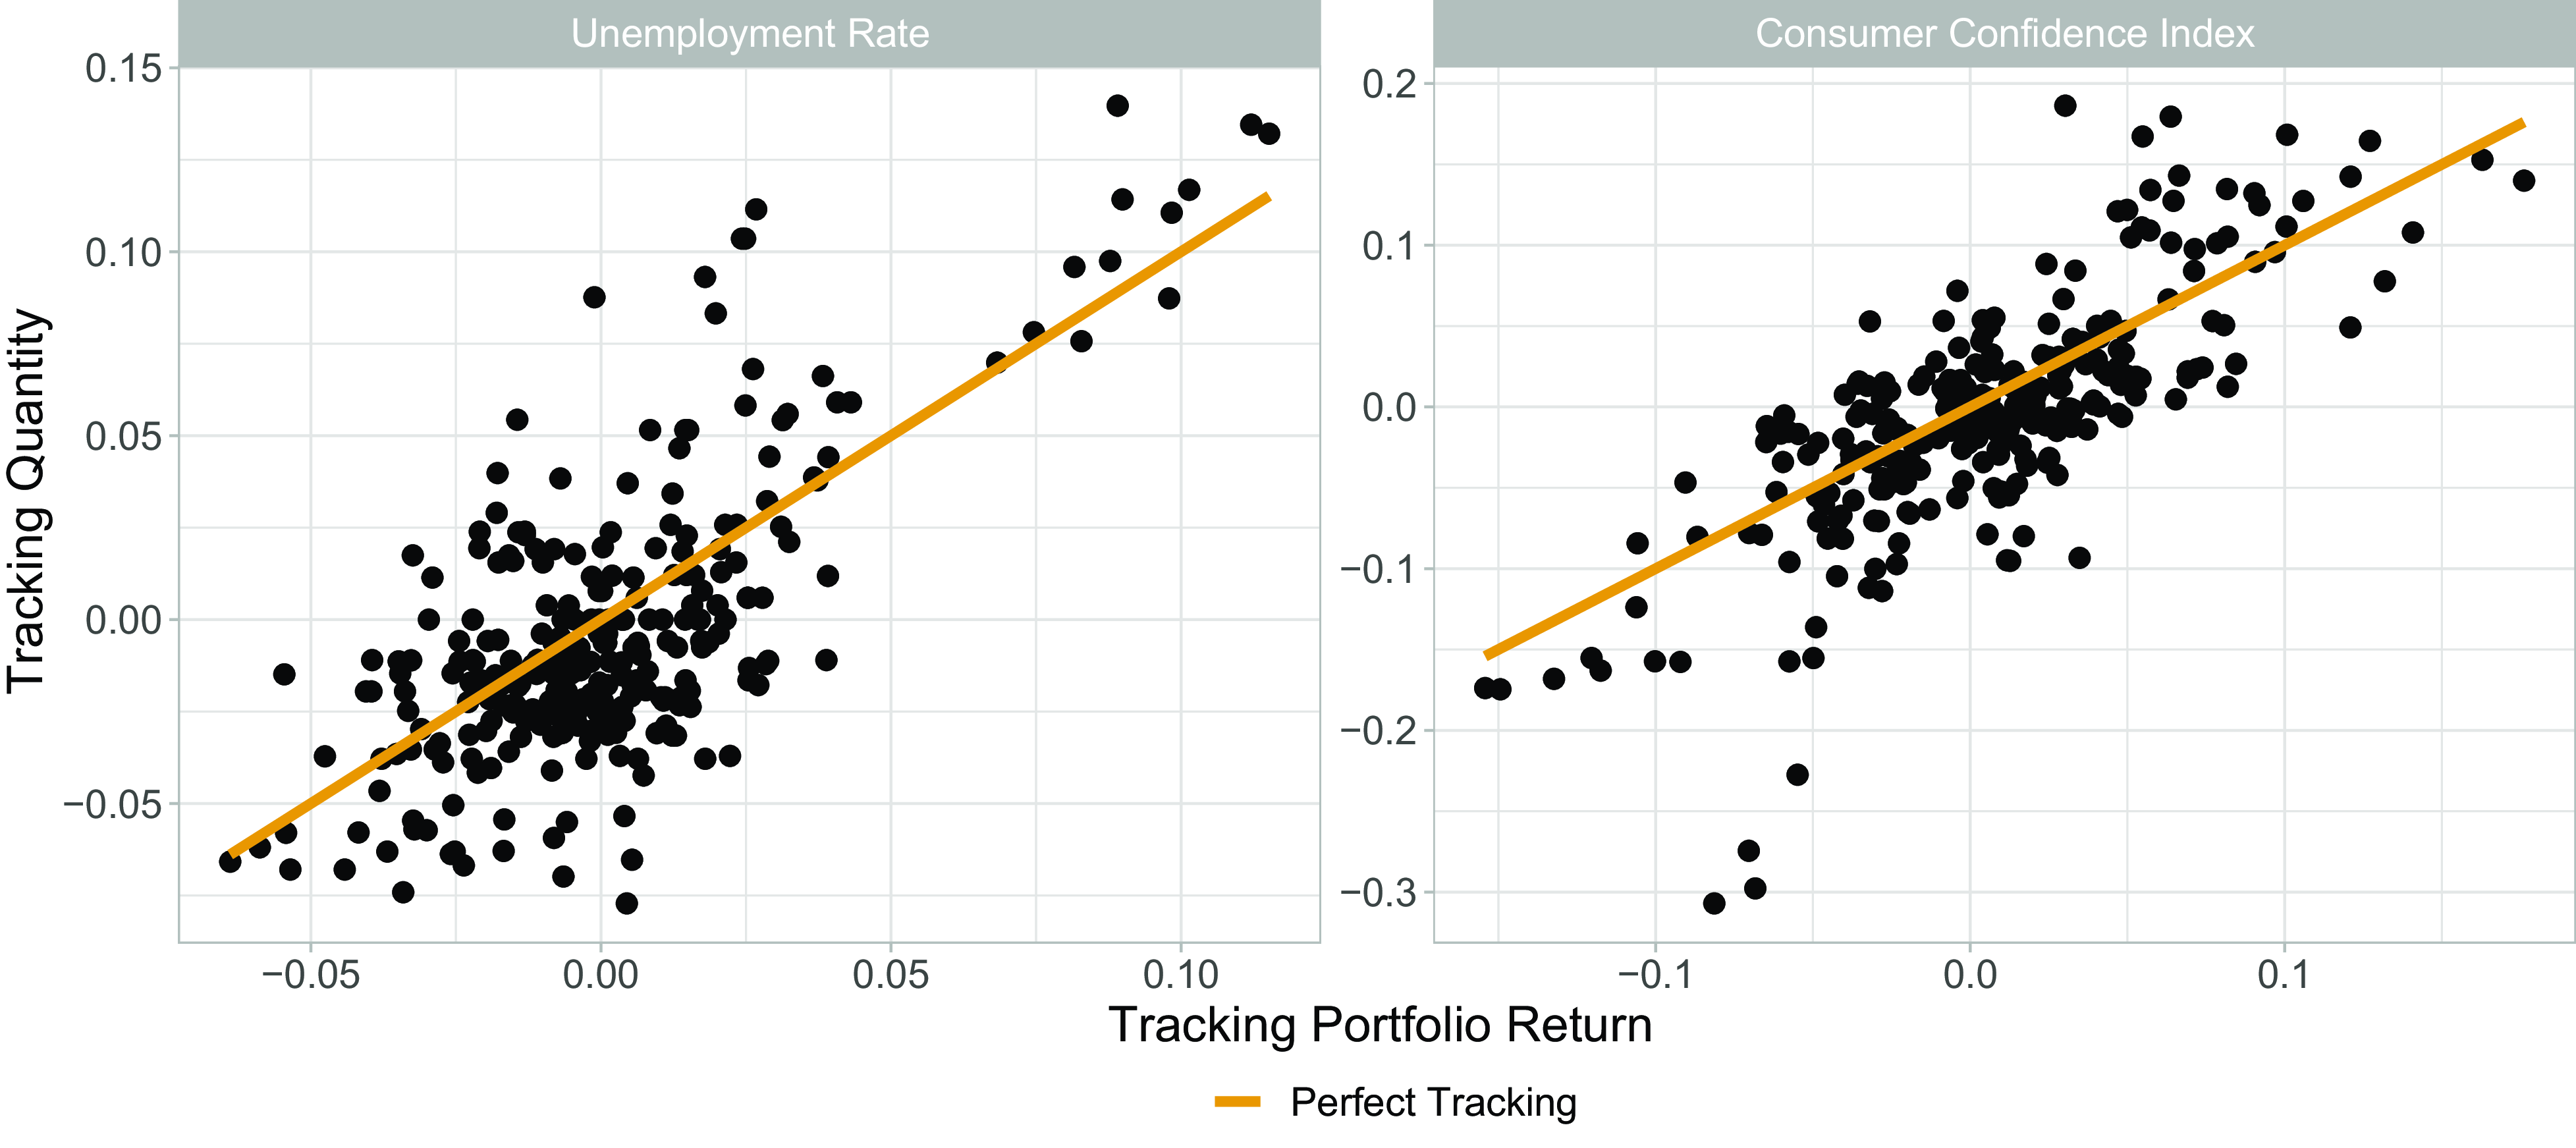
In Figure 2, we plot two of the economic variables on the vertical axis against the return on the tracking portfolio on the horizontal axis. A $45^{\circ }$
line passing through the origin is added to the plots to show the trajectory for perfect tracking. The
$45^{\circ }$
line passing through the origin is added to the plots to show the trajectory for perfect tracking. The $R^2$
values for the unemployment rate (left) and the Consumer Confidence Index (right) tracking are
$R^2$
values for the unemployment rate (left) and the Consumer Confidence Index (right) tracking are $65.4$
% and
$65.4$
% and $70.1$
%, respectively. These show that our chosen portfolios are able to track the underlying indicators relatively well.
$70.1$
%, respectively. These show that our chosen portfolios are able to track the underlying indicators relatively well.
Graphical check of the portfolio’s tracking ability via plotting the tracking quantity against the overall economic tracking portfolio return for the unemployment rate (left) and the Consumer Confidence Index (right). The superimposed lines indicate perfect tracking.
3.3. Computing the hedging portfolio
Next, we apply the theory developed in Section 2.3 to our setting, which involves computing an approximation for the tracking quantity $H$
in the form of Equation (2). We state our approximation results below and provide the full computation in Appendix B.
$H$
in the form of Equation (2). We state our approximation results below and provide the full computation in Appendix B.
For the weighted regression models found in Section 3.1, the hedging amount approximation according to Section 2.3 is:
 \begin{align*} H_t \approx C_{t-1} + a_{t-1}^{(1)}x_{t-1,t}^{(1)} + a_{t-1}^{(2)}x_{t-1,t}^{(2)}, \end{align*}
where $x^{(1)}$
and
$x^{(1)}$
and $x^{(2)}$
are the relative changes in the unemployment rate and the Consumer Confidence Index, respectively,
$x^{(2)}$
are the relative changes in the unemployment rate and the Consumer Confidence Index, respectively, $C_{t-1}$
is a risk-free investment quantity, and
$C_{t-1}$
is a risk-free investment quantity, and $a_{t-1}^{(1)},\ a_{t-1}^{(2)}$
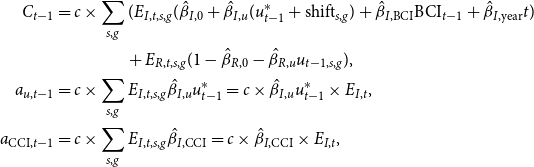
are the amounts invested in the corresponding tracking portfolios. The values of
$a_{t-1}^{(1)},\ a_{t-1}^{(2)}$
are the amounts invested in the corresponding tracking portfolios. The values of $C_{t-1},\ a_{t-1}^{(1)}$
, and
$C_{t-1},\ a_{t-1}^{(1)}$
, and $ a_{t-1}^{(2)}$
in our study are computed as:
$ a_{t-1}^{(2)}$
in our study are computed as:
 \begin{align*} C_{t-1} &= c \times \sum _{s,g}(E_{I,t,s,g}(\hat{\beta }_{I,0} + \hat{\beta }_{I,u}(u_{t-1}^* + \mathrm{shift}_{s,g}) + \hat{\beta }_{I,\mathrm{BCI}} \mathrm{BCI}_{t-1} + \hat{\beta }_{I,\mathrm{year}} t) \\ &\hspace{1.5cm} + E_{R,t,s,g}(1 - \hat{\beta }_{R,0} - \hat{\beta }_{R,u}u_{t-1,s,g}),\\ a_{u,t-1} &= c \times \hat{\beta }_{I,u} u_{t-1}^* \times E_{I,t},\\ a_{\mathrm{CCI},t-1} &= c \times \hat{\beta }_{I,\mathrm{CCI}} \times E_{I,t}, \end{align*}
where $c$
is the assumed cost per claim,
$c$
is the assumed cost per claim, $E$
are expected claim amounts, the indices
$E$
are expected claim amounts, the indices $I$
and
$I$
and $R$
represent inception and recovery, respectively, and the indices
$R$
represent inception and recovery, respectively, and the indices $s$
and
$s$
and $g$
stand for sex and age group, respectively. The
$g$
stand for sex and age group, respectively. The $\hat{\beta }$
are coefficient estimates from our economic tracking portfolios,
$\hat{\beta }$
are coefficient estimates from our economic tracking portfolios, $u^* +$
shift is an approximation for the age-grouped unemployment rate (see Appendix B for details), and BCI represents the Business Confidence Index.
$u^* +$
shift is an approximation for the age-grouped unemployment rate (see Appendix B for details), and BCI represents the Business Confidence Index.
The form of these quantities depends heavily on the underlying relationship as described by the regression models and the cost structure assumed for each claim. However, the process of deriving $H_t$
is not complicated and can be adapted to the specific situation of each insurance company. In Appendix B, we demonstrate how the derivation worked for our models and data, which can be used as an example of derivation for other situations.
$H_t$
is not complicated and can be adapted to the specific situation of each insurance company. In Appendix B, we demonstrate how the derivation worked for our models and data, which can be used as an example of derivation for other situations.
3.4. Illustration using a simulation study
In this section, we perform a forward-looking simulation study to illustrate the benefits of our proposed method. We show how incorporating a partial hedge for DII claims, using economic indicators and tracking portfolios for these indicators, can lead to a reduced amount of capital needed to support DII portfolios. To do so, we explore the effect of the hedging strategy on the loss reserve for DII portfolios. We consider the following three scenarios:
-
1. Baseline approach: Reserves are based on expected claims according to demographic factors only.
-
2. Economic approach: Reserves are based on our proposed hedging strategy, which considers economic effects and invests in economic tracking portfolios accordingly.
-
3. Perfect Tracking approach: Same as the economic approach, but assuming a perfect tracking performance of our economic tracking portfolios.
The purpose of the comparison between the Perfect Tracking and the Economic approaches is to shed light on the impact of tracking errors on loss reserving.
In order to perform the comparison under the three approaches, we simulate inceptions and recoveries and then calculate the resulting liabilities, as discussed in Section 2.3, using
 \begin{align*} L_t = L_{t-1} + c \times (A_{I,t} - A_{R,t}). \end{align*}
For each year $t \in {2017,\dots, 2021}$
,Footnote
3
we simulate
$t \in {2017,\dots, 2021}$
,Footnote
3
we simulate $m=1,\dots, $
10,000 different inception and recovery values,
$m=1,\dots, $
10,000 different inception and recovery values, $A_{I,t,m}$
and
$A_{I,t,m}$
and $A_{R,t,m}$
, respectively, and use them to compute 10,000 loss values
$A_{R,t,m}$
, respectively, and use them to compute 10,000 loss values $L_{t,m}$
. The simulated values follow the weighted regression models found in Section 3.1, based on the real economic indicator values in these years. Details of the simulation algorithm employed are provided in Appendix C.
$L_{t,m}$
. The simulated values follow the weighted regression models found in Section 3.1, based on the real economic indicator values in these years. Details of the simulation algorithm employed are provided in Appendix C.
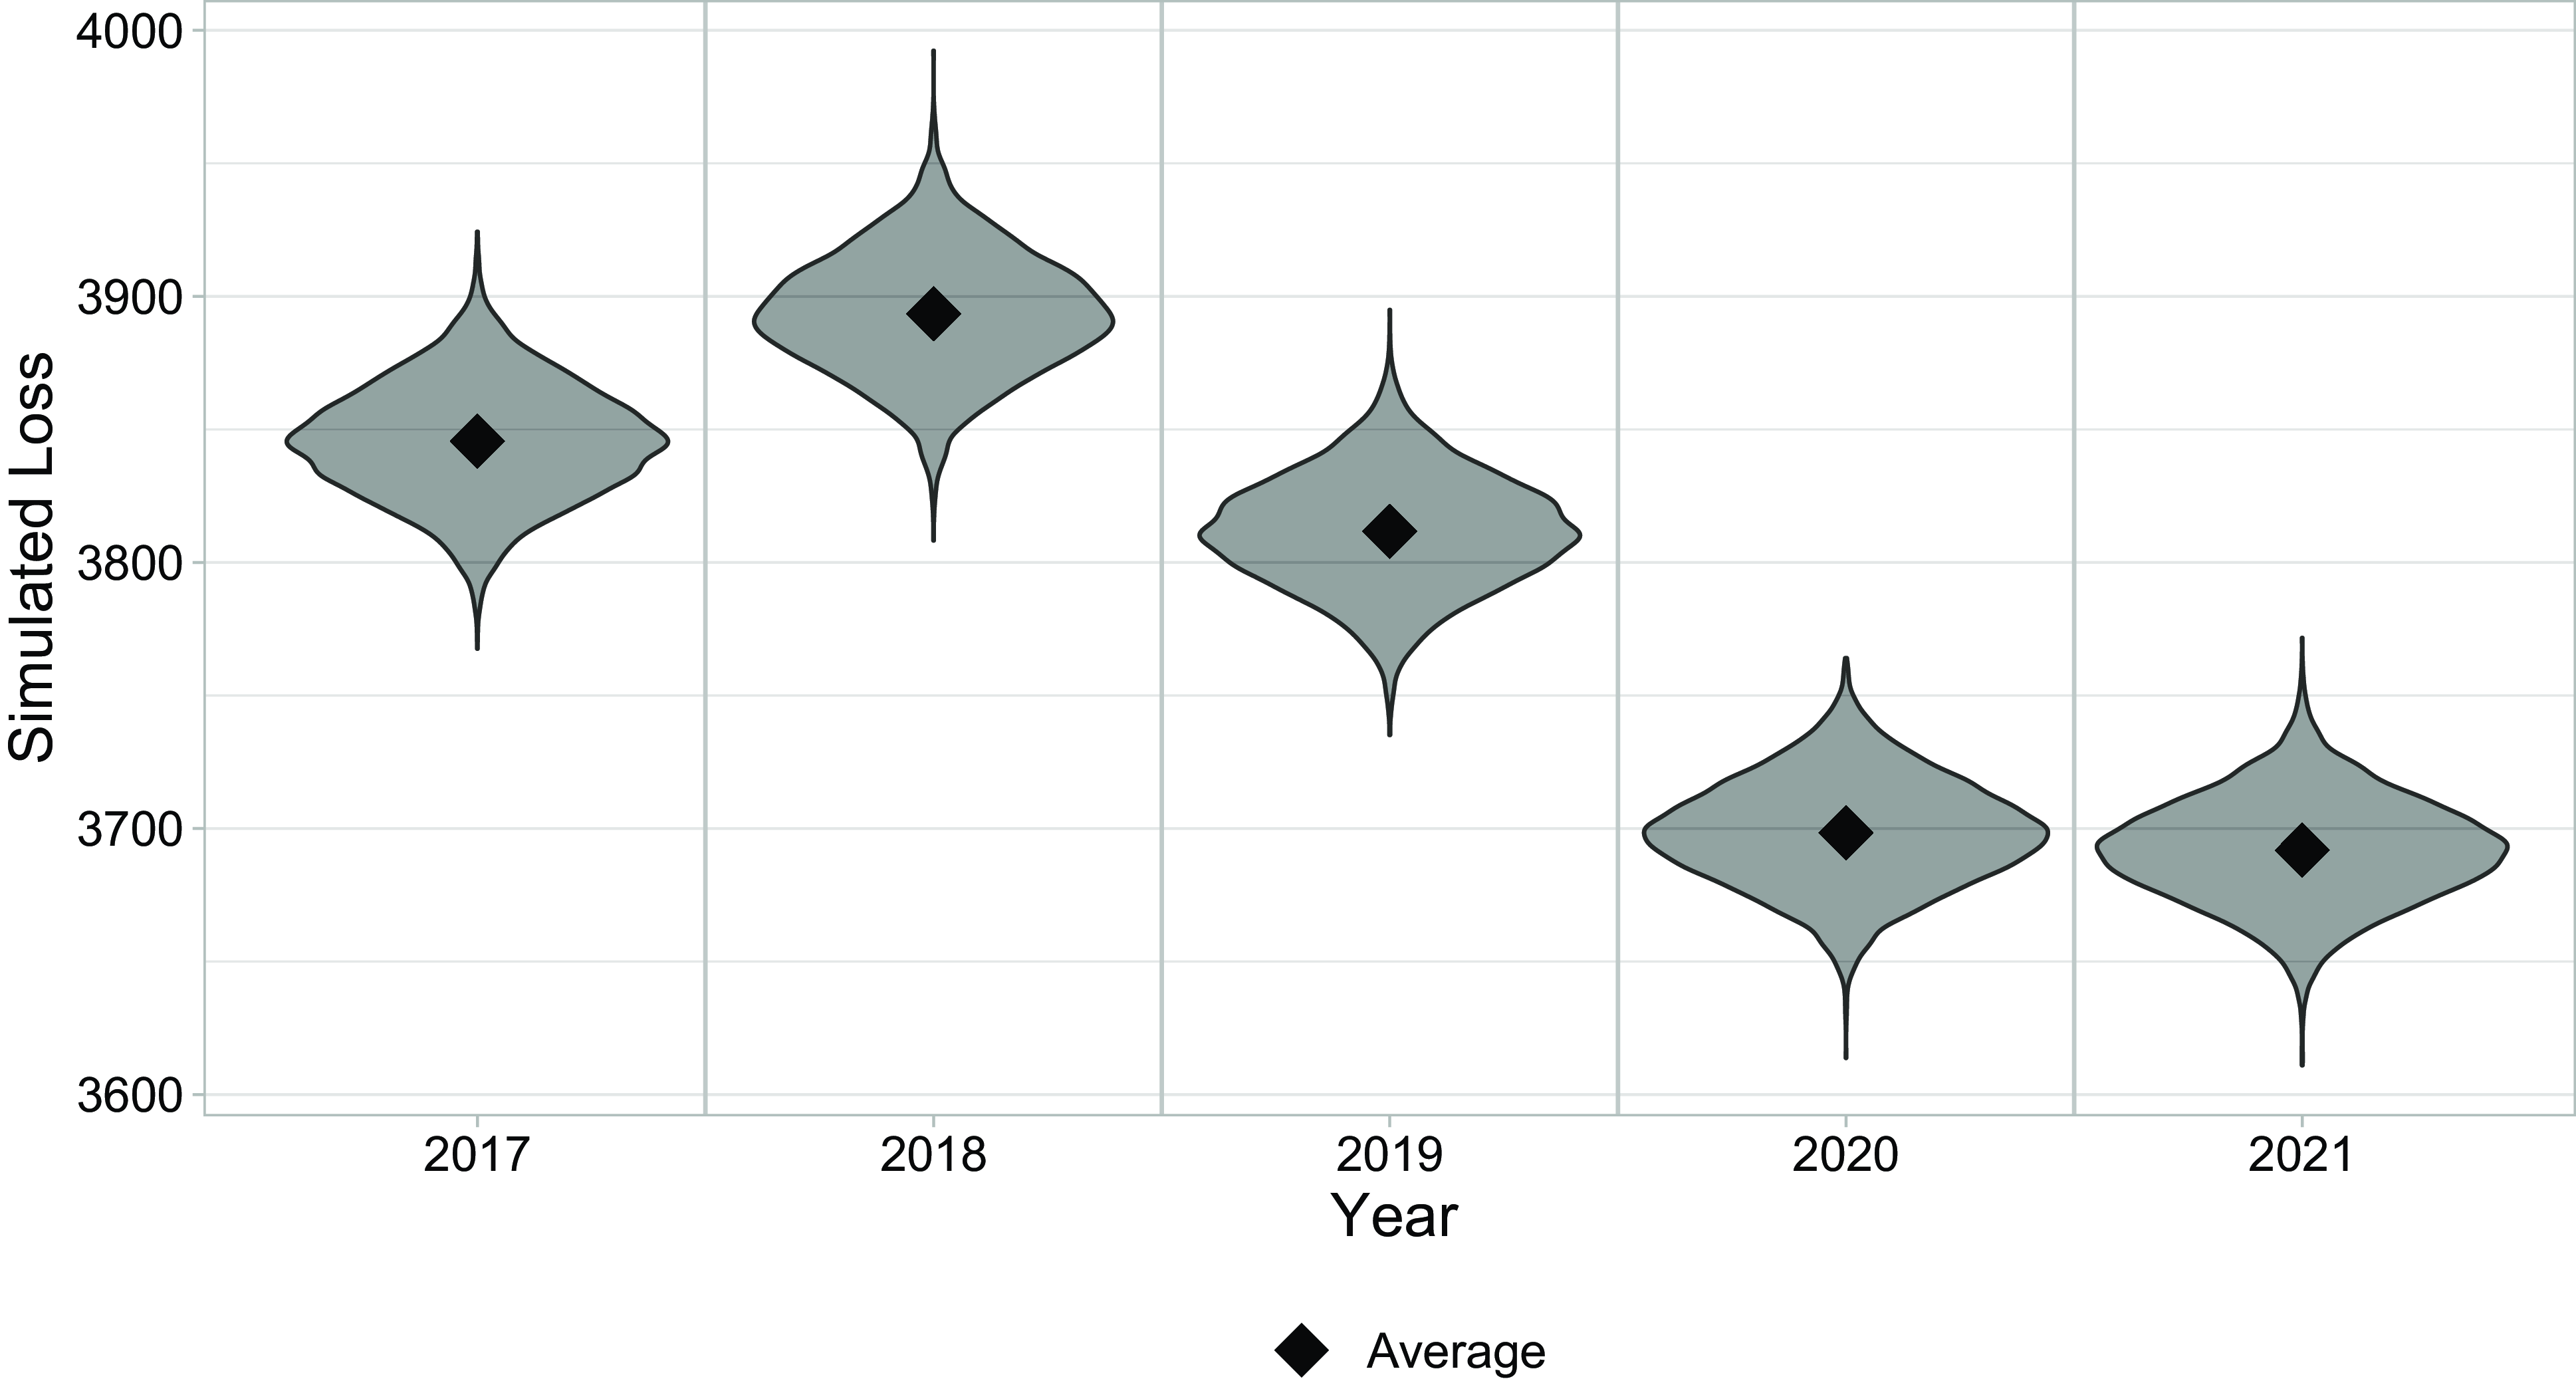
In Figure 3, we present the simulated loss values over the years $t = 2017,\dots, 2021$
. The diagram shows the distribution per year over the 10,000 simulations, and the diamond marks the average loss per year.
$t = 2017,\dots, 2021$
. The diagram shows the distribution per year over the 10,000 simulations, and the diamond marks the average loss per year.
Simulated loss values $L_{t,m},\ t = 2017,\dots, 2021,\ m = 1,\dots, $
10,000. The violin shape indicates the distribution per year over the 10,000 simulations, and the diamond shape marks the average loss per year.
$L_{t,m},\ t = 2017,\dots, 2021,\ m = 1,\dots, $
10,000. The violin shape indicates the distribution per year over the 10,000 simulations, and the diamond shape marks the average loss per year.
Next, we consider the loss reserve held by an insurance company, where we use the 99% Tail Value at Risk $\mathrm{TVaR}_{0.999}[L]$
, which is a typical choice for a loss reserve fulfilling regulatory standards. To compute the reserve, we first estimate the excess loss distribution as:
$\mathrm{TVaR}_{0.999}[L]$
, which is a typical choice for a loss reserve fulfilling regulatory standards. To compute the reserve, we first estimate the excess loss distribution as:
 \begin{equation*} \tilde {L} \,:\!=\, L - \mathcal {E}_L\ |\ L \gt \mathcal {E}_L, \end{equation*}
where $\mathcal{E}_L$
denotes the expected loss, which differs in the three approaches we are considering. Then, noting that the distribution of our simulated losses is approximately symmetric (see Fig. 3), we can estimate
$\mathcal{E}_L$
denotes the expected loss, which differs in the three approaches we are considering. Then, noting that the distribution of our simulated losses is approximately symmetric (see Fig. 3), we can estimate $\mathrm{TVaR}_{0.999}[L]$
as
$\mathrm{TVaR}_{0.999}[L]$
as
 \begin{align*} \mathrm{TVaR}_{0.999}[L] \approx \mathcal{E}_L + \mathrm{TVaR}_{0.998}[\tilde{L}]. \end{align*}
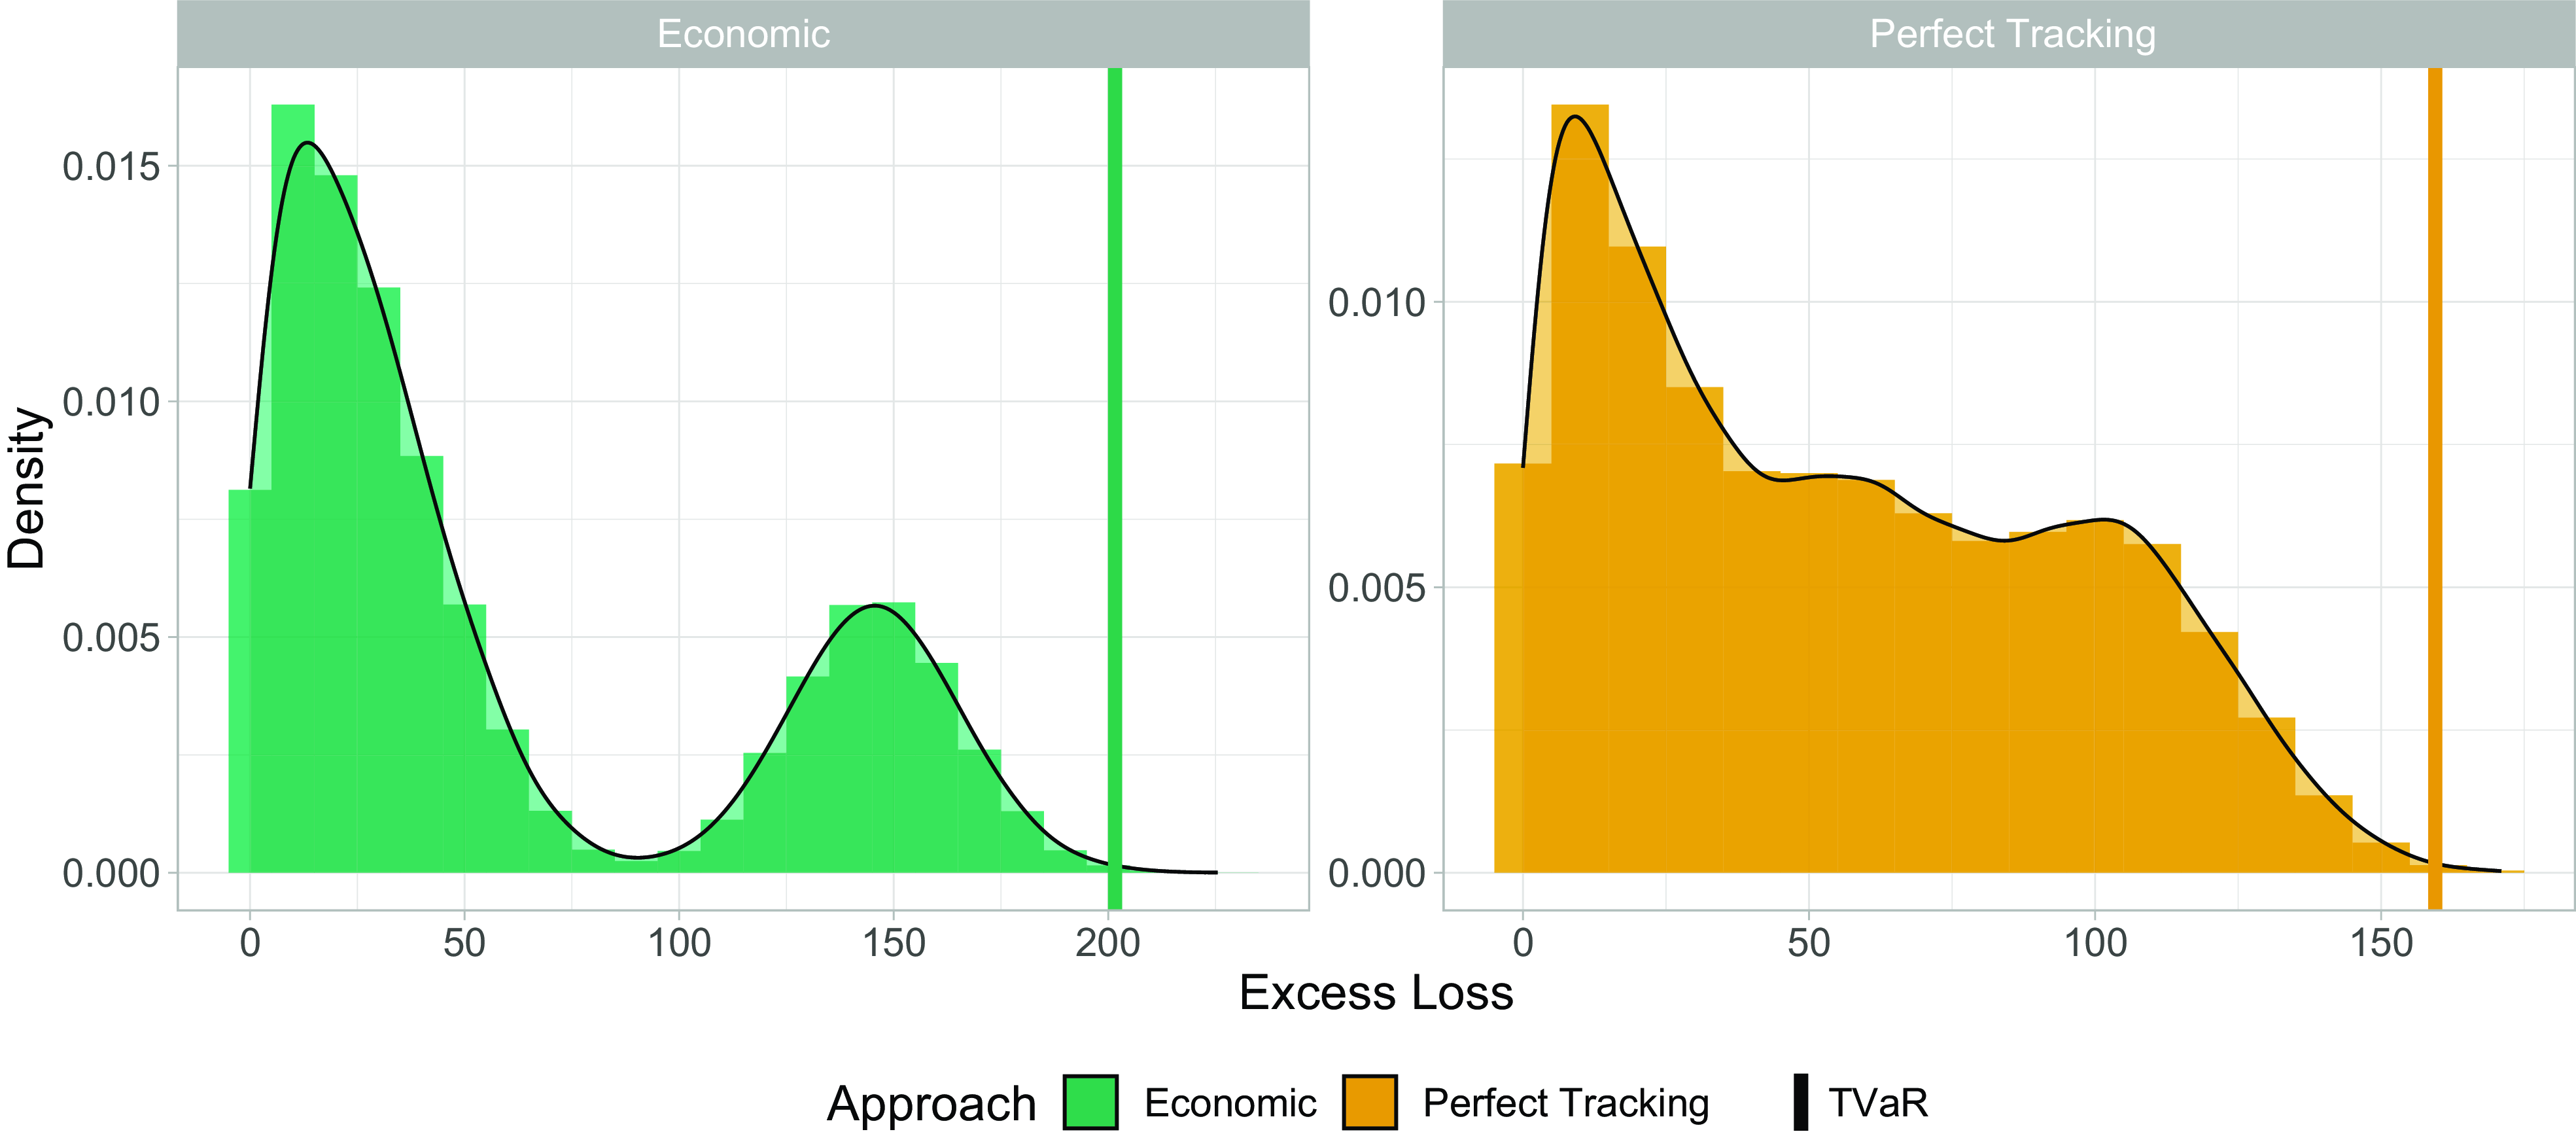
Comparison of the Economic (left) and Perfect Tracking (right) excess loss distributions. The vertical line indicates the corresponding 99.8% TVaR.
Now, we first look at the effect of hedging on the reserve under the three approaches. We found that for our data, in the Baseline approach, none of the simulated loss values $L_{t,m}$
exceeds its expected loss,
$L_{t,m}$
exceeds its expected loss, $\mathcal{E}_t^{\mathrm{Baseline}}$
, and hence,
$\mathcal{E}_t^{\mathrm{Baseline}}$
, and hence,
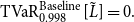 \begin{align*} \mathrm{TVaR}_{0.998}^{\mathrm{Baseline}}[\tilde{L}] = 0. \end{align*}
Excess loss, however, exists in the Economic and Perfect Tracking approach, and we show their empirical distributions in Fig. 4. In addition, we highlight the quantity $\mathrm{TVaR}_{0.998}[\tilde{L}]$
by means of a vertical line. Comparing the horizontal axes in Fig. 4, we observe that tracking error leads to a higher loss relative to perfect tracking, as expected. In addition, by computing the sample standard deviation in both approaches, we have:
$\mathrm{TVaR}_{0.998}[\tilde{L}]$
by means of a vertical line. Comparing the horizontal axes in Fig. 4, we observe that tracking error leads to a higher loss relative to perfect tracking, as expected. In addition, by computing the sample standard deviation in both approaches, we have:
 \begin{align*} \hat{\sigma }_{\tilde{L}^{\mathrm{Economic}}} &\approx 57.520,\\ \hat{\sigma }_{\tilde{L}^{\mathrm{Perfect\ Tracking}}} &\approx 39.994, \end{align*}
which indicates that tracking errors can result in higher loss variability. This is also reflected in the higher TVaR at 99.8%, as:
 \begin{align*} \mathrm{TVaR}_{0.998}^{\mathrm{Economic}}[\tilde{L}] &\approx 201.587,\\ \mathrm{TVaR}_{0.998}^{\mathrm{Perfect\ Tracking}}[\tilde{L}] &\approx 159.449. \end{align*}
Although tracking error hardly affects expected loss $\mathcal{E}$
compared to perfect tracking, it does affect the excess loss distributions.
$\mathcal{E}$
compared to perfect tracking, it does affect the excess loss distributions.
Next, we estimate the desired overall reserve $\mathrm{TVaR}_{0.999}$
by adding up
$\mathrm{TVaR}_{0.999}$
by adding up $\mathcal{E}$
and
$\mathcal{E}$
and $\mathrm{TVaR}_{0.998}[\tilde{L}]$
. We show the overall reserve over the five years in Figure 5, together with the average reserve in each approach.
$\mathrm{TVaR}_{0.998}[\tilde{L}]$
. We show the overall reserve over the five years in Figure 5, together with the average reserve in each approach.
Overall loss reserves in the Baseline, Economic, and Perfect Tracking approach for 2017 to 2021. Average reserves are indicated with dashed lines.
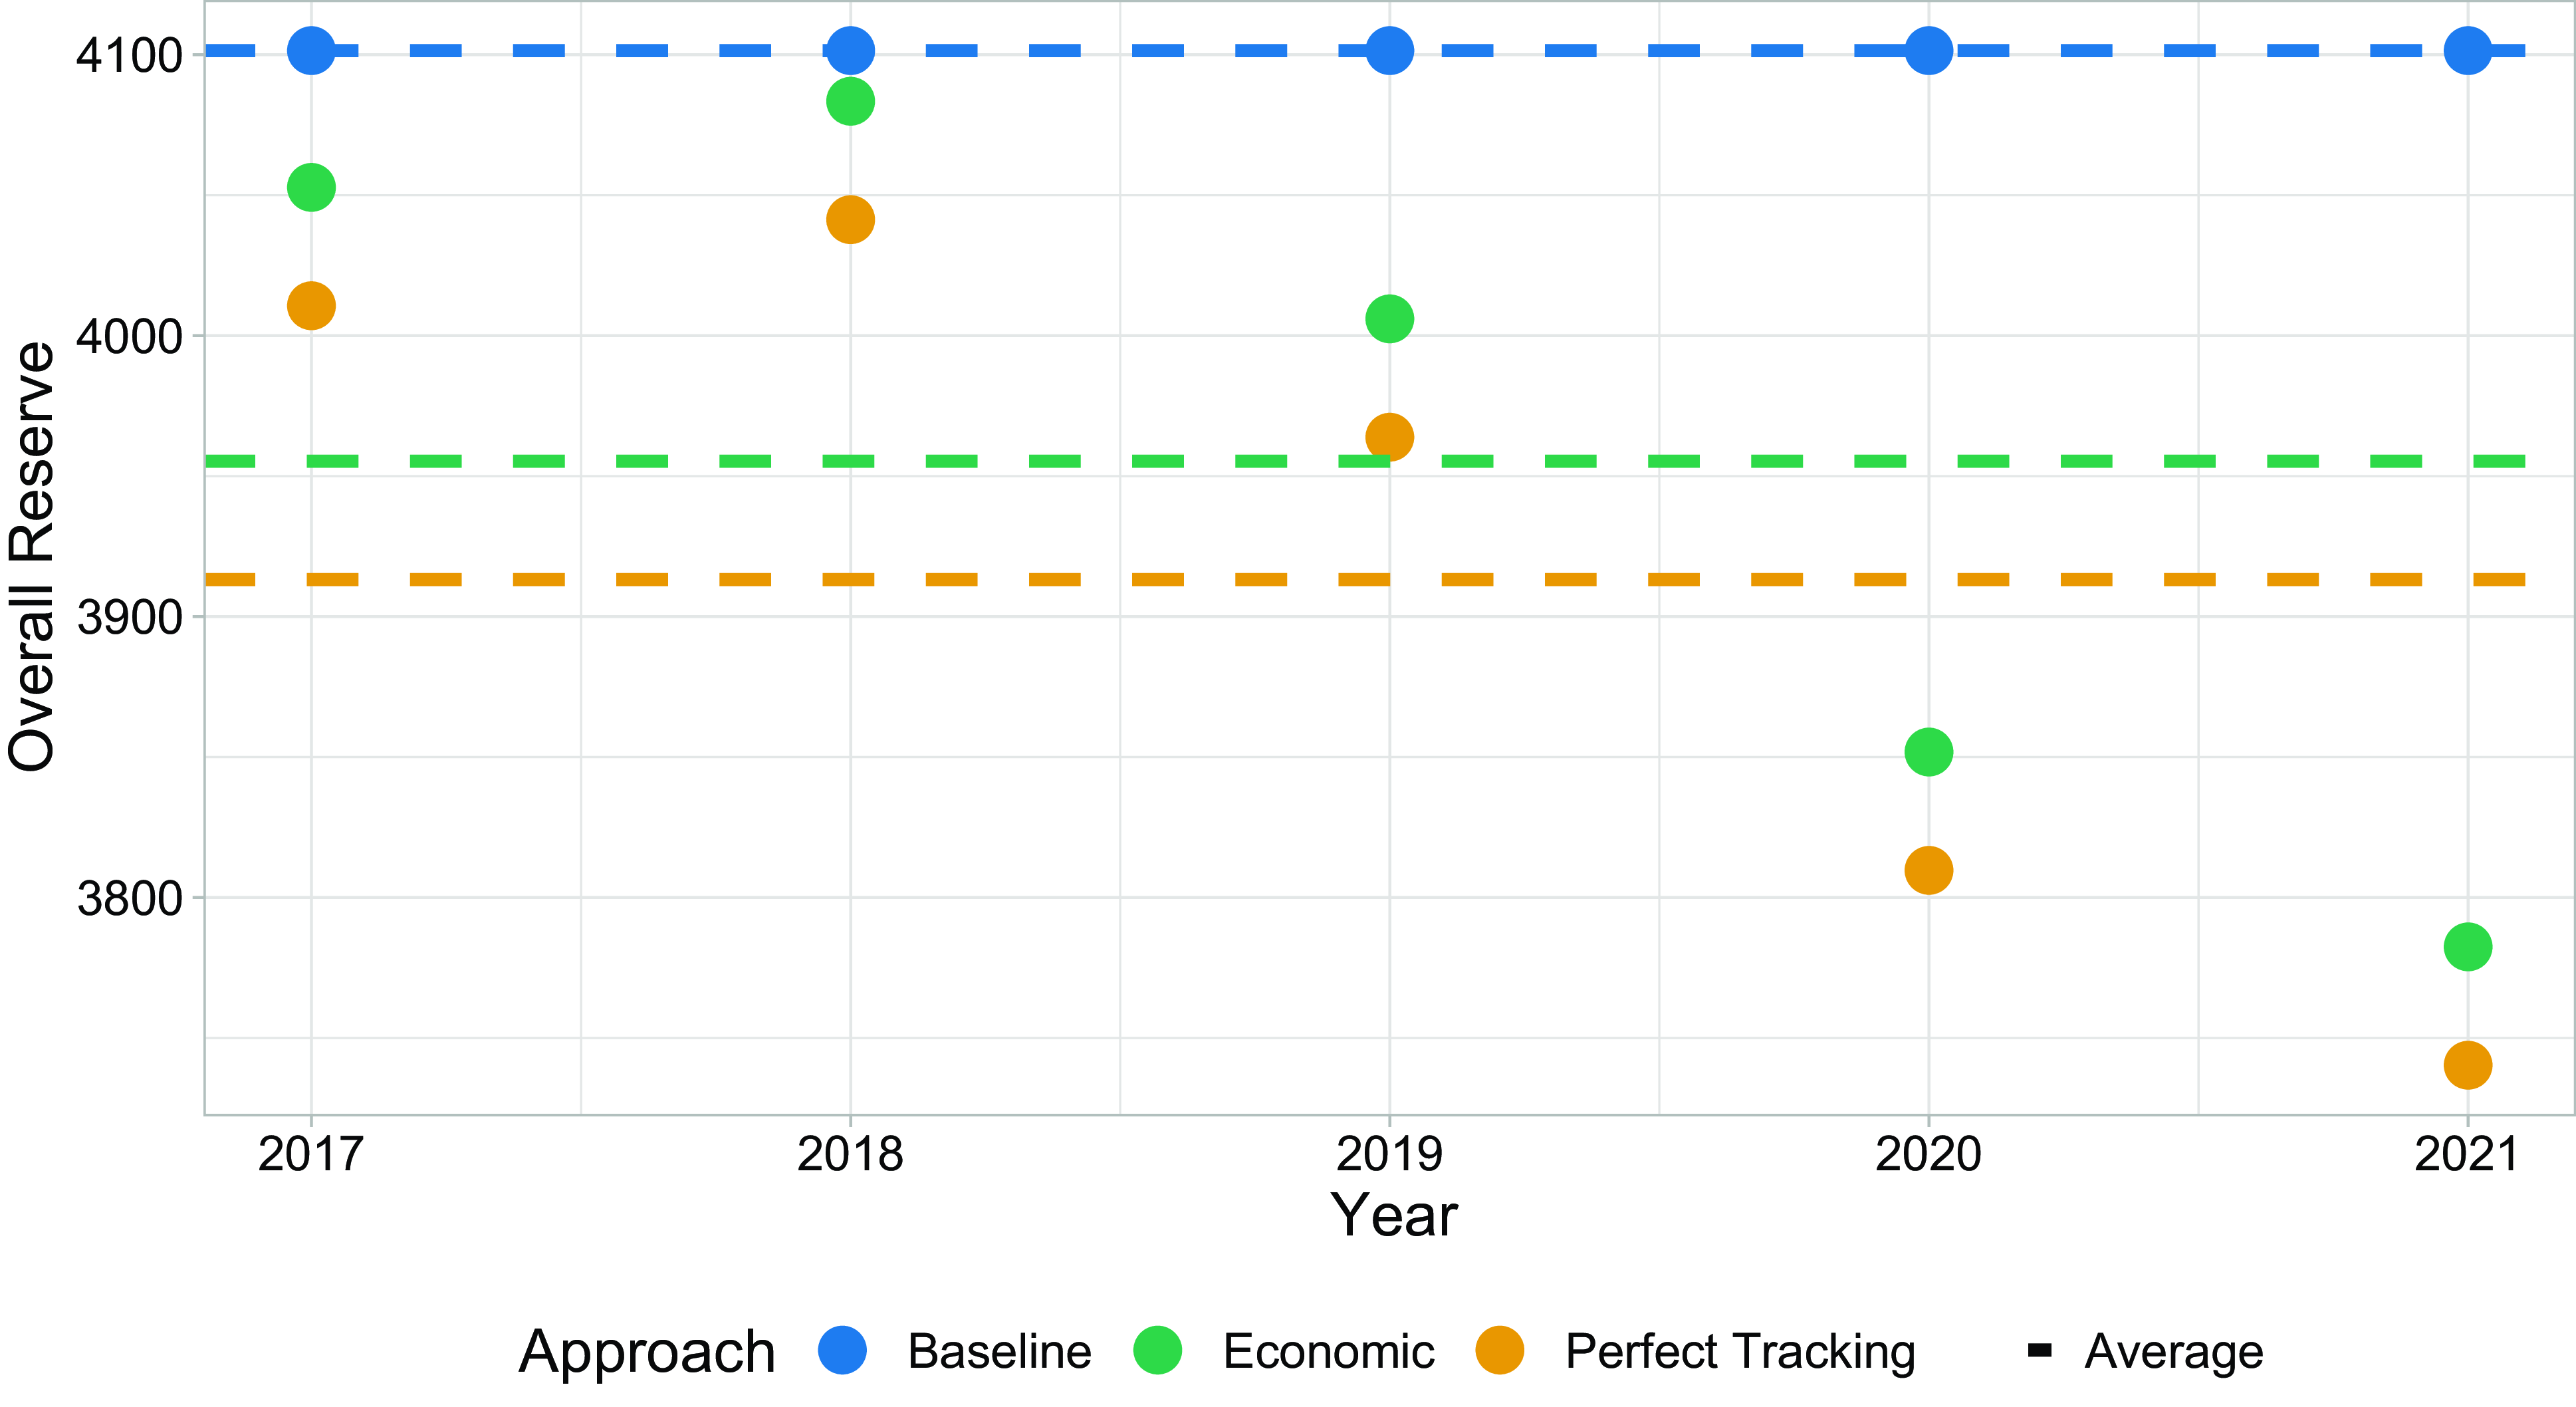
Under the Baseline approach, the reserve is the same for each year, as expected, since it is not affected by economic changes, and hence, $\mathcal{E}_t^{\mathrm{Baseline}}$
is constant through time. Due to over-reserving in the Baseline approach, no excess loss reserve is required. As
$\mathcal{E}_t^{\mathrm{Baseline}}$
is constant through time. Due to over-reserving in the Baseline approach, no excess loss reserve is required. As $\mathcal{E}_t$
in the Economic and Perfect Tracking approach reflects changing economic conditions, it changes over time, and consequently, the overall reserve varies from year to year. Even in years where the highest amount had to be held back (2017 and 2018), the overall reserve was below the reserve under the baseline approach. The average reserves are:
$\mathcal{E}_t$
in the Economic and Perfect Tracking approach reflects changing economic conditions, it changes over time, and consequently, the overall reserve varies from year to year. Even in years where the highest amount had to be held back (2017 and 2018), the overall reserve was below the reserve under the baseline approach. The average reserves are:
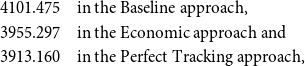 \begin{align*} 4101.475\ \ \ \ &\text{in the Baseline approach},\\ 3955.297\ \ \ \ &\text{in the Economic approach and}\\ 3913.160\ \ \ \ &\text{in the Perfect Tracking approach}, \end{align*}
On average, the Economic approach reduces the overall reserve by 3.6%, and for Perfect Tracking, we have an even higher reduction of 4.6%. In addition, it is interesting to note that tracking errors do not have a substantial negative impact on the overall reserve.
In summary, our simulation study provides insight into the potential benefit of the proposed hedging strategy. Incorporating economic developments in decision-making ensures greater flexibility in reserving, which ideally improves the accuracy of expected loss and reduces overall loss reserves. However, we note that the simulation and the Economic approach are based on the same distribution, and therefore, the simulation study can only be seen to provide a demonstration of the potential benefits of our hedging strategy. Verification of improvement attributed to the Economic approach in a real-world setting would require further evaluation of real data.
4. Conclusion and future research
In this paper, we propose a three-step process to hedge economic risk inherent in DII portfolios. By applying this methodology to the UK data, we show that our hedging strategy allows for flexible and accurate reserving, leading to a reduction in the insurance company’s loss reserve required for a given probability of adequacy. Furthermore, our study provides practical insights for insurance companies and guidance for implementation.
The study is not without its limitations. To fully validate the hedging strategy, the approach must be carried out on real loss data, which can be investigated in future research. Due to information and data availability, computations in this paper were performed using some necessary simplifying assumptions. We would like to analyze more complex cost structures and loss reserves further in future research. We also note that the effect of economic conditions on DII claim experience also has implications for DII pricing, which is another relevant research topic for the future.
As a future outlook, we want to shed light on further potential implications of our proposed methodology. First, hedging economic risk may influence DII pricing. Reduced capital requirements increase profitability, which may lead to lowered premiums, particularly if the market is competitive. Second, increased profitability may lead to better coverage of the population, for example, DII policies may be provided for jobs that may not have been covered before. Lastly, we highlight that the steps carried out in our work can also be applied to other lines of insurance business. The methodology developed and applied in this paper can be used whenever a source of economic risk can be identified, quantified, and partially hedged using economic indicators. The actuarial analysis presented in this paper can help to manage insurance risks that are heightened in times of economic hardship using an innovative asset-liability modeling framework.
Data availability statement
The data used in this paper are provided by the UK CMI. The CMI has, for research purposes, kindly provided their data and the accompanying working papers that outline all the data collection and modeling methods. The data are proprietary and cannot be published alongside the paper.
While, an investigation over a longer time horizon, covering more recent events, particularly those relating to COVID-19 and the subsequent economic turmoil, would have been beneficial but was not feasible due to data unavailability from the CMI at the time of writing.
We also test thresholds of 0.5 (Booth et al., Reference Booth, Niccolucci and Schuster1994), but the final models do not change.
Note, our actual data span 2004–2016, so our study addresses a simulated, forward-looking horizon.
Funding statement
No funding was received for this project.
Competing interests
None
A. Details on UK Data
In this section, we introduce further characteristics of our UK data, which, for the sake of brevity, are omitted in Section 3.1. The UK data from CMI is split into two data sets, one for claim inceptions and one for recoveries. We state the available categories below.
-
• The data are provided yearly from 2003 to 2016. We use data from 2004 in this paper since sex and age-grouped UK unemployment data were only available from 2004.
-
• Data are provided for males and females separately.
-
• Age ranges from 17 to 65 in the inception data and from 18 to 69, supplemented with the category “70+” for recoveries. We use data from age 25 to 64, as outside of this range, only little data were available. In the recovery case, we exclude ages from 60 onward.
-
• Occupation is given in five categories defined below, where we state the identical specification as in Continuous Mortality Investigation (2019):
OC1 Professional, managerial, executive, administrative, and clerical classes not engaged in manual labor.
OC2 Master craftsmen and tradesmen engaged in management and supervision; skilled operatives engaged in light manual work in non-hazardous occupations.
OC3 Skilled operatives engaged in manual work in non-hazardous occupations.
OC4 Skilled and semi-skilled operatives engaged in heavy manual work or subject to special hazards.
OC5 Other.
-
• DP is given weekly for weeks 1, 4, 13, 26 and 52. We exclude 1-week data, as only little data is available for this category.
-
• The recovery data set is additionally grouped by sickness duration, which is given in unit days from 7 to 119 days, weeks from 18 to 64 weeks, four-week blocks from 65-68 weeks to 153-156 weeks, years from 4 years to 10 years and the rest is stored as “>11 years”.
The main quantities of interest are Exposure, Actuals, and Expected. A brief explanation is as follows:
-
• Exposure: the number of active policies exposed to a change of policy status. For inception exposure, this value refers to all policies at risk of making a claim, while for recovery exposure, it refers to the number of people currently receiving DII payments and potentially able to recover.
-
• Actuals: the number of inceptions or recoveries, denoted by
$A_I$
or
$A_R$
, respectively. -
• Expected: the expected number of inceptions
$E_I$
or recoveries
$E_R$
. These are based on the CMI IP graduation tables (explained below) and provide the number of inceptions or recoveries that an insurance company would expect for a given policyholder group.


The “expected” rate of claim inceptions and recoveries per unit of exposure is calculated by the CMI (see Continuous Mortality Investigation, 2020 and 2000). These rates are estimated using Poisson generalized linear models, which allow for the effect of all characteristics listed above. Given the expected rates, we can calculate the Expected $E_I$
and
$E_I$
and $E_R$
by multiplying the exposure in a particular class of policyholders with the corresponding rate. This enables us to prepare the data for our weighted regression models. The final structure of the UK data that we used for modeling is shown in Table A.1.
$E_R$
by multiplying the exposure in a particular class of policyholders with the corresponding rate. This enables us to prepare the data for our weighted regression models. The final structure of the UK data that we used for modeling is shown in Table A.1.
Continuous Mortality Investigation inception data structure prepared for modeling (illustrative)
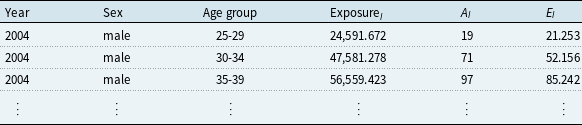
Table shows an example of the structure of the CMI inception data after preparing it for modeling. The values are illustrative as the CMI data are not publicly available.
B. Computation of the Hedging Quantity Approximation
Denote by $E$
expected quantities, as done throughout the paper, and by
$E$
expected quantities, as done throughout the paper, and by $E^{\mathcal{M}}$
expected claims according to our weighted regression Model from Section 3.1. The remaining notation is as proposed in Section 3.3.
$E^{\mathcal{M}}$
expected claims according to our weighted regression Model from Section 3.1. The remaining notation is as proposed in Section 3.3.
We assume that our weighted regression models from Section 3.1 approximately describe actual losses. With this, we obtain:
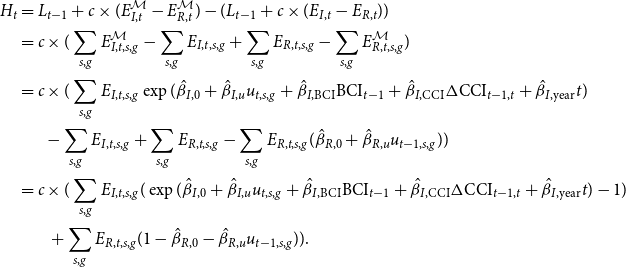 \begin{align*} H_t &= L_{t-1} + c \times (E_{I,t}^{\mathcal{M}} - E_{R,t}^{\mathcal{M}}) - (L_{t-1} + c \times (E_{I,t} - E_{R,t}))\\ &= c \times (\sum _{s,g}E_{I,t,s,g}^{\mathcal{M}} - \sum _{s,g}E_{I,t,s,g} + \sum _{s,g}E_{R,t,s,g} - \sum _{s,g}E_{R,t,s,g}^{\mathcal{M}})\\ &= c \times (\sum _{s,g}E_{I,t,s,g}\exp (\hat{\beta }_{I,0} + \hat{\beta }_{I,u}u_{t,s,g} + \hat{\beta }_{I,\mathrm{BCI}} \mathrm{BCI}_{t-1} + \hat{\beta }_{I,\mathrm{CCI}} \Delta \mathrm{CCI}_{t-1,t} + \hat{\beta }_{I,\mathrm{year}} t) \\ &\, \, \, \, \, \, \, \, - \sum _{s,g}E_{I,t,s,g} + \sum _{s,g}E_{R,t,s,g} - \sum _{s,g}E_{R,t,s,g}(\hat{\beta }_{R,0} + \hat{\beta }_{R,u}u_{t-1,s,g} ))\\ &= c \times (\sum _{s,g}E_{I,t,s,g}(\exp (\hat{\beta }_{I,0} + \hat{\beta }_{I,u}u_{t,s,g} + \hat{\beta }_{I,\mathrm{BCI}} \mathrm{BCI}_{t-1} + \hat{\beta }_{I,\mathrm{CCI}} \Delta \mathrm{CCI}_{t-1,t} + \hat{\beta }_{I,\mathrm{year}} t) - 1)\\ &\, \, \, \, \, \, \, \, \ + \sum _{s,g}E_{R,t,s,g}(1 - \hat{\beta }_{R,0} - \hat{\beta }_{R,u}u_{t-1,s,g})). \end{align*}
Remember that we try to express $H_t$
in the form
$H_t$
in the form
 \begin{align*} H_t \approx C_{t-1} + \sum _{l=1}^k a_{t-1}^{(l)} x_{t-1,t}^{(l)}. \end{align*}
To do so, we first approximate the exponential function as:
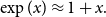 \begin{align*} \exp (x) \approx 1 + x. \end{align*}
Note that in our situation, this will be quite accurate because the Taylor expansion is close to the actual function for small $x$
. In our case,
$x$
. In our case, $x$
is the linear term describing the quantity
$x$
is the linear term describing the quantity $\log (A_I/E_I)$
, so as
$\log (A_I/E_I)$
, so as $A_I/E_I$
is close to one, this will be close to zero. Hence, we get:
$A_I/E_I$
is close to one, this will be close to zero. Hence, we get:
 \begin{align*} H_t &\approx c \times \left(\sum _{s,g}E_{I,t,s,g} \left(1 + \hat{\beta }_{I,0} + \hat{\beta }_{I,u}u_{t,s,g} + \hat{\beta }_{I,\mathrm{BCI}} \mathrm{BCI}_{t-1} + \hat{\beta }_{I,\mathrm{CCI}} \Delta \mathrm{CCI}_{t-1,t} + \hat{\beta }_{I,\mathrm{year}} t - 1 \right)\right.\\ &\, \, \, \, \, \, \, \, \ \left. + \sum _{s,g}E_{R,t,s,g} \left(1 - \hat{\beta }_{R,0} - \hat{\beta }_{R,u}u_{t-1,s,g} \right)\right). \end{align*}
Next, there is one technicality we perform on the unemployment rate. The $u$
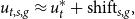
we used in the models is grouped by age and sex. Consequently, we would have to find and invest in Economic Tracking Portfolios for each such group. To reduce work and investment fees for insurance companies, we propose to approximate the age-grouped unemployment rate by shifting the overall unemployment rate with an age-group/sex-specific shift. This step is justified in FigureB.1: We observe that unemployment for different groups has a similar profile over the years but at different levels. Hence, it is reasonable to approximate the grouped unemployment rate via
$u$
we used in the models is grouped by age and sex. Consequently, we would have to find and invest in Economic Tracking Portfolios for each such group. To reduce work and investment fees for insurance companies, we propose to approximate the age-grouped unemployment rate by shifting the overall unemployment rate with an age-group/sex-specific shift. This step is justified in FigureB.1: We observe that unemployment for different groups has a similar profile over the years but at different levels. Hence, it is reasonable to approximate the grouped unemployment rate via
 \begin{align*} u_{t,s,g} \approx u_t^* + \mathrm{shift}_{s,g}, \end{align*}
where $u^*$
is the overall unemployment rate. The shifts are chosen so that we minimize the approximation error, so for each
$u^*$
is the overall unemployment rate. The shifts are chosen so that we minimize the approximation error, so for each $s$
and
$s$
and $g$
, we set
$g$
, we set
 \begin{align*} \mathrm{shift}_{s,g} = \mathrm{argmin}_z \sum _{t} \left(u_{t,s,g} - \left(u_t^* + z \right)\right)^2 = \frac{1}{n_t}\sum _{t} \left(u_{t,s,g} - u_t^* \right). \end{align*}
Male (left) and female (right) UK unemployment rate together with general unemployment rate (dashed orange). Different age groups are indicated with different shades of blue.
Integrating this into our approximation for $H_t$
, we rewrite
$H_t$
, we rewrite
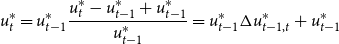 \begin{align*} u_t^* = u_{t-1}^* \frac{u_t^* - u_{t-1}^* + u_{t-1}^*}{u_{t-1}^*} = u_{t-1}^* \Delta u_{t-1,t}^* + u_{t-1}^* \end{align*}
and get
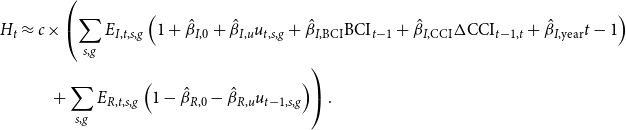
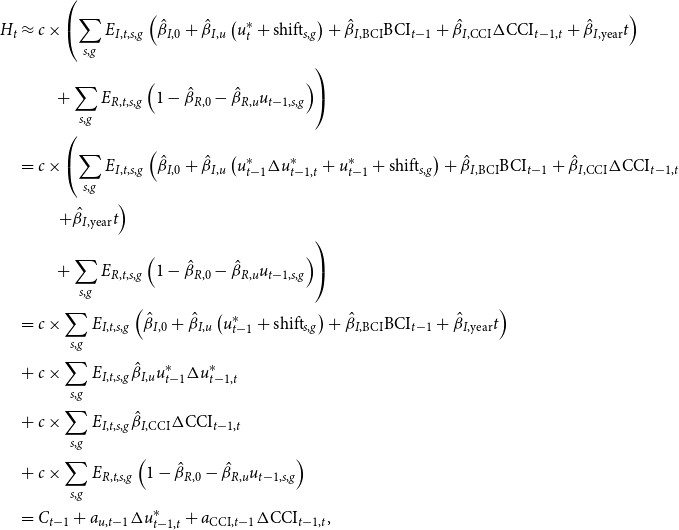 \begin{align*} H_t &\approx c \times \left(\sum _{s,g}E_{I,t,s,g}\left(\hat{\beta }_{I,0} + \hat{\beta }_{I,u}\left(u_t^* + \mathrm{shift}_{s,g}\right) + \hat{\beta }_{I,\mathrm{BCI}} \mathrm{BCI}_{t-1} + \hat{\beta }_{I,\mathrm{CCI}} \Delta \mathrm{CCI}_{t-1,t} + \hat{\beta }_{I,\mathrm{year}} t \right) \right.\\ &\, \, \, \, \, \, \, \, \ \ \left.+ \sum _{s,g}E_{R,t,s,g} \left(1 - \hat{\beta }_{R,0} - \hat{\beta }_{R,u}u_{t-1,s,g}\right)\right)\\ &= c \times \left(\sum _{s,g}E_{I,t,s,g} \left(\hat{\beta }_{I,0} + \hat{\beta }_{I,u}\left(u_{t-1}^*\Delta u_{t-1,t}^* + u_{t-1}^* + \mathrm{shift}_{s,g}\right) + \hat{\beta }_{I,\mathrm{BCI}} \mathrm{BCI}_{t-1} + \hat{\beta }_{I,\mathrm{CCI}} \Delta \mathrm{CCI}_{t-1,t} \right.\right. \\ &\left.\left. \qquad + \hat{\beta }_{I,\mathrm{year}} t \right) \right.\\ &\, \, \, \, \, \, \, \, \ \ \left. + \sum _{s,g}E_{R,t,s,g} \left(1 - \hat{\beta }_{R,0} - \hat{\beta }_{R,u}u_{t-1,s,g}\right)\right)\\ &= c \times \sum _{s,g}E_{I,t,s,g} \left(\hat{\beta }_{I,0} + \hat{\beta }_{I,u}\left(u_{t-1}^* + \mathrm{shift}_{s,g}\right) + \hat{\beta }_{I,\mathrm{BCI}} \mathrm{BCI}_{t-1} + \hat{\beta }_{I,\mathrm{year}} t\right)\\ &+ c \times \sum _{s,g}E_{I,t,s,g}\hat{\beta }_{I,u} u_{t-1}^*\Delta u_{t-1,t}^*\\ &+ c \times \sum _{s,g}E_{I,t,s,g}\hat{\beta }_{I,\mathrm{CCI}} \Delta \mathrm{CCI}_{t-1,t}\\ &+ c \times \sum _{s,g}E_{R,t,s,g}\left(1 - \hat{\beta }_{R,0} - \hat{\beta }_{R,u}u_{t-1,s,g}\right)\\ &= C_{t-1} + a_{u,t-1}\Delta u_{t-1,t}^* + a_{\mathrm{CCI},t-1}\Delta \mathrm{CCI}_{t-1,t}, \end{align*}
where
 \begin{align*} C_{t-1} &= c \times \sum _{s,g}(E_{I,t,s,g}(\hat{\beta }_{I,0} + \hat{\beta }_{I,u}(u_{t-1}^* + \mathrm{shift}_{s,g}) + \hat{\beta }_{I,\mathrm{BCI}} \mathrm{BCI}_{t-1} + \hat{\beta }_{I,\mathrm{year}} t)\\ &\hspace{1.5cm} + E_{R,t,s,g}(1 - \hat{\beta }_{R,0} - \hat{\beta }_{R,u}u_{t-1,s,g}),\\ a_{u,t-1} &= c \times \sum _{s,g}E_{I,t,s,g} \hat{\beta }_{I,u} u_{t-1}^* = c \times \hat{\beta }_{I,u} u_{t-1}^* \times E_{I,t},\\ a_{\mathrm{CCI},t-1} &= c \times \sum _{s,g}E_{I,t,s,g}\hat{\beta }_{I,\mathrm{CCI}} = c \times \hat{\beta }_{I,\mathrm{CCI}} \times E_{I,t}, \end{align*}
which is of the form we aimed to achieve.
C. Loss Simulation Algorithm
The algorithm to simulate loss values $L_{t,m}$
in Section 3.4 is stated below.
$L_{t,m}$
in Section 3.4 is stated below.
Algorithm Appendix 3.1 (Simulation of Losses). To simulate DII loss data,
-
• choose values for
-
∘ the number of simulations per quantity
$M$
, -
∘ cost per claim
$c$
, -
∘ a simulation period
$\mathcal{P}$
, -
∘ last year’s losses
$L_{t-1}$
, -
∘ expected rates
$r_{Q,s,g}$
and -
∘
$\mathrm{Exposure}_{Q,t,s,g}$
,
-


where $Q \in {I,R},\ t \in \mathcal{P},\ s \in$
{male,female} and
$Q \in {I,R},\ t \in \mathcal{P},\ s \in$
{male,female} and $g \in$
{25-29,…,60-64}.
$g \in$
{25-29,…,60-64}.
-
• For
$t \in \mathcal{P}$
, follow these steps:-
∘ For each sex
$s \in$
{male,female} and age group
$g \in$
{25-29,…,60-64}, -
∘ Set
where the
\begin{align*} \mu _{I,t,s,g} &= \hat{\beta }_{I,0} + \hat{\beta }_{I,u}u_{t,s,g} + \hat{\beta }_{I,\mathrm{BCI}} \mathrm{BCI}_{t-1} + \hat{\beta }_{I,\mathrm{CCI}} \Delta \mathrm{CCI}_{t-1,t} + \hat{\beta }_{I,\mathrm{year}} t,\\ \mu _{R,t,s,g} &= \hat{\beta }_{R,0} + \hat{\beta }_{R,u}u_{t-1,s,g}, \end{align*}
$\hat{\beta }$
-values are from our weighted regression models.
-
∘ Draw
$m = 1,\dots, M$
random variables
$Z_{I,t,m}$
from a Normal distribution with mean
$\mu _{I,t,s,g}$
and variance
$\hat{\sigma }^2_{\log (A/E)}$
(which is defined as the sample standard deviation of
$\log (A/E)$
values in our data). -
∘ Draw
$m = 1,\dots, M$
random variables
$Z_{R,t,m}$
from a Normal distribution with mean
$\mu _{R,t,s,g}$
and variance
$\hat{\sigma }^2_{A/E}$
(which is defined as the sample standard deviation of
$A/E$
values in our data). -
∘ Set
$A_{I,t,s,g,m} = \mathrm{Exposure}_{I,t,s,g} r_{I,s,g} \exp (Z_{I,t,m})$
. -
∘ Set
$A_{R,t,s,g,m} = \mathrm{Exposure}_{R,t,s,g} r_{R,s,g} Z_{R,t,m}$
.
-
-
• Compute
$L_{t,m} = L_{t-1} + c \times \left(\sum _{s,g} A_{I,t,s,g,m} - \sum _{s,g} A_{R,t,s,g,m}\right)$
.


This results in $M$
simulated loss values for each year
$M$
simulated loss values for each year $t \in \mathcal{P}$
.
$t \in \mathcal{P}$
.
We choose $M =$
10,000 and
$M =$
10,000 and $\mathcal{P} = {2017,\dots, 2021}$
. All other required quantities are usually available to an insurance company: The company knows its loss
$\mathcal{P} = {2017,\dots, 2021}$
. All other required quantities are usually available to an insurance company: The company knows its loss $L_{t-1}$
at time
$L_{t-1}$
at time $t-1$
, its risk exposures
$t-1$
, its risk exposures $\mathrm{Exposure}_{Q,t,s,g}$
, and its cost structure (i.e.
$\mathrm{Exposure}_{Q,t,s,g}$
, and its cost structure (i.e. $c$
) for next year. In our case, we do not have the data of a particular insurance company at hand and thus will make the following assumptions:
$c$
) for next year. In our case, we do not have the data of a particular insurance company at hand and thus will make the following assumptions:
-
•
$c = 1$
, -
•
$L_{t-1} = \sum _{s,g} (1/n_t)\sum _{t=2004}^{2016}\mathrm{Exposure}_{R,t,s,g}$
for all
$t \in \{2017,\dots, 2021\}$
, which is the average recovery exposure in the CMI data set, i.e. the average number of cost bearers per year, -
•
$r_{L,s,g} = (1/n_t)\sum _{t=2004}^{2016} E_{L,t,s,g}/\mathrm{Exposure}_{L,t,s,g}$
, which are expected rates assuming the average occupation class, deferment period and sickness duration distribution in the CMI data set and -
•
$\mathrm{Exposure}_{L,t,s,g} = (1/n_t)\sum _{t=2004}^{2016}\mathrm{Exposure}_{L,t,s,g}$
, which are the average inception and recovery exposures in the CMI data set.


 Open access