


Introduction
As our cities become denser and mass gatherings happen all over the world, crowd accidents, including stampedes and other secondary problems, are occurring in increasing numbers. Crowd safety in urban public spaces has become a new topic for both urban designers and managers.
This paper questions how the combination of different spatial separation elements, such as columns and pillars, will affect the crowd safety in a bottleneck area of the public open space and makes hypotheses about spatial layouts and management plans that will improve the situation. Through a detailed analysis of the Shanghai Bund crowd disaster as a case study, this paper attempts to introduce a new design method to urban planners and managers, considering crowd science to be more specific about dangerous space layout plans dealing with large crowds. This paper uses an agent-based simulation model developed previously in our laboratory, and the research data are based on the field survey of the site of Shanghai Bund waterfront conducted by the authors.
The research background relating to this paper is introduced in the section “Research background”. In the section “Shanghai Bund waterfront”, the official investigation results and the media reports about the Shanghai Bund crowd disaster are reviewed, along with a detailed introduction of the overall situation. In the section “Methodology”, the research methodology is introduced. The section “Data collection” introduces the data collection through the survey of the site. The simulation platform artisoc 4.0 and our simulation model are introduced briefly in the section “Modeling approach and simulation software”. In the section “Evaluation criteria”, evaluation criteria chosen to examine crowd safety are explained. In the section “Scenario development”, the settings of simulation scenario design are introduced with the practical and theoretical reasons explained. In the section “Results and discussion”, the original space layout of Shanghai Bund in 2014 and alternative scenarios are tested. Comparison figures of the results of different spaces and management operations are provided. In the Conclusion section, the space operations that should be adopted or avoided in the urban public space are concluded and further research directions for applying crowd science into engineering practice are discussed.
Research background
Traditionally, the public space design for events and other mass gatherings follows different design standards to operational guidance. The Level-of-Service (LoS) concept developed by Fruin, in particular, has defined the criteria for many pedestrian design standards (Fruin, Reference Fruin1971).
However, since the 1990s, many pedestrian self-organization phenomena in ordinary and emergency conditions have been revealed (Helbing and Molnar, Reference Helbing and Molnar1998; Helbing et al., Reference Helbing, Farkas, Molnar, Vicsek, Schreckenberg and Sharma2002, Reference Helbing, Buzna, Johansson and Werner2005). It was found that pedestrian data observed under normal situations do not necessarily suit pedestrian behavior in high-density or emergency situations. In recent years, pedestrian walking behavior tends to be understood as a typical complex system: the individual route choices shape the crowds and are affected by the crowds in turn. The reason analysis of various crowd disasters also indicates that pedestrian behavior is an indispensable factor for space safety (Helbing and Mukerji, Reference Helbing and Mukerji2012; Pretorius et al., Reference Pretorius, Gwynne and Galea2013). Even in a public space that fully meets design standards, a crowd incident can be triggered because of competition or avoidance behavior at a certain spot. Also, the understanding of the mechanism of crowd incidents changed from single cause to systematic failure (Helbing and Mukerji, Reference Helbing and Mukerji2012). In addition to the complexity of crowd psychology and the irreproducibility of accidents, simple observations cannot meet the needs of quantitative research. In many cases such as crowd accidents, direct observation is not possible for both practical and ethical reasons. As a result, computer simulation becomes one way to achieve the research analysis and assessment of these real-world scenarios.
In accordance with the theoretical development, a series of computational models were proposed. Among them, macro models such as all kinds of physical models, micro models like the cellular automata model, and agent-based modeling (ABM) are the main representatives. ABM, compared with the previous observational experiments and other simulation models, has proved to have a better ability to describe the detailed behavior of pedestrians (Bandini et al., Reference Bandini, Manzoni and Vizzari2009).
Although ABM has achieved much in terms of technology, it has much less practical application in the field of urban planning and crowd management. Currently, there are only a few cases where ABM has been applied for the analysis of crowd disasters and the testing of space designs, such as the examination of improved design solutions of pedestrian facilities (Helbing et al., Reference Helbing, Buzna, Johansson and Werner2005); the analysis of the crowd disaster at the Duisburg Love Parade electronic music festival (Helbing and Mukerji, Reference Helbing and Mukerji2012; Pretorius et al., Reference Pretorius, Gwynne and Galea2013); and the design of the new Jamarat Bridge in Mecca (Al-Kodmany, Reference Al-Kodmany2013).
Shanghai Bund waterfront
Overview of the situation
The Shanghai Bund Scenic Area is a downtown linear walking space along the Huangpu River. With the combination of exotic historical buildings, commercial leisure, and waterfront viewing, it attracts up to one million tourists per day during holidays. From 2011, a New Year countdown together with a lightshow was held for 3 years in this area and the number of visitors increased year by year. In 2014, the location of the lightshow was changed into a nearby place that required tickets in the last few days of the year for safety considerations. However, there were still large crowds of people unaware of the venue change or people simply gathered at the previous site for the New Year countdown. At 23:35 on December 31, 2014, a serious crowd disaster occurred in front of a staircase which caused 36 deaths and 49 injures. A media video recorded the moment the Shanghai crowd disaster happened and the pedestrians were in a fluid condition (Nan-fang Metropolis Daily, 2015). There was an obvious human wave forced by huge pressure pushing down the staircase to cause people to fall on each other, although nobody was doing this on purpose.
Site description
The Bund Scenic Area
In the past hundred years, the Bund waterfront has been reconstructed several times to adapt to the city's development. In 1990, the flood defense wall was shifted outwards and the inside was converted to parking and its top to a viewing platform (Wu et al., Reference Wu, Xi and Xi2011; Xi and Xu, Reference Xi and Xu2011). This plan partially satisfied the function of transportation, flood defense, and pedestrian activities. However, the city and the waterfront were separated by the height difference of the flood defense wall, while busy vehicle traffic occupied a large part of the waterfront space and the lack of the public activity space made the area potentially dangerous for high pedestrian density. With the opportunity of the 2010 Shanghai World Expo and the building of the Bund Tunnel, reconstruction was possible again in the Bund area with the intention of returning more waterfront space to pedestrians. High-intensity vehicle traffic was channeled underground, and the ground roadways were reduced from 11 lanes to 4, plus 2 spare lanes, which increased the accessible pedestrian ground space by 40%.
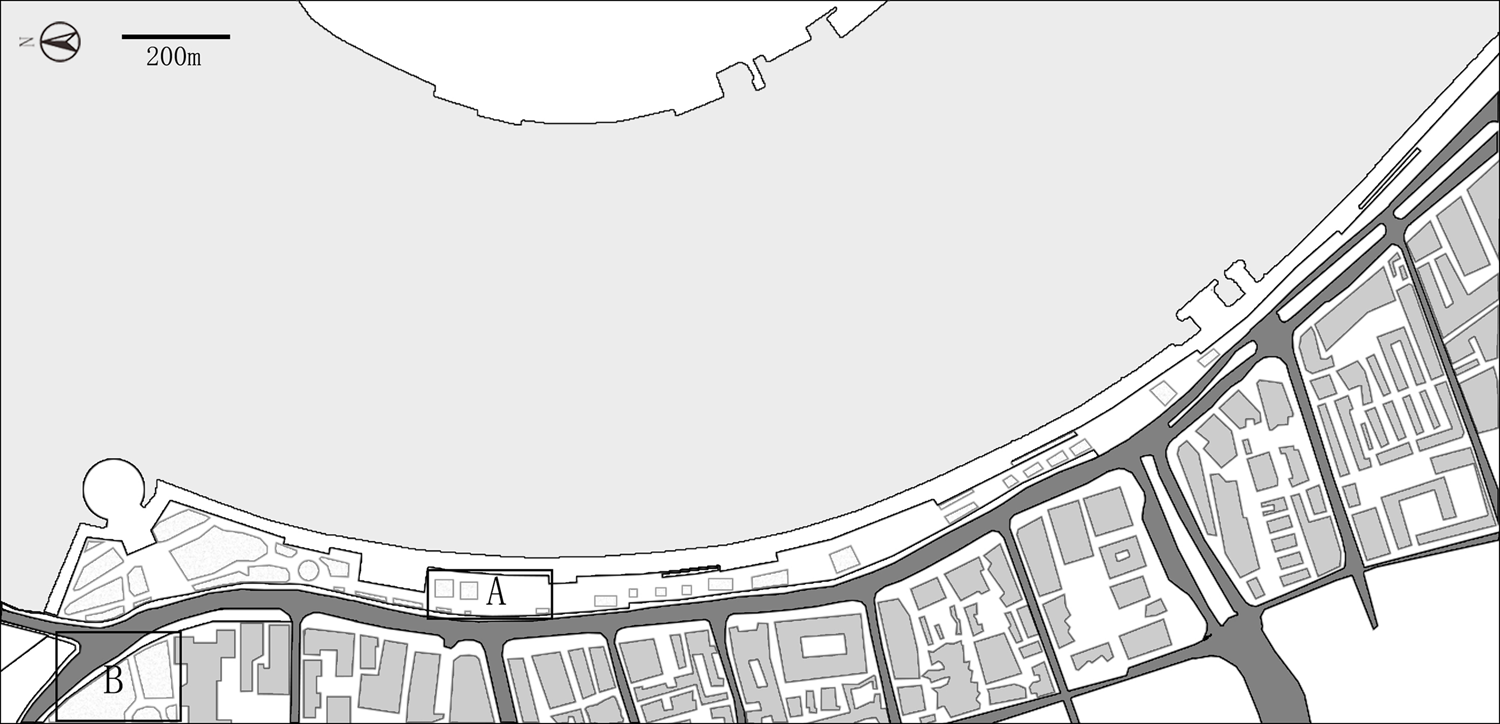
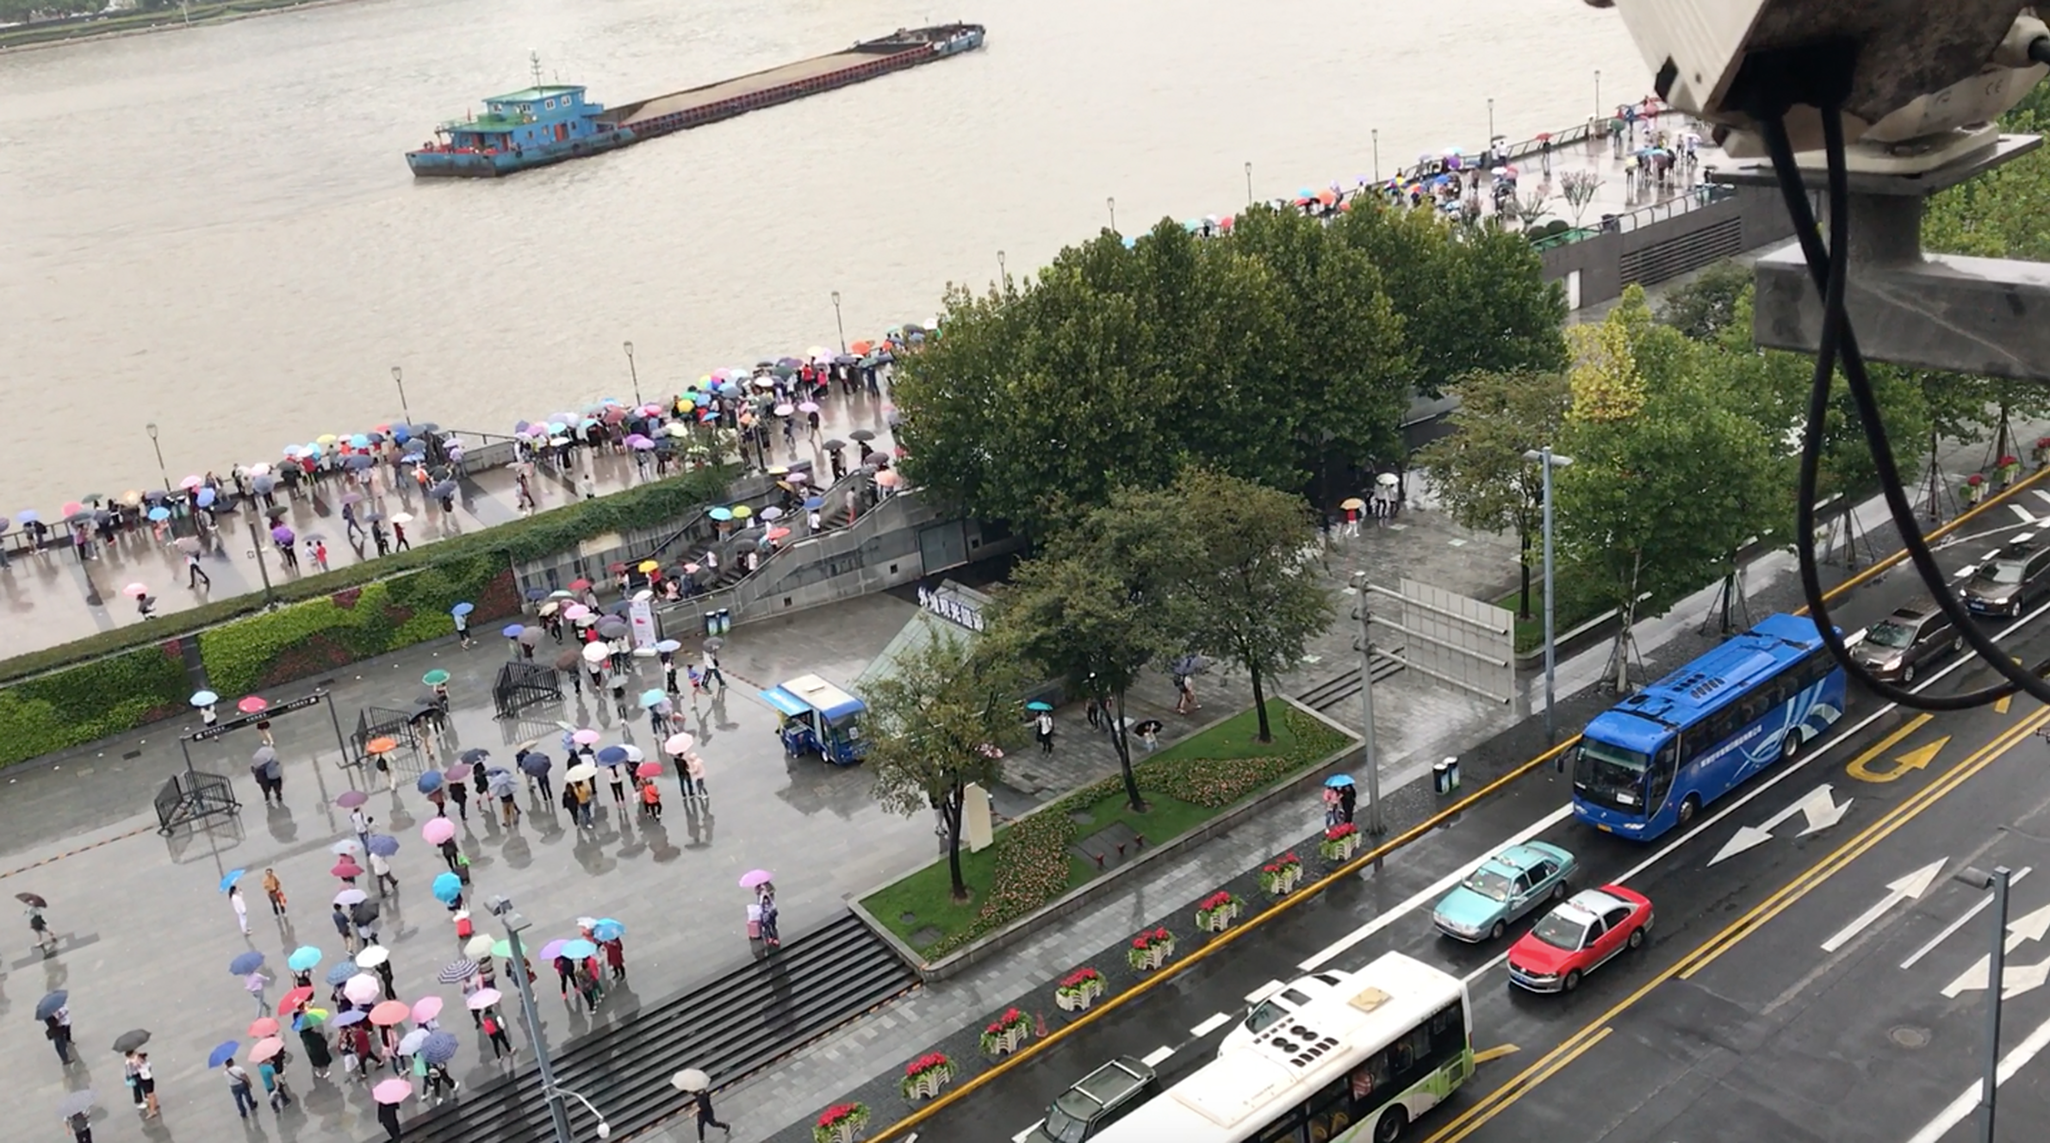
Currently, the Bund has an area of 3.1 km2, as shown in Figure 1. Compared with the previous plan, a middle layer of 4.7 m squares was set between the 3.5 m sidewalk and the 6.9 m flood defense wall. The three layers, as can be seen in Figure 2, are designed to form three walking passages along the north and south to relieve the high-density flows in rush hours (Xi and Xu, Reference Xi and Xu2011). The sidewalk was widened from 2.5–9 to 10–15 m. A facility belt is also set in the middle of the sidewalk to avoid obstruction. Squares are set in the main pedestrian flow intersections and good viewing sites to accommodate large gatherings and to provide event venues. Staircases and a few large slopes with angles between 3% and 5% were designed, combining the squares and the viewing platform, which took into account safety in high-density situations. Beside the staircases, the viewing platform on the top of the flood defense wall was partially widened to provide better vision across the river and resting spaces.
Bund Scenic Area, A: Chen Yi Square, B: Waitan Yuan, the actual event location (drawn by one of the authors based on the detailed plan of the urban design and site plan of Shanghai Bund waterfront by Xi and Xu (Reference Xi and Xu2011)).
Three elevations of the road, square, and viewing platform of Chen Yi Square (snapshot from the survey video by one of the authors).
Chen Yi Square
Located in the middle of the Bund Scenic Area (Fig. 2 and area A in Fig. 1), Chen Yi Square was doubled in the 2010 reconstruction and now has a public activity area of 2877 m2 (Xi and Xu, Reference Xi and Xu2011). Chen Yi Square is connected to the viewing platform with staircases on both the north and south sides (a detailed plan can be seen in Fig. 3). The viewing platform in the Chen Yi Square section is considered to be the best viewing position of the Bund area. In addition, Chen Yi Square is around 580 m away from subway lines 2 and 10 and is the area of the highest crowd density and pedestrian flows. Waitan Yuan, around 550 m away from Chen Yi Square, was the actual event site for the New Year lightshow at night (area B in Fig. 1).
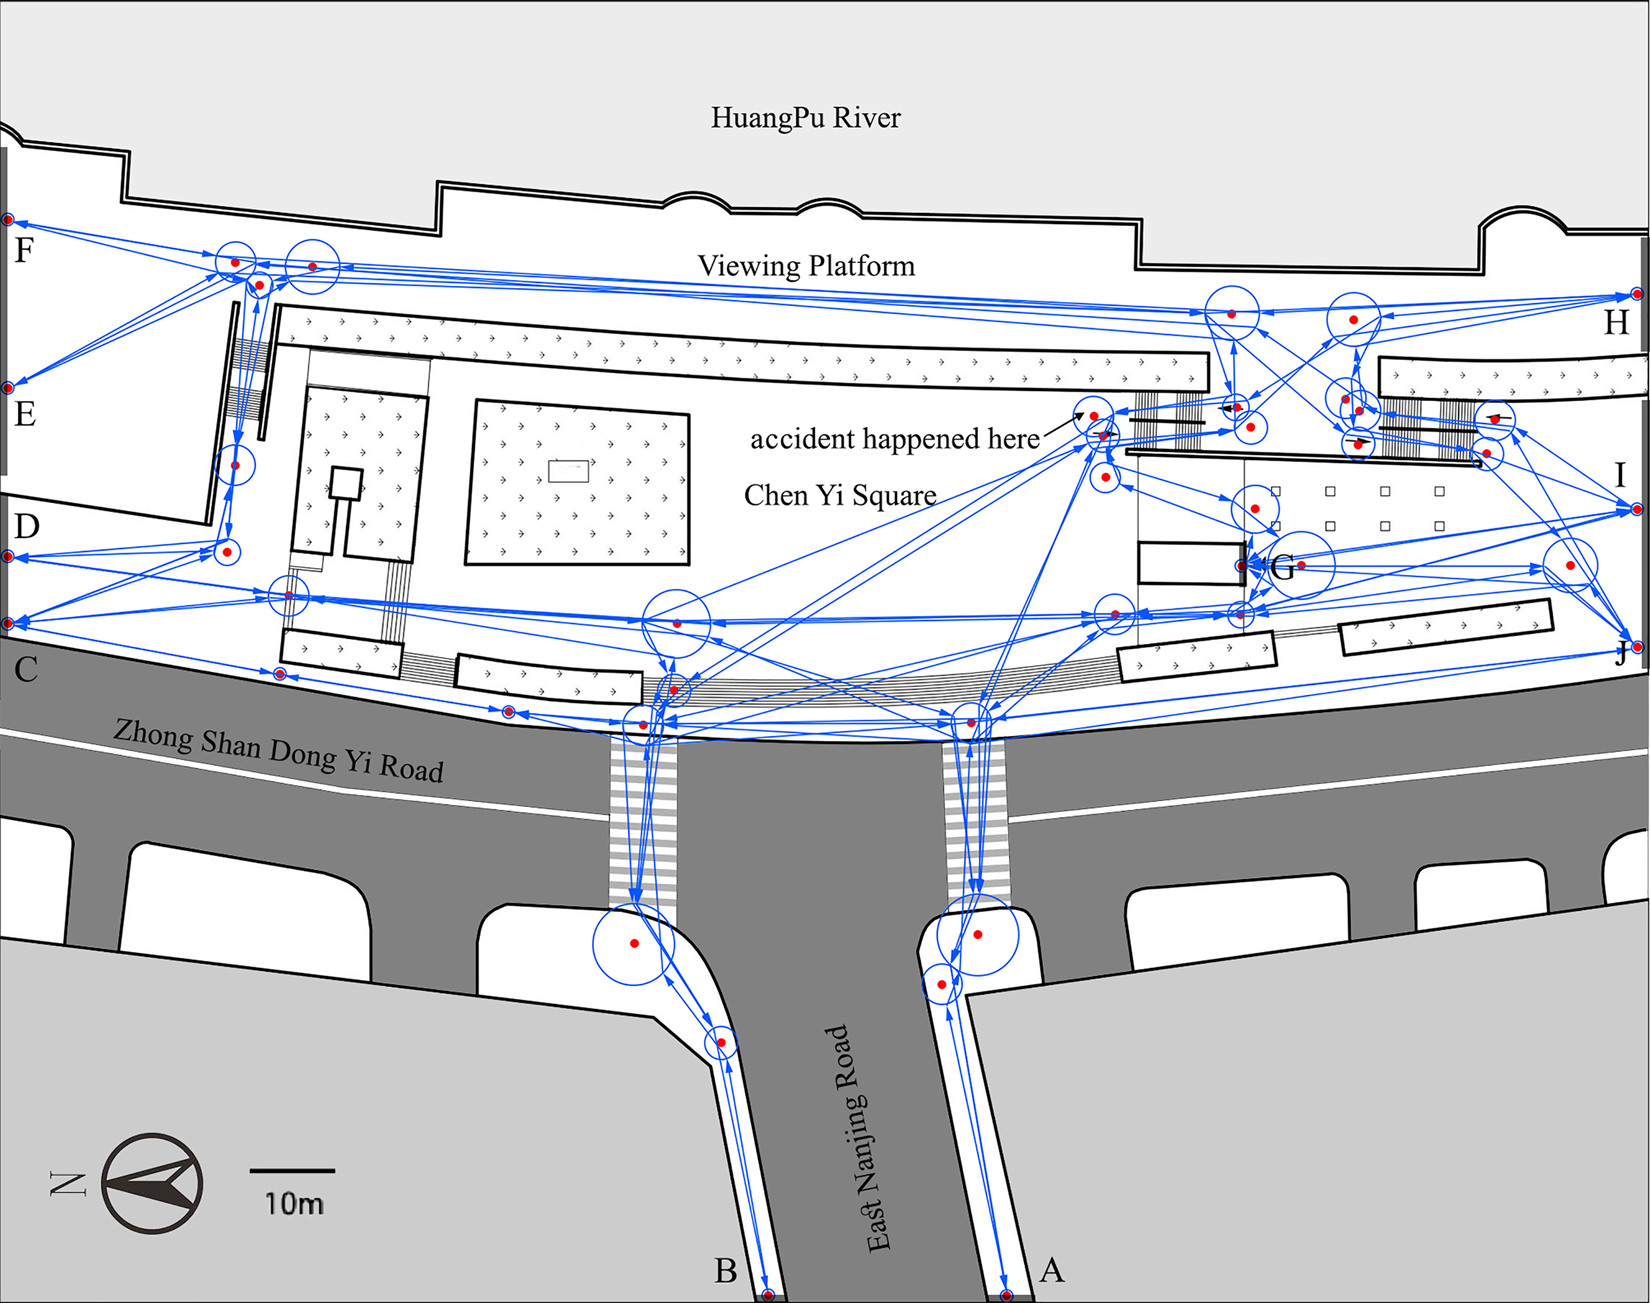
Simulation area, agent generation areas (from A to J), and the waypoint network (drawn by one of the authors based on the satellite map).
Accident site
The crowd accident happened in front and on the staircase in the southeast corner of Chen Yi Square. The staircase is made of two groups of 17 steps in total, and there is a 2.3 m platform between them. The staircase is 6.2 m in width and 8.4 m in depth. The highest point of the stair wall is 3.5 m from the ground and is equipped with steel strip armrests on both sides. The original plan had no column to divide the up and down flows.
Crowd accident
After the accident, the Shanghai Municipal Government formed a Joint Investigation Team among different city departments. After the comprehensive analysis, an investigation report was released on January 20, 2015 (Shanghai Bund Chen Yi Square Crowd Accident Investigation Committee, 2015). In the following, we extract the crucial points of this report in our own words and conclude the timeline of the accident in Table 1.
Timeline of the Bund crowd accidenta
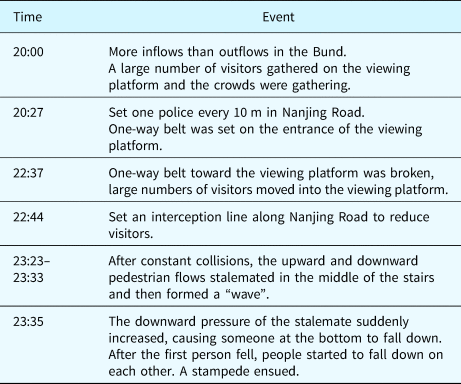
a The authors summary based on the investigation report on Shanghai Bund Chen Yi Square crowd accident (2015).
The visitor number was obtained through a comprehensive data analysis of the communication department, the public security department, and the subway operating enterprise. There were around 120,000 people from 20:00 to 21:00, 160,000 people from 21:00 to 22:00, and 240,000 people from 22:00 to 23:00 in the Bund area. From 23:00 to 23:35, when the accident happened, there were around 310,000 people. However, since visitors are not distributed evenly in the Bund area, the accident area had extremely high density. According to a media report, witnesses estimated the density at the accident site were around 6–7 persons/m2 (Sohu News, 2015).
In the investigation report, this accident was defined as a stampede caused by insufficient preparation and management. The main reasons were given as the following:
- When the event location changed, there was no risk evaluation about possible crowd gatherings.
- The change of the event was not well-enough publicized. The New Year countdown was officially announced on December 30, just 1 day before the event. The pronunciation of the Bund is “Waitan” in Chinese, while the new location is read as “Waitan Yuan”. Many of the visitors did not know about the change or could not tell the difference.
- Since the actual event site was changed, the security along the Bund was not set to the event level.
- There was not enough monitoring of the pedestrian flow change.
After the accident, a few facility improvements and management plans were adapted and will be discussed in detail in the scenario development section.
Methodology
The accident investigation report shows the overall visitor number of the site by the hour and a density range can be concluded. However, the investigation report does not mention spatial analysis or pedestrian flow patterns. In this case, many different flow patterns could happen inside the site. For urban designers who usually do not deal with actual disaster situations and do not have enough information about pedestrian flow patterns, how can they design an urban public space that satisfies crowd safety? What is more important, even though designers provide capacity for the public space, the urban space users gather and use the urban spaces according to their own preferences. The Shanghai Bund crowd accident, for example, could be called as a spontaneous gathering rather than an event, as the actual New Year countdown event was relocated to a nearby place. The focus of our analysis is not on the responsibilities of designers or management institutions but to offer a practical method to examine the crowd safety of the spatial layout and to arrange management plans and improve spatial facilities according to the simulation results in urban high-density situations. With the above considerations, our method collects pedestrian flow data in an ordinary day and uses the data as a crowd safety coefficient for the space safety examination.
Based on the findings from the official accident report and the survey of the site, a simulation model was developed. Unlike the general evacuation models on the market, which have limited ability regarding route circulation and social influence among occupants, the simulation model used in this paper is agent-based and can reflect the interactions between agents and obstacles. Instead of analyzing the extreme densities directly, the local density growth character of each space layout and management plan is stressed, as it shows the ability of avoiding the formation of pedestrian blockage and considering the limitations of an ABM model. To achieve this goal, pedestrian flow data were surveyed in the Shanghai Bund waterfront and used as a basic pedestrian flow parameter. The spot where the crowd accident happened was set as the key measurement area, and the areas close to it were measured as well. To analyze the simulation results, evaluation criteria were decided by reviewing the relevant literature.
Data collection
An aerial view video survey was conducted from 15:00 to 16:00 on a weekday in September 2017 in the area shown in Figure 3. There are 10 places where the visitors can enter freely, and they are named as entry A to J. The visitor numbers for each entry were counted for 5 min and the average was taken, as seen in Table 2.
Average entry visitor number of surveyed area (persons/min)a

a According to the aerial view video survey conducted by one of the authors in 2017.
Entries A and B are on East Nanjing Road, which is in the direction of the subway station. Almost half of the surveyed visitors were coming from this direction and went to the viewing platform. This main pedestrian stream was around 90° to the viewing platform and was tightened by the staircase like an hourglass. Visitors from entries E and F are from the north side of the viewing platform, accounting for 16.3% of the total visitors. Visitors from entry H were from the south side of the viewing platform, accounting for 11% of the total visitors. These three directions of visitors were meeting at the platform beyond the stairs.
Modeling approach and simulation software
The simulation software this research uses is artisoc 4.0 (Artisoc, Kozo Keikaku Engineering Inc). Unlike evacuation simulators, which can only create simple and typical models, artisoc is a flexible multi-agent simulator developed to create social phenomenon models and run simulations, which has been proved to have the ability to create complex models. A model in artisoc is made up of a model tree, variables, and rules, as can be seen in Figure 4. Different agents exist and interact with other agents and the environment in the space under the universal variable settings.
Visual framework of the simulation model in artisoc.
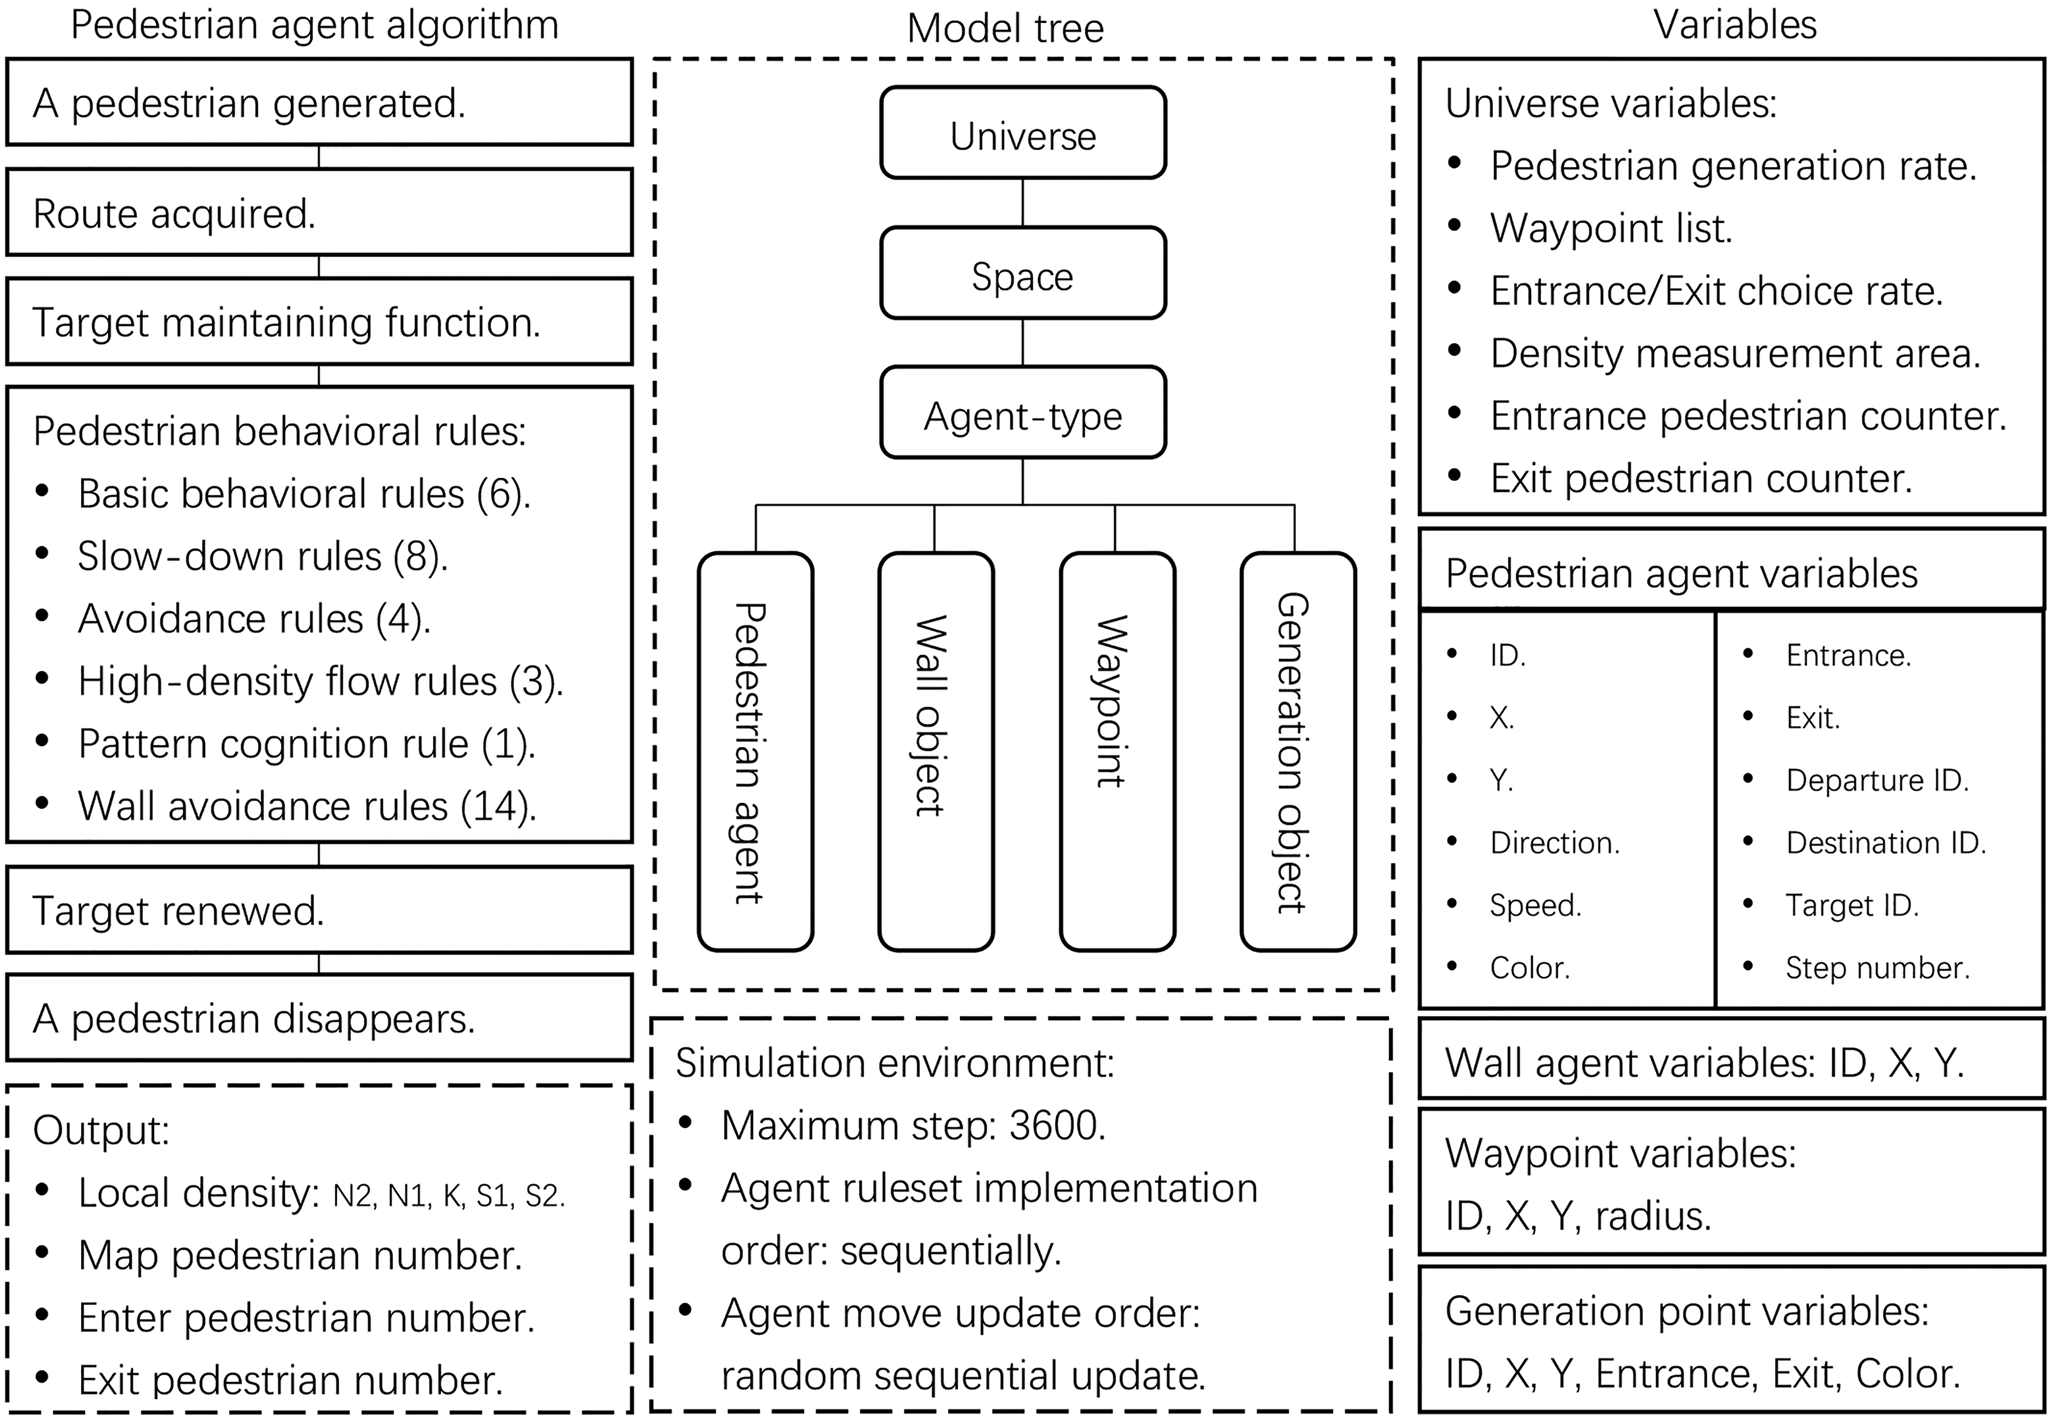
From this point, the Shanghai Bund simulation model developed for this research is introduced. There are four agent types in the model: pedestrian agent, wall object, waypoint, and generation object. Only pedestrian agents move in the space map, while other agent types are stationary. A pedestrian agent is generated with the surveyed visitor entry rate at a generation object (many generation objects form one entry depending on the entry width) and moves toward a preset exit. The pedestrian agent moves following the shortest path principle while avoiding other agents and wall objects. Waypoints are temporary walking targets set based on the directly visible principle. The simulation area, agent generation areas, and the waypoint network are shown in Figure 3. A choice-making sphere around each waypoint is set according to actual observation. When the agent reaches the choice-making sphere, it updates its temporary target to the next waypoint until it finds the exit. As the agent keeps avoiding other agents and wall objects, it will recalculate the direction between itself and the current target every few steps. The agent disappears when it reaches the sphere of the preset exit.
The space presentation in artisoc is two-dimensional and is divided into cell-grid spaces of 0.4 m per side. Though the space is cell-grid, the agent moves in the environment using an absolute coordinate system and avoids other agents and wall objects using a relative coordinate system, as shown in Figure 5a,b. In the relative coordinate system of the cell space, the Y axis represents the walking direction of pedestrians. With the above setting, the agent is able to move in 360° directions without the limitation of cells. Under this setting, ASPFver.4 pedestrian behavior rules are applied to the model. This enabled the same pedestrian behavior rules to be applied to pedestrians walking in different directions. More complete descriptions and figures can be seen in Kaneda and Okayama (Reference Kaneda, Okayama, Terano, Kita, Deguchi and Kijima2007). The speed setting of agents follows Henderson's survey result of a base casual distribution of an average speed of 1.34 m/s and a standard deviation of 0.26 m/s (Henderson, Reference Henderson1971). Individual differences of the walking speed can be represented with the forward cell movement, as shown in Figure 5a.
Explanation of coordinate systems and pedestrian behavior rules of ASPF (Kaneda and Okayama, Reference Kaneda, Okayama, Terano, Kita, Deguchi and Kijima2007).
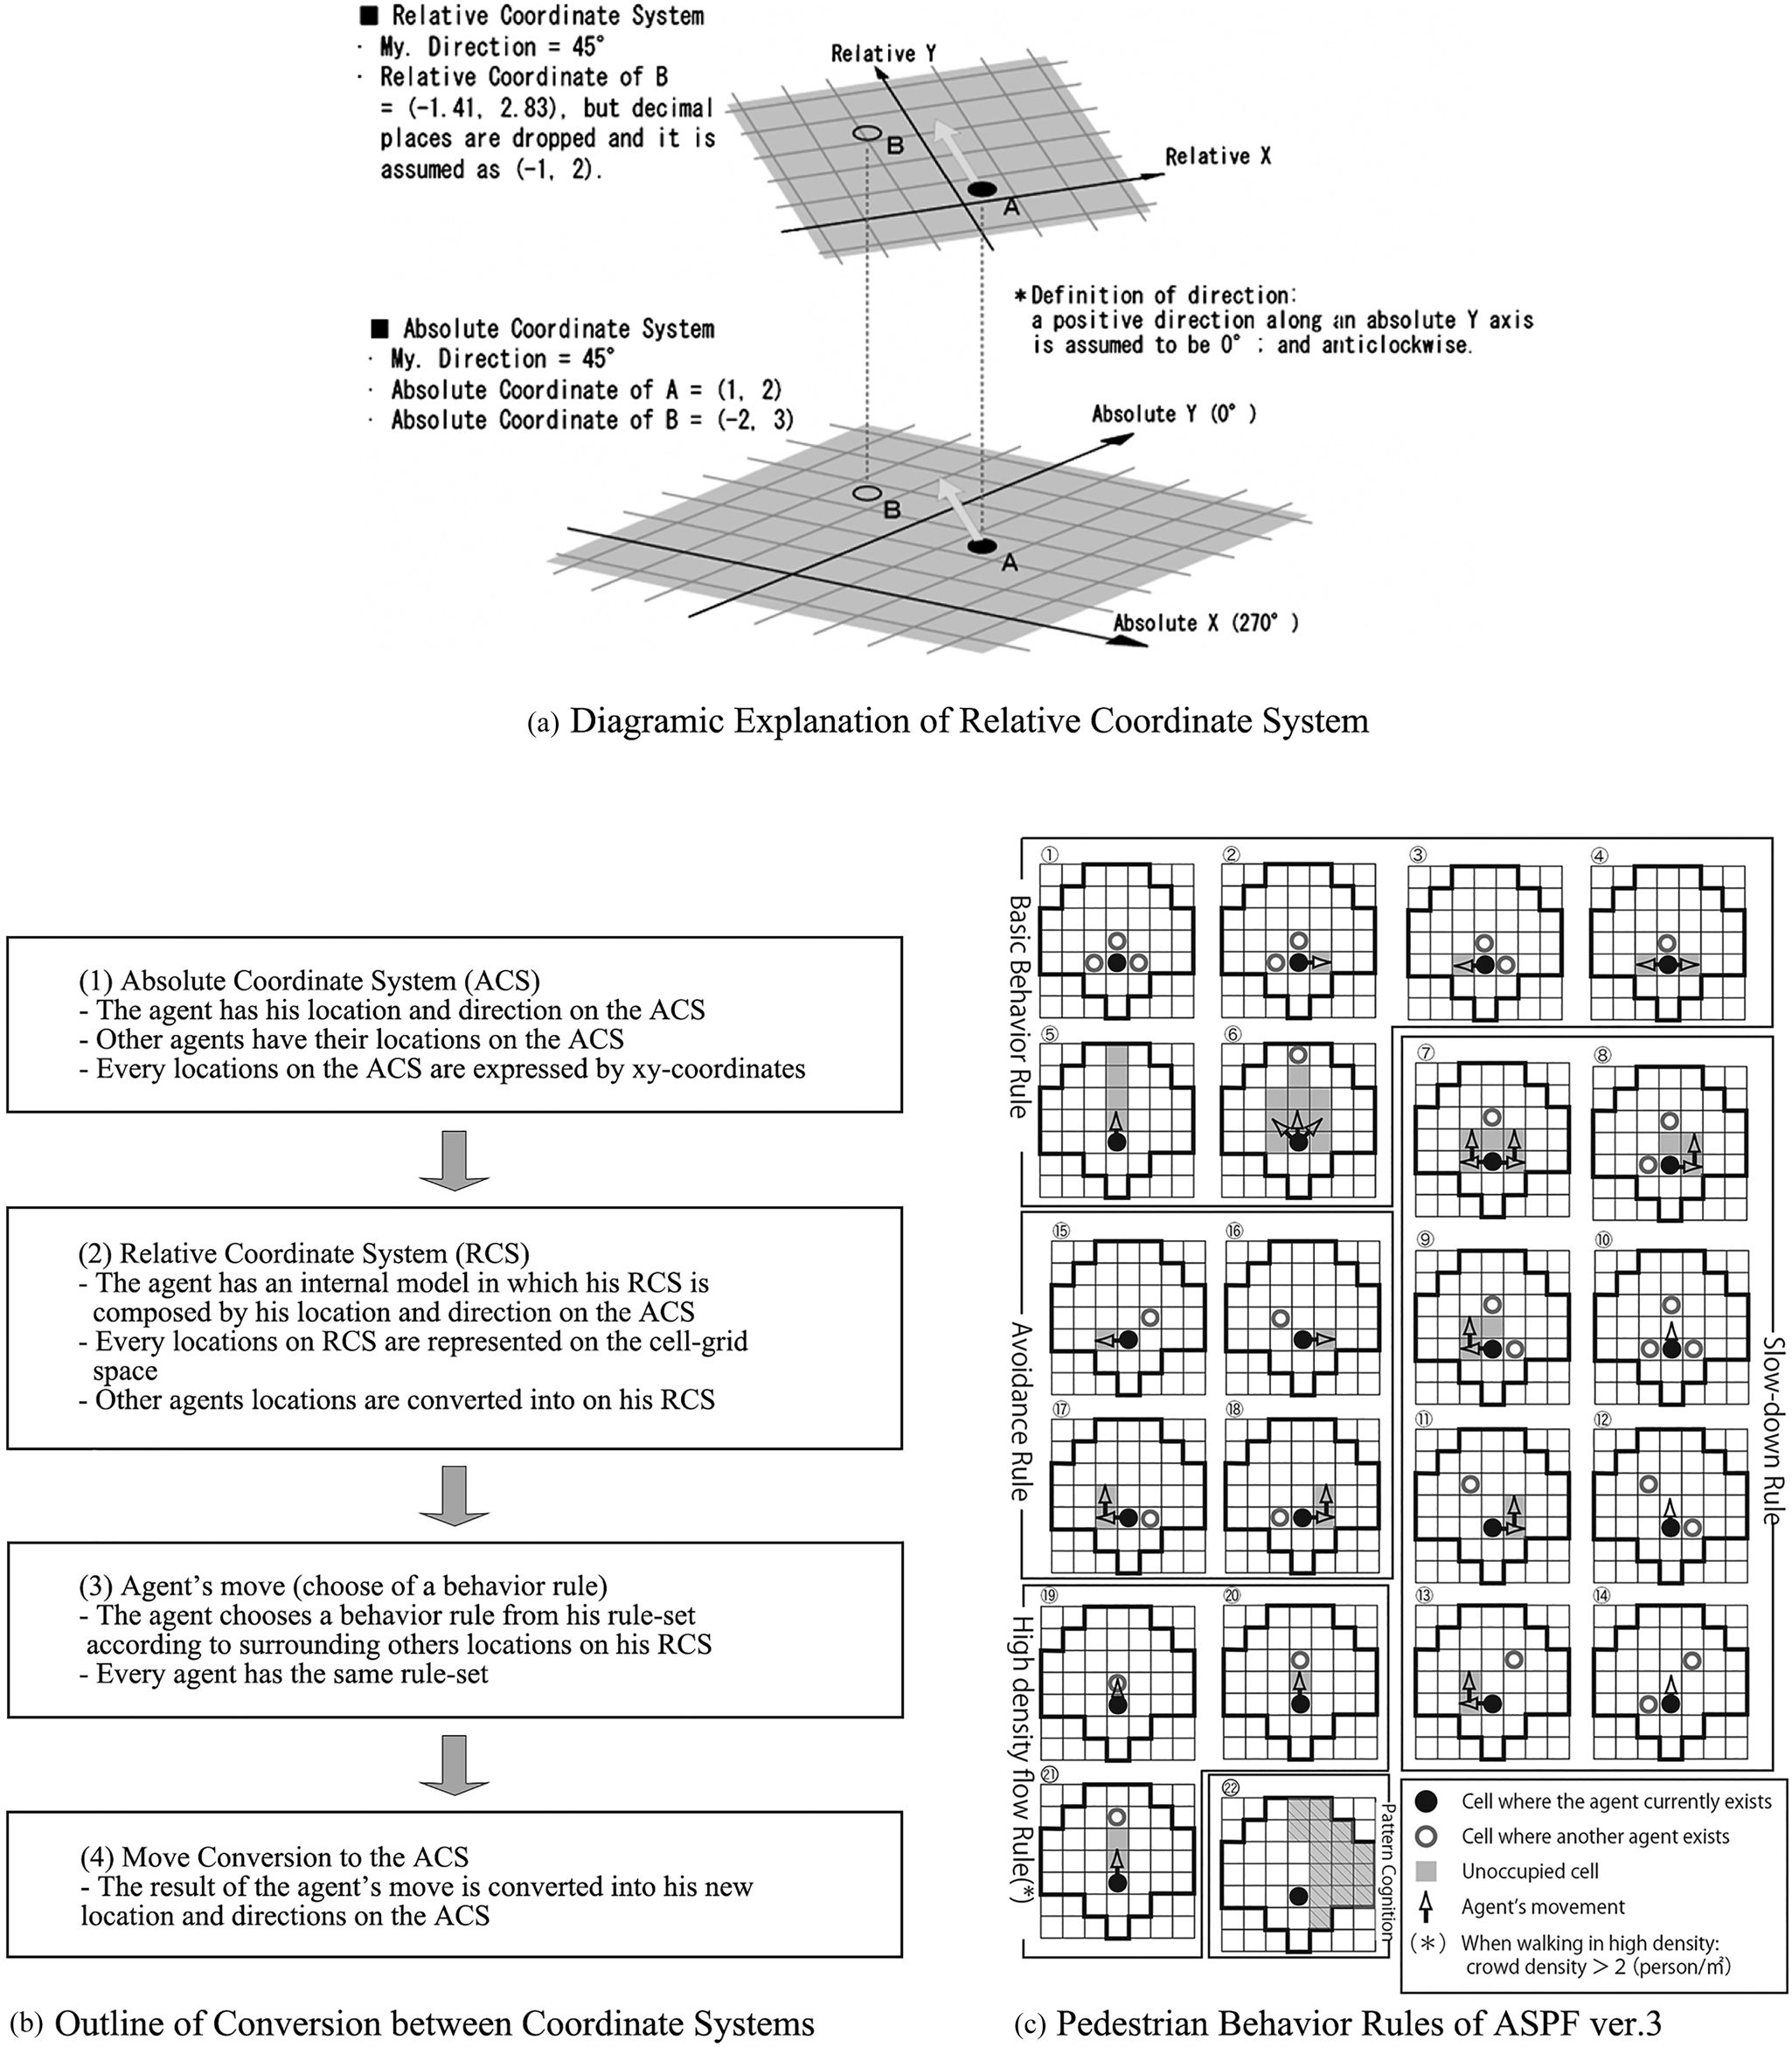
Agent Simulator of Pedestrian Flows (ASPF), developed by Kaneda and others, is introduced as behavioral rules in this model. ASPFver.4.0 has a total of 36 rules: 6 basic behavior rules, 8 slow-down rules, 4 avoidance rules, 3 high-density flow rules, 1 pattern cognition rule, and 14 wall avoidance rules. In each step, each agent selects one rule from the ASPF ruleset by following the given priority order. Rule explanations and adaptation priorities are shown in Table 3 and rule illustration is shown in Figure 5c. ASPFver.4 added wall avoidance rules based on ASPFver.3. More complete descriptions and figures can be seen in Kaneda (Reference Kaneda, Waldau, Gattermann, Knoflacher and Schreckenberg2007), Kaneda and Okayama (Reference Kaneda, Okayama, Terano, Kita, Deguchi and Kijima2007), Kaneda and He (Reference Kaneda, He, Terano, Kita, Takahashi and Deguchi2009), and Kaneda et al. (Reference Kaneda, Yoshida, He, Tamada, Kitakami, Klingsch, Rogsch, Schadschneider and Schreckenberg2010).
Explanations of ASPF rulesets and rule adapt prioritiesa
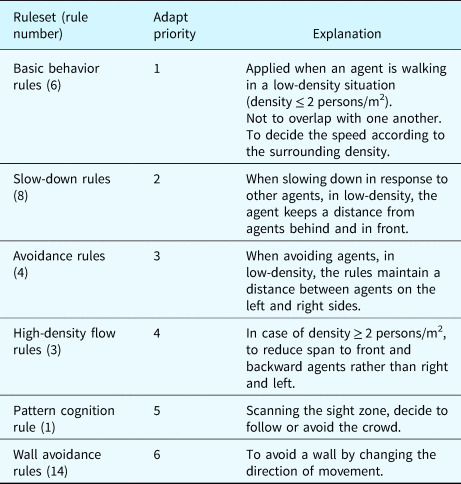
a Detailed explanations and figures see Kaneda (Reference Kaneda, Waldau, Gattermann, Knoflacher and Schreckenberg2007), Kaneda and Okayama (Reference Kaneda, Okayama, Terano, Kita, Deguchi and Kijima2007), Kaneda and He (Reference Kaneda, He, Terano, Kita, Takahashi and Deguchi2009), and Kaneda et al. (Reference Kaneda, Yoshida, He, Tamada, Kitakami, Klingsch, Rogsch, Schadschneider and Schreckenberg2010).
The ASPF model essentially is implemented as a stochastic simulation model. Even though the adaptation of rulesets is sequential, there are three ways that use random numbers in the model:
- A random number will be compared with the generation rate per step in each generation object in the simulation to decide if an agent will be generated. This ensures that the appearing rate of the agents to the simulation map is not uniform;
- The right/left direction turn of agents in ASPE rules is random with 50:50;
- The updating order of moves of each agent within each simulation step is random sequential in artisoc.
With the capability of the absolute coordinate system and the 0.4 m cell-grid space in the current model, density under 6.25 persons/m2 can be calculated accurately. Because of the application of the relative coordinate system, density above 6.25 persons/m2 can be simulated. However, since the current model does not consider body deformation in high density, the density values higher than 6.25 persons/m2 are simply listed as trends.
The output of each simulation includes the local density of five density measurement areas, the pedestrian agent number in the map, total pedestrian entry number, and total pedestrian exit number.
Evaluation criteria
Five measurement areas are set, as can be seen in Figure 6a. The actual accident spot was on the ground in front of the stairs, which is the key density area this research is focusing on, and has been set as measurement area K. The areas that are close to the key density areas in the north and south were set as measurement areas N1, S1 and N2, S2. The measurement areas are all squares and have the same width as the staircase. The density in N1 and S1 will directly tell if the density in the key area has a trend to extend, while the density in N2 and S2 will show if the areas around the bottleneck area are sufficiently utilized. The scaled density in Chen Yi Square is not measured because a large portion of it will not be accessed by pedestrians, as can be seen from Figure 2.
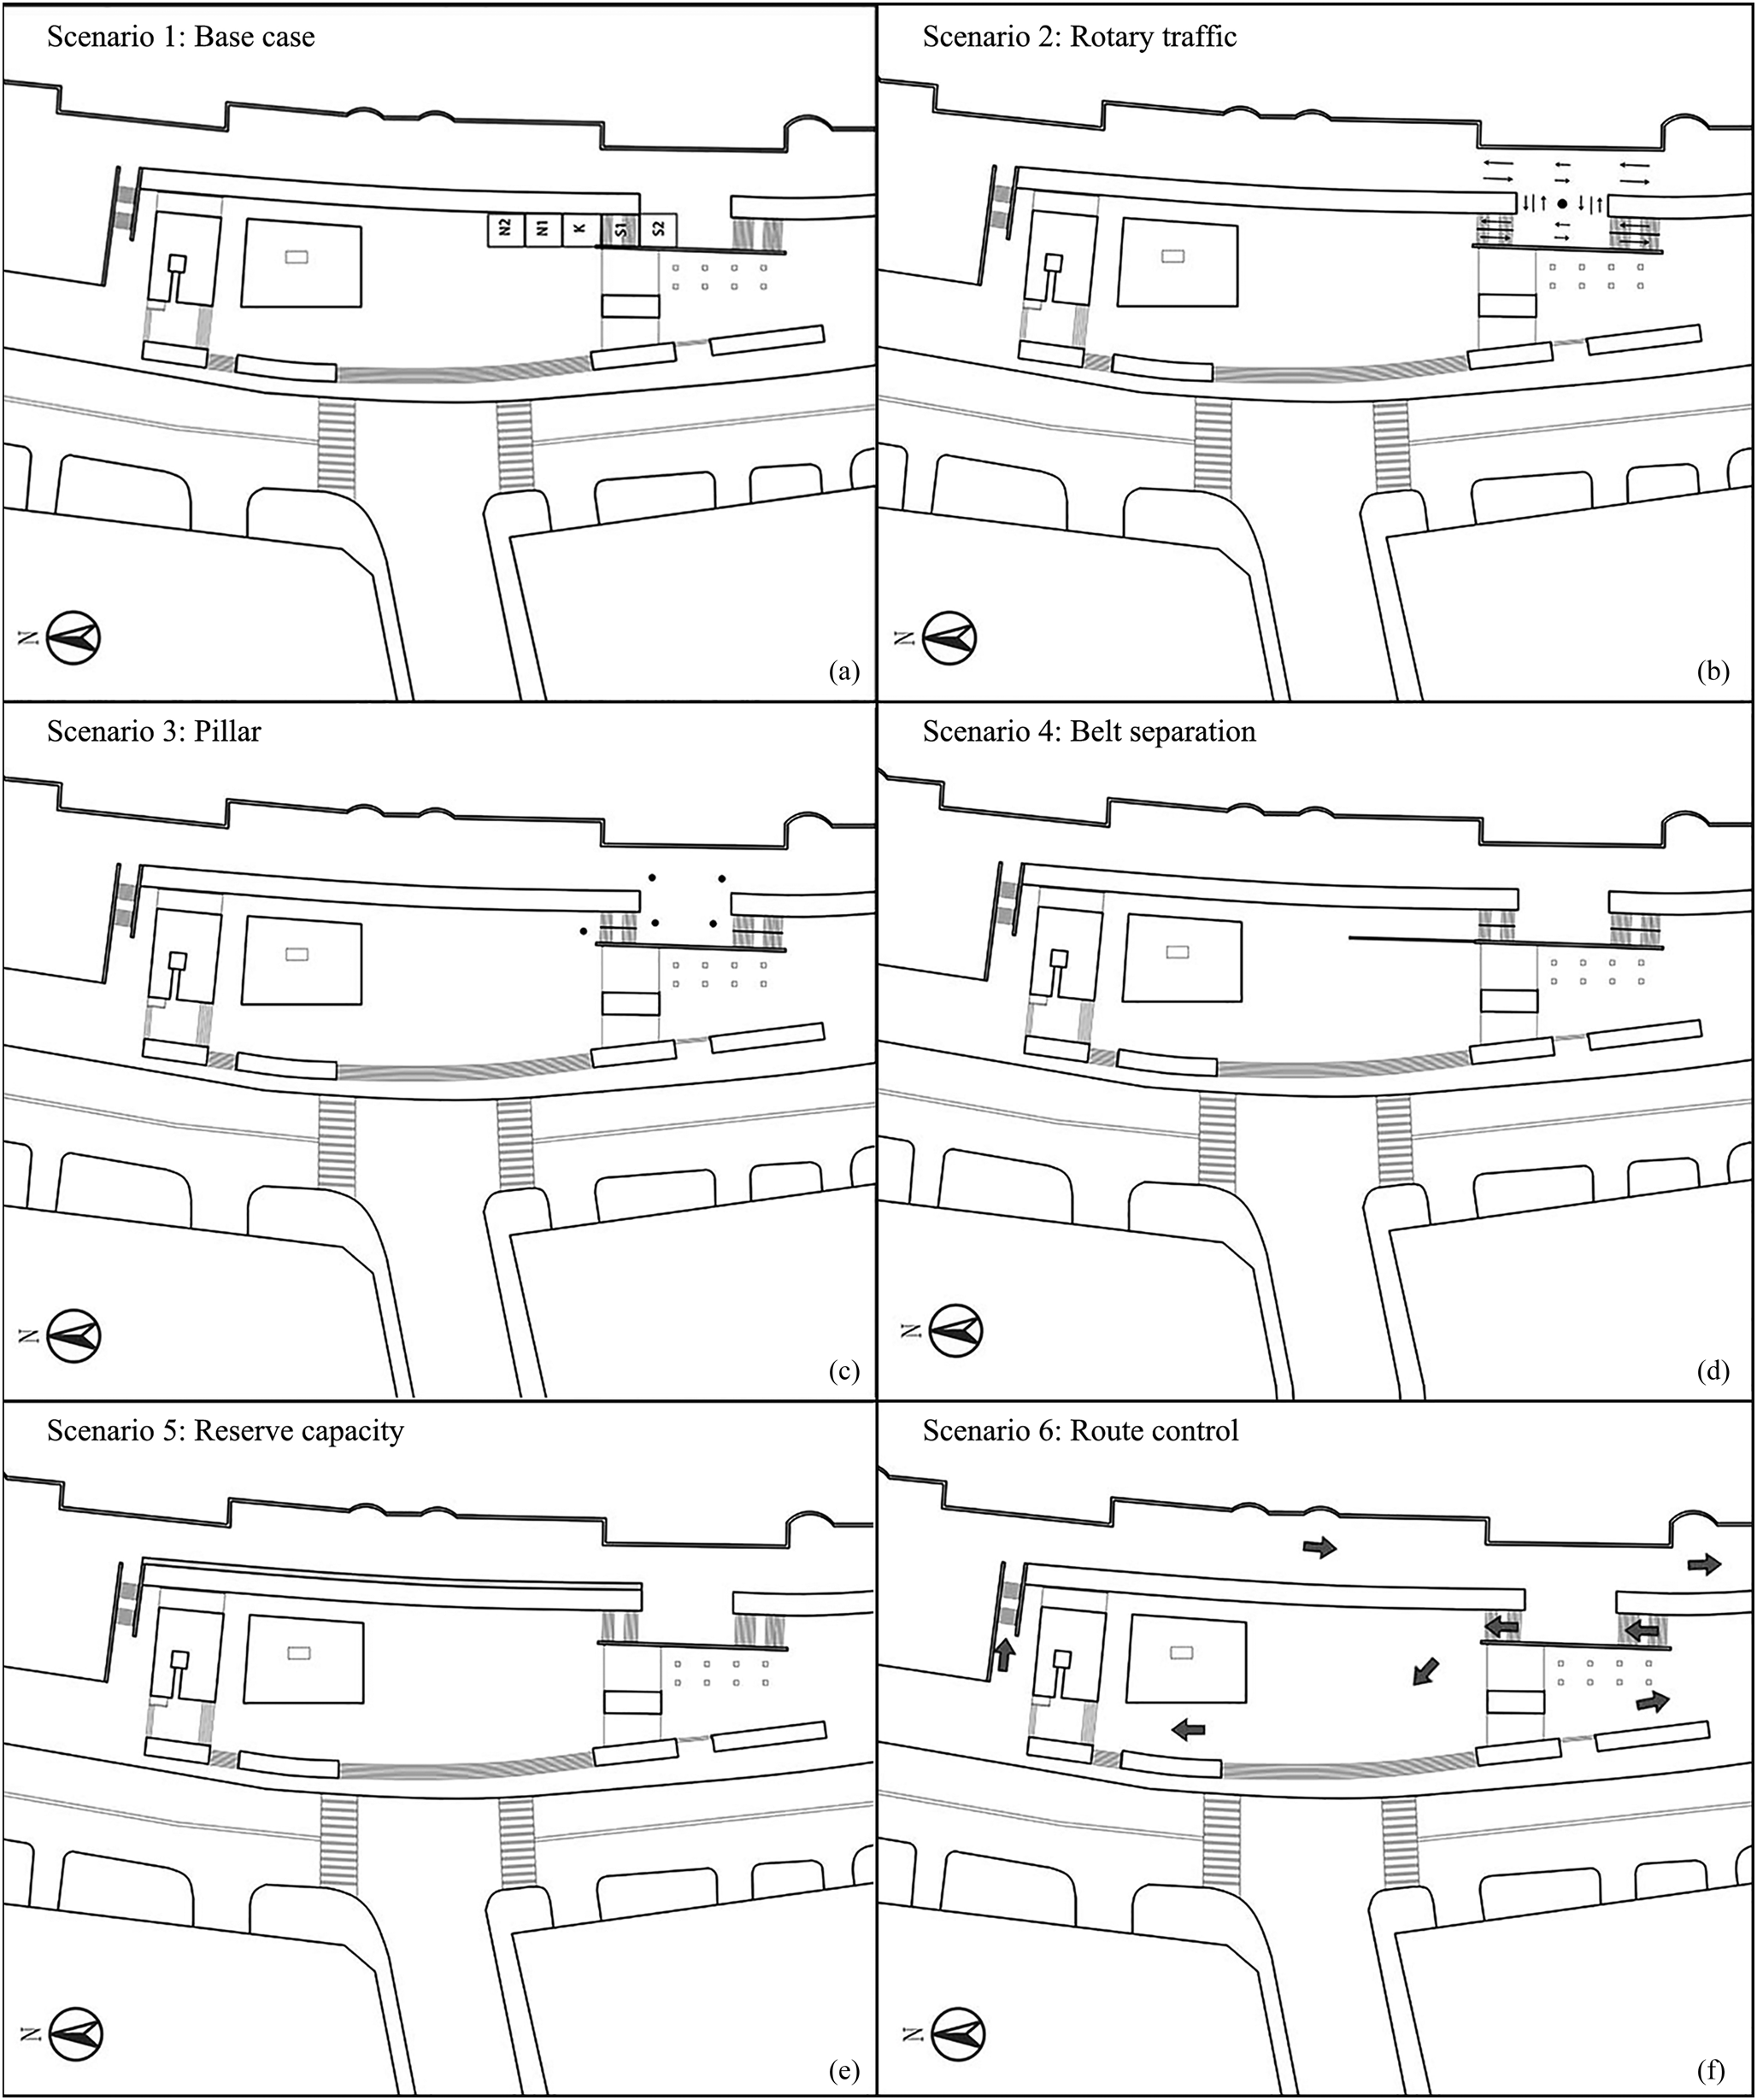
Scenario settings ((a) the original space layout in 2014, (b) use separation facilities to form rotary traffic, (c) add pillars to divide pedestrian traffic, (d) add belt separation facilities after the crowd accident, (e) set the capacity reserve area along the viewing platform, and (f) the route control plan implemented after the crowd accident).
Before examining different space layout and management plans, evaluation criteria needed to be identified. Fruin has defined the comfort and safety standards for crowd gathering in public places and established a LoS concept for horizontal roads and stairs, as shown in Table 4 (Fruin, Reference Fruin1971). In LoS standards, when the density is above 0.7 persons/m2 on horizontal roads and 1.1 persons/m2 on stairs, the free walking speed cannot be guaranteed and conflicts are possible. The body template Fruin chose, which covered 95% of an adult male's body size, is questioned as too loose and not suited to high-density environments (Still, Reference Still2000). Moreover, the LoS stops in service level F, at 2.5 persons/m2, but the pedestrian movement does not stop and the density will continue to increase, which makes the risk of the high-density pedestrian movement far exceed the measurement of LoS.
Relationships between the pedestrian status and density in LoS
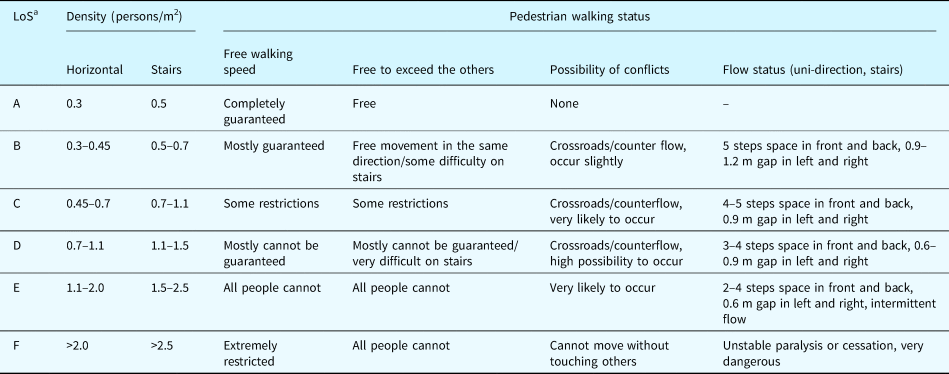
a LoS: Level-of-Services concept developed by Fruin (Reference Fruin1971).
By comparing different research, when the crowd density is less than 1 person/m2, the pedestrian walking speed is close to free walking; when the crowd density is close to 3 persons/m2, the highest flow rate is achieved and the pedestrian walking speed gradually slows down; when the crowd density is close to 4 persons/m2, the pedestrians slowly move forward and congestion gradually forms (Japanese Architecture Society, 1980). The ability of the human body to withstand stress depends on chest pressure. From the research of Okada (Reference Okada2011), people start to feel constant pressure at a density of approximately 7 persons/m2.
To facilitate the later analysis, the density lower than 1 person/m2 is considered to be the free walking stage, the density between 1 and 3 persons/m2 is considered to be the density accumulation stage, and the density between 3 and 4 persons/m2 is considered to be the congestion-forming stage, while with a density above 4 persons/m2, a crush condition may potentially occur and is considered to be the high-risk stage.
Scenario development
This section develops six scenarios, including the original Shanghai Bund space layout in 2014, three designs with different separation facilities, one plan with the reserve capacity, and one management plan with proper route control measures, as can be seen in Table 5 and Figure 6. All the scenarios share the same variables and parameters with different waypoint network settings.
Simulation scenario settings
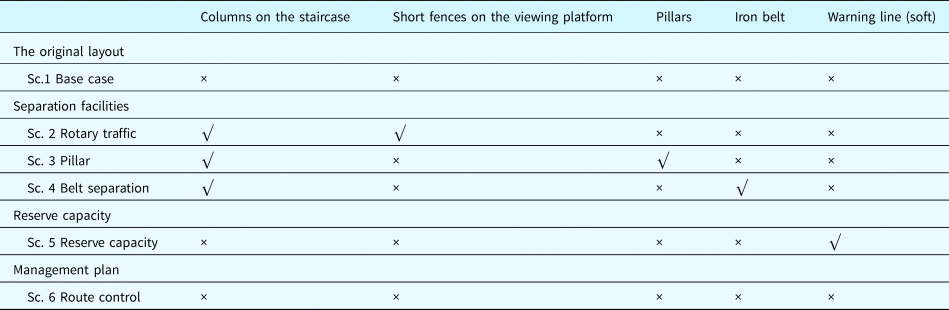
(Sc. 1) Scenario 1: base case
The original space plan is set as the base case, as shown in Figure 6a. The staircase has no column to divide the up and down pedestrians. The density will be measured in area K and four density spread zones as well as in each scenario.
(Sc. 2) Scenario 2: rotary traffic
Research has shown that when two pedestrian streams intersect each other, pedestrian streams will form stripes to facilitate the movement of both sides. However, when three or more flow directions intersect, there will be chaos rather than any kind of stripes (Helbing et al., Reference Helbing, Buzna, Johansson and Werner2005). As can be seen from Figure 2, the survey shows many pedestrian streams in different directions meet on the square platform on top of the stairs. Scenario 2 aims to form rotary traffic to avoid congestion, as shown in Figure 6b. A few short fences are added to divide pedestrians from different directions.
(Sc. 3) Scenario 3: pillar
Research has shown that in evacuation experiments, the arching phenomenon is observed because everyone tends to move faster. When an obstacle is added in front of the exit, the evacuation speed increases. Pillars can also be considered to have a similar function to conventional wave breakers and absorb pressure in the crowds (Helbing et al., Reference Helbing, Buzna, Johansson and Werner2005). To examine if adding obstacles to divide pedestrian flows is useful in the open space as well as evacuation experiments, scenario 3 situates five pillars in the positions where congestion easily forms, as shown in Figure 6c.
(Sc. 4) Scenario 4: belt separation
After the accident, expandable iron fences were added in the position shown in Figure 6d and stone divisions were added on the staircase to divide up and down pedestrians. This design improvement directly blocked the funnel shape of pedestrian flows in front of the staircase. This scenario is set to examine the crowd safety performance of the current space layout, as shown in Figure 6d.
(Sc. 5) Scenario 5: reserve capacity
Management experience of the Hajj shows that the reserve capacity in locations where pedestrians easily accumulate and opening the space when the crowd situation is growing risky will be a solution (Al-Kodmany, Reference Al-Kodmany2013). The capacity reserve area can also be designed to combine with an emergency aid route. In the few days after the accident, a reserve capacity area with a width around 2 m was set along the green belt on the viewing platform, as shown in Figure 6e. The evacuation route function is unquestioned; however, this area is relatively far from the congestion area and the ability to lower the crowd density is still under testing. In this scenario, the fences of the capacity reserve area disappear at the 900 second mark, which is half of the simulation period.
(Sc. 6) Scenario 6: route control
Scenario 6 set more proper route control measures compared to other design improvements, as shown in Figure 6f. The visitors are led to the north staircase to go up to the viewing platform, while the south staircase where the accident happened is only used by visitors going downwards.
Results and discussion
As previously mentioned, the surveyed visitor data considered to be a safety coefficient were input into the simulation models from one to four times to examine the crowd performance. Considering the stochastic character of the simulation model, each scenario was run 20 times to achieve a 95% confidence interval. One simulation step was set as 0.5 s and each simulation was run for 1800 s.
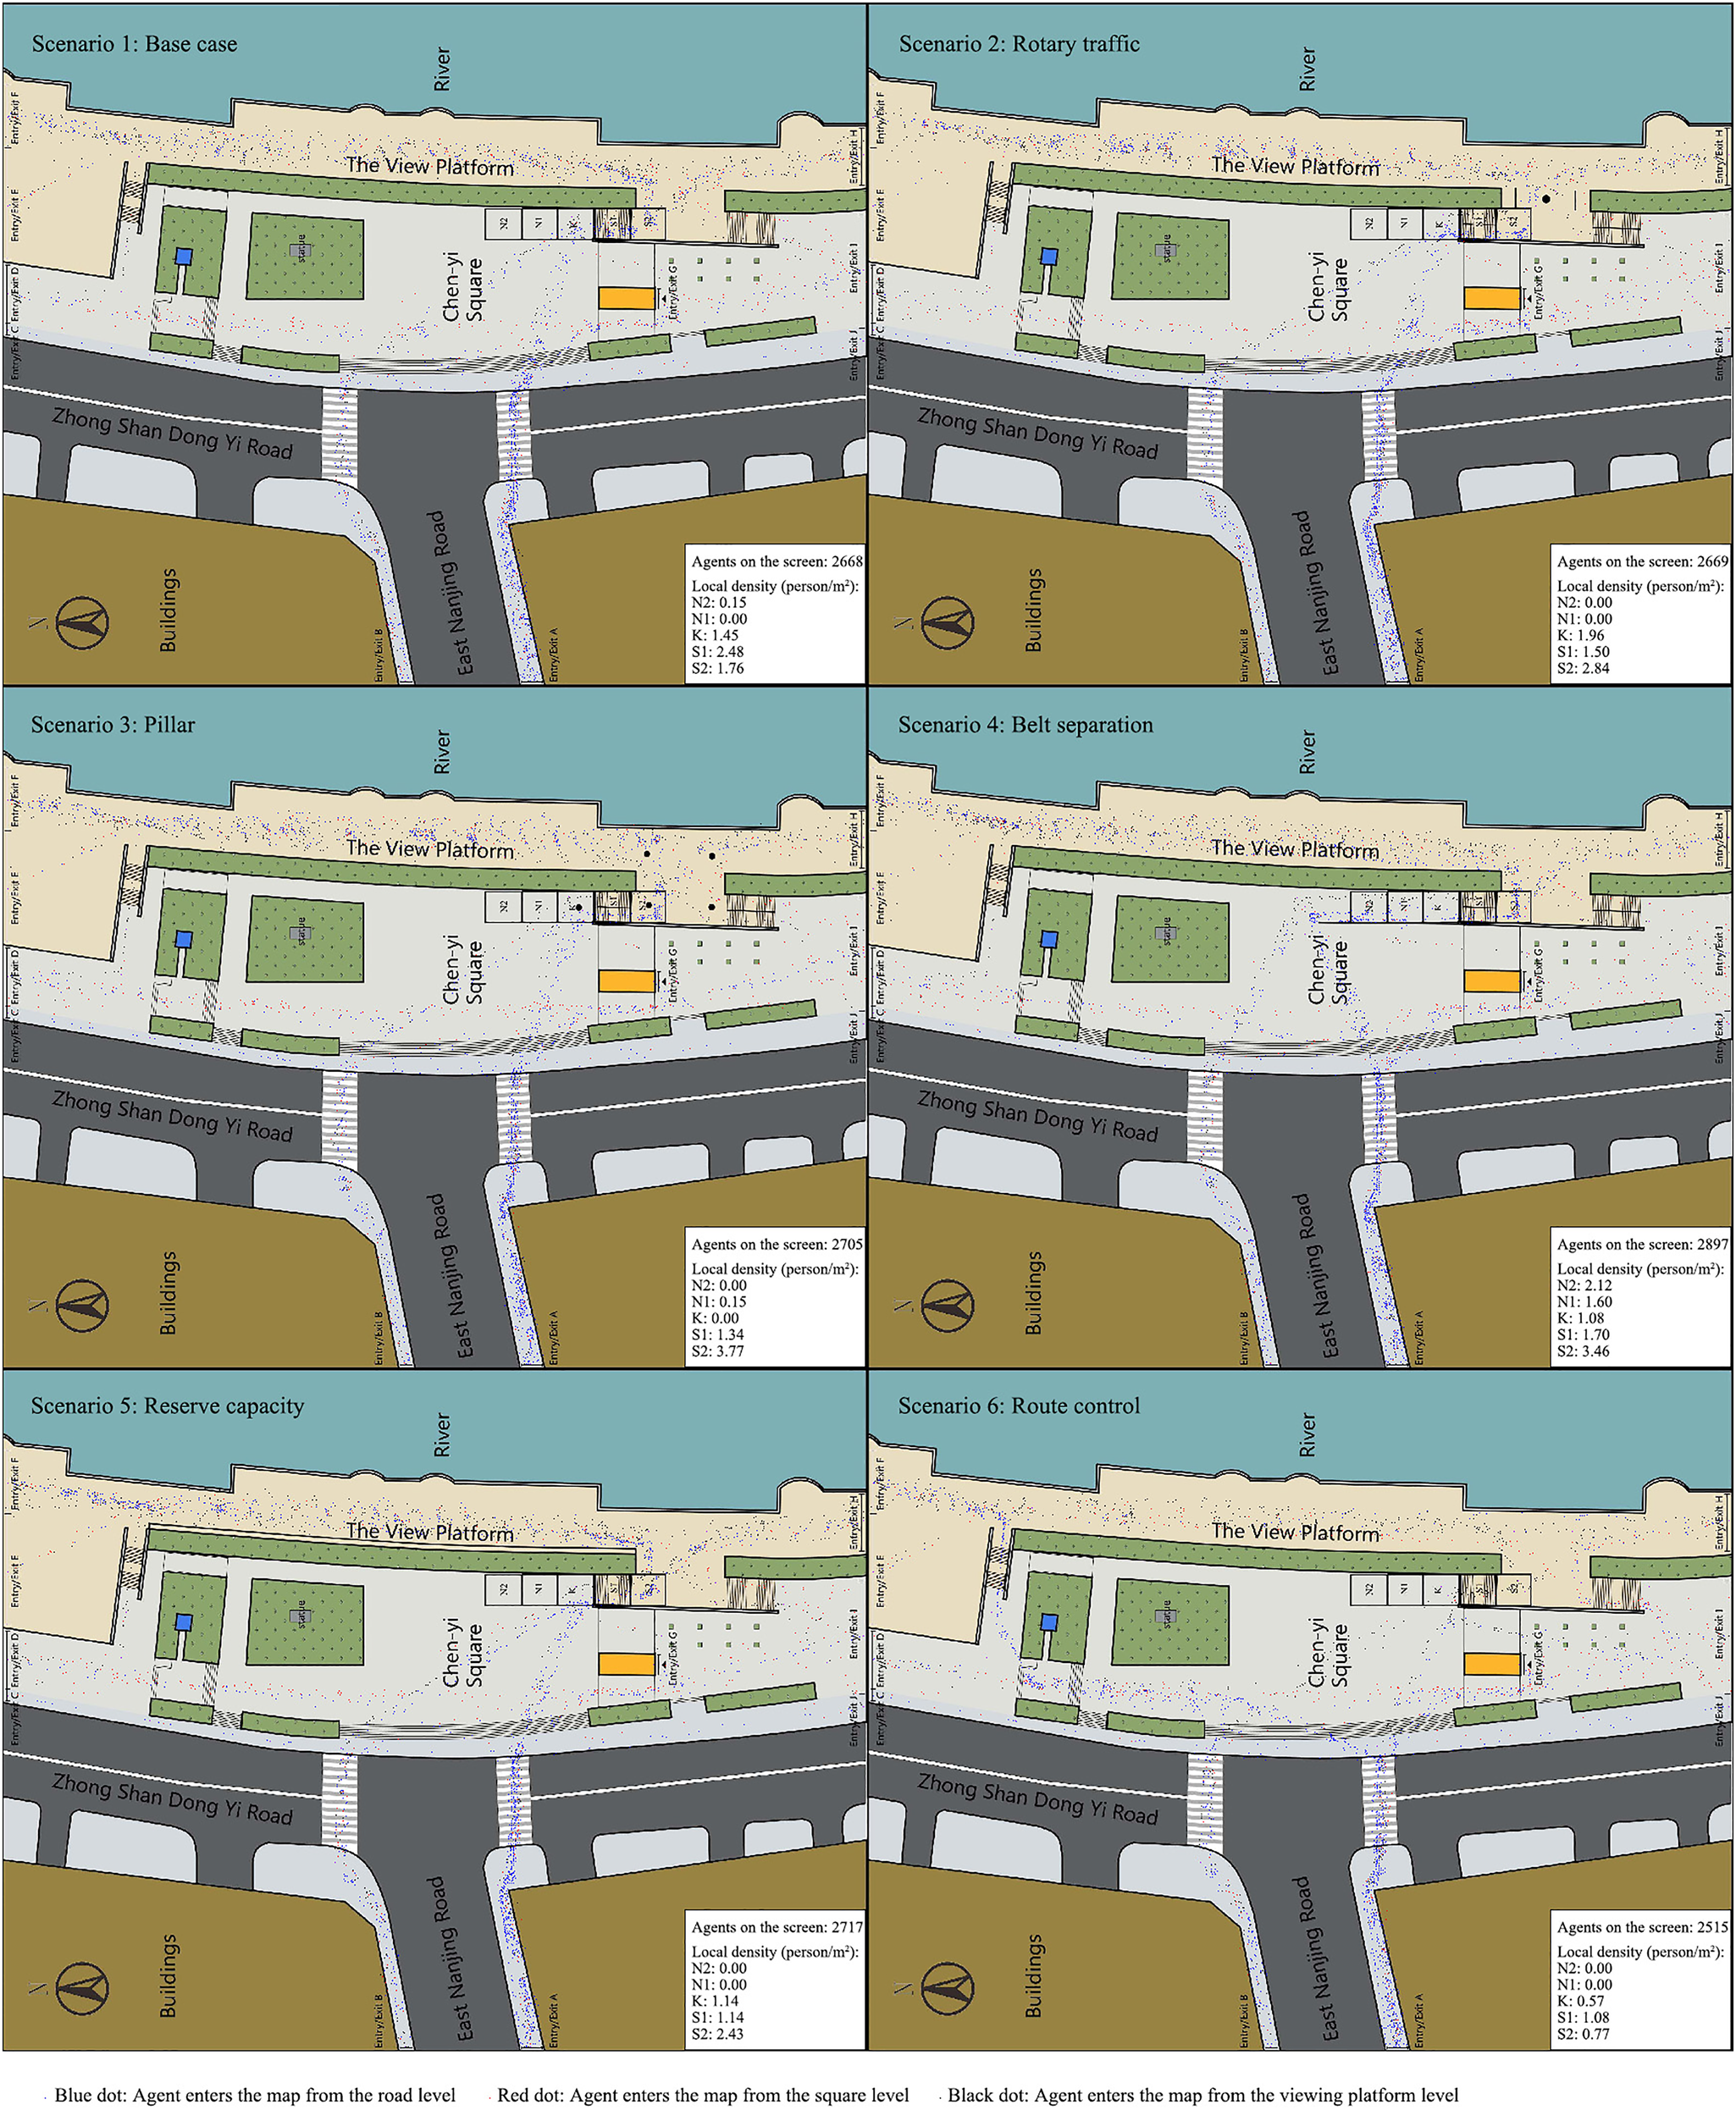
Figure 7 shows the snapshots of simulations run at twice the surveyed pedestrian flow-in value of each scenario. When the simulation ends, there are a different number of agents left in the simulation map caused by different congestion levels and different route choices. A space that has a higher passing ability is relatively safer. The average visitor number results are shown in Table 6 as a reference.
Snapshots of simulations in two-times surveyed pedestrian flow-in value in different scenarios.

The local densities are analyzed, and according to four stages, we divided in the evaluation criteria section: free walking stage (lower than 1 person/m2), density accumulation stage (from 1 to 3 persons/m2), congestion-forming stage (from 3 to 4 persons/m2), and high-risk stage (above 4 persons/m2).
Figure 8 shows the simulation results of the local density by measurement areas and it is easy to compare the density value. The density areas are: (a) N2 and N1 areas, the space in front of the accident area; (b) K area, to see the density of the accident area; (c) S1 area, to see the density on the staircase; and (d) S2 area, to see the density on top of the staircase, which is the platform.
Local density simulation results shown by density measurement areas.
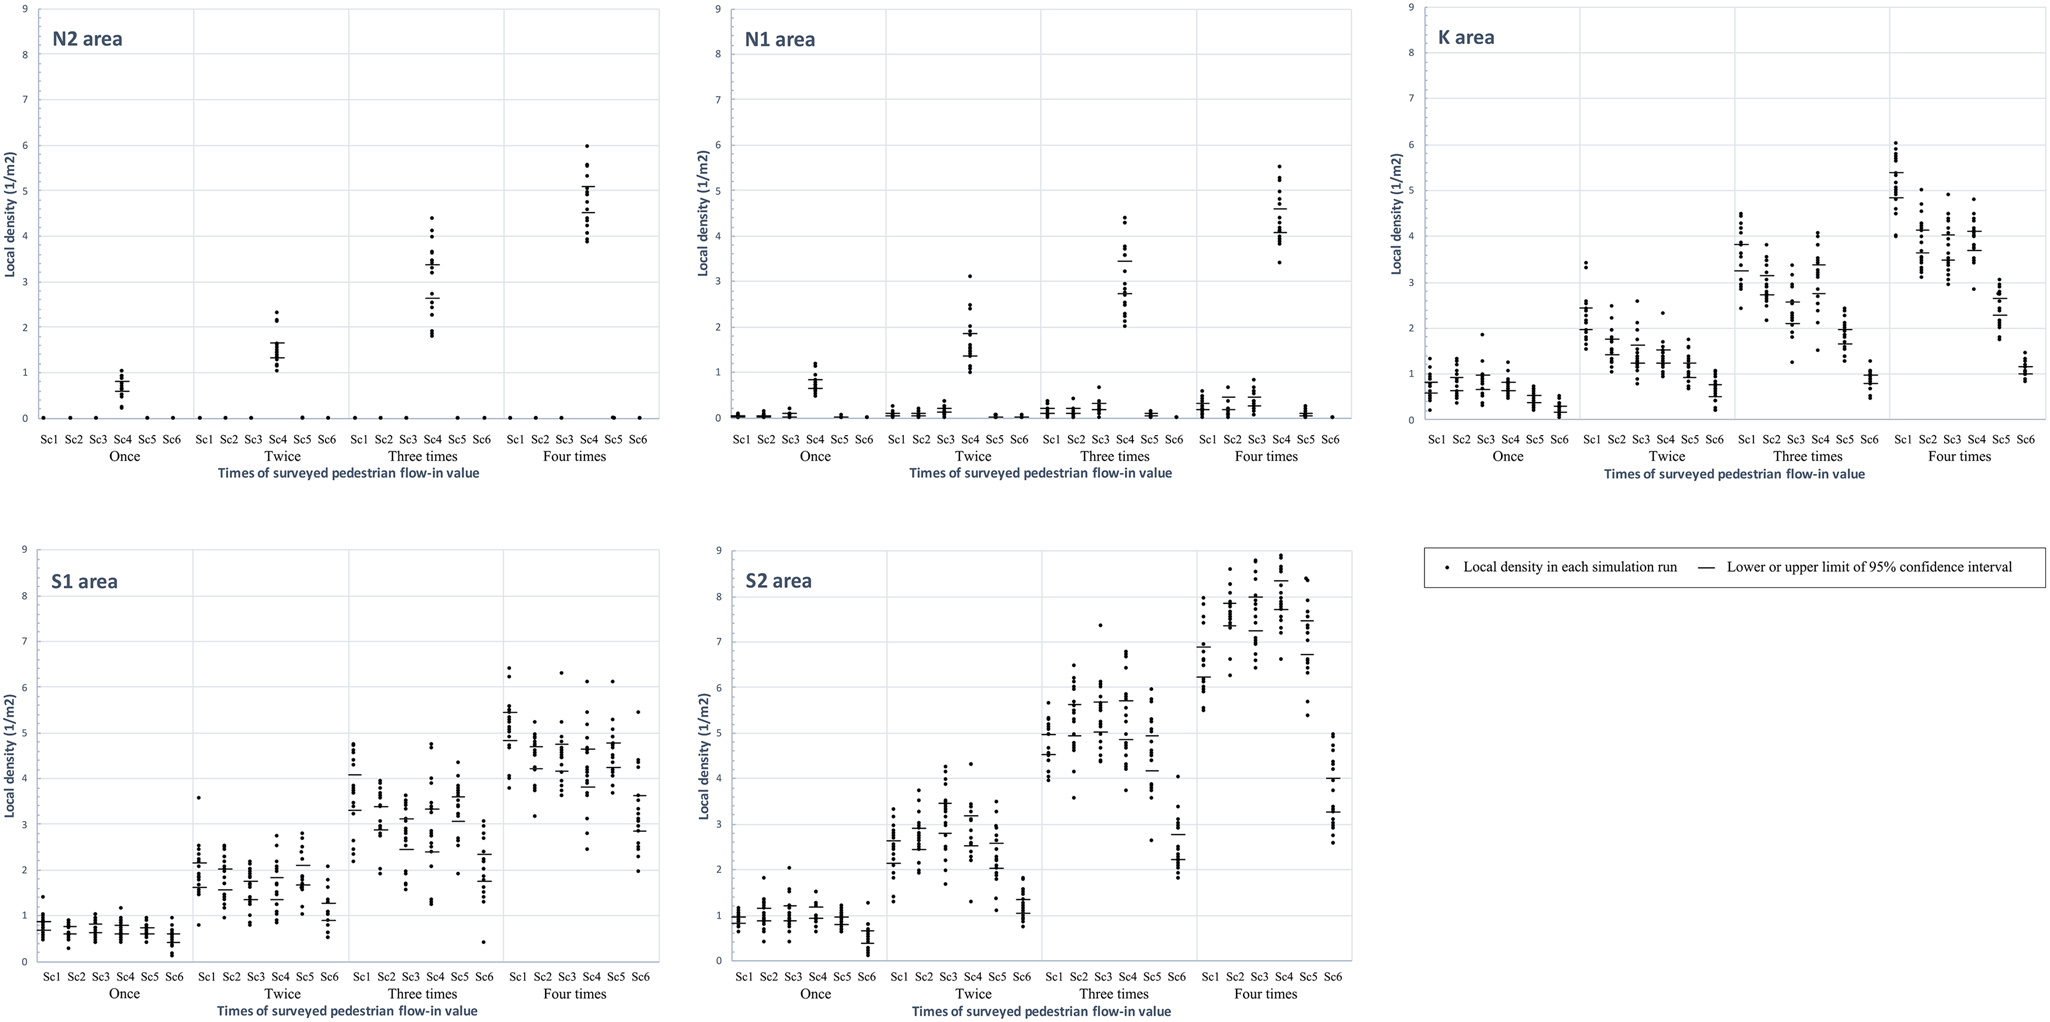
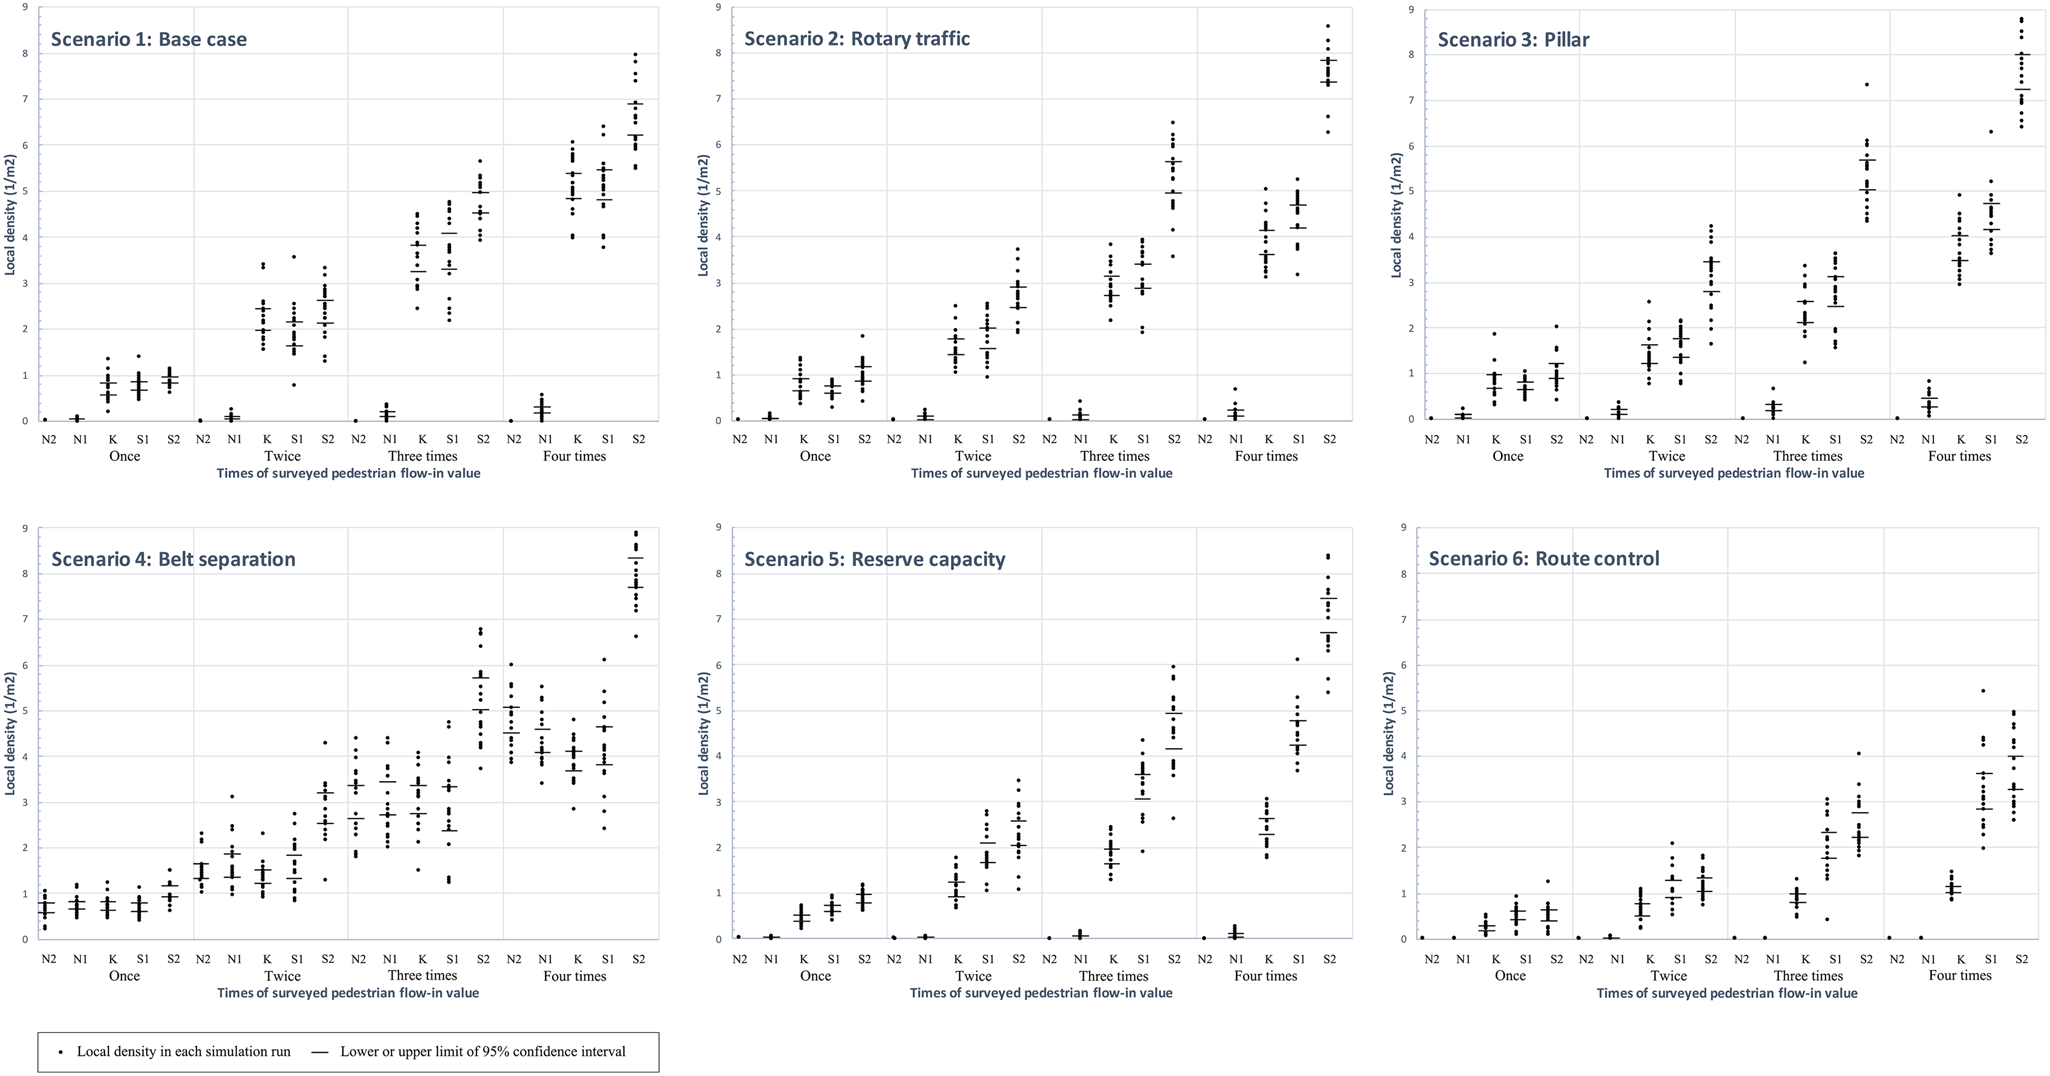
Figure 9 shows the results by scenarios and it is easy to compare the density difference around the accident spot. The focused density differences are: (a) N2, N1, and K areas, to see if the areas in front of the accident areas are fully applicable as density release areas; (b) K and S1 areas, to see if pressure comes from the lack of balance in front of the staircase; and (c) S1 and S2 areas, to see if pressure comes from the congestion on top of the stairs.
Local density simulation results shown by scenarios.
From Figure 8, we can see that:
In N2 and N1 areas, belt separation (Sc. 4) is the only scenario that stopped the funnel shape of pedestrians in front of the staircase. While in other scenarios, N2 and N1 areas are always in the free walking stage.
In the K area, all the scenarios reduced the density in the accident spot, as the flow-in value increased. The route control scenario (Sc. 6) as a management plan has the best ability to reduce the density in the K area, followed by the reserve capacity scenario (Sc. 5) and separation facility scenarios (Sc. 2–4).
In the S1 area, all the scenarios reduced the density on the staircase. The route control scenario (Sc. 6) as a management plan has the best ability to reduce the density on the staircase, followed by the separation facility scenarios (Sc. 2–4) and the reserve capacity scenario (Sc. 5). This differs from the figure of the K area, possibly because the capacity reserve area is too close to the congestion area on the platform.
In the S2 area, all the scenarios except the route control scenario increased the density on the platform on top of the staircase compared with the base case. This demonstrates that when adding hard facilities to separate the pedestrians, special attention should be paid to not making the already congested area worse.
From Figure 9, we can see that:
In Sc.1, the base case, the large density difference between N2, N1, and K means that they did not function as a density release area for the key location. The absence of a large difference between K and S1 areas means that the densities in front of and on the staircase are quite balanced. The density difference between S1 and S2 areas increases as the flow-in value grows. The high density accumulating on top of the staircase is possibly caused by chaotic flows coming from different directions and will lead to a downward pressure. When the people in front of the stairs can no longer sustain the pressure, someone will ultimately fall and will cause a domino effect. The video recorded by the media confirmed this inference (Nan-fang Metropolis Daily, 2015).
In Sc.2, rotary traffic, the density differences between N2, N1, and K are not as large as the base case. The density difference between K and S1 increases compared to the base case. The S2 area (platform) accumulated higher densities, which will lead to a higher downward pressure than the base case and makes the crowd situation even riskier. This scenario, designed to make the congestion area orderly, proved to be a risky solution.
In Sc.3, pillar, the density differences between N2, N1, and K are much lower than the base case. The density differences between K and S1 are larger than the base case, which will cause pressure from the lack of balance in front of the staircase. The S2 area (platform) accumulated a higher density than the S1 area compared with the base case, which will lead to a higher downward pressure and makes the crowd situation risky. The reason for this result could be that in evacuation experiments with pillars, occupants move in the same direction to the exit and the number of evacuees is limited, and the arching effect can be avoided in this way. In the open public space, visitors move in different directions and form more complicated congestion rather than an arch at the same time that new visitors keep flowing into the area. Along with the densities increasing, the pillar may increase congestion and the uneven distribution of visitors then cause fatalities.
In Sc.4, belt separation, more visitors are led to N2 and N1 areas and the densities in N2, N1, and K areas from one to three times flow-in value are quite balanced. The density difference between K and S1 is quite balanced within three times flow-in values. The S2 area (platform) reaches the congestion-forming stage and the high-risk stage first and increases greatly compared to the S1 area with three times the flow-in value. Comparing Sc. 2–4 shows that the density accumulates very quickly when the density is abover 4 persons/m2. No matter what the density release plan is chosen, crowds in the high-risk stage should not last long. The results of this scenario are a good combination of not overly high density on the staircase and a not overly large density difference between the top of the staircase and the front of the staircase. This shows that the current separation fences added after the crowd disaster make a positive improvement in the original space plan.
In Sc.5, reserve capacity, the density differences between N2, N1, and K are much lower than the base case. The density difference between K and S1 is higher than the base case, which may lead to downward pressure coming from a lack of balance. The density difference between S1 and S2 areas is getting higher than the base case, which will lead to a downward pressure coming from congestion on top of the staircase. There is no doubt that the current capacity reserve plan is functional to reduce over-density and is able to function as an emergency plan, but when deciding a location for the capacity reserve space, the already congested area should be avoided.
In Sc.6, route control, N2 and N1 are always in the free walking stage and the K area in front of the staircase maintains a stable low density at around 1 person/m2. All the areas are generally below 4 persons/m2. The density on the staircase (S1) and on top of the staircase (S2) mirror each other, which means that there is no obvious downward pressure.
In conclusion, in the Shanghai Bund crowd disaster, the reason for the accident technically may not have been caused by the upward and downward flows of the pedestrians on the staircase, but because the multi-direction flows meeting on the platform created a fatal downward pressure.
Compared with the ability of lowering the densities in crucial areas, like the staircase and the high-density mixed flow area, more efficient crowd management measures such as planning capacity reserve in advance (Sc. 5) and changing the route planning (Sc. 6) will have a better effect than design improvement measures. However, this does not mean that the design improvement should be neglected. The reasons for this are as follows:
- (Sc.1) Safety design utilizing computational simulation can help find the weakness of a space plan, which makes more proper crowd management planning possible. In this case, experts tend to consider the approximately 90-degrees relationship between the main stream from the subway and the Bund led to a contraction in front of the stairs, but the simulation results from Sc.1–5 show that the density on top of the stairs is the main reason leading to the accident.
- (Sc. 2) Even knowing that high-density flows are dangerous, in some mass-gathering and limited space environments, it is unavoidable. When making detour plans, increasing the congestion of the crucial area should be avoided. The best way is to always keep the density low in the first place.
- (Sc. 3) An improper detail in a high-density crowd can be fatal. In addition, the evacuation approaches should be subjected to adaptability testing before being applied in an open public space. For example, using pillars to divide crowds will increase the congestion and the instability of the crowds.
- (Sc. 4) It is also important to maintain a stable overall density. It can be very dangerous if a low-density area is located in a disadvantageous location, worse than having equally high density on both sides.
In the Shanghai case, the separation belt facilities added after the accident have been proved to be a positive improvement. Reserve capacity and route control measures can be applied as a management plan together with spatial improvement. Any stationary obstacles and stoppers in the areas where congestion forms easily should be avoided in high-density situations. Moreover, the conditions on top of the stairs should be monitored closely. When congestion forms in this area, the downward-moving pedestrians should be led to leave the viewing platform from the south exit to reduce the downward pressure on the stairs.
Conclusions
This paper presented research about improving the crowd congestion condition based on a previous crowd disaster site in Shanghai. An agent-based simulation model was built to make the analysis quantifiable, which made it easier to consider crowd science in urban space design. The test results revealed a different possible reason for the crowd disaster, which may have been caused by the congestion on top of the staircase instead of the contraction in front of it. By comparing the local density in each scenario, we generalized some common aspects that need to be avoided in public space design dealing with mass gatherings. However, the simulation examination is still necessary for specific public spaces dealing with specific crowds to discover the hidden risks. High-density crowds are a magnifier for hidden dangers in the urban space. Sometimes, with only a few separation facilities and a more proper crowd management plan, significant losses of life can be avoided. It also means that fatalities can happen because of minor improper design details.
The current model cannot consider the spread of force among pedestrians in high-density conditions, and this is the main reason why many current models are invalid for high density crowd simulations. In the future study, understanding the pressure inside crowds may be a way to better understand what space functions and facilities cities require. Moreover, due to the non-reproducibility and ethical issues regarding crowd accidents, the verification and validation of many crowd accident analyses still need to be improved.
Acknowledgements
This research is partially based on the research conducted as LIU's collaboration master thesis between Tongji University and Nagoya Institute of Technology. This research is sponsored by the China Scholarship Council, identification number: 201806260268 and Japan Society for the Promotion of Science, KAKENHI Grant Number: 18H03825.
Yuanyuan Liu is a Ph.D candidate of Urban Planning at Architecture and Design course in the Graduate School of Engineering at Nagoya Institute of Technology. She graduated from the Architecture and Planning School at Shandong Architecture University in 2015 and obtained one Architecture and one Engineering degree in a dual degree program between Tongji University and Nagoya Institute of Technology from 2016 to 2018. Her research interests cover the application of planning theories, crowd dynamic theories, agent-based simulation, and machine learning to support urban public space design, especially in high-density scenarios.
Toshiyuki Kaneda is a professor of Urban Planning at Architecture and Design course in the Graduate School of Engineering at Nagoya Institute of Technology. He graduated Planning School at Tokyo Institute of Technology in 1983 and had the degree of Engineering at Tokyo Institute of Technology in 1988. He was the President of Japan Association for Simulation and Gaming from 2011 to 2013. His research interests include planning theory, simulation and gaming and urban system analysis, and ABM. Especially in the recent two decades, he published over two dozen agent-based pedestrian modeling researches.


 Open access