


1. Introduction
Milk production has been the most important production line in Finnish agriculture in terms of value added. Although total milk production has been declining, dairy products have accounted for a significant share of Finland’s food exports. In 2024, the value of dairy product exports was €491 million, and the trade balance was positive (Jansik and Rosokivi, Reference Jansik, Rosokivi, Jansik and Rosokivi2025). Rapid structural changes have challenged also the Finnish dairy sector: the number of dairy farms has decreased, but the size of the remaining farms has increased (Niemi et al., Reference Niemi, Mikkola, Outa-Pulkkinen, Latvala and Niemi2025).
To remain competitive, farmers need to develop their production processes and adapt to a changing business environment. Competitiveness is underpinned by structural change, which is reflected in growing farms. As farm units get larger, new managerial challenges arise – more livestock, arable land, and employees mean that new management methods are required to ensure competitiveness, resource use efficiency, and profitability. As farms grow and employ more people, the demand for quality assurance grows (Stup et al., Reference Stup, Hyde and Holden2006) as in many other businesses using Lean as a management tool (Moyano-Fuentes and Sacristán-Díaz, Reference Moyano–Fuentes and Sacristán–Díaz2012). Lean can be seen as a system that supports the quality of production processes and minimizes waste, i.e., time or material (Shah et al., Reference Shah and Ward2007) and improving productivity (Krafcik et al., Reference Krafcik1988). Furthermore, reducing production costs is one of the most common motives cited by Lean adopters (Dora et al., Reference Dora, Kumar and Gellynck2016). Continuous improvement is an essential part of Lean, as kaizen offers a range of tools supporting this by challenging current practices (see e.g., Garza-Reyes et al., Reference Garza–Reyes, Kumar, Chaikittisilp and Tan2018).
In this article, we aim to answer the following questions: Which dairy farmers have adopted the Lean method or are interested in adoptiong it, and what benefits have those who have adopted it gained in the specific context of Finnish dairy farms? We explore the factors that affect Lean adoption and the experiences that Lean adopters have gained in the specific context of Finnish dairy farms. The motivation of our research is based on the fact that only a few Finnish dairy farms apply Lean principles for improving efficiency of their production processes although there is a high demand for productivity enhancing actions and Lean adoption has been supported within Finnish dairy system.
The present article has five sections: the second continues with a review of the current literature on Lean thinking and its use in agriculture; the third presents our own research data and statistical analyses; and the fourth presents the findings with a discussion. The fifth and final section draws some conclusions.
2. Literature review
In this section, we review existing literature on the concept of lean thinking and its application to management – particularly on farms. Lean Thinking relies back on Toyota Production System that is reported by Ohno at 1988 (see e.g., Barth et al., Reference Barth and Melin2018; Bittencourt et al., Reference Bittencourt, Alves and Leão2020). Later on, Womack and Jones (1996, ref. Bittencourt et al., Reference Bittencourt, Alves and Leão2020) developed the Lean Thinking philosophy that has five principles. These covers topics of value, value stream, pull production, flow, and pursuit perfection (Bittencourt et al., Reference Bittencourt, Alves and Leão2020, 1496).
Recently, there has been a growing interest in Lean thinking as it has shown to improve technical and economic performance. The review showed that there are a few articles on Lean thinking in the agricultural context. These explore Lean production methods, practices, and/or management – see e.g., Andersson et al. (Reference Andersson, Eklund and Rydberg2020), Barth and Melin (Reference Barth and Melin2018), Caicedo Solano et al. (Reference Caicedo Solano, García Llinás and Montoya-Torres2020), Carrijo et al. (Reference Carrijo, Rader and Batalha2024). Meanwhile, Hesse et al. (Reference Hesse, Bertulat and Heuwieser2017) studied the use of Lean management tools as a Standard Operating Procedure (SOP) for farms and Wesana et al. (Reference Wesana, De Steur, Dora, Mutenyo, Muyama and Gellynck2018) explored how they might be applied to waste management. Of the Lean tools, value stream mapping and it’s adaptions in agriculture, has been on the focus of studies by Carrijo et al. (Reference Carrijo, Rader and Batalha2024) and Andreazza de Freitas et al. (Reference Andreazza de Freitas, Hernandes de Paula e Silva and Aparecido Lopes Silva2025). Lean management practices supporting dairy farming management practices are evaluated by Nadeem et al. (Reference Nadeem, Lodhi and Malik2025). As early as in 2006, Stup et al. were studying how farms applied Lean thinking to manage their human resources, and Bettini et al. (Reference Bettini, Giorgeti, Cini and Citti2010) examined the combination of Lean with the Six Sigma management method. As farmers generally suffer from low income, solutions such as Lean are looking increasingly attractive, especially because most structural changes are taking the form of farms growing in overall size (Zimmermann et al., Reference Zimmermann and Heckelei2012). As they grow, larger herds and an increasing number of workers mean that farmers need to develop more advanced managerial skills (Hadley et al., Reference Hadley, Harsh and Wolf2002) and to become proficient in using the tools needed to run the farm profitably. These aspects contribute to acceptance and adoption of Lean.
In their research focusing on adopting Lean in Swedish farms, Barth and Melin (Reference Barth and Melin2018) revised three Lean philosophies used on farms: to reduce waste, increase customer value, and focus on the long-term perspective. The aim to reduce waste also makes Lean thinking very attractive to environmental business models (Barth et al., Reference Barth and Melin2018; Caldera et al., Reference Caldera, Desha and Dawes2017). The key, according to Shah and Ward (Reference Shah and Ward2007), is to take a different approach towards waste in general. It is not just physical waste that is being considered, but also the time spent on unprofitable work (i.e., looking for tools because you cannot find them). There is a range of waste sources such as waiting, unnecessary inventory, and defects (Hines et al., Reference Hines and Rich1997). Reducing waste like this increases customer value by focusing on the activities that will add value (Hines et al., Reference Hines, Holweg and Rich2004). Finally, long-term perspective describes a mindset of continuous improvement (Barth et al., Reference Barth and Melin2018). Continuous improvements can be followed with various measures as Belekoukias et al. (Reference Belekoukias, Garza-Reyes and Kumar2014) present after literature review. Most of the recognized measures are connected with the operational management, such as productivity, quality, capacity, and cost (ibid.). All these factors should work together to improve competitiveness through better productivity and lower unit costs, and to support business-units’ goals that are set in the strategy.
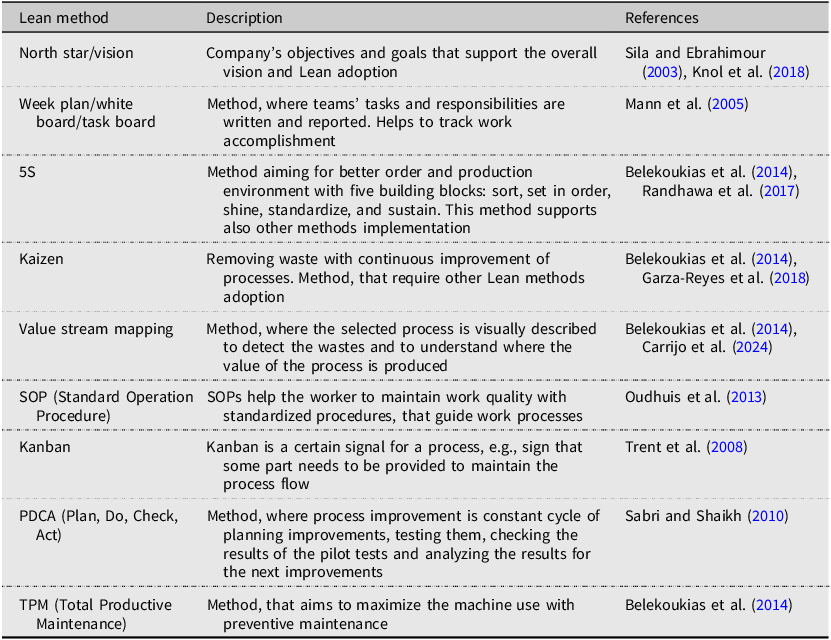
Moyano-Fuentes and Sacristán-Díaz (Reference Moyano–Fuentes and Sacristán–Díaz2012) have reviewed numerous Lean investigations that report improvements in business economics and operational performance, and Lean tools have been shown to help enterprises cope with sustainability goals and unit cost challenges at the same time (Caldera et al., Reference Caldera, Desha and Dawes2017). In this study, Lean users have adopted one or several of the following tools that are presented on Table 1.
Lean tools in this study

Table 1. Long description
The table compares various Lean methods, their descriptions, and references. It contains ten rows and three columns. The columns are labeled Lean method, Description, and References. The Lean methods listed include North star/vision, Week plan/white board/task board, 5S, Kaizen, Value stream mapping, SOP (Standard Operation Procedure), Kanban, PDCA (Plan, Do, Check, Act), and TPM (Total Productive Maintenance). Each method is described briefly, and relevant references are provided. Notable methods include 5S, which aims for better order and production environment, and Kaizen, which focuses on continuous improvement. The table provides a comprehensive overview of Lean tools used in various studies.
One way to improve a farm’s economics when it struggles with high unit costs is to make more efficient use of inputs. In accordance with Lean principles, waste is eliminated, and the overall cost of each unit’s production is brought down. In their research on German dairy farmers, Hesse et al. (Reference Hesse, Bertulat and Heuwieser2017) found that standard operating procedures (SOPs) improved work efficiency and consistency, as less variation between the ways employees performed their tasks meant they worked together better. Meanwhile in Sweden, Barth and Melin (Reference Barth and Melin2018) studied 34 farms with a range of agricultural production that had implemented Lean farm management practices. Improvements achieved with Lean were reported by 16 farmers who also participated in Lean audition. They reported some positive effects, such as improvements in the workplace environment, better work performance with constant routines, better animal health, and more efficient use of resources.
Despite its popularity, implementing Lean is not always rewarding (Dora et al., Reference Dora, Kumar and Gellynck2016) as it often requires demanding changes. There is always the risk of failure if a management ideology is adopted too soon and it proves to be inappropriate (Arlbjørn et al., Reference Arlbjørn and Freytag2013). Although some firms have adopted Lean thinking, they may have chosen only a few of the management tools rather than implementing the whole philosophy (Bhasin et al., Reference Bhasin2011). This gradual implementation, however, may help some managers overcome certain challenges in production processes that would otherwise arise with a full and sudden implementation (Dora et al., Reference Dora, Kumar and Gellynck2016).
We explore which socio-economic factors, general goals, and attitudes or values of farmers affect the likelihood of Lean adoption. In this analysis, we apply explorative factor analysis and binary regression models. In addition, we report the experiences of 25 farmers who have applied Lean on their farms.
3. Materials and methods
Quantitative survey data was collected via a questionnaire that was distributed during the first quarter of 2019. The Finnish dairy cooperative Valio made it possible to share the questionnaire with 5,200 Finnish dairy farmers via the coop’s intranet pages – i.e., most of the 5,744 dairy farms registered in Finland in 2019 (Natural Resources Institute Finland, 2026). Altogether we received 135 responses from dairy farmers.
In 2019, dairy farmers’ average age was 49 years (OSF, 2022a), and the average herd size was 41.3 milking cows per farm in 2018 (OSF, 2022b). The average annual milk yield was 8,650 kg per cow (Niemi et al., Reference Niemi and Niemi2019). In our sample, the respondents on average had more milking cows and higher average annual milk yield (9,946 kg per cow, see Table 2). Furthermore, the farmers of the sample were somewhat younger than average Finnish dairy farmers and 46% of them had at least Bachelor’s degree in agriculture.
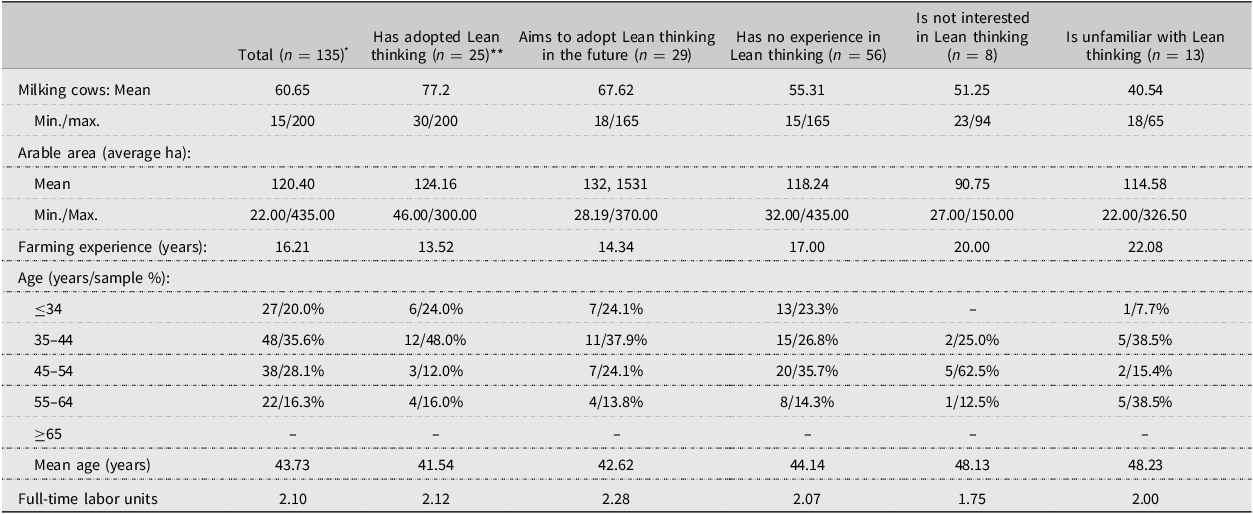
Descriptive statistics of farms and farmer characteristics divided according to lean adoption phase (n = 131, missing 4)
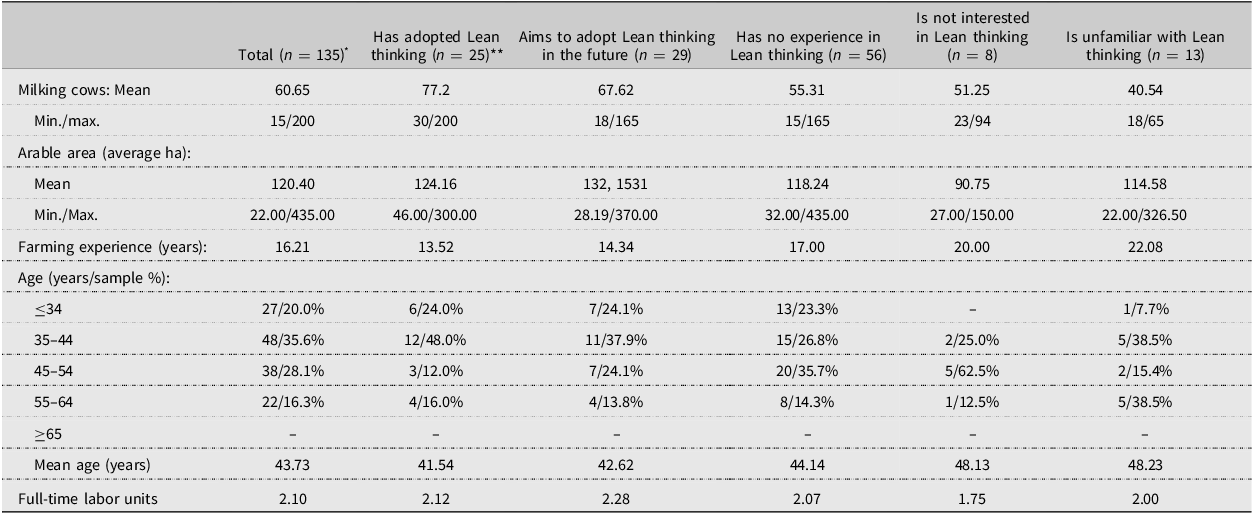
Table 2. Long description
The table presents descriptive statistics of dairy farms and farmer characteristics categorized by their phase of lean thinking adoption. It includes data on the number of milking cows, arable land area, farming experience, age distribution, mean age, and full-time labor units. The table is divided into columns representing different adoption phases: total, has adopted lean thinking, aims to adopt lean thinking, has no experience in lean thinking, is not interested in lean thinking, and is unfamiliar with lean thinking. Each column provides mean values, minimum and maximum ranges, and age distributions for the respective groups. Notable trends include variations in the number of milking cows, arable land area, and farming experience across different adoption phases. The age distribution and mean age also differ among the groups, with some phases showing higher average ages and different educational backgrounds.
*N = 135 is total number of observations, 4 responses did not report their experience of Lean. **This includes one response with Lean experience, however with giving up of Lean later-on.
Descriptive statistics for the overall sample and for Lean adoption phase categories are presented in Table 2. Of the 135 respondents, 25 had experience in implementing Lean practices. In addition to background variables, the survey collected data on farm’s development goals using binary scales. The survey continued by exploring the attitudes a and values. Lean adopters were asked the reasons for adopting Lean thinking and their experiences of Lean on a Likert scale.
The survey did not contain any identification information such as name, farm’s name, farm’s identification code, address, village etc. that could reveal the respondents. Furthermore, the aim of the study and the use of the survey data were described in the survey’s cover letter.
Despite the obvious limitations of this data, the sample is nevertheless interesting from the perspective of Lean adoption. Respondents were on average younger than most Finnish dairy farmers, which may indicate they are more future-oriented. As the business grows, farmers need to systematize management, and Lean is one option. To gain a better understanding on the structure of the data, we looked at differences in background variables between the adoption phase categories. These are presented in Table 2 and show slight differences between farmer and farm characteristics in relation to their interest towards Lean.
For later binary analysis, the original data from Table 2 was split into two categories. A new dummy-variable, Lean adoption, was created with the value of 1 representing all farmers who have adopted, or aim to adopt, Lean thinking in their farm management, while 0 was assigned to all the other categories describing varying degrees of non-adoption.
Given the importance of values in decision-making, we explored how they might explain respondents’ motives for adopting Lean management at the farm level. To identify latent variables underlying reported values, we applied explorative factor analysis (EFA) (see Field et al., Reference Field2018). Similar survey questions have been used in farm management studies to measure latent factors of risk management, farm development, and farmers’ values (see e.g., van Winsen et al., Reference van Winsen, de Mey, Lauwers, Van Passel, Vancauteren and Wauters2016; Hansson et al., Reference Hansson and Ferguson2011; Rikkonen et al., Reference Rikkonen, Mäkijärvi and andYlätalo2013). EFA would allow us to better understand the correlation structure of the value measurements (see Fabrigar et al., Reference Fabrigar and Wegener2012). It is based on linear regression models, which reduce the number of observed variables to discover otherwise unobservable (or latent) variables. A high factor loading means that there is a strong connection between the variable measured and the latent factor (Everitt et al., Reference Everitt and Vehkalahti2019).
The final step of explorative factor analysis involved calculating the factor score variables for any further analysis, as e.g. DiStefano et al. (Reference DiStefano, Zhu and Mindrila2009) recommend. Factor score variables can be used to rank respondents in terms of the latent factors and these scores can make it easier to understand the differences between Lean adoption phase categories (DiStefano et al., Reference DiStefano, Zhu and Mindrila2009). We applied regression factor scores for each farmer response instead of using the latent structure of factors to build the most suitable scores (DiStefano et al., Reference DiStefano, Zhu and Mindrila2009). Potential explanatory variables for binary adoption regression models were then tested with the Mann–Whitney U-test, which is suitable for small samples without normality assumptions (Field et al., Reference Field2018).
When the dependent variable is binary (‘yes’ or ‘no’ to Lean adoption), the standard regression model will not work as the values are discrete. Therefore, they are transformed using a link function into a continuous dependent variable.
In the present study, the sensitivity of results was tested by estimating generalized linear models of the binary variable using three different link functions – generalized logistic, standard normal, and Poisson distributions. These probability distributions belong to the same exponential family, but their shapes differ. The regression function is linear (McCullagh et al., Reference McCullagh and Nelder1989). Equation (1) shows the logit function, expressed by a link which incorporates the expected value of the distribution and the linear regression (Tutz, Reference Tutz2011). $Logit P(X) = ln (P(X) / (1-P(X))) =\beta _{0}+\beta _{1}x_{1}+\beta _{2}x_{2}+\cdots +\beta _{k}x_{k},$
where P is probability; the link function is ln (P(X)/(1-P(X))); the xs are explanatory variables; and the βs estimated parameters. Equation (2) shows the probit link, which is similar to the logit, except that it uses a standard normal cumulative distribution function as the link (Tutz, Reference Tutz2011). $ProbitP(X) = {{\Phi} ^{ - 1}}P(X) = {\beta _0} + {\beta _1}{x_1} + {\beta _2}{x_2} + \cdots + {\beta _k}{x_k},$
where Φ -1 is the inverse of the standard normal cumulative distribution function. Often the results of probit and logit models are quite similar. Equation (3) shows the third model tested in this study – a complementary log–log link regression (Tutz, Reference Tutz2011). ${cloglog}P\left(X\right)=\mathit{\log } \left(-\mathit{\log } \left(1-P(X)\right)\right)=\beta _{0}+\beta _{1}x_{1}+\beta _{2}x_{2}+\cdots +\beta _{k}x_{k}.$
A complementary log–log (or cloglog) link function differs from logit and probit link functions as cloglog tends to approach value 1.0 quicker than value 0.0, while logit and probit functions approach both values at a similar pace because they are symmetric (Agresti et al., Reference Agresti2010; Tutz, Reference Tutz2011). We used a Bayesian information criteria (BIC) test to compare non-nested models, and we checked the share of correct predictions. Furthermore, we calculated the marginal effects of explanatory variables on the mean probability of adopting Lean (see e.g., Hoffmann et al., Reference Hoffmann and Hoffmann2016), to see potential one-unit changes within the predictors.
4. Results
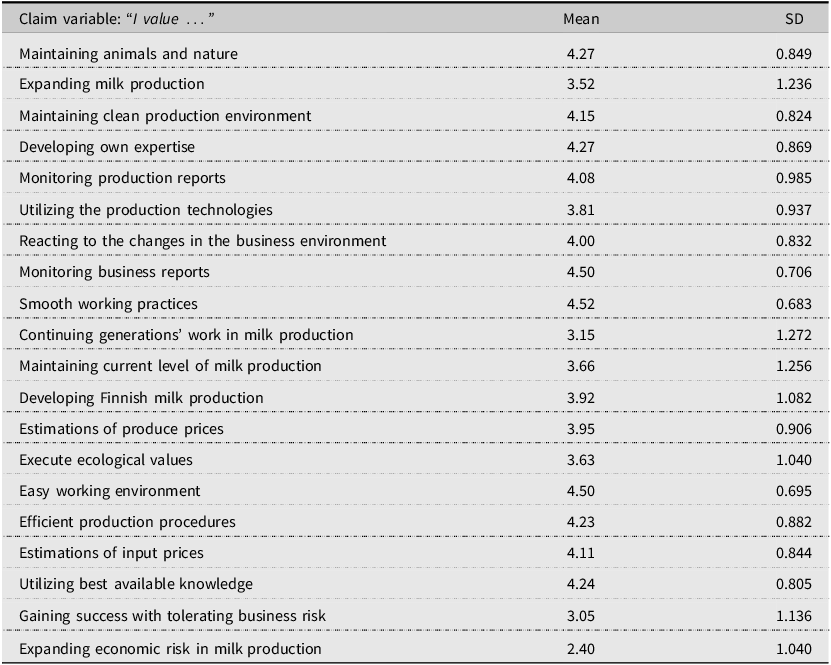
While the whole sample was 135, the Lean questions were responded by 131 dairy farmers. These Lean questions formed the core of the analysis. It told us whether or not farmers were planning to adopt Lean thinking and their values and reasoning for doing so. Lastly, we present their experiences of using Lean tools at the end of this section. The survey consisted of 20 claims about the values and reasoning behind their business strategies and decision-making – these are listed below in Table 3. The farmers were asked to rate these on a 5-point Likert scale, ranging from 1 = totally disagree to 5 = totally agree.
Mean response score of claims with standard deviation (5-point Likert-scale) of 131 farmers
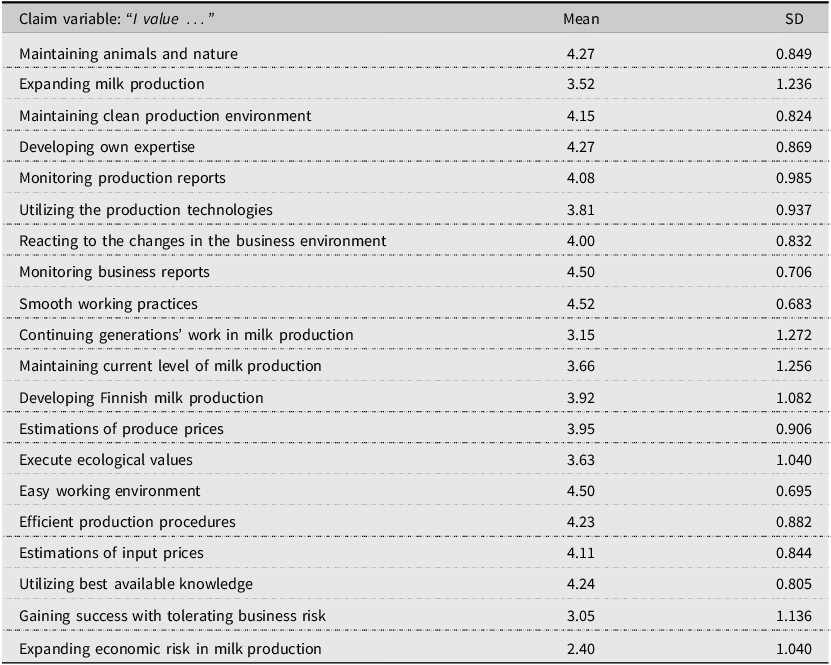
Table 3. Long description
The table presents the mean response scores and standard deviations of 131 farmers’ responses to 20 claims about the values and reasoning behind their business strategies and decision-making. The table has 20 rows and 3 columns. The columns are labeled ‘Claim variable: I value ...’, ‘Mean’, and ‘SD’. Each row lists a specific claim, followed by its mean response score and standard deviation. Notable claims include ‘Maintaining animals and nature’ with a mean score of 4.27, ‘Expanding milk production’ with a mean score of 3.52, and ‘Smooth working practices’ with the highest mean score of 4.52. The standard deviations range from 0.683 to 1.272, indicating varying levels of agreement among the farmers.
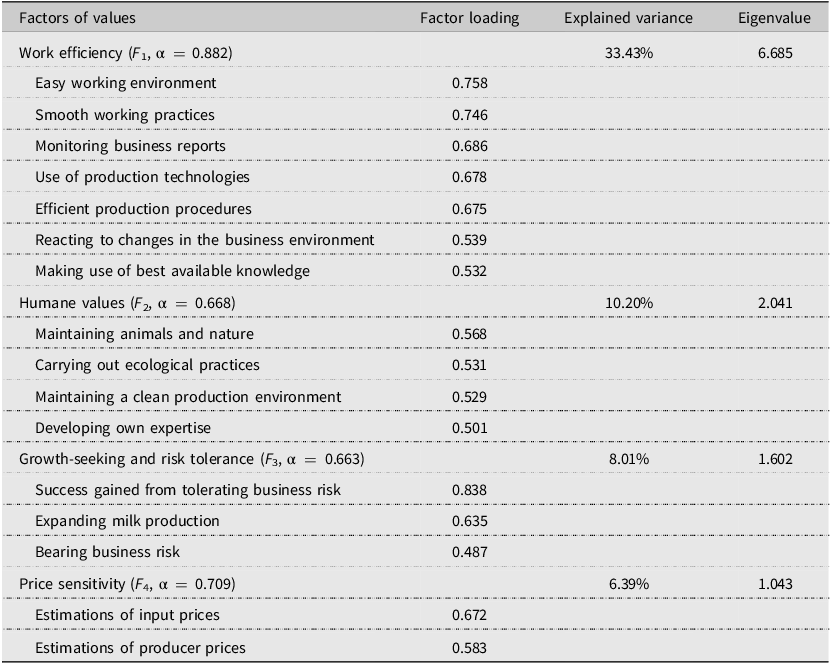
We used EFA to determine the latent variables in the data gleaned from the 20-item survey. This gave us a better understanding of smaller number of latent values that might motivate farmers’ decision to adopt Lean thinking. The Kaiser–Meyer–Olkin measure was 0.851 and at a sufficient level, and the four factors (F 1 −F 4) in Table 4 were feasible for later use in regression analysis according to the Scree plot analysis.
Latent factors and variables, after an EFA of the 5-point Likert scale responses of farmers (n = 131) to claims about motivating values

Table 4. Long description
The table presents the results of an exploratory factor analysis (EFA) conducted on the responses of 131 farmers to a 5-point Likert scale survey about motivating values. It includes four latent factors: Work efficiency, Humane values, Growth-seeking and risk tolerance, and Price sensitivity. Each factor is associated with specific variables and their respective factor loadings. The table also shows the explained variance and eigenvalues for each factor. Work efficiency has the highest explained variance at 33.43 percentage, followed by Humane values at 10.20 percentage, Growth-seeking and risk tolerance at 8.01 percentage, and Price sensitivity at 6.39 percentage. The variables under each factor are listed with their factor loadings, indicating the strength of their relationship with the respective factor.
Principal axis factoring with Varimax rotation and Kaiser Normalization. Cutoff loading 0.400.
Of the four latent factors this analysis produced, work efficiency proved to be the strongest, containing the original variables of ‘the use of production technologies’ and ‘efficient production procedures’. Meanwhile the second latent factor, humane values, contained those variables that described farmers’ eagerness to develop their farming practices and skills plus values connected to sustainability and the ethical aspects of milk production. The last two factors were growth-seeking and risk tolerance – regarding how determined farmers were to develop their business – and price sensitivity – containing just two of the original variables about pricing.
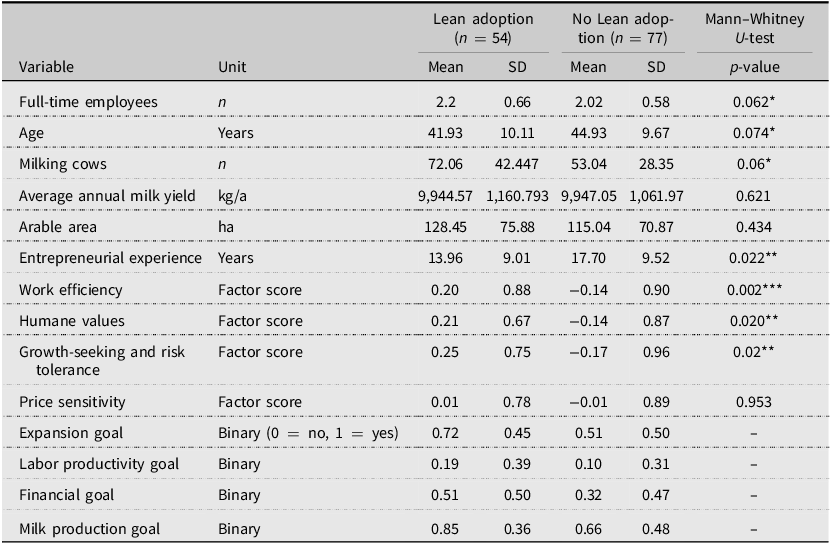
As well as latent factors, the EFA produced factor scores which were then saved in the form of regression scores. We then used a Mann–Whitey U-test to ascertain the significance of group differences (Table 5).
Comparison of potential explanatory variables for binary regression models of adoption groups
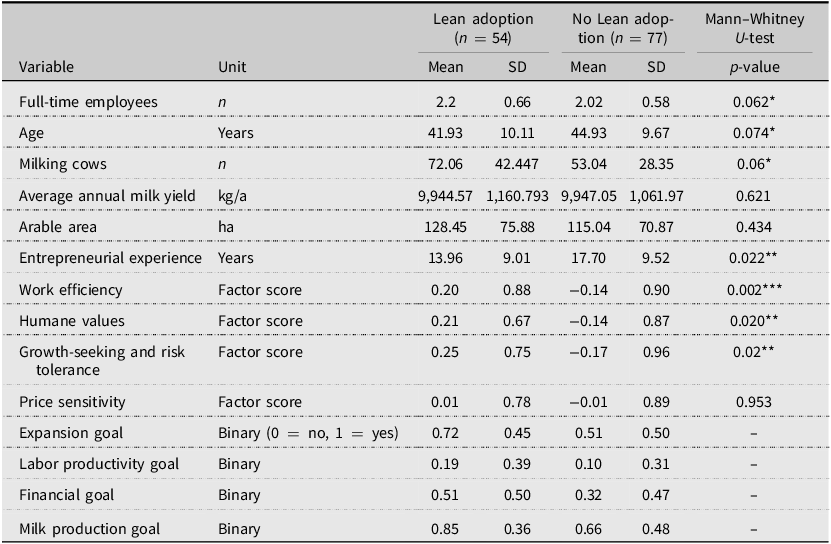
Table 5. Long description
The table compares various variables between lean adoption and no lean adoption groups. It includes data on full-time employees, age, milking cows, average annual milk yield, arable area, entrepreneurial experience, work efficiency, humane values, growth-seeking and risk tolerance, price sensitivity, expansion goal, labor productivity goal, financial goal, and milk production goal. The table has 14 rows and 7 columns, with columns for the variable name, unit, mean, standard deviation for both groups, and the p-value from the Mann-Whitney U-test. Notable trends include significant differences in entrepreneurial experience, work efficiency, humane values, and growth-seeking and risk tolerance between the two groups.
***p < 0.01, **p < 0.05, *p < 0.1.
The farm and farmer characteristics in the analysis were the number of milking cows, the farmer’s age and entrepreneurial experience in years, and the number of full-time employees. The most statistically significant difference laid in the number of milking cows (p-value 0.006). This indicates that dairy farmers with larger herds are potential adopters of Lean method. Because the Mann–Whitney U-test indicated that these characteristics were less significantly different between the two Lean adoption groups in our sample, we examined whether farm development goals and farmers’ motivational values might distinguish the groups better instead. The existence of farm development goals was ascertained with a question, to which the binary response was either yes (1), or no (0).
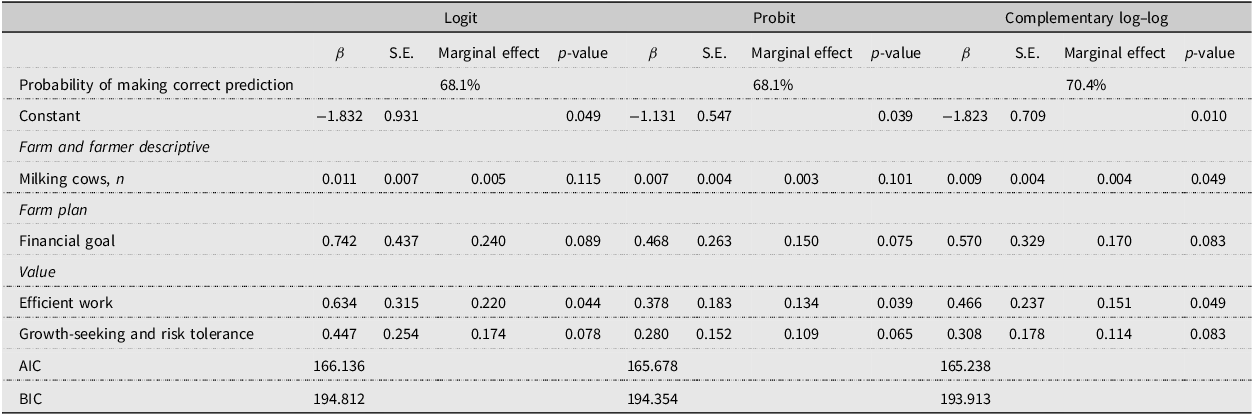
For the regression analysis, we used the number of milking cows and number of full-time employees as the farm characteristics; and financial goal and milk production goal as the farmers’ goals; the factor scores for the latent value factors; and entrepreneurial experience as the farmer characteristic – being more indicative of a farmer’s career in dairy farming than age, although there was a correlation between these two variables. After various modeling tests, only four variables were found to be significant (with less than a 10% level of risk) and these were the subject of the final analysis (Table 6.) concerning the determinants of Lean adoption. Three regression models were then applied and compared to discover the most probable predictors for Lean adoption at the farm-level, by calculating the marginal effects of variables that were significant – i.e. with less than a 10 per cent level of risk.
Regression coefficients (β), standard errors (S.E.), marginal effects and statistical significances (p-value) of explanatory variables in alternative binary regression models
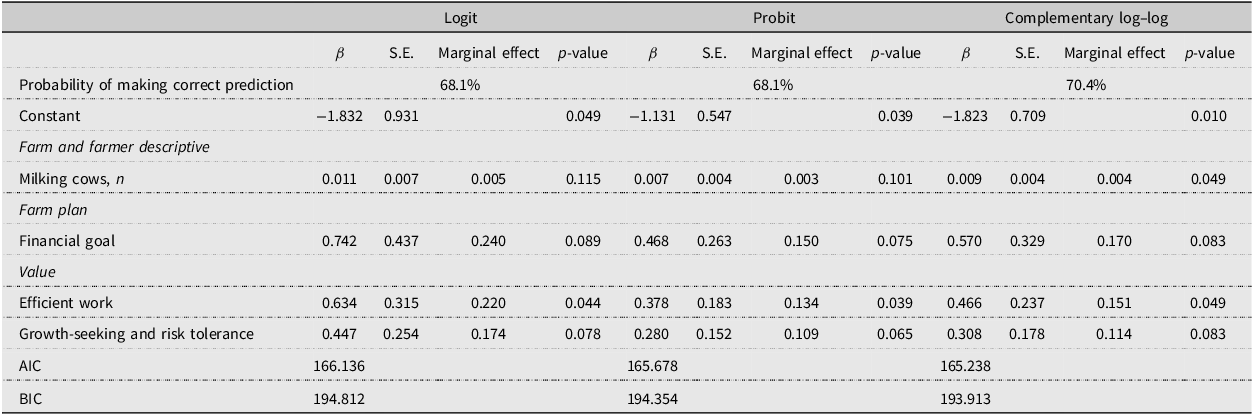
Table 6. Long description
The table presents a comparison of regression coefficients, standard errors, and marginal effects of explanatory variables across three different binary regression models: Logit, Probit, and Complementary log-log. The table includes data for the probability of making correct predictions, farm and farmer descriptive variables, farm plan, value, and entrepreneurial experience. Key variables include the number of milking cows, financial goal, efficient work, growth-seeking and risk tolerance, and entrepreneurial experience. The table also lists the Akaike Information Criterion (AIC) and Bayesian Information Criterion (BIC) values for each model. Notable trends include the significance of efficient work and growth-seeking and risk tolerance across all models.
The results showed few differences between the regression models (Table 6), except in the number of significant variables. The clog-log model had a 70.4 per cent probability of making correct predictions; the smallest BIC test value; and a total of four significant variables – work efficiency, growth-seeking and risk tolerance, financial goal, and the number of milking cows – which all correlated positively with Lean adoption. The marginal effects for each model describe how a one-unit change of the predictor will increase the probability of Lean adoption, all other continuous variables being held constant at their mean levels and with dummy variables at 0.
Once we had identified the factors most closely associated with the likelihood of adopting the Lean method and resulting the factors of herd size, growth orientation, and efficient work, we moved on to examine the experiences of Finnish dairy farmers with the use of Lean tools. Following results present the group of 25 Lean users’ responses. We explored how widely these tools were used among those farmers who did use them (9 possible Lean tools). We asked farmers three sets questions to share their experiences (Tables 7–9) and explain why they had adopted Lean methods.
Drivers for Lean adoption for the farmers who have implemented Lean (n = 25) on a 5-point Likert scale (1 = totally disagree to 5 = totally agree)
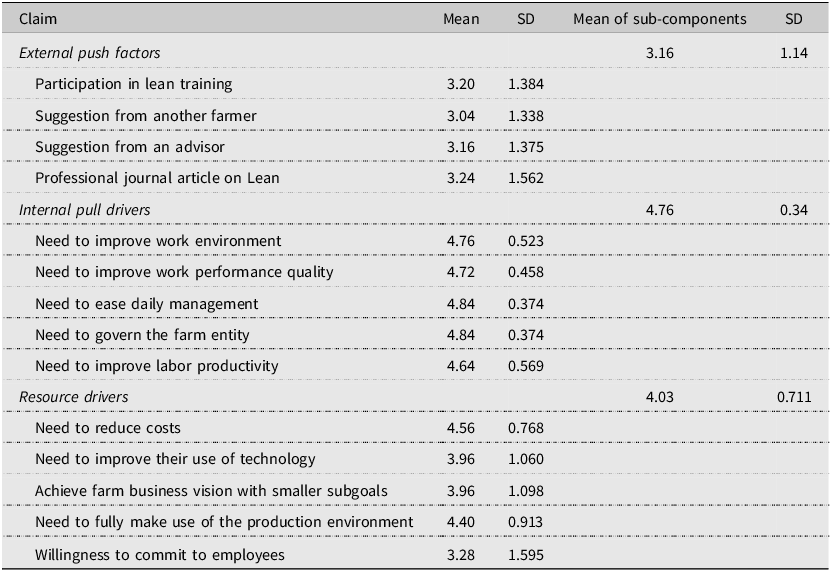
Table 7. Long description
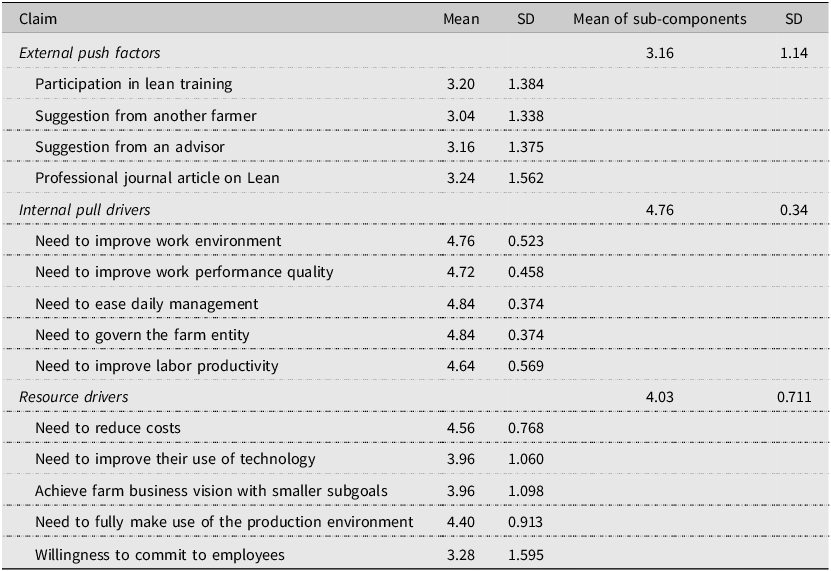
The table presents data on the drivers for Lean adoption among 25 farmers, measured on a 5-point Likert scale. It includes three main categories: External push factors, Internal pull drivers, and Resource drivers. Each category lists specific factors with their mean scores and standard deviations. External push factors have a mean of 3.16, with sub-components like participation in lean training and suggestions from other farmers or advisors. Internal pull drivers have the highest mean of 4.76, highlighting needs such as improving work environment, work performance quality, daily management, governing the farm, and labor productivity. Resource drivers have a mean of 4.03, covering needs like reducing costs, improving technology use, achieving business vision, making full use of the production environment, and committing to employees.
Distribution of Lean users’ opinions of usefulness of selected Lean tools on a 5-point Likert-scale (1= totally disagree to 5 = totally agree), with the option of giving a “no experience” rating
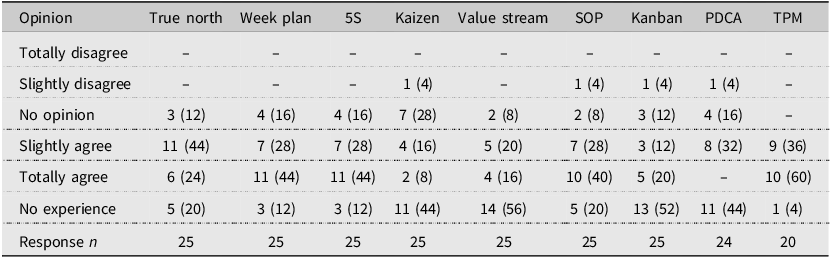
Table 8. Long description
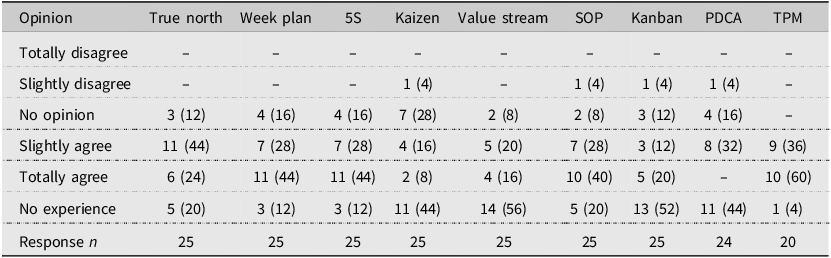
The table presents the distribution of Lean users’ opinions on the usefulness of various Lean tools, rated on a 5-point Likert scale from 1 (totally disagree) to 5 (totally agree), with an additional option for ‘no experience’. The table includes columns for different Lean tools such as true north, week plan, 5S, Kaizen, value stream, SOP, Kanban, PDCA, and TPM. Each column lists the number and percentage of respondents for each opinion category. Notable trends include high agreement for tools like TPM and Kanban, with many respondents indicating ‘totally agree’. Tools like Kaizen and value stream show a significant number of respondents with ‘no experience’. The data highlights varying levels of familiarity and perceived usefulness among the different Lean tools.
Lean users’ assessment of the effects of Lean adoption on strategic management, work performance, and operation management (n = 25): “On our farm, Lean thinking has…”
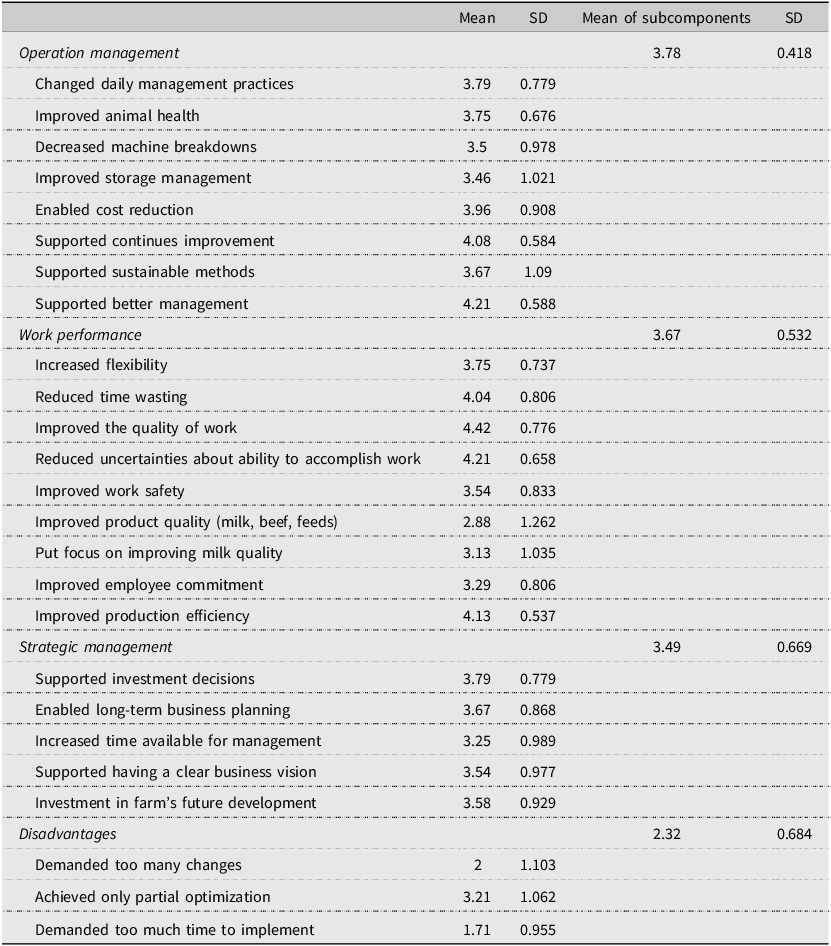
Table 9. Long description
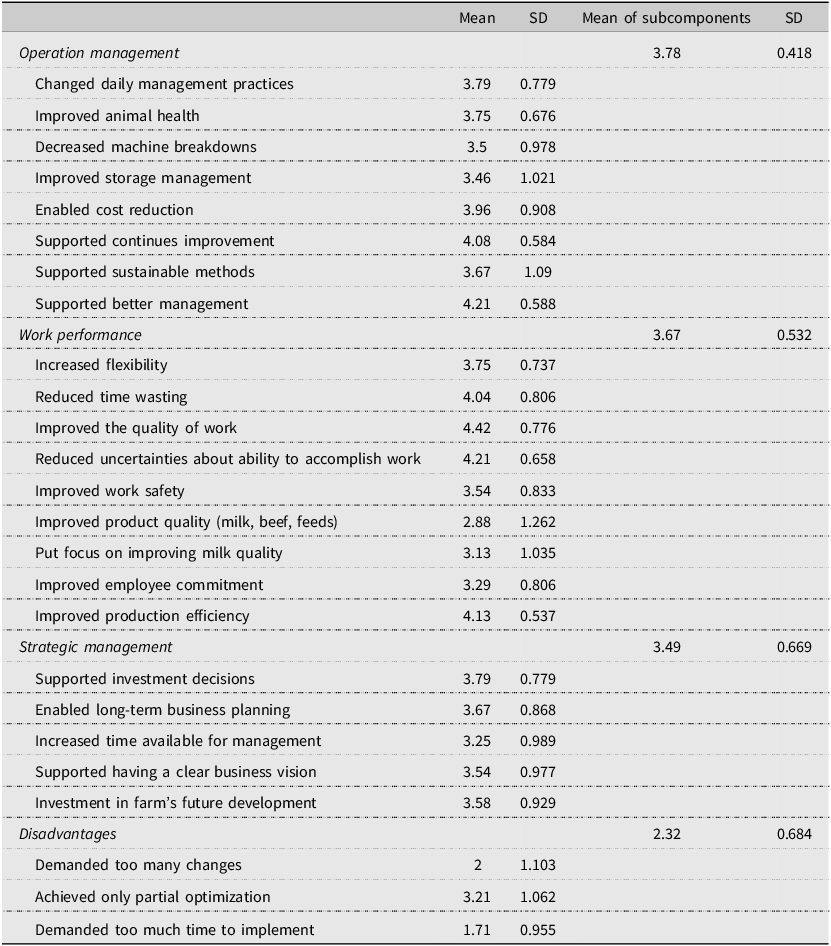
The table presents a detailed assessment by Lean users of the effects of Lean adoption on strategic management, work performance, and operation management. It includes mean and standard deviation values for various subcomponents. The table has 27 rows and 4 columns. The columns are labeled Mean, SD, Mean of subcomponents, and SD. The rows are categorized under Operation management, Work performance, Strategic management, and Disadvantages. Notable trends include high mean values for supported better management and improved the quality of work, indicating significant positive impacts in these areas. The table also highlights some disadvantages such as demanding too many changes and achieving only partial optimization.
Table 7 focuses on what drove farmers to adopt Lean management. The internal drivers that led to the need to improve daily management and work efficiency were particularly relevant, as were the resource drivers of cost reduction, whereas the external push factors were somewhat less important.
The most common Lean thinking tools used by these 25 farms were Total Productive Maintenance (TPM), 5S (Sort, Set in Order, Shine, Standardize, Sustain), and Week Plan. Value Stream Mapping was the most unfamiliar of the nine Lean tools. SOP was also well-known among the respondents and commonly supported, though not by all. As we had only one farmer who gave up Lean, however, it was impossible to explore in any depth the causes for these negative experiences.
We also explored adopters’ experiences of Lean (Table 8). Farmers were asked to evaluate 20 claims on 5-step Likert-scale (from 1=totally disagree to 5=totally agree). These claims were formulated based on the Lean effects reported in the existing literature (see e.g., Caldera et al., Reference Caldera, Desha and Dawes2017; Dora et al., Reference Dora, Kumar and Gellynck2016; Melin et al., Reference Melin and Barth2018). We grouped these 20 claims according to common themes, as the factor analysis was not feasible for this small data set. Finnish dairy farmers that had implemented Lean (n = 25) reported positive influences of Lean on work performance, efficiency, and productivity (Table 9). The quality improvement is related to decreased uncertainty of the accomplishment of work tasks, and Lean is found to support continuous improvement in farm management practices. These results echo the internal pull drivers, which highlighted the need to improve work efficiency and operational management at farm level.
The dairy farmers’ responses were consistent when they assessed Lean adoption (Table 8). Overall, their experiences were positive, particularly with regard to work performance and operational management– having mean subcomponent values of 3.67 and 3.89 respectively. These would seem to indicate that internal pull drivers facilitate Lean adoption helping to overcome the challenges of adopting new practices. When we look at the individual items within the subcomponents, the three highest scores were Lean thinking improved the quality of work (4.42), supported better management (4.21) and reduced uncertainty about accomplishing work (4.21). Interestingly, most of the farmers using Lean also found that through Lean adoption they achieved only partial optimization (3.21). This may be because typically only a few Lean tools were adopted but not all Lean management practices.
5. Discussion
Our sample showed that Lean was being adopted by Finnish dairy farms in a piecemeal fashion when considering the Lean tools focused on this study. Furthermore, in our sample, the comparison of adoption groups showed that the average age and experience in dairy farming differ significantly between groups but in binary regression models these independent variables were insignificant. Partial adoption of Lean thinking is understandable in Finnish context, when consider that dairy farms are small business entities with limited financial and human resources, and that full adoption of Lean thinking would be expensive and time consuming. Lean thinking is a complex concept in which business unit management and human resource management aspects are intertwined, requiring unique adaptation processes (Marodin et al., Reference Marodin and Saurin2013). Furthermore, factors other than age clearly influence farmers’ values and goals (Brown et al., Reference Brown, Daigneault and Dawson2019).
According to Coppola et al. (Reference Coppola, Ianuario, Chinnici, Di Vita, Pappalardo and D’Amico2018), younger farmers are more interested in modernizing their management practices, while older farmers are often more reluctant to do so (Brown et al., Reference Brown, Daigneault and Dawson2019; Coppola et al., Reference Coppola, Ianuario, Chinnici, Di Vita, Pappalardo and D’Amico2018). This observation is also consistent with the results of our data sample. Brown et al. (Reference Brown, Daigneault and Dawson2019) found in their research concerning the impact of age on decisions to implement sustainable practices that younger farmers are more willing to improve sustainability of production. They suggest that this result is partly justified by the willingness of young farmers to carry out experiments.
In our binary regression analysis, socio-economic explanatory variables such as age or entrepreneurial experience or education were not statistically significant, but it is likely that they are intertwined with the most significant predictors, which were the goal to expand milk production and the motive to work more efficiently. Other possible explanations are the small sample size and the self-selection of the respondents. Costa et al. (Reference Costa, Godinho Filho, Fredendall and Gómez Paredes2018) investigated the drivers for adopting Lean and the benefits experienced from it in Lean-related management approach studies. They found following drivers of Lean adoption to be the most important incentives: waste reduction, cost reduction, efficiency increase, and productivity increase.
To understand how Finnish dairy farmers have used Lean management, we explored which independent variables are linked to farmers’ decision to adopt it. Focusing on management is crucial to the success of a farm. Mäkinen (Reference Mäkinen2013) found in his research of 117 dairy farms from the FADN (farm accountancy data network) that the managerial thinking of farmers influences their economic success. ‘Managerial thinking’ is described here as work undertaken by farmers to achieve short-term goals, which sets a vision and treats farming as a business action (Mäkinen et al., Reference Mäkinen2013).
Our sample supports previous findings that Lean could provide an excellent way of minimizing variation between the ways employees perform tasks, so they work together better and improve the quality of work – which we also found to be the single most important factor in the human resource management in our data (Table 8). Kallioniemi et al. (Reference Kallioniemi, Simola, Kaseva and Kymäläinen2016) found that heavy workload was a significant source of stress. Acute stress impairs decision-making ability (Starcke and Brand, Reference Starcke and Brand2012) and can hinder the learning process, especially in connection with negative events (Mather et al., Reference Mather and Lighthall2012). At the farm level, this can challenge the farmer’s ability to keep up with the monitoring required by the farm’s internal and external business environment in order to remain competitive. Because of dairy farming’s typically heavy workload and inflexible time schedules (Lunner Kolstrup et al., Reference Lunner Kolstrup, Kallioniemi, Lundqvist, Kymäläinen, Stallones and Brumby2013), stress is a constant hazard for the farmer. Tools to ease time management of the workload with planning may well help to keep stress at more acceptable levels. Since our sample consists of larger-than-average dairy farms, the current stress and workload may be an obstacle to investing the time and effort required to implement the Lean method.
On large dairy farms, the communication between management and employees is found to be a challenge for human resource management (Durst et al., Reference Durst, Moore, Ritter and Barkema2018). Our findings indicate that Lean can improve communication and mutual understanding as quality of work and uncertainties of accomplished tasks are reported to gain positive influences (Table 8).
In family farming, the resources of farming family influence on to the future and business opportunities in the long-term (Suess-Reyes et al., Reference Suess-Reyes and Fuetsch2016). While the farmer’s family has a role in improving competitiveness, the physical and intelligent resources of the employees also make a difference. Improving the commitment of employees was not found to be a significant driver for Lean adoption in our sample – the farms in our sample employed an average of only 2.12 people on a full-time basis (including family members). However, this could change as Finnish dairy farms are growing (Natural Resources Institute Finland, 2026) and the human resource management challenges will be an important factor in the successful management of a dairy farm (Durst et al., Reference Durst, Moore, Ritter and Barkema2018; Lunner Kolstrup et al., Reference Lunner Kolstrup, Kallioniemi, Lundqvist, Kymäläinen, Stallones and Brumby2013).
In terms of improving productivity, learning from other farmers’ experiences appears to be an effective way of disseminating best management practices (Mareth et al., Reference Mareth, Thomé, Scavarda and Cyrino Oliveira2017), while O’Donoghue and Heanue (Reference O’Donoghue and Heanue2018) emphasize the significant impact of agricultural education. In our sample, learning from the experiences of other farmers did not appear to be an important motivating factor for adopting the Lean method. This may be due to two possible reasons: first, our sample of farmers already had a high level of education; second, because Lean is a relatively new concept for Finnish farmers, many of our sample farmers are themselves the vanguard of early adopters. Although this sometimes entails the risk of adopting inappropriate innovations, fast learning often means using technology and/or making innovations that can improve the financial performance of farms (Micheels et al., Reference Micheels and Gow2012).
Although our research was limited to a small sample of Finnish dairy farms, there are already indications – such as our results indicating that Lean can improve the quality of work – that human resource management could benefit greatly from continuing to implement Lean thinking. Productivity and efficiency are crucial in improving the profitability and economic sustainability of dairy farming, and they are also the building blocks of competitiveness.
6. Conclusions
The research aimed to explore the determinants of Lean adoption among Finnish dairy farmers as dairy farmers need to find ways to improve work performance and productivity at the farm level due to structural change and ever-growing business units. Structural change leads to employing people outside the farming family, and this in turn requires an ability to manage the work performance of all employees. Certain management protocols may provide a way for dairy farmers to cope with the challenges. Despite the expected positive effects, the adoption rate of Lean in dairy farming is still low in Finland. Both intentions to adopt and actual Lean adoption tended to be driven by the willingness of the farmer to increase work efficiency and to expand milk production. These drivers seemed to be intertwined with the age of farmer and the size of herd. Experiences of Lean adopters indicate that Lean had improved the work performance and operation management. Despite, farmers had only adopted a few of the possible tools of Lean. This is probably the challenge related to small businesses in general, not only to agriculture. The largest, growth oriented dairy farms with several employees would likely be group of farms that would benefit the most from implementing Lean.
Our findings support existing literature on Lean thinking in agriculture and increase understanding of the factors that influence the adoption of Lean thinking in primary food production. Furthermore, this study may strengthen the understanding of how farmers can be motivated to adopt management protocols such as Lean thinking.
The study has also its limitations. The sample is a convenience sample collected via dairy processor’s intranet without statistical sampling. The population was all the milk producers of the dominant dairy processor in Finland, but the respondents were on average younger, and their farms were larger than the population averages. The number of respondents was also relatively small. Despite the small sample, the findings were consistent with the previous studies on the adoption of Lean by small and medium-sized enterprises. To gain a better understanding of the benefits of Lean adoption for management at farm level, a wider study including other forms of agricultural production would support informed recommendations for disseminating Lean through education, extension services, and policy.
Supplementary material
The supplementary material for this article can be found at https://doi.org/10.1017/aae.2026.10046.
Data availability statement
Data not available – participant consent: The participants of this study did not give written consent for their data to be shared publicly.
Acknowledgements
We would like to thank Valio co-operative for collaboration with the data collection.
Author contributions
Conceptualization, S.L.-K. and T.S.; Methodology, S.L.-K. and T.S.; Formal Analysis, S.L.-K. and T.S.; Data Curation, S.L.-K.; Writing – Original Draft, S.L.-K.; Writing – Review and Editing, S.L.-K. and T.S.; Supervision, T.S.; Funding Acquisition, S.L.-K.
Financial support
Work of corresponding author Lahnamäki-Kivelä was supported by Ruth Foundation (Finland), no grant-number.
Competing interests
The authors report there are no competing interests to declare.
AI contribution
Artificial intelligence was not used within the research or writing process.


 Open access

