

Introduction
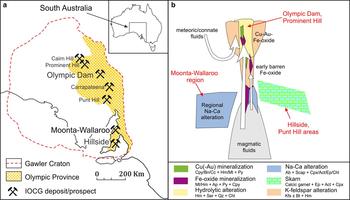
Iron-oxide copper gold (IOCG) deposits of the Olympic Cu-Au Province, eastern Gawler Craton, South Australia (Fig. 1a) display significant enrichment in rare-earth elements (REE) relative to average crustal values (Skirrow et al., 2007). Indeed, a marked enrichment in REE + Y (hereafter REY) and U is one defining characteristic of the IOCG deposit clan (Hitzman et al., Reference Hitzman, Oreskes and Einaudi1992), and any genetic model for the deposits needs to account for this.
(a) Sketch map of the Gawler Craton, South Australia, showing the location of the Olympic Cu-Au province, the Olympic Dam deposit, the Hillside deposit, and other deposits/prospects mentioned in the text. (b) Sketch, after Barton and Johnson (Reference Barton and Johnson1996), showing proposed crustal settings of selected South Australian IOCG deposits.
The >10 billion tonne Olympic Dam Cu-U-Au-Ag deposit is not only the largest IOCG system in the Gawler Craton, but is among the largest concentrations of REE on Earth (mean concentration ~0.17 wt.% La and 0.25 wt.% Ce; Ehrig et al., Reference Ehrig, McPhie, Kamenetsky, Hedenquist, Harris and Camus2012). The deposit is also enriched in a diverse range of other elements considered to be critical metals, such as Sc, Ga, In, Mo, Nb, Se, Sn, Sr, Te and W (Ehrig et al., Reference Ehrig, McPhie, Kamenetsky, Hedenquist, Harris and Camus2012). The REE are not recovered at present for several reasons, including: (1) a dominance of less valuable light rare earths (LREE; La, Ce, Nd); (2) occurrence within various fine-grained minerals (bastnäsite, florencite and subordinate synchysite, xenotime and monazite); (3) their presence also within solid solution in common accessories (e.g. apatite; Krneta et al., Reference Krneta, Ciobanu, Cook, Ehrig and Kontonikas-Charos2016); and (4) the intimate intergrowth of all REE minerals with other phases, notably U-bearing minerals, down to the nanoscale.
Feldspars are, volumetrically, by far the dominant component of the Roxby Downs Granite (RDG), a Mesoproterozoic felsic granitoid that hosts, and is genetically associated with, the IOCG system at Olympic Dam. These feldspars, and those from coeval Mesoproterozoic granitoids related to other IOCG systems within the Olympic Cu-Au Province, contain measurable concentrations of REE and other trace elements (Y, Ga etc.), either within the feldspar lattice, or as sub-microscopic-scale inclusions of discrete REE minerals (Ismail et al., Reference Ismail, Ciobanu, Cook, Teale, Giles, Schmidt Mumm and Wade2014; Kontonikas-Charos et al., Reference Kontonikas-Charos, Ciobanu and Cook2014, Reference Kontonikas-Charos, Ciobanu, Cook, Ehrig and Kamenetsky2015, Reference Kontonikas-Charos, Ciobanu, Cook, Ehrig, Krneta and Kamenetsky2017a). To understand the evolution of trace element concentrations in feldspars during fluid–rock interaction, and mechanisms of REE enrichment within broader models for IOCG genesis, these authors have investigated the microstructural, mineralogical and geochemical expression of such enrichment during feldspar evolution from igneous to early hydrothermal stages.
Kontonikas-Charos et al. (Reference Kontonikas-Charos, Ciobanu, Cook, Ehrig, Krneta and Kamenetsky2017a) examined the sequence and mechanisms of feldspar replacement reactions that mark the onset of the IOCG-forming system at Olympic Dam. These start with late-magmatic development of rapakivi and anti-rapakivi textures between igneous plagioclase and alkali feldspar. The post-magmatic evolution comprises modification of alkali feldspar from cryptoperthite to patch perthite, overprinting of patch perthite by highly porous albite and K-feldspar, and replacement of plagioclase by albite + sericite ± Ba-rich K-feldspar. Importantly, the study showed that hydrothermal albite and K-feldspar formed within granitoids hosting the Olympic Dam deposit without supply of alkali metals from any external source. Kontonikas-Charos et al. (Reference Kontonikas-Charos, Ciobanu, Cook, Ehrig, Krneta and Kamenetsky2017b) provide trace element data for feldspars from different stages of the igneous to hydrothermal transformation of plagioclase and alkali feldspar from Olympic Dam and prospects within the region. The evolution of feldspar microtextures and compositions are mirrored by changes in absolute REY concentrations and chondrite-normalized REY fractionation patterns. Initial albitization of igneous plagioclase traps REY within the resultant albite + sericite ± epidote assemblage.
The systematic changes in feldspars from least-altered to mineralized RDG at Olympic Dam (Kontonikas-Charos et al., Reference Kontonikas-Charos, Ciobanu, Cook, Ehrig, Krneta and Kamenetsky2017b) support the applicability of REY-fractionation trends in feldspars as geochemical tracers of hydrothermal alteration. Such an interpretation is consistent with studies of feldspars from rocks in areas further south in the Olympic Cu-Au province: the Moonta-Wallaroo region (Kontonikas-Charos et al., Reference Kontonikas-Charos, Ciobanu and Cook2014); and granites from the Hillside Cu-Au skarn deposit (Ismail et al., Reference Ismail, Ciobanu, Cook, Teale, Giles, Schmidt Mumm and Wade2014). The marked decrease in ∑REY in feldspars with proximity to the Olympic Dam orebody hints at the release and remobilization of REY from feldspars into discrete REE minerals.
These studies have all emphasized the nature of the replacement reactions as dominantly pseudomorphic, thus presumably driven via a coupling of dissolution and (re)precipitation rates at the interface between a pre-existing mineral and a pervading fluid (CDRR), as defined by Putnis (Reference Putnis2002). Given that CDRR, the main type of feldspar transformation, begins at the nanoscale (Kontonikas-Charos et al., Reference Kontonikas-Charos, Ciobanu, Cook, Ehrig, Krneta and Kamenetsky2017a), it is critical to understand prevailing mineral assemblages and phase relationships at the smallest scales (orientation boundaries, inclusions, etc.). In this contribution, examples are presented from the Olympic Dam and Hillside deposits, two types of IOCG systems with contrasting alteration styles (Fig. 1b; see below). These illustrate how the characterization of feldspars and associated REE-bearing minerals and/or discrete REE-minerals at the nanoscale allow us to constrain the sequence of reactions from primary magmatic assemblages to phases formed simultaneously with Fe-metasomatism and deposition of sulfide ore. Considering the abundance of feldspars in rocks hosting IOCG systems, any widespread feldspar replacement reactions will play a significant role in redistributing trace elements during the transition from magmatic to hydrothermal stages. Identifying host phases and reaction pathways for REE, and by implication, also other critical metals, is an important step towards establishing their long-term resource potential.
Background on IOCG deposits and feldspar alteration
Iron oxide copper-gold mineralization forms in a wide range of ore systems spanning the Archean to the Phanerozoic (e.g. Groves et al., Reference Groves, Bierlein, Meinert and Hitzman2010). Genetic models for these deposits are still much debated, particularly regarding the role of igneous rocks, the sources of metals and fluids, and geodynamic settings (e.g. Hitzman et al., Reference Hitzman, Oreskes and Einaudi1992; Barton and Johnson, Reference Barton and Johnson1996; Pollard, Reference Pollard2006; Groves et al., Reference Groves, Bierlein, Meinert and Hitzman2010). It is widely accepted, nonetheless, that IOCG systems are defined by broad alteration haloes comprising early sodic-calcic alteration and barren Fe-oxide alteration followed by deposition of Cu-Au mineralization, often accompanied by hydrolytic alteration (Fig. 1b). The early albite ± calc-silicate (epidote ± actinolite ± diopside) ± magnetite alteration (Na-Ca-Fe alteration) as well as scapolite-bearing assemblages may be recognized at the regional scale (Barton, Reference Barton2014). In contrast, the ore-bearing alteration stage is typically found at the local scale and can be broadly subdivided into deeper potassic (K-feldspar ± biotite) and shallower hydrolytic (sericite ± chlorite ± carbonate) alteration, where magnetite and hematite are the dominant Fe oxides, respectively (Barton, Reference Barton2014). Terranes dominated by carbonate-rich protoliths are generally characterized by calc-silicate alteration (e.g. epidote/clinozoisite + actinolite + clinopyroxene + calcic garnet), with ore hosted within skarn. Based on gain or loss of different components, skarn formation is distinct from Na-Ca alteration of aluminous igneous or sedimentary protoliths which can also result in the formation of calc-silicates (carbonate-hosted alteration; Barton, Reference Barton2014).
The Olympic Cu-Au Province is one of the largest Mesoproterozoic IOCG provinces on Earth (Skirrow et al., Reference Skirrow, Bastrakov, Barovich, Fraser, Creaser, Fanning, Raymond and Davidson2007). Alteration ranges from the ‘end-member’ sericite-hematite-breccia hosted type (e.g. Olympic Dam and Prominent Hill deposits), to skarn-hosted polymetallic mineralization in the Punt Hill district (Groundhog prospect; e.g. Reid et al., Reference Reid, Swain, Mason and Maas2011), strongly potassic-altered and minor skarn-hosted mineralization at Moonta-Wallaroo (small-scale Cu-Au veins; Conor et al., Reference Conor, Raymond, Baker, Teale, Say, Lowe and Porter2010) and Cu-Au skarn-IOCG deposit at Hillside, on the western margin of the Yorke Peninsula (e.g. Conor et al., Reference Conor, Raymond, Baker, Teale, Say, Lowe and Porter2010; Ismail et al., Reference Ismail, Ciobanu, Cook, Teale, Giles, Schmidt Mumm and Wade2014) (Fig. 1a). Unlike other IOCG terranes in Australia (e.g. Cloncurry District), the Olympic Cu-Au Province also stands out in showing a characteristic enrichment in REE and U, irrespective of alteration style (e.g. Skirrow et al., Reference Skirrow, Bastrakov, Barovich, Fraser, Creaser, Fanning, Raymond and Davidson2007). An opportunity thus exists to understand the processes inherently responsible for such metal endowments within a range of host rocks and alteration styles, in which feldspars play key roles. Albitization, associated with the early sodic-calcic alteration stage, has been discussed down to the nanoscale in a broader petrological context, albeit not for IOCG systems, with significant implications for rock permeability and geochemistry (e.g. Plümper and Putnis, Reference Plümper and Putnis2009). Moreover, hematite dusting of feldspars, often observed in rocks that have undergone subsolidus re-equilibration (e.g. Putnis et al., Reference Putnis, Hinrichs, Putnis, Golla-Schindler and Collins2007), is recognized as Fe-oxide staining of feldspar across the Olympic Cu-Au Province (e.g. Ismail et al., Reference Ismail, Ciobanu, Cook, Teale, Giles, Schmidt Mumm and Wade2014; Kontonikas-Charos et al., Reference Kontonikas-Charos, Ciobanu, Cook, Ehrig and Kamenetsky2015, Reference Kontonikas-Charos, Ciobanu, Cook, Ehrig, Krneta and Kamenetsky2017a; Ismail, Reference Ismail2016). This phenomenon is also observed to increase in intensity with proximity to the ore-hosting Olympic Dam Breccia Complex (ODBC) (Kontonikas-Charos et al., Reference Kontonikas-Charos, Ciobanu, Cook, Ehrig, Krneta and Kamenetsky2017a). Moreover, a recent study by Mauger et al. (Reference Mauger, Ehrig, Kontonikas-Charos, Ciobanu, Cook and Kamenetsky2016) reported the regional presence of albite at Olympic Dam, as well as deposit-scale zonation of feldspar speciation, showing an increase in microcline/orthoclase ratio from surrounding least-altered-RDG to altered and mineralized RDG within the ODBC. This trend is complemented by an increase in the Fe/Mg ratio of chlorite in the same samples.
Many publications have dealt with mesoscopic/macroscopic-scale characterization of alteration haloes in IOCG systems (e.g. Barton Reference Barton2014, and references therein). These authors have sought to show how alteration assemblages can provide a petrological context for ore deposition. Although various alteration signatures have been defined, and show some degree of continuity from deposit to deposit, the understanding of the mineral assemblages themselves, and their variation from the micro- to nanoscale, has lagged well behind. Issues such as the mobility and enrichment of trace elements, including U and REY, have also been dealt with using approaches based on basic petrographic and whole-rock analysis rather than any mineralogical studies at appropriate scales. Building upon an understanding of feldspar alteration from the macro- to micro- scale (Kontonikas-Charos et al., Reference Kontonikas-Charos, Ciobanu, Cook, Ehrig, Krneta and Kamenetsky2017a), the present study extends this knowledge down to the nanoscale. The main aim is to understand whether feldspars can track mobility of minor/trace elements during their alteration, and if so in what way.
Approach
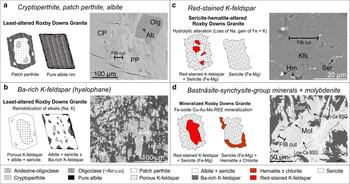
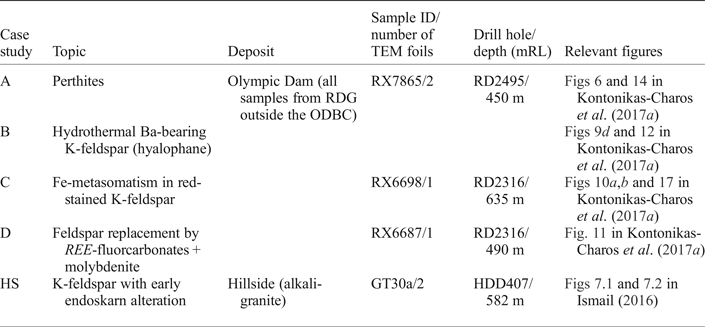
Our main emphasis is on examples representing various stages of feldspar alteration in the RDG outside the orebody at Olympic Dam. An additional example from the early skarn at Hillside has been investigated for comparison. The sample suite (Table 1) was selected based on several criteria including: (1) preservation of igneous and hydrothermal feldspars; (2) anomalous trace- and minor-element concentrations, and (3) the presence of unusual REE- and sulfide-bearing mineral assemblages within the replacement areas. Examples from Olympic Dam include specimens that particularly show the sequence of feldspar alteration as introduced by Kontonikas-Charos et al. (Reference Kontonikas-Charos, Ciobanu, Cook, Ehrig, Krneta and Kamenetsky2017a), i.e. igneous alkali feldspars record post-magmatic recrystallization textures (deuteric coarsening), which are overprinted by albitization, K-feldspathization and hydrolytic (sericite + quartz) alteration (Fig. 2).
Schematic sketches and photomicrographs illustrating and providing a textural context for the four case studies from Olympic Dam considered in this contribution (a–d). Locations of FIB cuts are shown. Abbreviations: Ab, albite; BSG, bastnäsite–synchysite group minerals; CP, cryptoperthite; Hm, hematite; Hyal, hyalophane; Kfs, K-feldspar; Mol, molybdenite; Olg, oligoclase; PP, patch perthite; Ser, sericite.
Overview of samples investigated and correlation with previous work.
Case study A (Fig. 2a) derives from a sample of RDG, ~4 km outside the ODBC and is representative of the recrystallization of igneous alkali feldspar (cryptoperthite) to patch perthite following interaction with post-magmatic fluids. Mineralogy is typical of least-altered RDG. Plagioclase and alkali feldspar are partially overprinted by an assemblage of near end-member albite and rare hyalophane, together with preserved, but porous orthoclase. Igneous amphibole, biotite and Fe-(Ti)-oxides (magnetite, titanite and ilmenite) are preserved. The sample provides insights into initial textural and geochemical changes occurring in the RDG prior to deposition of IOCG-type mineralization.
Case study B (Fig. 2b) is from the same sample, and addresses the hyalophane, which occurs exclusively as micro-scale aggregates within albitized cores of phenocrysts consisting of andesine. The sample was chosen to characterize the hyalophane morphology and relationships with enclosing albite, as well as to find evidence for the presence of other mineral inclusions. Such an approach is designed to understand, in further detail, the mineralogical changes within the feldspar assemblage from micro- to nanoscale following albitization.
Case study C (Fig. 2c) is from sericite-hematite-altered RDG located at depth (−635 mRL) within a drillhole targeting distal satellite mineralization ~4 km NE from the Olympic Dam deposit. Mineralogy and geochemistry are comparable to that seen at the margins of the ODBC. The sample contains variably red-stained K-feldspar, which occurs in association with sparse Cu-(Fe)-sulfide mineralization. There is no evident preservation of igneous plagioclase, amphibole or biotite within the sample. This case study was selected from one of the grains with highest Fe concentration (mean values of ~1.5 wt.% FeO; Kontonikas-Charos et al., Reference Kontonikas-Charos, Ciobanu, Cook, Ehrig, Krneta and Kamenetsky2017a) to constrain whether Fe-metasomatized feldspar contains any Fe oxides present as pore-hosted inclusions, disseminated inclusions, nanoparticles, or by inference, within the feldspar crystal lattice.
Case study D (Fig. 2d) is from mineralized RDG from the same distal satellite drillhole, but to a shallower depth (−490 mRL), from an interval containing Cu-Au-U-REE-Mo mineralization. Sulfides, particularly chalcopyrite and pyrite, are intimately associated with both magnetite and hematite; the latter extensively replacing the former (e.g. martitization). Of particular interest is a ~2 mm-sized lamellar intergrowth between REE-fluorcarbonates of the bastnäsite–synchysite group (Donnay and Donnay, Reference Donnay and Donnay1953; Ni et al., Reference Ni, Hughes and Mariano1993) and molybdenite, which has pervasively replaced an igneous feldspar grain. The significance of the sample is to correlate Fe metasomatism with deposition of the sulfide-oxide assemblage and associated REE-Mo mineralization.
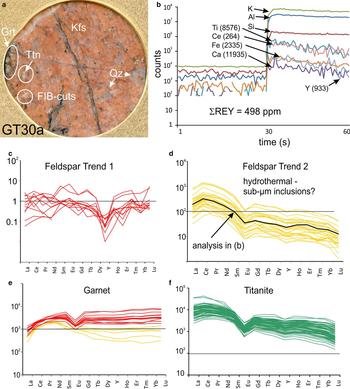
A sample from Hillside is included for the purposes of comparison with the material from Olympic Dam. The sample was collected at the immediate contact between alkali granite and garnet skarn, and is dominated by K-feldspar and quartz, with minor andradite, titanite, chlorite and calcite. K-feldspar characterized by high (100–1000 ppm) concentrations of REY (Fig. 3; laser-ablation inductively coupled plasma mass spectrometry (LA-ICP-MS) spot analyses from Ismail, Reference Ismail2016). A key objective when investigating this case study was to establish whether such anomalous concentrations are due to inclusions of titanite and/or andradite, and if so, to observe any crystal modifications within the K-feldspar lattice which might accommodate such inclusions.
Overview of case study at Hillside (HS): (a) polished block of sample showing the locations of FIB cuts used in present study (Key as in Fig. 2); (b) LA-ICP-MS downhole profile showing flat signals for REE and Y in the feldspars analysed; (c–f) chondrite-normalized REY fractionation trends for feldspar (Trend 1), feldspar (Trend 2, in which abundant sub-micrometre-scale inclusions are present), garnet and titanite. Note the very similar appearance of fractionation trends for feldspar with inclusions and titanite and/or garnet.
Methods
Focused ion beam-scanning electron microscopy (FIB-SEM) and transmission electron microscopy (TEM) are the two microanalytical methods used in the present study. All instrumentation is housed at Adelaide Microscopy (University of Adelaide, Australia).
Sample preparation for FIB cross-section imaging and TEM was done on an FEI-Helios nanoLab Dual Focused Ion Beam SEM. Procedures outlined by Ciobanu et al. (Reference Ciobanu, Cook, Utsunomiya, Pring and Green2011) were followed in the extraction and thinning (to <100 nm) of TEM foils by ion beam (Ga+) milling. The TEM foils were attached to Cu grids.
High-resolution (HR)-TEM imaging in Bright Field (BF) mode and electron diffraction were performed using a Philips CM200 TEM. The instrument is equipped with a LaB6 source and operated at 160 and 200 kV, and utilizes a double-tilt holder and a Gatan Orius digital camera. Energy-dispersive X-ray spectra (EDS) were acquired using an Oxford Instruments X-Max 65T SDD detector running Aztec software. Diffraction measurements were performed using DigitalMicrograph™ 3.11.1 and Winwulff© 1.4.0 software. Publicly available data from the American Mineralogist Crystal Structure Database were used for indexing of the electron diffractions.
High-angle annular dark field-scanning transmission electron microscopy (HAADF-STEM) imaging and EDS measurements were performed using an ultrahigh resolution, probe-corrected, FEI Titan Themis S/TEM. This instrument is equipped with the X-FEG Schottky source and Super-X EDS geometry. The Super-X detector provides geometrically symmetric EDS detection with an effective solid angle of 0.8 Sr. Probe correction delivered sub-Angstrom spatial resolution and an inner collection angle greater than 50 mrad were used for HAADF experiments using the Fischione HAADF detector. The EDS data were collected using both the Philips CM200 and Titan Themis instruments but the spectra shown in this contribution are from the Philips CM200 (spot size ~50 nm), except for the smallest inclusions, which were identified using the Titan Themis instrument (spot size 5–6 nm).
Results
Perthites
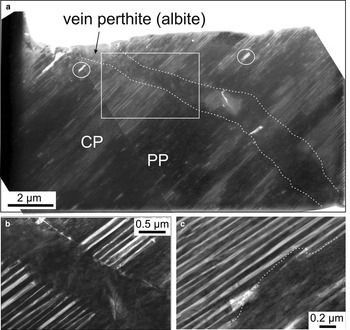
Case study A demonstrates the coexistence of various types of perthites, from cryptoperthites (CP) of igneous origin to patch and vein perthites (PP and VP, respectively), of post-magmatic (deuteric) to early hydrothermal stages (Fig. 4a). Dense, parallel lamellae of albite form regular intergrowths between orthoclase and albite, defining the fields of CP (Fig. 4b). Patch perthite occurs as coarser domains (hundreds of nanometres in size), which pseudomorphically replace areas of CP with both sharp and irregular boundaries (Fig. 4b,c). Relevant TEM-EDS spectra for each perthite type are shown in Supplementary Fig. 1a–c (See below).
BF-TEM images (a–c) showing the main type of perthites (cryptoperthite: CP; patch perthite: PP, and vein perthite: VP) (case study A). Note the superimposition of lamellar PP onto CP in (b) in an area marked by the white rectangle in (a). In detail, such PP lamellae show replacement boundaries against the CP (dashed line) in (c). White circles in (a) represent micropores.
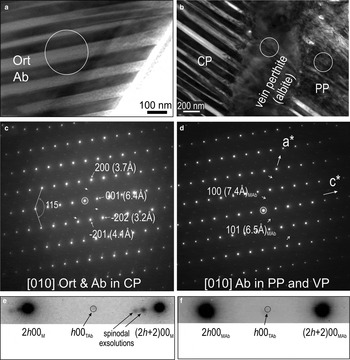
Despite the differences between the regular albite-orthoclase lamellar intergrowths in CP and the irregular albite in both PP and along the vein (Fig. 5a,b), electron diffractions obtained from the three types of perthite show the same orientation of the feldspars when the specimen is tilted down to [010] zone axis in the monoclinic cell of hyalophane/orthoclase and albite. Selected Areas of Electron Diffractions (SAEDS) are shown in Fig. 5c,d. In detail, however, the SAEDs show satellite reflections along h00 (h = 2n) and h0l (h = 2n) directions (arrowed on Fig. 5c,d). These indicate the presence of: (1) two-feldspar exsolutions (sets of satellites along h00) in CP; and (2) reflections corresponding to a triclinic cell in albite in both cases (Fig. 5e,f), noting the presence of h00 (h≠2n) and h0l (h≠2n) reflections, which are forbidden for the C2/m monoclinic symmetry, indicating transition to triclinic symmetry. The arrays of satellite spots with decreasing intensity from the main h00 (h = 2n) reflections are typical of spinodal decomposition (Fig. 5f). The weak reflections corresponding to triclinic symmetry in albite from all three perthites probably relate to the monoclinic-triclinic phase transition in albite.
BF-TEM images (a,b) and corresponding SAED patterns down to [010] zone axis in feldspars as marked in (c,d) showing the epitaxial orientation between all three types of perthites from foil representing case study A (abbreviations as in Fig. 4). White circles mark the SAED areas, where (c) is for CP in (a), and (d) represents both PP and VP [circles in (b)]. Note the presence of satellite reflections (arrowed) in (c–d), indicating the orthoclase (Ort) and albite (Ab) intergrowths [spinodal decomposition in CP from (c)]. In (c,d), the presence of h00 (h≠2n) and h0l (h≠2n) reflections, forbidden for the C2/m monoclinic (M) symmetry, indicates transition to triclinic (T) symmetry. (e,f) Intervals between two main reflections along directions || to c* axis from SAEDs in (c,d), respectively, showing details of the two types of satellite reflections. Note the absence of satellites marking the feldspar intergrowths/decomposition present in CP (e) but not in PP, VP (f).
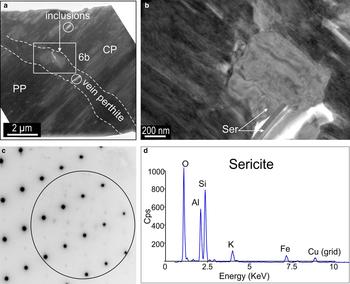
Sub-micro to nanoscale pores, as well as mineral inclusions, are present throughout the PP but the coarsest inclusions (several hundred nanometres in size) occur along the albite vein (Fig. 6a). Numerous sericite inclusions are observed, occasionally with variable orientations, and identified from SAEDs and TEM-EDS spectra (Fig. 6b–d).
BF-TEM images (a,b), SAED pattern (c) and TEM-EDS spectrum (d) of sericite inclusions along the vein albite crosscutting the cryptoperthite (CP) and patch perthite (PP). (a) Inclusions location along the vein. Micropores are indicated by circles. (b) Detail showing the different morphologies and orientations of these inclusions, i.e. stubby and lamellar. (c) SAED pattern obtained from the larger, stubby inclusion where the weaker reflections (circled) are attributable to the coarser (sericite) inclusion within albite down the zone axis as shown in Fig. 5d. (d) Note the Fe peak on the spectrum obtained from the coarser inclusions (spot size ~50 nm). Cps: counts per second.
Hydrothermal potassium feldspar – hyalophane
Case study B is represented by the foil obtained from a previously albitized andesine core, which shows characteristics typical of hydrothermal potassium feldspar at Olympic Dam such as Ba-enrichment ranging from 20 to 27% celsian (Csn) in this sample (Kontonikas-Charos et al., Reference Kontonikas-Charos, Ciobanu, Cook, Ehrig, Krneta and Kamenetsky2017a). The Ba-rich K-feldspar studied here is close to ideal hyalophane, K0.75Ba0.25Al1.75Si2.25O8 (Hyal), i.e. Hyal73–Hyal100; mean Hyal84, and is used as a descriptor for ‘average’ hyalophane henceforth. The complexity of the mineral assemblage down to the nanometre-scale, as indicated by TEM and HAADF-STEM imaging (Fig. 7), comprises a diversity of mineral inclusions, as well as variation in the size and morphology of the main components.
BF-TEM (a) and HAADF-STEM (b) images of foil containing hyalophane (Hyal84; case study B). Line colours on (a) are drawn to show contacts between albite (Ab) and hyalophane (white), sericite inclusions (yellow), and inclusions of Fe oxides (Fe-ox, red), fluorite (Fl, purple), epidote (Ep, green), and apatite (Ap, blue).
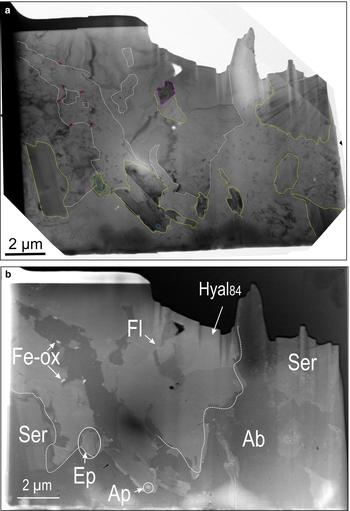
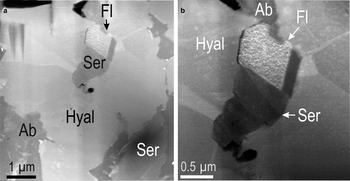
The middle part of the foil shows Hyal84, occurring as an aggregate of platy grains (each several µm in width) radially distributed around an inclusion core consisting of fluorite and sericite (Fig. 8a,b). Weak grain zonation with respect to Ba is also apparent on the HAADF-STEM images (Fig. 8a). There is a ~7% compositional variation with respect to Csn. TEM-EDS spectra for hyalophane of variable composition, sericite and fluorite are shown in Supplementary Fig. 1d–g. Hyalophane is surrounded by albite, in which one side features sharp mutual boundaries, whereas the other displays irregular contacts comprising nano-size inclusions of Fe oxides along the boundary (Fig. 7a,b). Such inclusions are more abundant in areas where islands of albite are also present within Hyal84.
HAADF-STEM (a,b) showing details of the hyalophane (Hyal) aggregate in the middle part of the foil (case study B) surrounding an inclusion core comprising fluorite (Fl) and sericite (Ser).
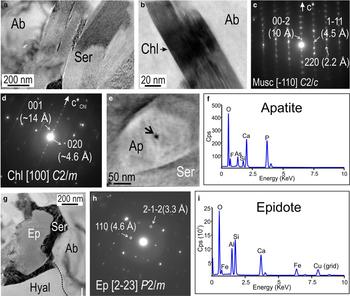
The third most abundant mineral is muscovite (sericite), which occurs as coarse (several µm-sized) radial or lamellar aggregates to nano-scale slivers mostly throughout the albite (Fig. 7). In detail, such slivers are characterized by stacking disorder along the c* axis (Fig. 9a,c). The presence of chlorite is also suggested based on SAEDs obtained from some of the smaller inclusions (Fig. 9b,d). Inclusions of As-bearing fluorapatite (up to 200 nm in size) were also identified within mica (Figs 7, 9e,f). Interestingly, an inclusion (~several hundred nanometres) of a calcic silicate is observed embedded within sericite along the contact between Hyal84 and albite. This is identified as epidote based on TEM-EDS spectra and SAEDs down the [22¯3] zone axis of epidote (Figs 7 and 9g–i).
BF-TEM images of sericite (Ser; a) and chlorite (Chl; b) within albite with corresponding SAEDs on zone axes as marked in (c,d) respectively. (e–f) HAADF-STEM image and corresponding spectrum for an inclusion of As-bearing fluorapatite (Ap) within sericite. The arrow in (e) indicates the location of the beam for the EDS spectrum (~5–6 nm). In (f), note F and As peaks in the apatite spectrum. (g–i) BF-TEM image, SAED (down to zone axis as marked), and TEM-EDS spectrum of an epidote (Ep) inclusion located at the boundary between hyalophane (Hyal) and albite (Ab). Note the envelope of sericite around the epidote in (g).
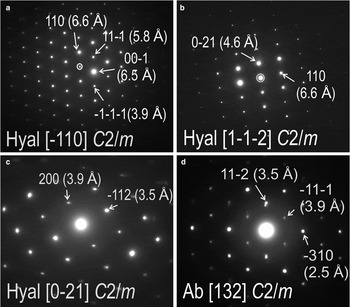
A range of electron diffraction patterns was obtained from the two feldspars (Ab and Hyal84) by tilting the specimen and also changing the foil orientation in the holder (Fig. 10). The two feldspars were observed not to be oriented completely randomly to each another across their direct boundaries when the specimen is tilted on the [11¯0] zone axis in Hyal84, and the adjacent albite is oriented down to [132] zone axis (Fig. 10a,d, respectively). The (hh0)* axis in Hyal84 is parallel to (hh.2l)* in albite, and the (hkl)* directions in the two feldspars are also parallel to one another.
Selected SAED patterns showing zone axes as marked (square brackets) in feldspars from the foil representing case study B. (a–c) Highest-order zone axes obtained from hyalophane (Hyal) in different parts of the foil and at different specimen tilting. (d) SAED down the [132] zone axis in albite (Ab) is obtained at the same tilt with SAED down the [1¯10] zone axis in adjacent hyalophane shown in (a).
Red-stained potassium feldspar and advanced feldspar replacement: Fe and REE metasomatism
Reddening of igneous feldspar at Olympic Dam, referred to here as ‘red-stained potassium feldspar’ (K-Fs), is attributed to Fe metasomatism. This is followed by complete pseudomorphic replacement of feldspar (plagioclase?) by sericite, accompanied by abundant REE-fluorcarbonates and sulfides (Kontonikas-Charos et al., Reference Kontonikas-Charos, Ciobanu, Cook, Ehrig, Krneta and Kamenetsky2017a). Both are studied from two foils obtained from the same drill hole outside the Olympic Dam orebody. Iron metasomatism is expressed by the presence of Fe-oxide inclusions, which, although ubiquitous throughout all feldspars affected by alteration, or completely new (hydrothermal) feldspars (such as the hyalophane above), vary in both abundance (density) and size.
Case study C shows numerous inclusions of Fe oxides, ranging in size from nano to micro-scale, disseminated throughout the foil, which was cut across anomalously Fe-rich domains of preserved magmatic K-Fs. Abundant pores and thin slivers of chlorite are also present (Fig. 11a). The TEM-EDS spectra obtained from host K-Fs, Fe oxides and chlorite are given in Supplementary Fig. 1h–j.
BF-TEM image showing red-stained K-feldspar foil and minerals identified in case study C (K-feldspar, Fe oxide and chlorite). Inclusions of Fe oxides are circled in (a). White squares are locations of areas shown in Fig. 12. Black arrows indicate micropores.
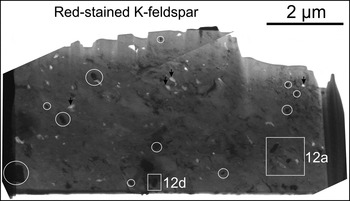
In detail, Fe oxides vary in size from tens to hundreds of nanometres over distances of <1 µm, suggesting that even smaller inclusions (nanoparticles) could also be present in such areas. Note that although pores are present, the Fe-oxide inclusions are not embedded within those pores (Fig. 12a). Electron diffractions obtained from the host K-Fs throughout the foil are consistent with a single feldspar grain. The highest-order zone axes recorded, i.e. [3¯12] and [1¯11¯] in feldspar (SAEDs shown as Fig. 12b,c), could be indexed using the monoclinic cell of orthoclase.
BF-TEM images and SAED patterns for host orthoclase (Ort) and inclusions in case study C. (a) Detail (large rectangle in Fig. 11a) showing size and morphology of Fe oxide and chlorite (Chl) inclusions. Note also the presence of pores. (b,c) Two SAED patterns (obtained at different tilts of the sample) showing the highest-order zone axes (as marked) in orthoclase. (d) Detail (small circle in Fig. 11a) of an area where an inclusion of Fe oxide (maghemite; Mgh?) is located at the boundary between orthoclase and a chlorite inclusion. (e) SAED pattern obtained from area in (d) showing coherent (epitaxial) intergrowths between chlorite and orthoclase (zone axes as marked). Weaker reflections (such as those circled in the white rectangle) could be indexed as maghemite using the P43 space group. (f) Schematic diagram showing the reflections used for maghemite indexing.
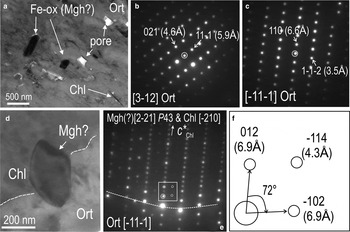
Coherent lattice-scale intergrowths between chlorite inclusions and orthoclase are inferred from electron diffractions obtained across such inclusions. The latter show epitaxial orientation with host feldspar, i.e. c* chlorite on [2¯10] zone axis is parallel with (110)* axis in on [1¯11¯] zone axis in orthoclase (Fig. 12d,e). The speciation of the Fe-oxide inclusion hosted along the contact between the two silicates is traceable from satellite reflections on Fig. 12e,f, which, although relatively faint and irregular, could nevertheless be indexed as maghemite down to the [22¯1] zone axis when using the space group P43.
Pseudomorphic replacement of feldspars (plagioclase, perthitic alkali-feldspar, red-stained K-feldspar) at Olympic Dam commonly results in micro-scale intergrowths of sericite + Fe-oxide assemblages, within which a variety of other mineral species can also be present (Kontonikas-Charos et al., Reference Kontonikas-Charos, Ciobanu, Cook, Ehrig, Krneta and Kamenetsky2017a). Case study D is an exceptional example of this type of replacement, in which REE-fluorcarbonates + molybdenite are the major components. The sample is from a shallower interval (~150 m above case study C) and contains Cu-Au-Mo mineralization, atypical for IOCG systems, as well as both magnetite and hematite, which are important components of the overall hydrothermal alteration assemblage. The foil discussed here was cut across micro-scale patches in which REE-fluorcarbonates from the bastnäsite–synchysite group (BSG) form syntaxic intergrowths with one another (lamellae tens of micrometres in width, and comprising species with low-Ca and high-Ca compositions; Kontonikas-Charos et al., Reference Kontonikas-Charos, Ciobanu, Cook, Ehrig, Krneta and Kamenetsky2017a), as well as also molybdenite (Fig. 13). Other components documented throughout this replacement assemblage are sericite, and minor quartz, Fe oxides and K-feldspar, all filling the shape of a replaced feldspar phenocryst (Fig. 11 in Kontonikas-Charos et al., Reference Kontonikas-Charos, Ciobanu, Cook, Ehrig, Krneta and Kamenetsky2017a).
HAADF-STEM (a–c) images and TEM-EDS spectra (d–g) of mineral assemblages in the case study D. (a) Low-resolution image of foil showing lamellar intergrowths between bastnäsite–synchysite group (BSG) species and molybdenite (Mol). Note the dark spots within the BSG representing thinner areas around Fe-oxide inclusions produced by ion milling (see text for further explanation). (b,c) Higher-resolution images of areas circled in (a). Both are of Fe-oxide inclusions within the BSG. Note the lamellar (b) and hexagonal platelet morphology in (c) consistent with hematite (Hm). Appearance of (b) is due to milling from the TEM. Note the centred dark spot in (c), which correlates with the EDS spot. The arrow pointing at the spot in the centre of the lamellae in (c) indicates the location of EDS spectrum (spot size of ~5 nm). (d–g) TEM-EDS spectra of the BSG species (high- and low-Ca), molybdenite, and an Fe-oxide inclusion. Cps: counts per second.
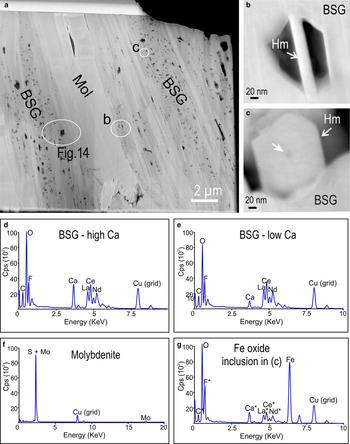
On the HAADF-STEM image of this foil, the lamellar intergrowths between molybdenite and the BSG species are readily identifiable not only by the relative contrast in grey shades (molybdenite is brighter) but also by the pitted appearance of the BSG domains (Fig. 13a). Most of these pits are thinner areas of the foil (see below), however some contain single lamellae of Fe-oxide inclusions (Fig. 13b,c). The Fe oxide is identified as hematite considering the lamellar morphology as seen from orientations either transversal (<20 nm width; Fig. 13b), or parallel (~150 nm wide; Fig. 13c) to the section of the pit. It is likely that the numerous pits are artefacts caused by such hematite inclusions removed during FIB milling. The TEM-EDS spectra for BSG domains (high- and low-Ca), molybdenite and hematite are shown in Fig. 13d–g).
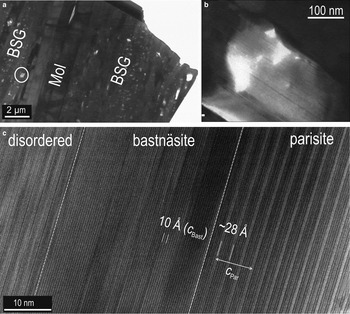
High-resolution (HR)-TEM imaging of one of the thinner areas created by the milling as explained above (Fig. 14a) shows that the BSG minerals form sub-micrometre- (Fig. 14b) to lattice-scale intergrowths with one another (Fig. 14c). Lattice fringes along the c* axis show relatively regular domains, some tens of nm in width, characterized by: (1) single-layer type of ~4.5–5 Å width; and (2) two layer types forming a sequence of ~28 Å width separated by a brighter and wider layer (Fig. 14c). These sequences are attributable to intervals of bastnäsite and parisite. Although the ~35 nm interval of bastnäsite is relatively regular, the stacking disorder is observed on one side (Fig. 14c).
BF-TEM images showing details of the bastnäsite-synchysite group (BSG) intergrowths from the area marked on Fig. 13a. (a,b) Location and low-magnification image of the BSG and molybdenite (Mol) intergrowths. Note the variation in thickness of the sample in (b). (c) High-resolution TEM image of BSG intergrowths in (b) outlining the more ordered stacking sequences over intervals of ~30–40 nm along the c* axis. Bastnäsite and parisite, as well as a disordered stacking sequence are highlighted.
Electron diffraction patterns obtained with the beam tilted perpendicular to the c* axis of the BSG species confirm that the main species throughout the foil are indeed bastnäsite and parisite, albeit with disordering along the c* axis in both species (Fig. 15). The SAED patterns show a distribution of reflections along the c* axis and parallel directions that are concurrent with previous TEM studies of BSG species showing crystal structural modularity typical of mixed-layer compounds, i.e. parisite is a 6-fold superstructure of bastnäsite when oriented on [213¯0] or equivalent [1¯100] zone axes (Fig. 15a,b). The four main BSG species: bastnäsite [Ln(CO3)F]; parisite [Ca(Ln)2(CO3)3F2]; roentgenite [Ca2Ln3(CO3)5F3]; and synchysite [CaLn(CO3)2], where Ln = REE, are formed by stacking sequences of several layer types and with correlation between the stacking period and chemical composition (Donnay and Donnay, Reference Donnay and Donnay1953; Ni et al., Reference Ni, Hughes and Mariano1993). HR-TEM studies have confirmed such correlation and numerous polytypes have subsequently been described following layer formalism (van Landuyt and Amelinckx, Reference van Landuyt and Amelinckx1975; Wu et al., Reference Wu, Meng, Pan and Yang1998; Meng et al., Reference Meng, Wu, Mou and Li2001, Reference Meng, Wu, Han and Meng2002). One characteristic of these minerals is that they rarely form single crystals but rather occur as ‘polycrystals’ defined by syntaxic intergrowths of two or more species (Donnay and Donnay, Reference Donnay and Donnay1953). Irregular sequences of layers are also common and they can explain the ‘disordered species’,commonly detected by X-ray diffraction (van Landuyt and Amelinckx, Reference van Landuyt and Amelinckx1975).
SAED patterns of bastnäsite, parisite and molybdenite on zone axes as marked by square brackets from case study D. All SAED patterns are obtained at the same sample tilt. (a) Note the streaking along c* in bastnäsite indicative of stacking disorder. (b) Note the parent reflections of bastnäsite (brighter reflections) and the 6-fold superstructure satellites on c* corresponding to parisite. (c) SAED typical of lattice fringes as those in Fig. 14c, showing disordered BSG phases intergrowths along the c* axis and parallel directions (variation in satellite intensity, streaking). (d) SAED pattern of molybdenite indicative of polytype 2H. Crystal-structural disorder/twinning is indicated by satellite reflections (arrowed) and steaking along rows parallel to c*2H. Indexing of hexagonal cells as hkil, where h + k + i = 0.
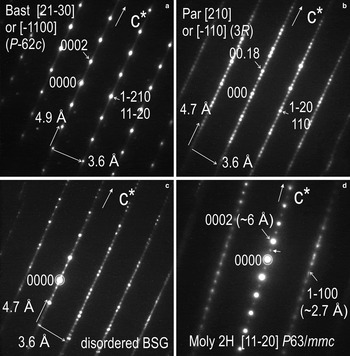
Lattice-scale intergrowths such as those shown in Fig. 14c are characterized by SAEDs with strong disorder along c* (Fig. 15c). Intergrowths throughout this foil are, however, more complex and include other stacking sequences.
Molybdenite shows relatively coherent intergrowths with BSG minerals, albeit with minor rotation between the c* axis in each respective mineral. The hexagonal polytype 2H is identified based on SAEDs down to the [112¯0] zone axis of molybdenite (Fig. 15d). Some crystal-structural disorder/twinning is indicated by satellite reflections (arrowed on Fig. 15d) and streaking along rows parallel to c*2H.
Hillside – endoskarn
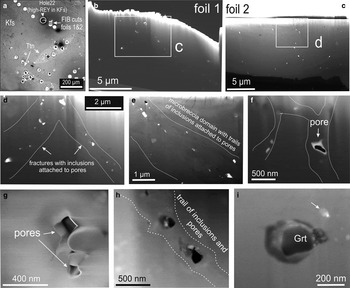
Igneous feldspars containing anomalous concentrations of REY (up to ~500 ppm ΣREY) were studied from two foils obtained from an area adjacent to domains with such measured values (Fig. 16a). FIB imaging shows that feldspar in both foils contains small pervasive inclusions of garnet and titanite (Fig. 16b,c). These are most abundant along fractures and/or trails, some of which form networks (Fig. 16d,e), as are well defined pores (Fig. 16f). Aggregates of inclusions attached to pores and single larger (tens of nanometres) inclusions of calcic garnet (andradite) are also present (Fig. 16f–i).
Secondary Electron (SE) images showing feldspar from the Hillside case study (HS): (a) overview of foil locations from an area adjacent to domains from where LA-ICP-MS data were obtained (Fig. 3). (b–f) FIB cross-section imaging showing pervasive minute inclusions and pores in feldspar. Note concentration of inclusions and pores along fractures and/or trails (d–f). (g,h) Aggregated inclusions attached to pores and larger inclusions of garnet. (i) Nanometre-scale inclusions of garnet (Grt).
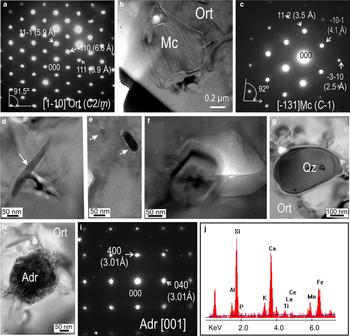
Electron diffraction patterns obtained from the host feldspar in both foils show single grains in each case, and the highest-order zone axis recorded was indexed as [11¯0] using the monoclinic cell (Fig. 17a). Electron diffraction patterns obtained from a sub-micrometre inclusion of K-feldspar include (h0l) and (hkl) reflections which do not meet the conditions h = 2n and h + k = 2n of the C2/m space group; and thus were indexed using the triclinic cell of microcline (Fig. 17b,c). Numerous inclusions of variable size (~5–50 nm) and habit (acicular to granular) were imaged from both foils (Fig. 17d–h). The acicular type is associated with lattice defects (Fig. 17d), whereas the granular inclusions are hosted within pores (Fig. 17f). Quartz and andradite are among the largest inclusions (>100 nm) identified using TEM-EDS. The SAED patterns of first order, i.e. [001] zone axis, are shown for garnet in Fig. 17i. The TEM-EDS spectrum from the same inclusion shows not only major Ca, Fe, Al and Si peaks but also minor peaks for Ti and REE (Fig. 17j). Many of the granular sub-micrometre to nanometre-scale inclusions in orthoclase can be attributed to such calcic (grandite series) garnets. These are main rock components in the skarn at Hillside and are also major REY carriers (Ismail et al., Reference Ismail, Ciobanu, Cook, Teale, Giles, Schmidt Mumm and Wade2014; Ismail, Reference Ismail2016). Whereas the coarse orthoclase grains are magmatic, the microcline and quartz are probably hydrothermal phases formed during the early metasomatism which produced endoskarn at the granite contact. The thin, acicular inclusions can be attributed to titanite which is present as coarse (hundreds of µm) inclusions in adjacent areas.
BF-TEM images, SAED patterns and TEM-EDS spectra from case study HS. (a) SAED pattern of orthoclase down the [11¯0] zone axis. (b) High-resolution image of microcline (Mc) within orthoclase (Ort). (c) SAED pattern of microcline from (b). (d–h) Higher-resolution images of various inclusions within the orthoclase. Note the andradite within (h). (i) SAED pattern on [001] zone axis of andradite in (h). (j) TEM-EDS spectrum for andradite. Abbreviations: Adr – andradite; Mc – microcline; Ort – orthoclase; Qz – quartz.
Discussion
Nanoscale studies can constrain trace-element redistribution in minerals and help track their mineralogy from initial host to new-formed products (Reich et al., Reference Reich, Hough, Deditius, Utsunomiya, Ciobanu and Cook2011; Ciobanu et al., Reference Ciobanu, Cook, Maunders, Wade and Ehrig2016, Reference Ciobanu, Cook and Ehrig2017a). In addressing feldspars at the nanoscale, we first aimed to understand whether the assumptions of distinct magmatic and hydrothermal stages of feldspar evolution could be substantiated in greater detail. Secondly, we address whether feldspar transformation processes in different parts of a single large deposit such as Olympic Dam, or in a different but similarly anomalously REE-rich system (Hillside), have common features, or differ, and if so, in what ways. It is worth pointing out that thermodynamics and phase equilibria will need to be considered at the appropriate scale of reaction, i.e. considering the effects of particle size on reaction and stability in oxide-bearing systems (Navrotsky et al., Reference Navrotsky, Mazeina and Majzlan2008; Navrotsky, Reference Navrotsky2011). This issue lies, however, beyond the scope of the present study.
Magmatic to hydrothermal feldspars – grain scale (re)mobilization
Perthite transformation via coupled dissolution-reprecipitation reactions (CDRR), from the magmatic stage to replacive albite at OD (Kontonikas-Charos et al., Reference Kontonikas-Charos, Ciobanu, Cook, Ehrig, Krneta and Kamenetsky2017a) is further substantiated by the observations of case study A. The epitaxial orientations between CP (magmatic) and hydrothermal (PP and VP) feldspars (Fig. 4), are clearly indicative of interface-mediated reactions between pre-existing alkali-feldspars and pervading fluid, irrespective of crystal morphology observed at the micro-scale, e.g. the cross-cutting relationships of vein perthite. The presence of Fe-bearing sericite, as inclusions, shows that some of the elements released during such replacement, e.g. K and/or Fe, are trapped within the area of reaction (Fig. 5). Throughout the complex perthites, there is increased porosity at replacement contacts and even more so also along the albite vein (Fig. 4). Overall, this case study shows how grain-scale albitization enhances rock porosity, and probably permeability also, which facilitates element remobilization (e.g. of K and Fe in this instance) and promotes discrete mineral precipitation within the reaction area, i.e. the parent alkali-feldspar grain. Evidence supporting grain-scale element exchange during feldspar replacement is provided by hydrothermal experiments with plagioclase feldspars at 600°C and 2 Kbar (Hövelmann et al., Reference Hövelmann, Putnis, Geisler, Schmidt and Golla-Schindler2010). These show that albitization leads to changes in oxygen isotope signatures, as well as mobilization of elements such as Al and Ti that are otherwise considered largely immobile in hydrothermal environments.
The hypothesis that hydrothermal Ba-bearing K-feldspar, hyalophane, can form in the middle of a magmatic phenocryst, based on contrasting chemistry, morphology and replacement environment (Kontonikas-Charos et al., Reference Kontonikas-Charos, Ciobanu, Cook, Ehrig, Krneta and Kamenetsky2017a), is further supported by the nanoscale complexity of the mineral assemblage in case study B. This is highlighted by the presence of nanometre-scale inclusions of calcic silicates (documented here for the first time at Olympic Dam), As-bearing apatite and Fe oxides, which are located along reaction boundaries in albite (Figs 6 and 8). The formation of such minerals may be predictable as albitization of andesine in the phenocryst core releases Ca, whereas Ba, and K, necessary to form hyalophane, could be sourced from the perthite zones of the same phenocryst. Involvement of F-, Fe-, As-bearing fluids locally remobilizing, or introducing such elements at this stage is also feasible from the assemblage observed comprising fluorite (as a nucleation core for hyalophane), minute Fe-oxides, and As (within fluorapatite). The presence of chlorite, which has been documented here from the smaller sericite inclusions in albite, show that such fluids also carry Mg, even though this could be remobilized from igneous amphiboles observed within the same phenocryst (Kontonikas-Charos et al., Reference Kontonikas-Charos, Ciobanu, Cook, Ehrig, Krneta and Kamenetsky2017a). Such reactions and the occurrence of Ba-rich K-feldspar, are observed in samples from other parts of the RDG at Olympic Dam (e.g. adjacent to the ODBC; Kontonikas-Charos et al., Reference Kontonikas-Charos, Ciobanu, Cook, Ehrig, Krneta and Kamenetsky2017a), or in the early and distal skarn at Hillside (Ismail, Reference Ismail2016).
Both foils discussed above, obtained from the same polished block sample, are illustrative of the preservation of initial rock compositions following mineral reactions driven via CDRR in this case, supported by whole-rock geochemistry (Kontonikas-Charos et al., Reference Kontonikas-Charos, Ciobanu, Cook, Ehrig, Krneta and Kamenetsky2017a). The large size of magmatic feldspars, the presence of perthites, and the zonation between both alkali-feldspar and plagioclase (rapakivi textures), all assist grain-scale element recycling, a type of remobilization that may also lead to telescoping of alteration styles.
Broader-scale zonation patterns: metasomatism and advanced feldspar replacement
At Olympic Dam, fluids become richer in Fe, REY and other metals, e.g. Mo (Kontonikas-Charos et al., Reference Kontonikas-Charos, Ciobanu, Cook, Ehrig, Krneta and Kamenetsky2017a), as reactions between feldspars and fluids progress. Red-staining of K-feldspar, observed pervasively within and outside the ODBC is probably the initial stage of Fe metasomatism and suggests the presence of nanoscale hematite (or other Fe oxides) (Kontonikas-Charos et al., Reference Kontonikas-Charos, Ciobanu, Cook, Ehrig, Krneta and Kamenetsky2017a). Comparably, dusty inclusions of Fe oxides are reported from early skarn (in which feldspars are preserved) at Hillside (Ismail et al., Reference Ismail, Ciobanu, Cook, Teale, Giles, Schmidt Mumm and Wade2014; Ismail, Reference Ismail2016). Studies of granitic terranes elsewhere contend that the presence of hematite in porous, red-clouded feldspars is strong evidence for large-scale crustal fluid–rock interaction (Putnis et al., Reference Putnis, Hinrichs, Putnis, Golla-Schindler and Collins2007).
The results here show abundant, nanometre-scale inclusions of Fe oxides throughout red-stained orthoclase (case study C) and also in a REE-fluorcarbonate + molybdenite + sericite assemblage that has completely pseudomorphed a pre-existing feldspar (case study D). Speciation of the Fe oxide itself appear to be maghemite and hematite in the two case studies, respectively. Although more data are needed to confirm the identification of maghemite, this is likely to form on behalf of a precursor magnetite and such results are, moreover, concurrent with the presence of co-existing chlorite. Both chlorite and magnetite/maghemite are indicative of a more reduced environment (presence of Fe2+ in the system) prior to the sericite (hydrolytic) stage, which is expressed in the BSG-molybdenite assemblage hosting hematite. Differences between precipitation rates can be invoked to explain the relative lack of open pores around the Fe oxides in the advanced replacement of feldspars compared to the perthites. The replacement reactions are, nevertheless, of comparable CDRR type, as evidenced by epitaxial intergrowths observed at the nanoscale, i.e. between orthoclase and chlorite, among REE-fluorcarbonate species, and between those fluorcarbonates and molybdenite.
Notably Fe metasomatism, as it becomes prominent, is associated with more complex alteration assemblages, which may be associated with ore deposition, i.e. REE, Ca, F, as well as Mo and S (case study D). This is initiated by the replacement of feldspars that can lead to diverse mineral assemblages, if sufficiently advanced, and ultimately with the potential to obliterate recognizable granite within the ODBC. The strong correlation between precipitation of hematite, REE, and ore sulfides is unequivocal evidence that Fe metasomatism and sulfide deposition are associated with one another in time and space within the host granite.
The two examples here, the simpler assemblage in the red-stained feldspar, and the mineralogically diverse assemblages attributable to advanced replacement in the REE-fluorcarbonate-molybdenite, are from the same drillhole, and overlie an interval displaying pronounced albitization (Krneta et al., Reference Krneta, Ciobanu, Cook, Ehrig and Kontonikas-Charos2016; Kontonikas-Charos et al., Reference Kontonikas-Charos, Ciobanu, Cook, Ehrig, Krneta and Kamenetsky2017a). The red-stained K-feldspar and mineralized sample occurs 150 m above the other. Such mineralogical differences can be explained by progressive metasomatism being enhanced by an increase in fluid/rock ratios. Early feldspar alteration of the perthite type observed at depth would have increased pore-controlled permeability (as shown in case study A), assisting an upwards-directed focusing of fluids at higher rates than otherwise expected in granitic rocks, leading to advanced metasomatism and ore deposition above the albitized interval.
The nanometre-scale of the calc-silicate inclusions within orthoclase documented here from the skarn-granite contact at Hillside (Figs 16 and 17), is a further example of metasomatism traceable down to the nanoscale. The evidence shows that, in the absence of plagioclase, Ca and Fe can be sourced from a carbonate protolith leading to the formation of abundant calc-silicates. Hillside, like most skarn systems (Meinert, Reference Meinert1992), displays a deposit-scale zonation of calc-silicate assemblages (of which andradite is a main component) relative to magmatic contacts (Ismail et al., Reference Ismail, Ciobanu, Cook, Teale, Giles, Schmidt Mumm and Wade2014; Ismail, Reference Ismail2016). Although the skarn zoning is preferentially a function of protolith replacement, feldspars can also host REY and other trace elements in substantial amounts when affected by endoskarn formation, as outlined below.
Rare-earth element remobilization: the role of feldspars in defining IOCG mineral signatures
In both deposits discussed here, igneous feldspars are modest hosts for REY, with ΣREY ranging between a few ppm (K-feldspars) to tens of ppm (plagioclase), although they have distinct chondrite-normalized patterns that can be correlated with alteration stages (e.g. Ismail et al., Reference Ismail, Ciobanu, Cook, Teale, Giles, Schmidt Mumm and Wade2014; Kontonikas-Charos et al., Reference Kontonikas-Charos, Ciobanu and Cook2014, Reference Kontonikas-Charos, Ciobanu, Cook, Ehrig, Krneta and Kamenetsky2017b). An increase in ΣREY is observed with progressive albitization, e.g. replacive albite (VP) hosts slightly more REY than PP at OD (means 36 ppm and 24 ppm, respectively; Kontonikas-Charos et al., in Reference Kontonikas-Charos, Ciobanu, Cook, Ehrig, Krneta and Kamenetsky2017b), and red-stained, porous K-feldspar has the lowest ΣREY of all (mean 5–6 ppm; Kontonikas-Charos et al., in Reference Kontonikas-Charos, Ciobanu, Cook, Ehrig, Krneta and Kamenetsky2017b). Although the red-stained feldspar is a product of Fe-metasomatism, the latter is inefficient with respect to CDRR-driven remobilization/concentration of REY from the local reaction environment since it lacks the more complex trace-element signature of either the fluids or the parent feldspar. If this can be substantiated by other studies, zonation halos enclosing these deposits are probably due to such a reaction rather than to an influx of hydrothermal fluids external to the pluton. In cases where CDRR is not operative, feldspars (particularly albite), can retain as much as 200 ppm ΣREY (e.g. feldspathic schist at Moonta-Wallaroo; Kontonikas-Charos et al., Reference Kontonikas-Charos, Ciobanu and Cook2014), and with chondrite-normalized fractionation trends that mimic those of the whole rock.
Feldspars become strongly depleted in REY if Ca or other elements are available to form discrete REE-minerals (BSG, monazite, allanite, etc.), accessories (titanite, apatite), or calc-silicates (epidote, garnet). Moreover, such minerals are good REY-repositories which can readily occur as nanoscale inclusions within feldspars (e.g. epidote and apatite in case study D), and may increase in abundance to account for as much 500 ppm ΣREY (e.g. andradite and titanite in orthoclase at Hillside; Ismail et al., Reference Ismail, Ciobanu, Cook, Teale, Giles, Schmidt Mumm and Wade2014). The distinct chondrite-normalized REY fractionation patterns (Fig. 3), and ΣREY concentrations in the tens to hundreds of ppm range, are atypical for igneous feldspar. These patterns can nevertheless be explained by the nanoscale observations, which show an abundance of small, regularly distributed mineral inclusions. Their small size and homogeneous distribution is supported by the flatness of signals for REY on time-resolved downhole LA-ICP-MS profiles (Fig. 3b). Potentially, <5 nm nanoparticles, which cannot be visualized readily using instrumentation employed here, may also be present.
The observed marked decrease in ∑REY in feldspars with proximity to the Olympic Dam orebody (Kontonikas-Charos et al., in Reference Kontonikas-Charos, Ciobanu, Cook, Ehrig, Krneta and Kamenetsky2017b) hints at the release and local remobilization of REY from feldspars to form discrete REE minerals. This scenario is illustrated by the example of the REE-fluorcarbonates-molybdenite assemblage (Fig. 12) in the drill hole intersecting the distal satellite mineralization. Evidence for pre-existing feldspars would be obliterated with increasing fluid/ratio metasomatism, but as shown here, Fe-metasomatism is contemporaneous with REE-enrichment when mineralizing fluids (Mo, Cu, Au) are released. Rapid uplift of already albitized granite could focus such fluids in the cupola areas of the RDG and explain the REE enrichment in the mineralized hematite breccias at OD. In contrast, the REE enrichment in skarns will concentrate these elements into calc-silicates rather than as REE-discrete minerals, as known from Hillside (Ismail et al., Reference Ismail, Ciobanu, Cook, Teale, Giles, Schmidt Mumm and Wade2014).
Implications and outlook
The complexity of the mineral reactions documented here suggests that placing formal labels on alteration stages such as ‘sodic’, ‘calcic’ and ‘potassic’, and arranging these in a systematic sequence, may not adequately reflect what really took place prior to, and at the time of, IOCG ore formation. Alteration stages may have overlapped with one another and reaction products may have been metastable, e.g. preservation of monoclinic-triclinic transitions in feldspars. The complexity of reactions documented also highlights the importance of detailed petrography and mineralogy, together with geochemistry, in order to support interpretations made on alteration stages within magmatic-hydrothermal systems.
CDRR, as documented here for reactions during post-magmatic perthite formation, therefore not only assists in the mobilization of elements from feldspar but also opens up nanoscale pore spaces for the mobilized elements to be trapped as inclusions. This supports the overall hypothesis that albitization and other expressions of feldspar alteration enhance rock porosity and drive element remobilization. Without a suitable trap mechanism at the deposit scale (e.g. cap rock, fault structures etc.), however, hydrothermal fluids may be easily lost from the system. The enhanced porosity, and likely permeability, resulting from CDRR is not only critical for the REE distribution but is observed in a broad variety of ore and alteration assemblages across the Olympic Dam deposit. The importance of CDRR at OD is documented, for example, in assemblages involving uraninite (Macmillan et al., Reference Macmillan, Cook, Ehrig, Ciobanu and Pring2016a,Reference Macmillan, Ciobanu, Ehrig, Cook and Pringb,Reference Macmillan, Ciobanu, Ehrig, Cook and Pringc).
Although this contribution has focused exclusively on the nanoscale evidence for REY release from feldspars, similar mechanisms may also apply to other critical metals which may be initially concentrated within the feldspar lattice, and which seldom form independent minerals in igneous rocks. These include Ga, Sc and Nb, all of which are enriched at Olympic Dam relative to crustal values. Considering the abundance of feldspars in granitoid-hosted IOCG systems, their role in re-concentrating a whole range of critical metals should not be ignored. Identifying reaction pathways and product host phases for these critical metals is beyond the scope of the present work but future work should address the distributions of these elements in feldspars and in hydrothermal reaction products ranging from discrete REE-minerals to calc-silicates. This represents an essential step towards establishing and unlocking their long-term resource potential.
Acknowledgements
This is a contribution to the ‘FOX’ project (characterization of Fe oxides), supported by BHP Billiton Olympic Dam and the South Australian Government Mining and Petroleum Services Centre of Excellence. AKC acknowledges the Deep Exploration Technologies Co-operative Research Centre for scholarship support. NJC acknowledges support from the ARC Research Hub for Australian Copper-Uranium. Constructive comments from reviewers Oliver Plümper, Tina Hill and Artur Deditius, and from Special Issue editors Erik Jonsson and John Bowles, helped the authors to improve the manuscript.
Supplementary material
To view supplementary material for this article, please visit https://doi.org/10.1180/minmag.2017.081.040


 Open access

