




Introduction
Iron is essential for animal health, supporting growth, metabolism, and blood production (Seyoum et al. Reference Seyoum, Baye and Humblot2021). Pigs often receive iron supplements, particularly during weaning, when piglets have fewer iron reserves to meet their increased iron needs due to rapid growth and higher blood volume. Traditionally, ferrous sulfate, an inorganic iron source, is used, but it has been linked to poor bioavailability (Lee et al. Reference Lee, Shinde and Choi2008; Li et al. Reference Li, Hansen and Borst2016; Sun et al. Reference Sun, Yu and Luo2022), intestinal damage, oxidative stress, and gut microbiota imbalances (Abbas et al., Reference Abbas, Hayirli and Drakesmith2022; Chen et al. Reference Chen, Wu and Wang2020; Knight et al. Reference Knight, Wang and Donovan2019; Nairz and Weiss Reference Nairz and Weiss2020).
Organic iron sources such as polysaccharide iron complexes (PICs), including SQM® iron from Quali Tech, offer an alternative. These sources, complexed with organic molecules, potentially enhance iron stability and bioavailability while reducing side effects like diarrhea (Huang et al. Reference Huang, Yang and Xie2023a). SQM® iron is a commercial PIC. In a previous study using a human colonic adenocarcinoma (CaCo-2) cell model, SQM® iron showed greater iron availability than ferrous sulfate (Wortley et al. Reference Wortley, Leusner and Good2005). Moreover, inorganic iron sources like ferrous sulfate can damage the gut barrier and affect nutrient absorption (Chen et al. Reference Chen, Wu and Wang2020; Ding et al. Reference Ding, Yu and Chen2020a, b). SQM® iron effects on gut barrier and nutrient absorption in pigs warrants investigation.
Despite promising results with organic iron sources in other studies, research on SQM® iron specifically in pigs is limited. Investigations into its effects on gut health, including indicators like d-lactate and diamine oxidase (DAO; Ruan et al. Reference Ruan, Gong and Zhang2004; Wolvekamp and de Bruin Reference Wolvekamp and de Bruin1994), and its impact on the gut microbiota are necessary. Previous studies on other organic iron sources have shown varied effects on gut microbiota depending on the specific source (Ma et al. Reference Ma, Liu and Piao2022; Zeng et al. Reference Zeng, Jiang and Zhou2023). For example, PICs have been shown to inhibit pathogenic bacteria while promoting beneficial ones (Gao et al. Reference Gao, Jiang and Wan2020). The effect of SQM® on pig’s gut microbiota warrants investigation.
Our study hypothesized that SQM® iron would positively affect growth performance, gut integrity, and microbiome in nursery pigs compared to ferrous sulfate, and we explored how sanitary conditions influenced these effects. The objective was to assess SQM® iron’s impact on growth, gut health, and microbiome in nursery pigs.
Materials and methods
Animal use protocol F22-009 (AC11741) was reviewed and approved by the University of Manitoba Animal Care Committee, and pigs were handled according to the guidelines described by the Canadian Council on Animal Care (CCACare 2009).
Feed preparation
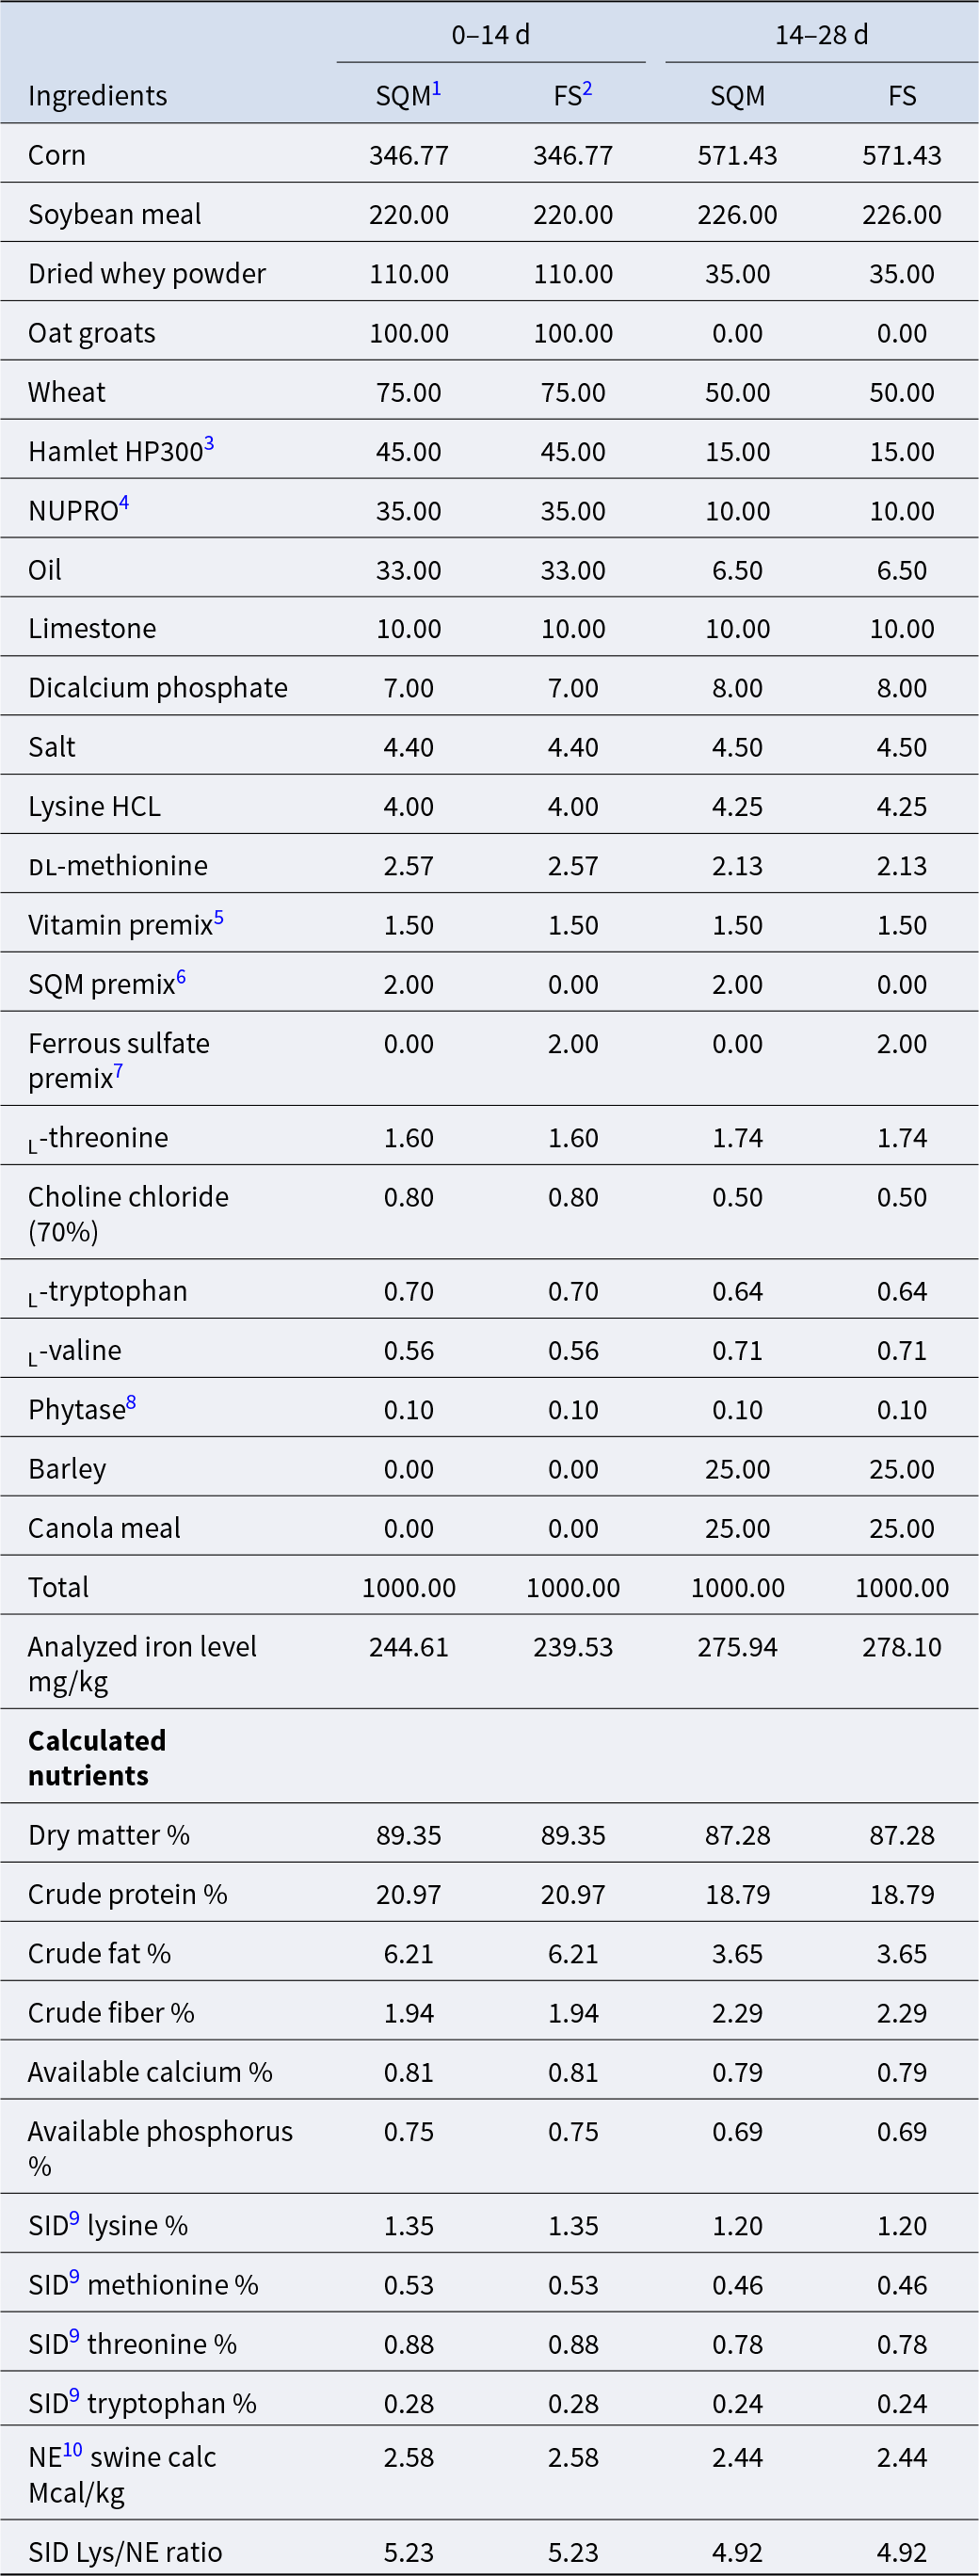
The diets were provided as mash feed, formulated in a two-phase feeding program (Table 1) and prepared at the Glenlea Research Station Feed Mill at the University of Manitoba. The iron levels in the feed ingredients and in the final mash feeds were analyzed prior to the experiment. Iron was supplemented to the feeds with a trace mineral premix (supplemented with organic iron or inorganic iron). The organic iron source was iron polysaccharide complex (SQM® iron, QualiTech); the inorganic iron source was ferrous sulfate heptahydrate. The iron content in diets was set to meet or exceed the dietary iron requirement of nursery pigs (NRCl 2012).
Composition and nutritional values of experimental diet, as-feed basis g/kg

Table 1 Long description
The table lists ingredient inclusion rates (grams per kilogram, as-fed) and nutrient targets for two pig diet phases, days 0 to 14 and days 14 to 28, comparing SQM9 versus FS10 iron sources. In both phases, the SQM and FS formulas are identical except for the iron premix: SQM premix is 2 g per kg in SQM diets and 0 in FS diets, while ferrous sulfate premix is 2 g per kg in FS diets and 0 in SQM diets. For days 0 to 14, major ingredients are corn 346.77, soybean meal 220, dried whey 110, oat groats 100, and wheat 75 g per kg; for days 14 to 28, corn rises to 571.43, soybean meal is 226, whey drops to 35, oat groats drop to 0, and barley and canola meal are added at 25 g per kg each. Total diet weight is 1000 g per kg for all four diets. Analyzed iron is similar within each phase: about 244.61 versus 239.53 mg per kg in days 0 to 14, and about 275.94 versus 278.10 mg per kg in days 14 to 28. Calculated nutrients are the same between SQM and FS within each phase; from early to later phase, crude protein decreases from 20.97 to 18.79 percent and net energy decreases from 2.58 to 2.44 Mcal per kg. Values are presented as formulated targets and analyzed iron, so actual nutrient composition may vary with ingredient variability and analysis methods.
1 Polysaccharide iron complex.
2 Ferrous sulfate.
3 Hamlet HP300: from Hamlet Protein.
4 NUPRO: from Alltech. Protein ingredient based on yeast extract and plant protein.
5 The vitamin premix (DSM Nutritional Products Canada Inc. Ayr, ON) provided the following quantities of vitamins per kilogram of diets: Vitamin A, 13,500 IU; Vitamin D3, 750 IU; 25-OH-D3, 1000 IU; Vitamin E, 100 IU; Vitamin B12, 55 μg; Biotin, 300 μg; Menadione, 4 mg; Thiamine, 4 mg; Riboflavin 11 mg; Pantothenic acid, 45 mg; Pyridoxine, 4.5 mg; Ascorbic acid, 100 mg; Niacin 50 mg; and Folic acid, 1.7 mg.
6 The trace mineral premix with organic iron (QualiTech, Inc., MN) contains iron polysaccharide complex, roughage products, zinc sulfate, manganese sulfate, copper sulfate, sodium selenite, ethylenediamine dihydriodide, and mineral oil. The premix provided the following quantities of minerals in both organic and inorganic diets per kg: Manganese, 75 mg; Zinc, 130 mg; Iron, 100 mg; Copper, 25 mg; Iodine, 10 mg; and Selenium, 0.3 mg.
7 The trace mineral premix with inorganic iron (QualiTech, Inc., MN) contains roughage products, zinc sulfate, ferrous sulfate, manganese sulfate, copper sulfate, sodium selenite, ethylenediamine dihydriodide, and mineral oil. The premix provided the following quantities of minerals in both organic and inorganic diets per kg: Manganese, 75 mg; Zinc, 130 mg; Iron, 100 mg; Copper, 25 mg; Iodine, 10 mg; and Selenium, 0.3 mg.
8 Phytase: from AB vista.
9 Standardized ileal digestible.
10 Net energy.
Experimental design
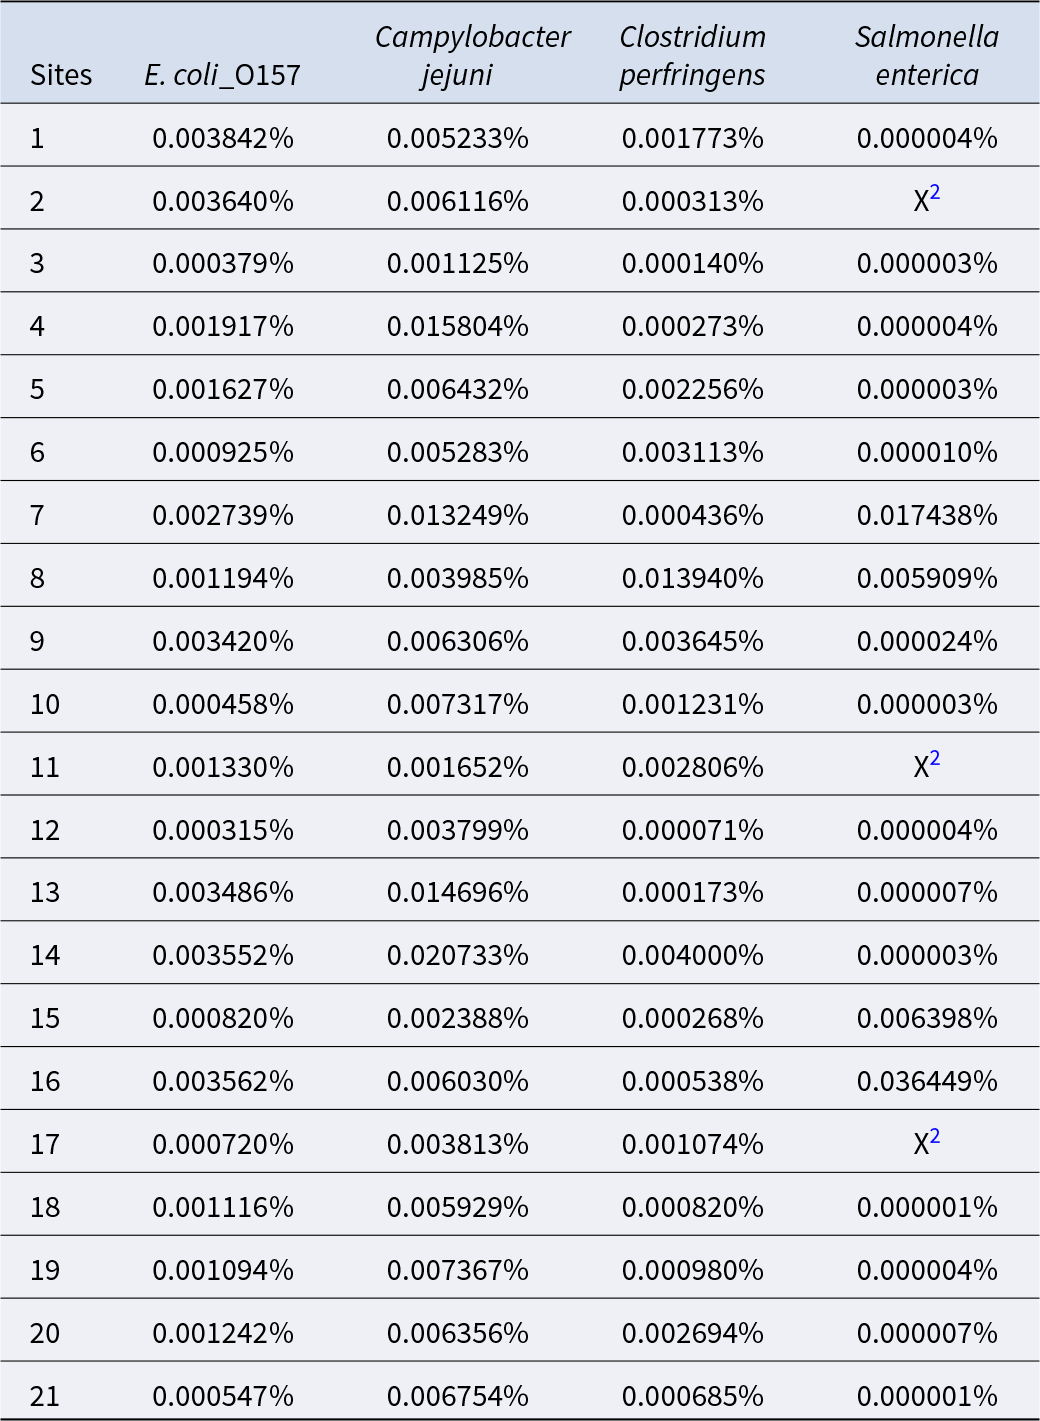
A total of 320 TN70 mixed-sex piglets (castrated males and females) were obtained from the swine barn of the Glenlea Research Station at the University of Manitoba. The pigs were housed in 32 pens with 10 pigs per pen. Two rooms were assigned as clean rooms, and two rooms were assigned as dirty rooms. In this study, the setup of clean and contaminated environments was adapted from the classic methods described by Floc’h et al. (Reference Floc’h, Knudsen and Gidenne2014) and Montagne et al. (Reference Montagne, Arturo-Schaan and Floc’h2010). The clean rooms were sanitized and disinfected and were gently washed with an unpressurized hose weekly during the experiment, whereas the dirty rooms remained unwashed for the duration of the experiment. Polymerase chain reaction (PCR) tests were conducted on fecal samples collected at various locations within the Glenlea Swine Barn to confirm the presence of pathogenic bacteria (Table 2). Experimental pens in the dirty rooms were inoculated with fecal matter confirmed with pathogenic bacteria. The bacteria of interest were E. coli O157, Campylobacter jejuni, Clostridium perfringens, and Salmonella enterica. The relative quantification of pathogenic bacteria was calculated as 2∆C t, where ∆Ct = Ct (bacteria of interest) − Ct (Universal bacterial gene) (Livak and Schmittgen Reference Livak and Schmittgen2001). The area of confirmed pathogenic bacteria was targeted for fecal collection into 5-gallon plastic buckets and stored in a freezer 1 day prior to the experiment. To ensure equal application of bacteria to each dirty pen, one scoop from each fecal-containing bucket was taken into an empty bucket and mixed with room-temperature tap water (1 part fecal to 1 part water) to make a slurry that was applied to the pens.
Relative quantification1 of pathogenic bacteria from ground fecal samples collected in various sites from Glenlea Swine Barn
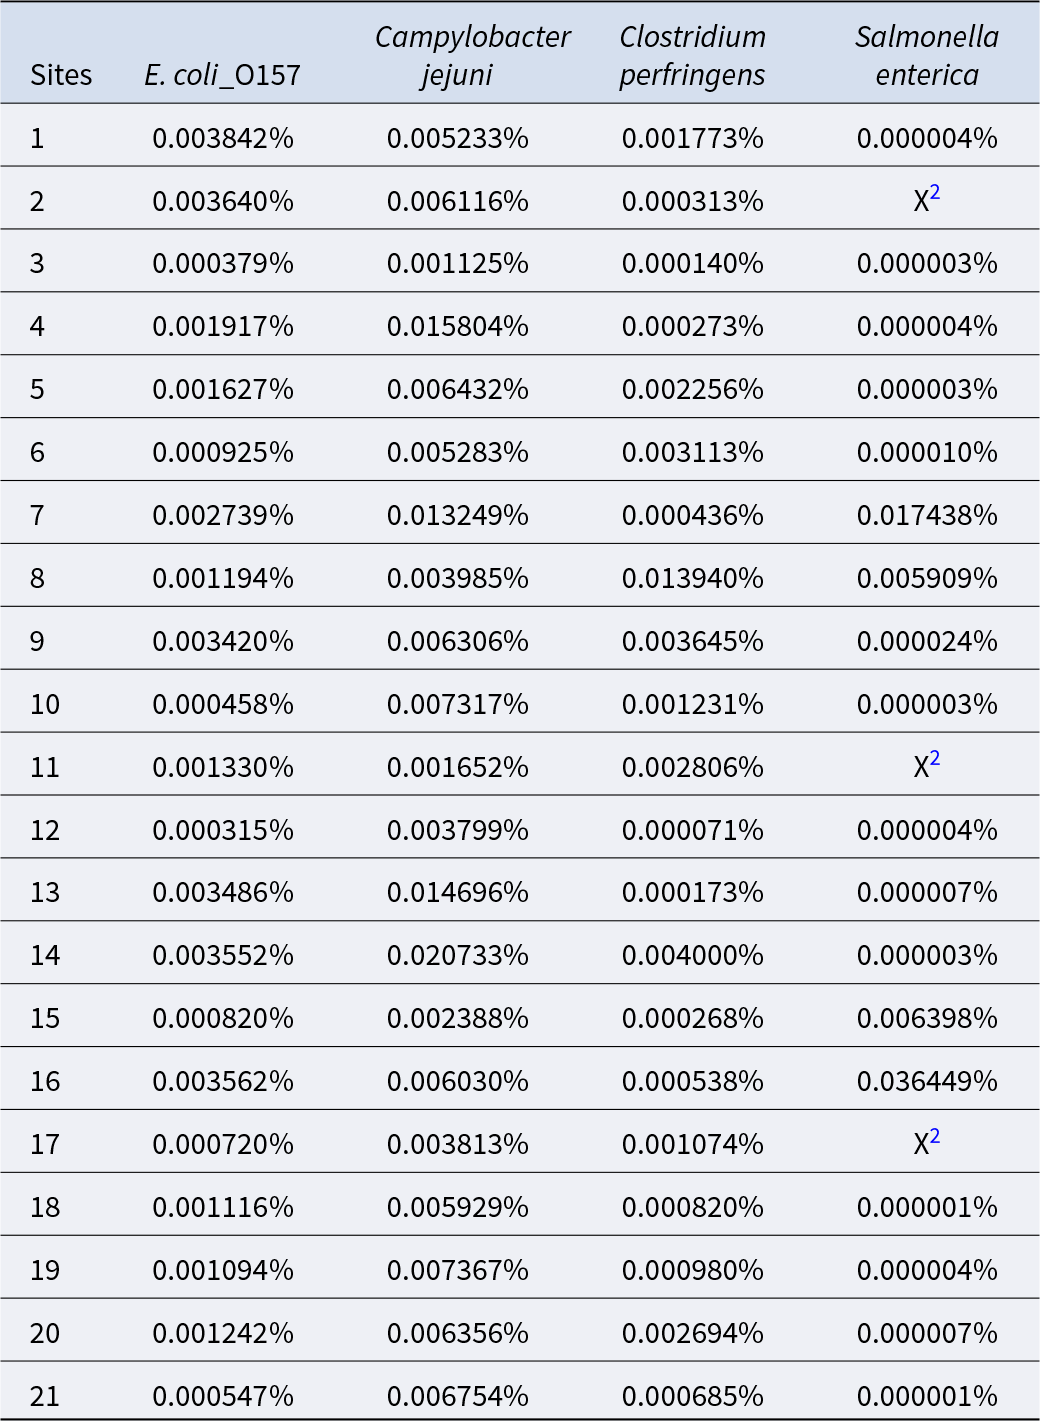
Table 2 Long description
Relative abundance percentages are listed for four pathogens across 21 sampling sites from ground fecal material. Campylobacter jejuni is consistently the highest of the four, ranging from 0.001125% (site 3) to 0.020733% (site 14), with other high values at site 4 (0.015804%) and site 13 (0.014696%). E. coli O157 stays low throughout, from 0.000315% (site 12) to 0.003842% (site 1), with several sites near 0.0035%. Clostridium perfringens varies more, reaching 0.013940% at site 8 and 0.004000% at site 14, while the lowest is 0.000071% at site 12. Salmonella enterica is extremely low at most sites (often around a few millionths of a percent) and is not detected at sites 2, 11, and 17, but shows clear spikes at site 16 (0.036449%), site 7 (0.017438%), site 15 (0.006398%), and site 8 (0.005909%). Overall, most sites show low pathogen levels with a few localized hotspots, especially for Salmonella and Clostridium. Values come from a molecular quantification method, so results reflect relative abundance and should be interpreted as comparative rather than absolute counts.
1 Numeric values obtained by qPCR and calculated by the ΔΔCt method (Livak and Schmittgen Reference Livak and Schmittgen2001).
2 X means not detected.
The pens were randomly assigned to two dietary treatments and two sanitary conditions within the clean and dirty rooms (eight pens per treatment): 1) diet supplemented with organic iron in clean sanitary condition; 2) diet supplemented with organic iron in dirty sanitary condition; 3) diet supplemented with inorganic iron in clean sanitary condition; and 4) diet supplemented with inorganic iron in dirty sanitary condition. The pigs were fed with phase I diet from day 0 to day 14 and phase II diet from day 15 to day 28. Pig health condition was monitored daily, and pigs were handled according to the guidelines of the Canada Council on Animal Care (CCAC 2009). On day 28th, one pig from each pen was randomly selected and transported to the T.K. Cheung Centre for Animal Research, anesthetized by an intramuscular injection of ketamine and xylazine (20:2 mg/kg body weight [BW]), and euthanized with a captive bolt gun for sample collection.
Animals and management
Pigs were weighed on day 0 and distributed into the floor pens of identical size, 6 ft × 5 ft (30 sq ft). The pens were separated by a plastic partitioning board, and the floor was slatted metal coated with plastic. Pigs were allowed ad libitum access to feed and drinking water (water nipples) during the experiment. The temperature curve started at 27°C and decreased to 22°C by day 28 in the nursery. The lights were turned off from 5 pm to 5 am automatically in the nursery rooms.
Growth performance and organ weights
Feed intake and BW were collected weekly to calculate average daily gain (ADG), average daily feed intake (ADFI), and feed conversion ratio (FCR, feed/gain). Pig BW and organ weights (heart, liver, and kidney) were recorded. The relative organ weight was calculated as follows:
Relative organ weights (%) = Organ weight (g)/pig BW (g) × 100%
Fecal scores
Fecal scores were collected weekly and rated based on a 0–3 score scale described in a previous study (Pérez-Calvo et al. Reference Pérez-Calvo, Wicaksono and Canet2019). The rating of fecal score was done by the same person throughout the experiment. A brief description of the scale is as follows:
1. Normal: well-formed solid feces
2. Soft feces: formed soft feces
3. Mild diarrhea: fluid feces with yellowish color
4. Severe diarrhea: watery and projectile feces.
Fecal iron analysis
Fresh floor fecal samples were collected on days 0, 14, and 21. The samples were flash frozen in liquid nitrogen and stored in a −80°C freezer before being transported in a sealed polyurethane foam box to the Central Lab Testing Inc (Winnipeg, Manitoba). In the lab, samples were thawed and oven-dried at 55°C for 16 h. Then the samples were ground using a Retsch ZM200 grinder before being further dried at 135°C for 2 h to get the dry matter (DM) content (AOAC 2006; procedure 934.01). Finally, the samples were weighted and digested in acid to obtain an in-solution form suitable for Inductively Coupled Plasma Optical Emission Spectroscopy. Final readings of iron content were measured by optical emission spectroscopy at a wavelength of 238/204 nm.
Transepithelial electric resistance and cell permeability measurement
The mid-jejunum was located 4 m from the stomach–duodenum junction. Jejunum samples were rinsed with phosphate-buffered saline solution immediately after sample collection and sealed in a 15 mL tube immersed in an icebox and transported to the lab, where transepithelial electric resistance (TEER) and paracellular flow with fluorescein isothiocyanate-dextran (FITC-dextran) of jejunum samples were determined using Ussing chambers. The Ussing chambers contained pairs of voltage (Ag/AgCl pellet) and current (Ag wire) electrodes enclosed in 3% agar bridges and filled with Kreb–Ranger bicarbonate (KRB) buffer (in mmol·L−1: 154 Na+, 6.3 K+, 137 Cl−, 0.3 H2PO4, 1.2 Ca2+, 0.7 Mg2+, 24 HCO3−, pH 7.4 with 1 μmol·L−1 of indomethacin). Five milliliters of KRB buffer solution mixed with 10 mmol·L−1 d-glucose was added to the serosal chambers. Five milliliters of KRB buffer solution mixed with 10 mmol·L−1 d-glucose was added to the mucosal chambers. A mix of 95% O2 and 5% CO2 was added continuously to the serosal and mucosal chambers. A water-jacketed reservoir was used to keep the temperature of the chambers at 37°C. The possible potential difference existing between the mucosal and serosal chambers was offset before tissue was mounted. Serosal and longitudinal muscle layers were stripped off using micro-forceps before the tissues were mounted in Ussing chambers by using a tissue slider with an aperture of 1 cm2. The tissues were left to equilibrate for 10 min, followed by the recording of TEER for 1 h. The data were calculated by the average of the data points for each tissue sample for the 1-h duration. After equilibration, 0.1 mg·mL−1 of FITC-D4 (molecular weight 4 kDa; Sigma-Aldrich Co.) was added to the mucosal side, and after 1 h, 1 mL of the sample was obtained from the serosal side to measure intestinal permeability. The KRB samples (100 µL) from the serosal side were transferred to 96-well plates. The fluorescence was measured at an excitation wavelength of 485 nm and an emission wavelength of 528 nm using a Bio-Tek PowerWave HT Microplate Scanning Spectrophotometer (BIO-TEK Instruments, Inc., Winooski, VT, USA). The concentrations of FITC-D4 in the KRB buffer (ng·mL−1) were calculated based on a standard curve (R 2 = 0.99). The FITC-D4 flux was measured for 1 h using a slide that has 1 cm2 of well surface area and was expressed as μg·cm−2·h−1·mL−1.
Real-time PCR
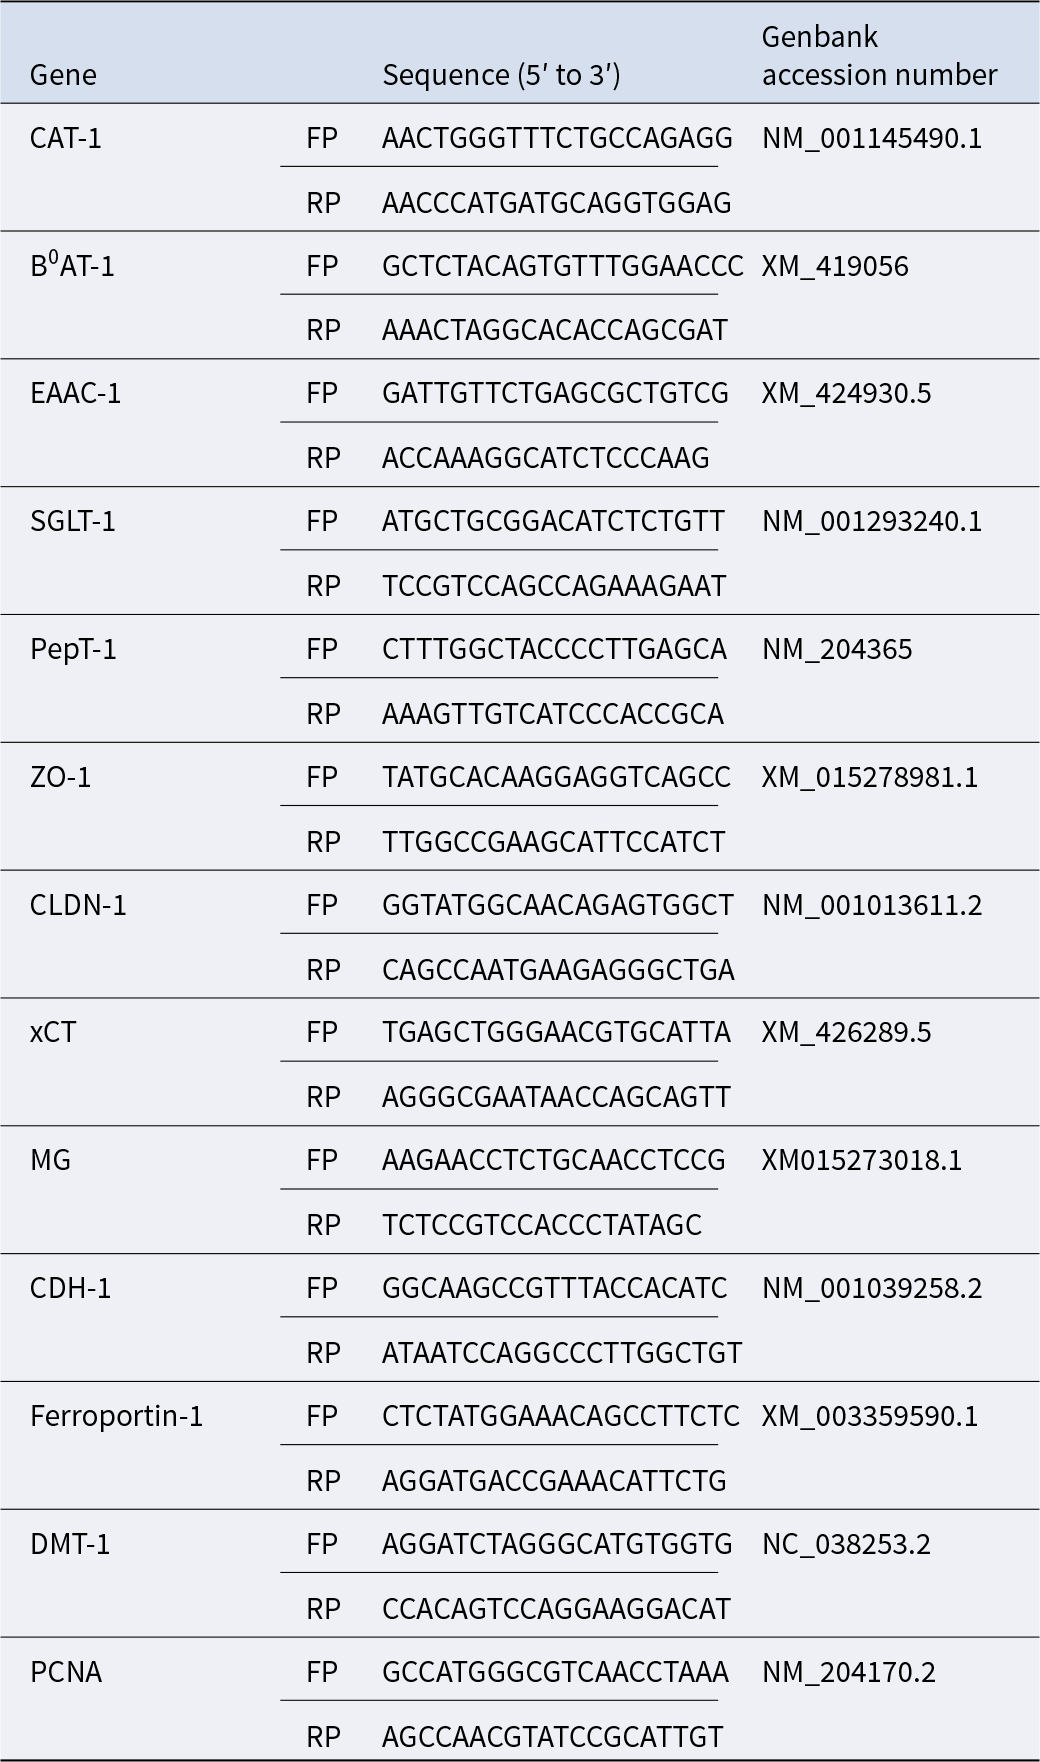
Total RNA from jejunum samples was extracted using TRIzol reagent (Invitrogen, Carlsbad, CA, USA) according to the manufacturer’s instructions. The extracted RNA’s quantity was measured by a Nanodrop 2000 spectrophotometer (Thermo Fisher Scientific Inc., Ottawa, ON, Canada), and the RNA quality was checked by 1% agarose gel electrophoresis. Complementary DNA was synthesized from RNA using iScriptTM cDNA synthesis kit (Bio-Rad, Mississauga, ON, Canada) and quantitative Real-time PCR (qPCR) of genes, including neutral amino acid transporter (B0AT-1), cationic amino acid transporter-1 (CAT-1), glutamate transporters excitatory amino acid carrier-1 (EAAC-1), peptide transporter-1 (PEPT-1), sodium-dependent glucose transporter-1 (SGLT-1), cysteine/glutamate antiporter (xCT), zonula occludens-1 (ZO-1), cadherin-1 (CDH-1), claudin-1 (CLDN-1), maltase-glucoamylase transporter (MG), divalent metal transporter-1 (DMT-1), Ferroportin-1, and proliferating cell nuclear antigen (PCNA), were determined by iQ™ SYBR® Green Supermix (Bio-Rad) in a CFX ConnectTM Real-Time PCR Detection System (Bio-Rad). The qPCR was performed to quantify nutrient transporter genes and tight junction (TJ) proteins. The cycling conditions were 95°C for 3 min, 40 cycles at 95°C for 20 s, 60°C for 30 s, and 72°C for 30 s. The cyclophilin-A (CYCA) gene was used as the housekeeping gene. Relative gene expressions of nutrient transporters and TJ proteins were calculated by using the 2−ΔΔCT method and were reported as the fold change from the control value (Livak and Schmittgen Reference Livak and Schmittgen2001). Primers for the nutrient transporters and TJ proteins used for this procedure are included in Table 3.
Primer sequence for real-time quantitative PCR analysis for the gene expression of nutrient transporters and tight junction proteins

Table 3 Long description
The table provides forward and reverse primer sequences, written from the five prime to three prime direction, for real-time quantitative PCR targets and lists a GenBank accession number for each gene. Thirteen genes are included: CAT-1, B0AT-1, EAAC-1, SGLT-1, PepT-1, ZO-1, CLDN-1, xCT, MG, CDH-1, Ferroportin-1, DMT-1, and PCNA. Each gene has two rows, one for the forward primer and one for the reverse primer; accession numbers appear once per gene. Accession formats vary across targets, including NM, XM, and NC entries, indicating different record types. The table is a reference for assay design and identification rather than a results table, so it does not report expression levels, group comparisons, or trends.
CAT-1, cationic amino acid transporter-1; B0AT-1, neutral amino acid transporter; EAAC-1, excitatory amino acid transporter-1; SGLT-1, sodium-dependent glucose transporter-1; PepT-1, peptide transporter; ZO-1, zonula occudens-1; CLDN-1, claudin-1; xCT, cysteine/glutamate antiporter; MG, maltase-glucoamylase; CDH-1, cadherin-1; DMT-1, divalent metal transporter; PCNA, proliferating cell nuclear antigen; FP, forward primer; RP, reverse primer.
Serum d-lactate and diamine oxidase
Blood samples were drawn from the jugular vein and then centrifuged (3,000 × g) to obtain serum samples (Thermo Fisher Scientific) and stored in a −80°C freezer on the same day of collection. For the d-lactate samples, serum samples were deproteinized by protocatechuic acid and neutralized by potassium hydroxide to a pH range of 6.5–8 prior to further analysis to avoid reading interference from serum proteins, as instructed by the manufacturer’s protocol (Deproteination protocol, Abcam). d-lactate was measured following the instructions of the Abcam d-lactate Assay Kit (ab83429). DAO was measured following the instructions of the Abcam Diamine Oxidase Assay Kit (ab241004).
Colon digesta microbiota
Colon digesta was collected and flash frozen in liquid nitrogen and stored in a −80°C freezer. Genomic DNA was extracted from the digesta samples using QIAamp Fast DNA Stool Mini Kit (QIAGEN, Toronto, Canada). DNA quantity was determined by a Nanodrop 2000 spectrophotometer (Thermo Fisher Scientific, Waltham, MA, USA), and quality was determined by 1.0% agarose gel electrophoresis. DNA samples were then sent to Genome Quebec (Montreal, Quebec, Canada) for 16S rRNA amplicon sequencing of the V4 region. 515F (GTGYCAGCMGCCGCGGTAA) was set as the forward primer and 806R (GGACTACNVGGGTWTCTAAT) as the reverse primer. Illumina MiSeq PE 300bp paired-end sequencing with 10 M reads was performed to obtain complete sequences of the V4 region. The two adaptors used were (ACACTCTTTCCCTACACGACGCTCTTCCGATCTA) and (GTGACTGGAGTTCAGACGTGTGCTCTTCCGATCT), and a 12 bp index was used for single multiplexing. The data sequences obtained from the sequencing were analyzed with QIIME2 (version 2021.11) as previously described by Xia and Sun (Reference Xia and Sun2023). The initial reads were filtered and denoised by DADA2 (Callahan et al. Reference Callahan, McMurdie and Rosen2016), which generates unique amplicon sequence variants (ASVs). Bacterial features were classified using the SILVA reference database classifier (version 138) with a 99% sequence similarity threshold. QIIME2 was used to generate alpha and beta diversities based on the ASV feature data and analyzed for similarities and by permutational multivariate analysis of variance (PERMANOVA, with 999 Monte Carlo permutations). Compositional data at the various taxa levels was analyzed using the Kruskal–Wallis test. Discriminant analysis (LDA) and effect size (LEfSe) (Segata et al. Reference Segata, Izard and Waldron2011) were generated using MicrobiomeAnalyst 2 (Chong et al. Reference Chong, Liu and Zhou2020) and included taxa with relative abundances greater than 0.01%. Total sum scaling normalization (Robinson and Oshlack Reference Robinson and Oshlack2010) was used for LEfse analysis. Data visualization was performed using the ggplot2 package in R (version 4.22) and MicrobiomeAnalyst 2 (Chong et al. Reference Chong, Liu and Zhou2020). Benjamini–Hochberg false discovery rate (FDR) correction of P-values (Benjamin and Hochberg Reference Benjamin and Hochberg1995) was followed for all the microbiota data analysis described above.
Statistical analyses
The experiment was analyzed as a complete randomized design with each pen considered as the experimental unit. All parameters, including growth performance, organ weight, fecal score, Ussing chamber TEER, and transcellular flow, fecal iron content, serum d-lactate, serum DAO, and gene expression of nutrient transporters and TJ proteins from jejunum samples were analyzed using PROC MIXED procedure of SAS (SAS Inst., Inc., Cary, NC, USA) followed by the Tukey’s multiple comparison test with the model: Y ij = µ + D i + S j + e ij, where µ is the overall mean, D i is the fixed treatment for iron source, S j the fixed effect of sanitary condition, and e ij is the residual error of the model. P < 0.05 was used to declare significance, and a trend was discussed at 0.05 ≤ P < 0.1.
Results
Growth performance and organ weight indexes
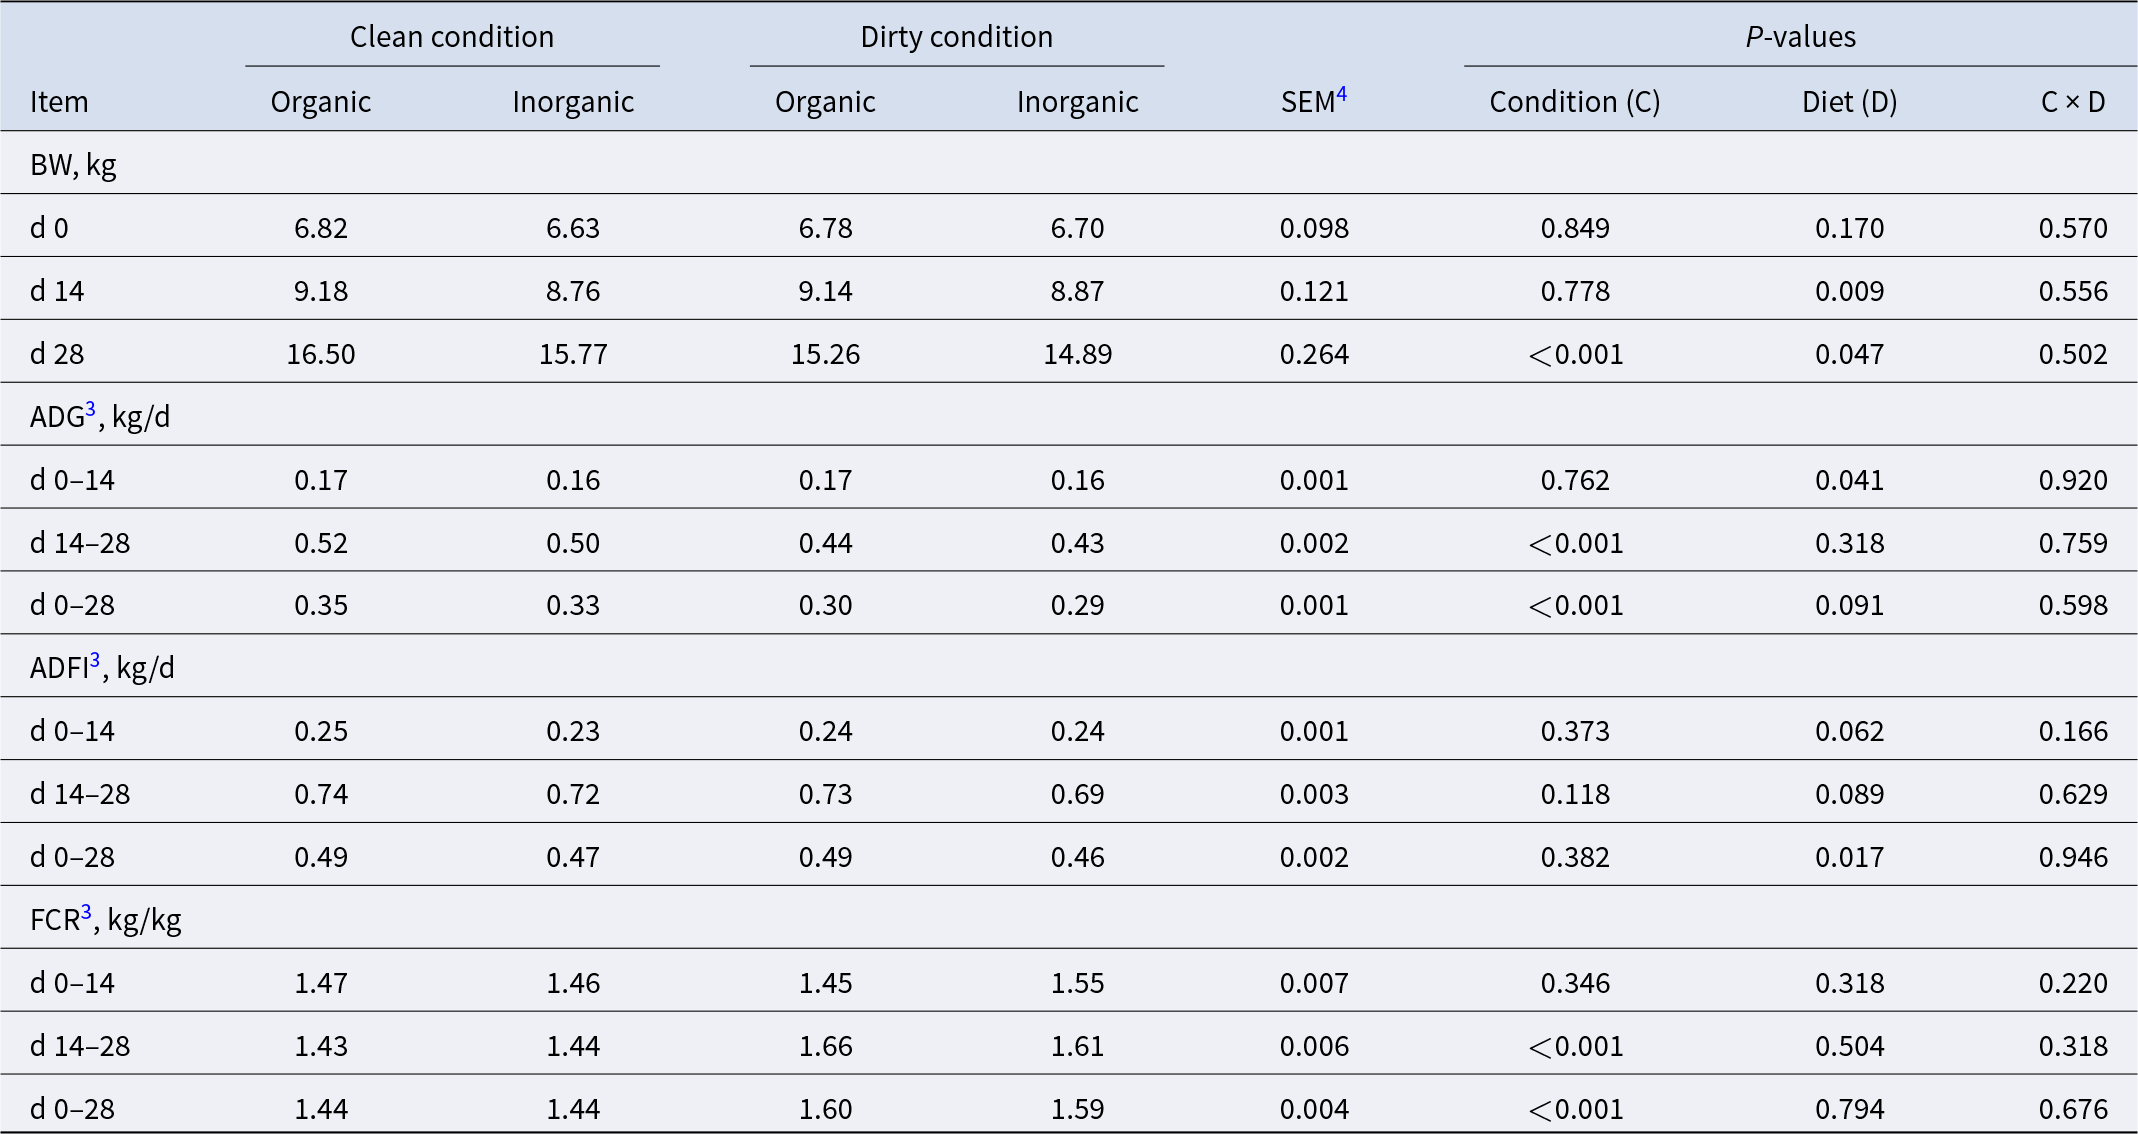
The effects of iron source and sanitary conditions on growth performance parameters are summarized in Table 4. No significant interaction between iron source and sanitary condition was observed for BW at any time point (days 0, 14, or 28; P > 0.05). At day 0, BW did not differ among treatments. At day 14, piglets fed organic iron had greater BW than those fed inorganic iron, regardless of sanitary condition (P < 0.05), whereas sanitary condition had no significant effect. At day 28, piglets raised under clean conditions had higher BW than those raised under dirty conditions (P < 0.001), and piglets fed organic iron also had higher BW than those fed inorganic iron (P < 0.05). No significant interactions between iron sources and sanitation conditions were observed for ADG, ADFI, or FCR (feed/gain) (P > 0.05). Piglets receiving organic iron had a significantly higher ADG compared to those receiving inorganic iron during phase 1 (days 0–14), regardless of hygiene conditions (P < 0.05). However, ADG during phase 2 was similar between the two groups. Over the entire growth period (days 0–28), there was a trend toward higher ADG in piglets fed organic iron compared to those fed inorganic iron (P = 0.091). Significant effects of sanitary conditions on ADG were not observed until phase 2 (days 14–28), where piglets raised in clean conditions exhibited higher ADG compared to those in dirty conditions, regardless of iron source (P < 0.05). Piglets fed organic iron also tended to have higher ADFI in both phase 1 (P = 0.062) and phase 2 (P = 0.089) and had significantly higher ADFI over the entire growth period (P < 0.05) compared to those fed inorganic iron. Sanitary conditions did not significantly affect ADFI in either growth phase or overall. FCR was unaffected by iron sources (P > 0.05). Although FCR in phase 1 was not influenced by sanitary conditions, FCR in phase 2 and the overall period were significantly lower (P < 0.05) for piglets raised in clean conditions compared to those raised in dirty conditions. Despite the differences in growth performance, iron source and sanitary conditions did not significantly affect the organ weight indexes of the heart, liver, and spleen (Table 5, P > 0.05).
Effects of the sources of iron (organic1 and inorganic2) on growth performance of growing nursery pigs under clean and dirty conditions3
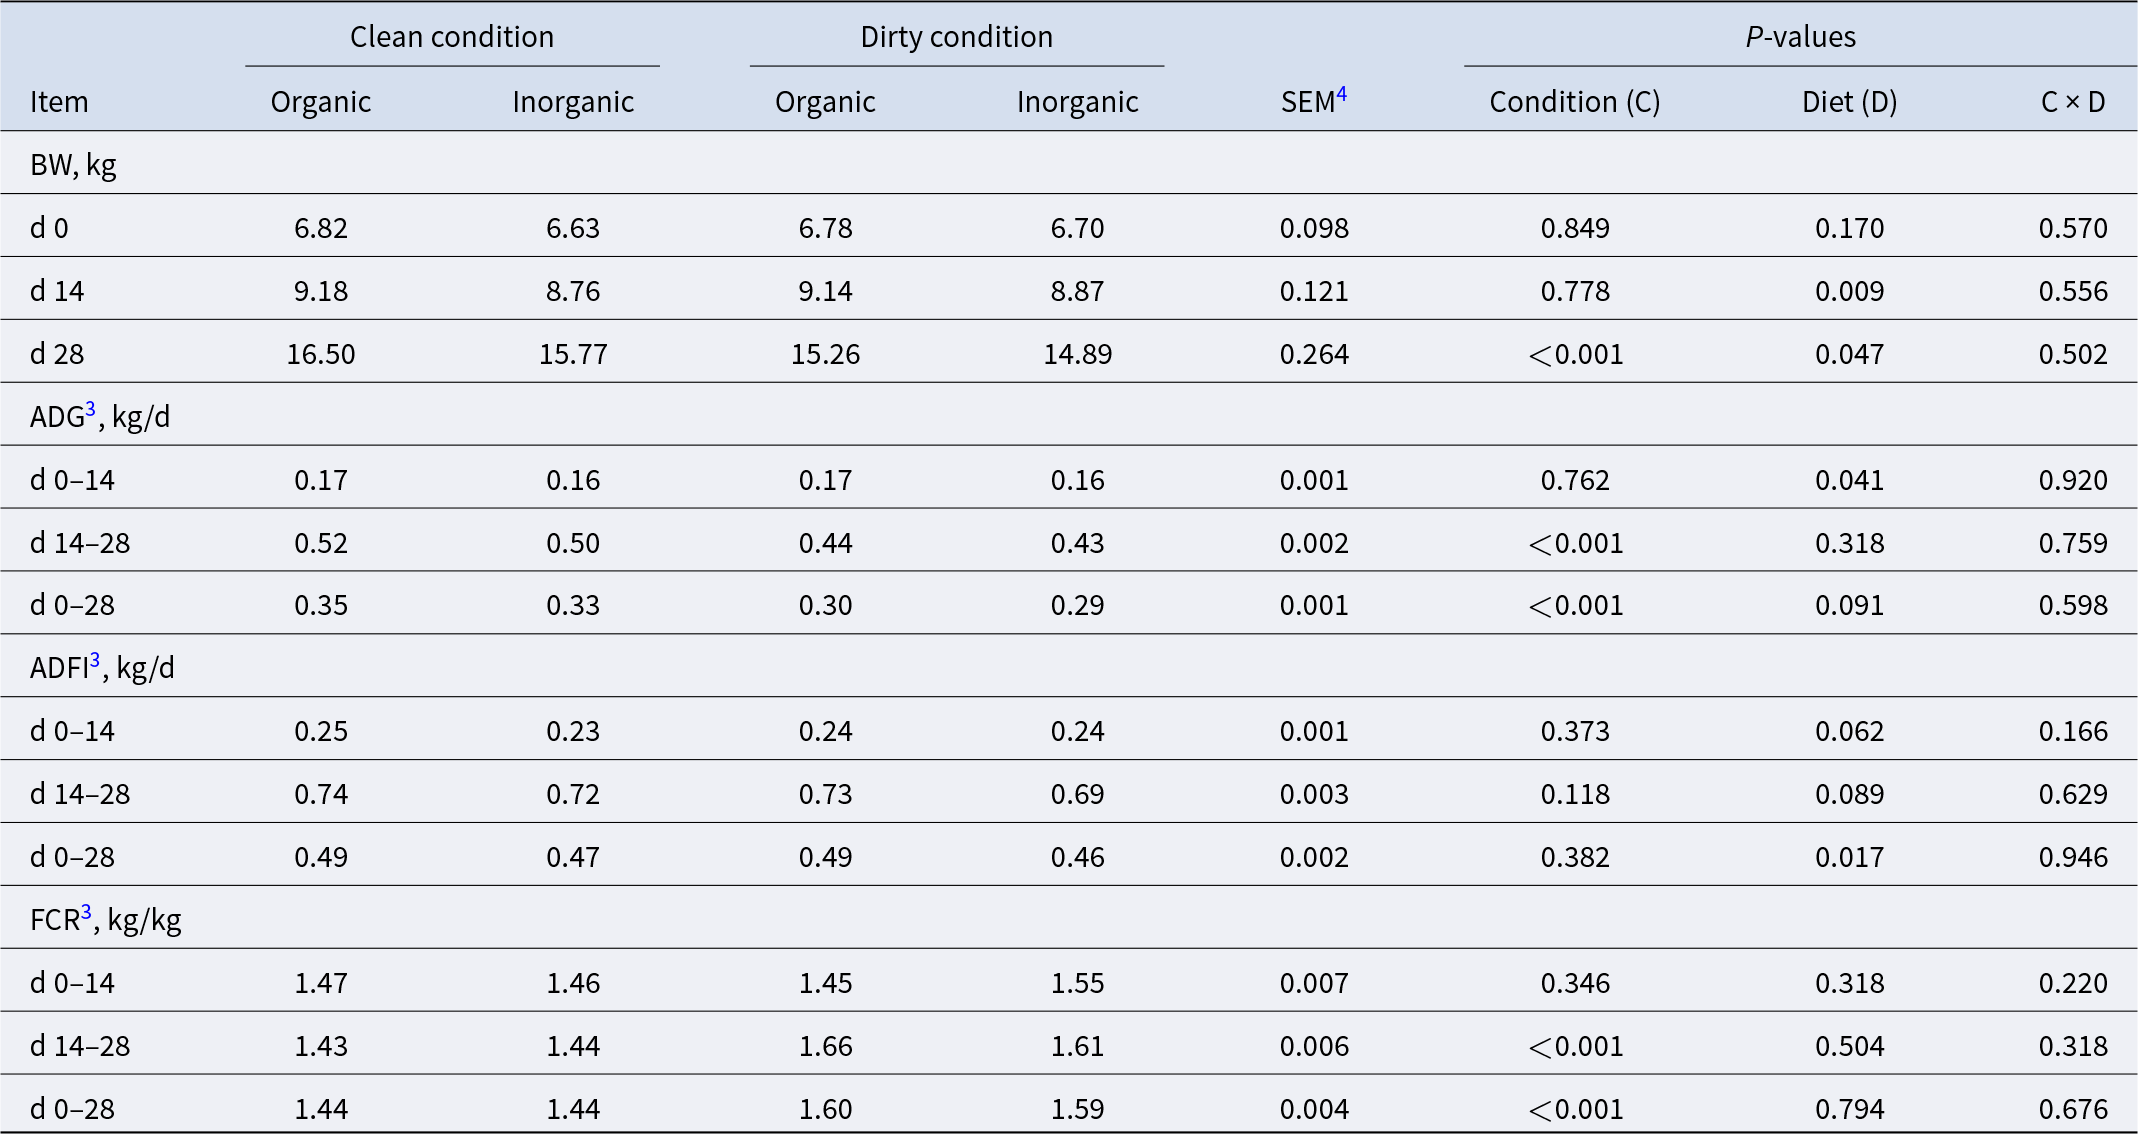
Table 4 Long description
The table reports nursery pig body weight at days 0, 14, and 28, plus average daily gain, average daily feed intake, and feed conversion ratio across days 0 to 14, 14 to 28, and 0 to 28. Results are split by housing condition (clean versus dirty) and iron source (organic versus inorganic), with standard error and p-values for condition, diet, and their interaction. By day 28, pigs in clean conditions were heavier than pigs in dirty conditions (about 15.8 to 16.5 kg in clean versus about 14.9 to 15.3 kg in dirty), and the condition effect was statistically significant. Growth rate from days 14 to 28 and from days 0 to 28 was higher in clean conditions (about 0.50 to 0.52 kg per day and 0.33 to 0.35 kg per day) than in dirty conditions (about 0.43 to 0.44 and 0.29 to 0.30), with statistically significant condition effects. Feed conversion ratio was worse in dirty conditions, especially from days 14 to 28 (about 1.61 to 1.66 in dirty versus about 1.43 to 1.44 in clean), and this condition effect was statistically significant. Diet effects were smaller: organic iron produced slightly higher body weight at day 14 and day 28 and slightly higher overall feed intake from days 0 to 28, with statistically significant diet p-values for those outcomes. Interaction p-values were not statistically significant, suggesting the pattern of clean versus dirty differences was similar for both iron sources.
1 Organic diet is supplemented with iron polysaccharide complex (QualiTech, Inc., MN) as the iron source.
2 Inorganic diet is supplemented with ferrous sulfate as an iron source.
3 ADG, average daily gain; ADFI, average daily feed intake; FCR, feed conversion ratio (feed/gain).
4 Standard error of the mean.
Effects of the sources of iron (organic1 and inorganic2) and different sanitary conditions (clean and dirty) on the relative organ weight of post-weaned pigs measured at the end of phase 2 feeding

Table 5 Long description
The table reports relative weights of heart, liver, and spleen in post-weaned pigs at the end of phase 2, comparing clean versus dirty sanitary conditions and organic versus inorganic iron diets. Heart values were tightly clustered from 0.50 to 0.53 across all four groups, with p-values indicating no clear effects of condition, diet, or their interaction. Liver values ranged from 3.49 to 3.76, with the highest in clean organic and the lowest in dirty inorganic, but p-values again suggest no meaningful differences. Spleen values ranged from 0.19 to 0.23, with clean inorganic slightly higher than the other groups, yet statistical tests do not indicate a clear effect. Standard errors were small, supporting that group means were close. Overall, organ weights appear stable across both sanitation conditions and iron source, and any small numerical differences should be interpreted cautiously given the non-significant p-values.
1 Organic diet is supplemented with iron polysaccharide complex (QualiTech, Inc., MN) as the iron source.
2 Inorganic diet is supplemented with ferrous sulfate as an iron source.
3 Standard error of the mean.
Fecal iron concentration and fecal scores
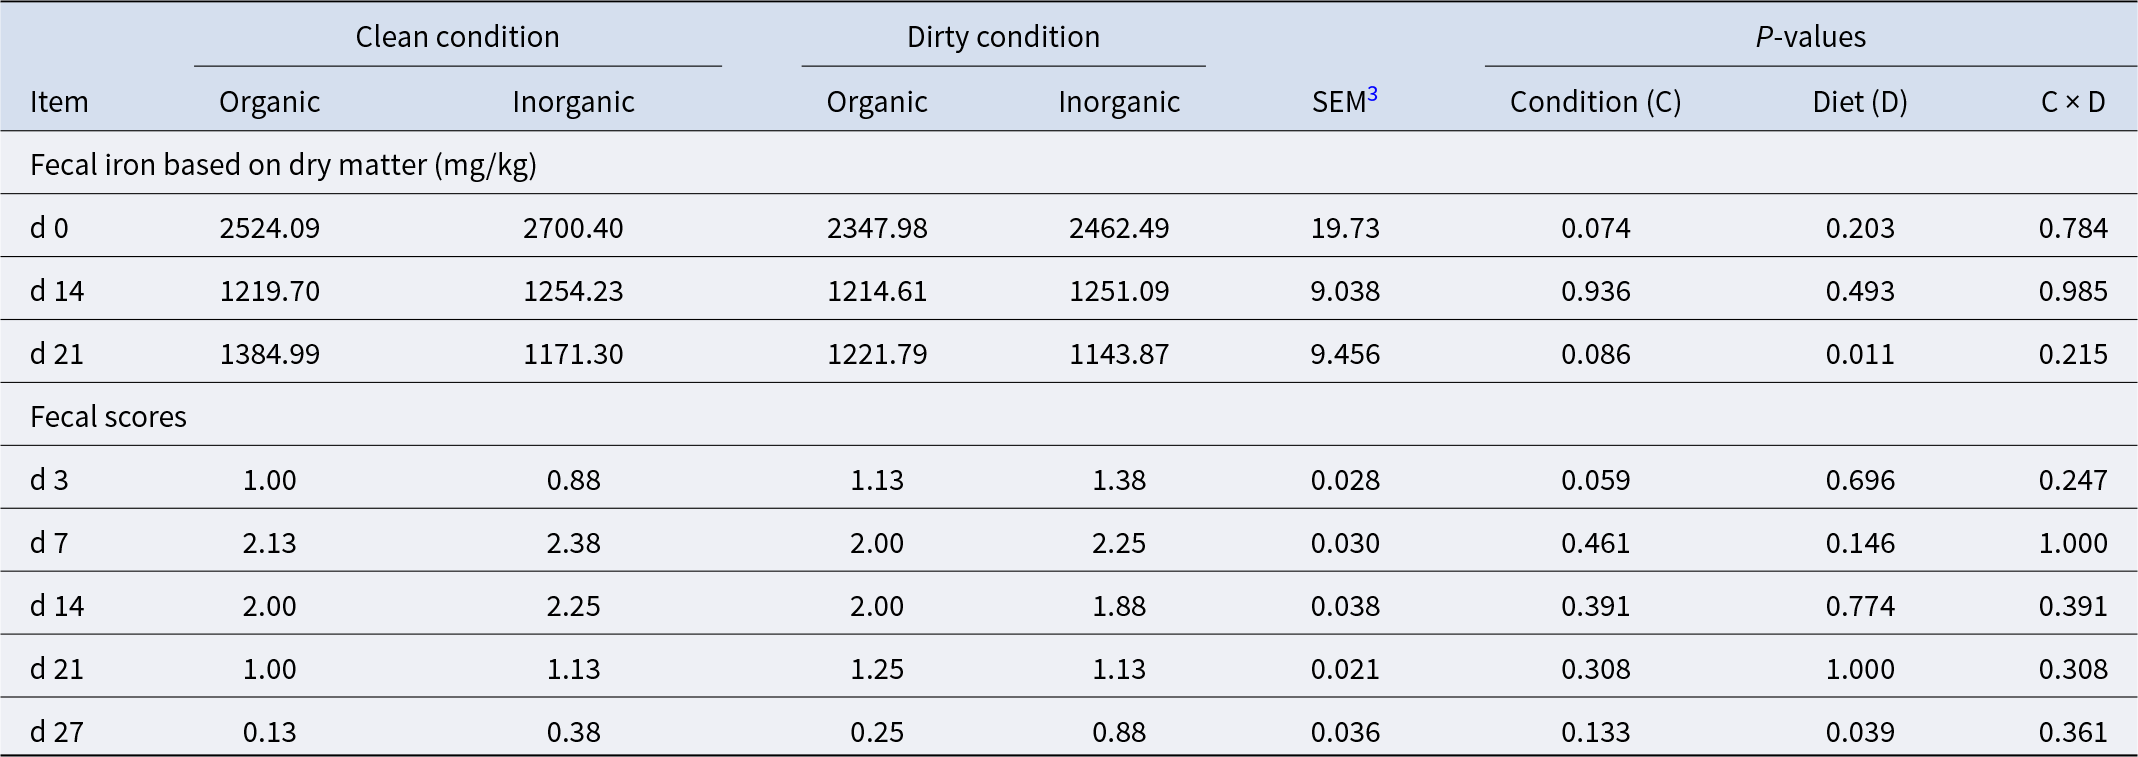
The effects of iron source and sanitary conditions on fecal iron content are summarized in Table 6. Fecal samples were collected on days 0, 14, and 21. No significant interactions between iron source and sanitary conditions were observed for fecal iron content (P > 0.05). However, on day 21, a significant difference was observed based on iron source: piglets fed organic iron under clean conditions had higher fecal iron concentrations (on a DM basis) compared to those in other treatment groups (P < 0.05).
Effects of the sources of iron (organic iron1 and inorganic iron2) on fecal dry matter iron concentration and fecal scores of post-weaned pigs under clean and dirty conditions
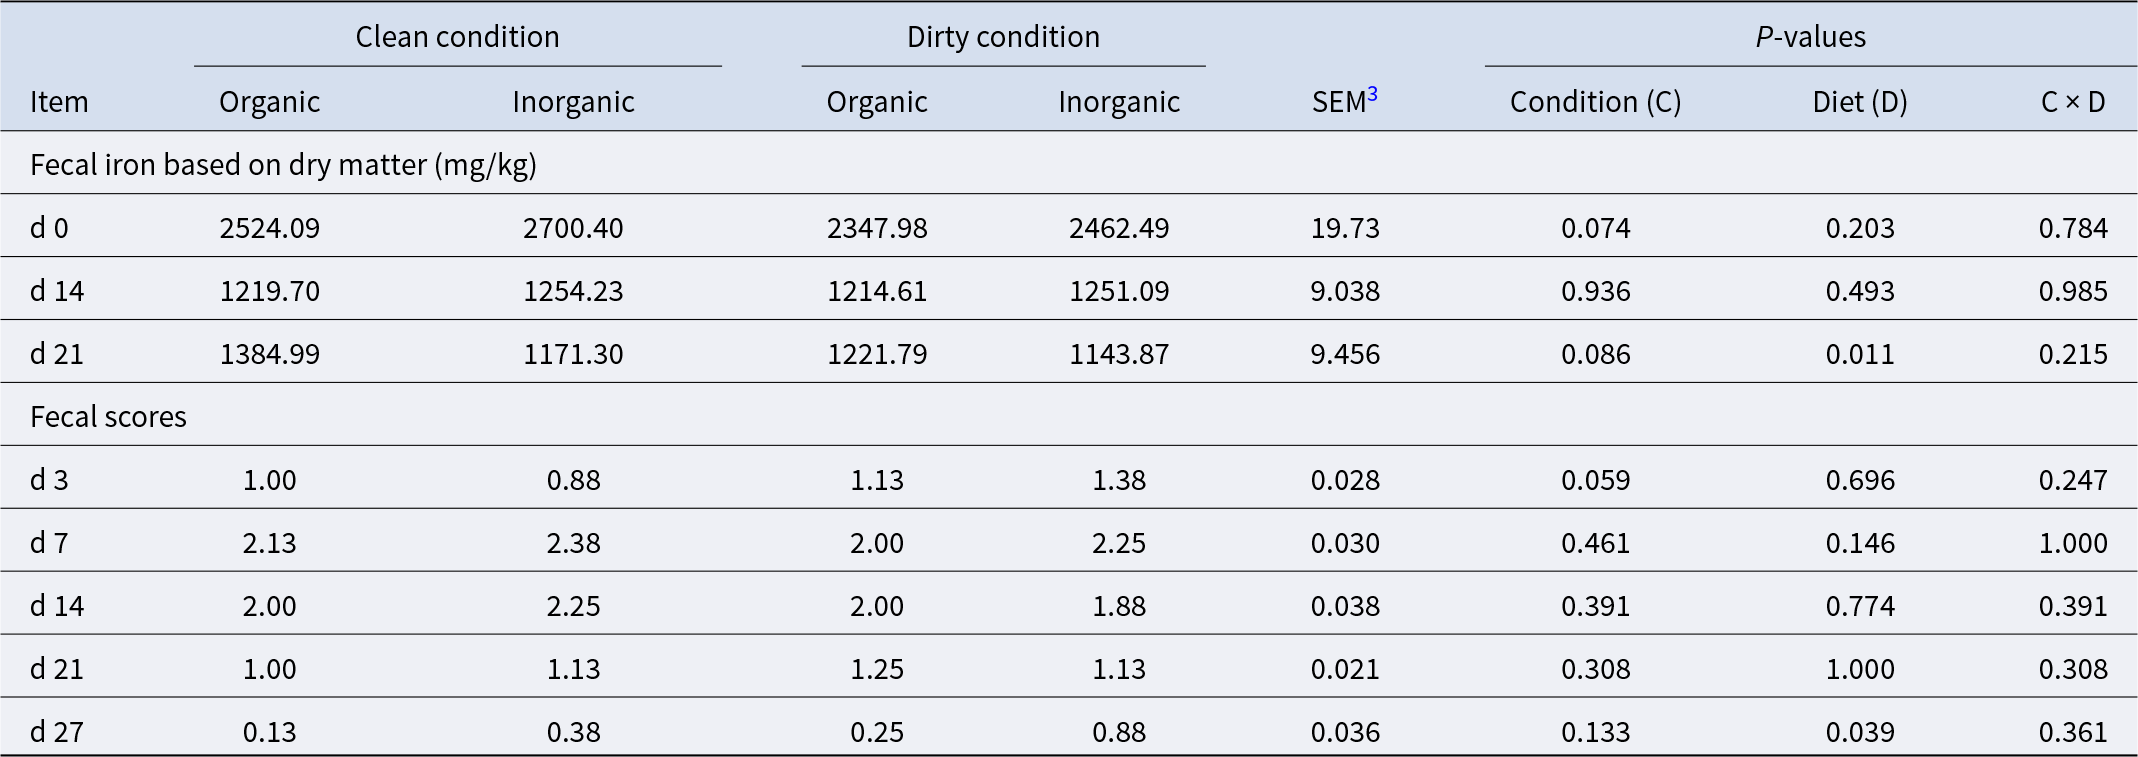
Table 6 Long description
The table reports fecal iron concentration on a dry matter basis and fecal scores for post-weaned pigs fed organic or inorganic iron under clean versus dirty housing, with standard error and p-values for condition, diet, and their interaction. Fecal iron was high at day 0 in all groups, then dropped by day 14 and remained lower through day 21. At day 21, pigs fed organic iron had higher fecal iron than those fed inorganic iron in both environments (clean: 1384.99 vs 1171.30; dirty: 1221.79 vs 1143.87), and the diet effect was statistically significant (p 0.011). Condition effects for fecal iron were not statistically significant at days 0, 14, or 21, and there was no evidence of a condition-by-diet interaction for fecal iron. Fecal scores were generally similar between diets and conditions across days 3, 7, 14, and 21, with no statistically significant main effects. At day 27, fecal scores were higher with inorganic than organic iron (clean: 0.38 vs 0.13; dirty: 0.88 vs 0.25), and the diet effect was statistically significant (p 0.039). Overall, most differences are small and should be interpreted alongside the reported standard errors and p-values.
1 Organic diet is supplemented with iron polysaccharide complex (QualiTech, Inc., MN) as the iron source.
2 Inorganic diet is supplemented with ferrous sulfate as an iron source.
3 Standard error of the mean.
The effect of iron source and sanitary conditions on fecal scores of post-weaned pigs is also detailed in Table 6. No significant effects of sanitary conditions or interactions between iron source and sanitary conditions were found for fecal scores at the various sampling days (P > 0.05). On day 27, piglets fed organic iron had a significantly lower fecal score compared to those fed inorganic iron and raised under dirty conditions (P < 0.05).
Serum d-lactate, diamine oxidase, and gut permeability
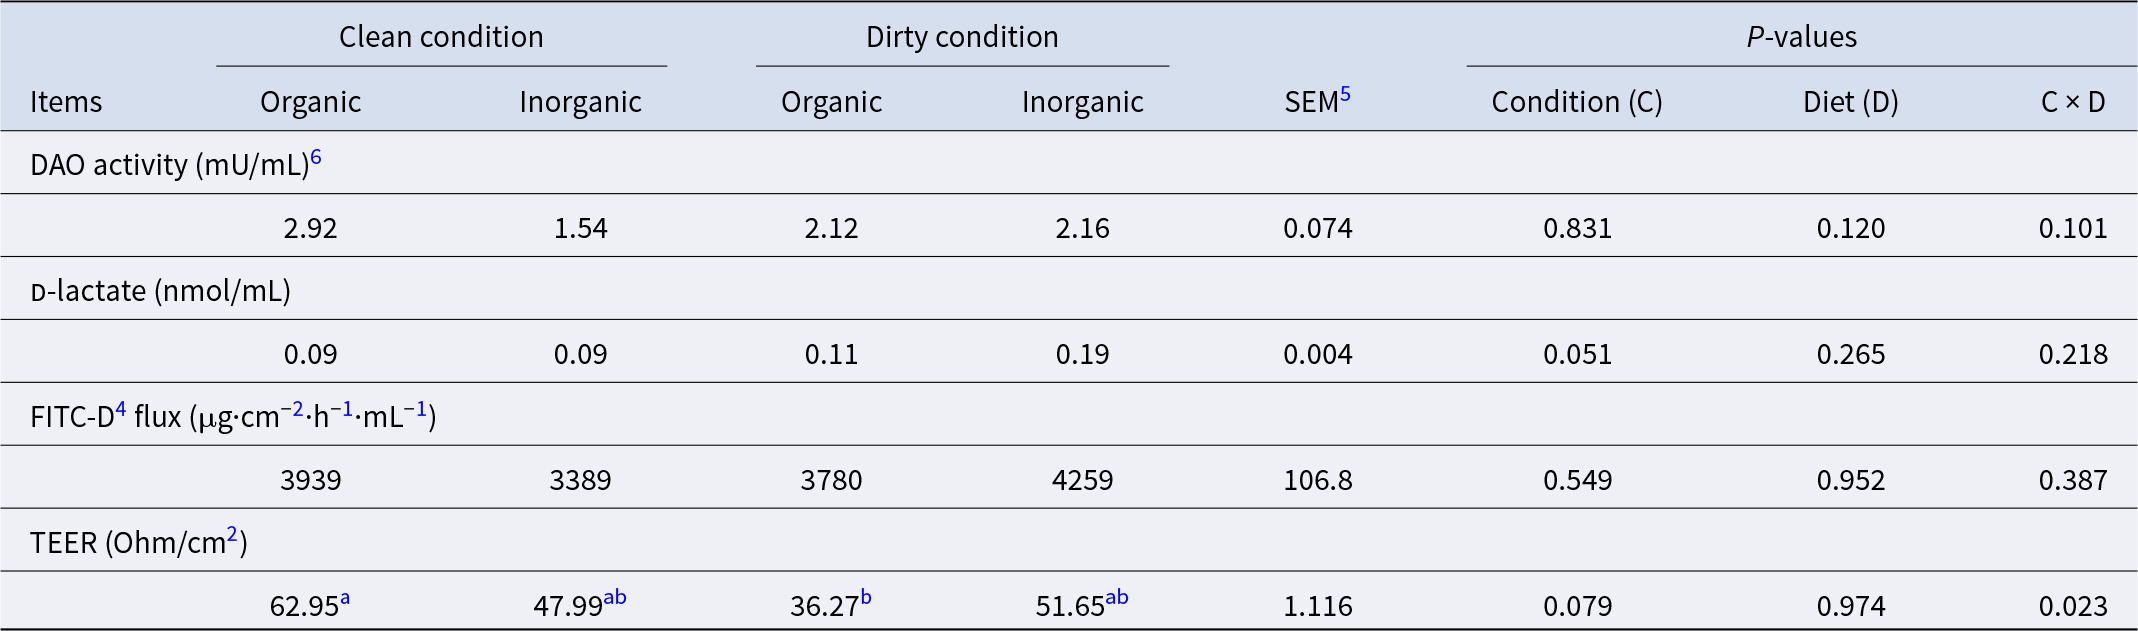
Table 7 summarizes the effects of iron source and sanitary conditions on two serum indicators of gut health, i.e., d-lactate and DAO and on two gut permeability indicators, i.e., TEER and fluorescein isothiocyanate (FITC) paracellular flux. There were no significant effects of iron source or sanitary conditions on the gut health and gut permeability indicators measured (P > 0.05). There was, however, a significant interaction effect on TEER (P < 0.05). The TEER was significantly higher in the pig group fed with the organic iron and raised under clean conditions compared to the group fed with the organic iron and raised under the dirty conditions (P < 0.05).
Effects of the sources of iron (organic1 vs. inorganic2) and sanitary conditions (clean vs. dirty) on serum d-lactate, DAO3 activity, jejunum paracellular flow (FITC4 fluorescence value), and transepithelial resistance (TEER) of post-weaned nursery pigs measured at the end of phase 2 feeding
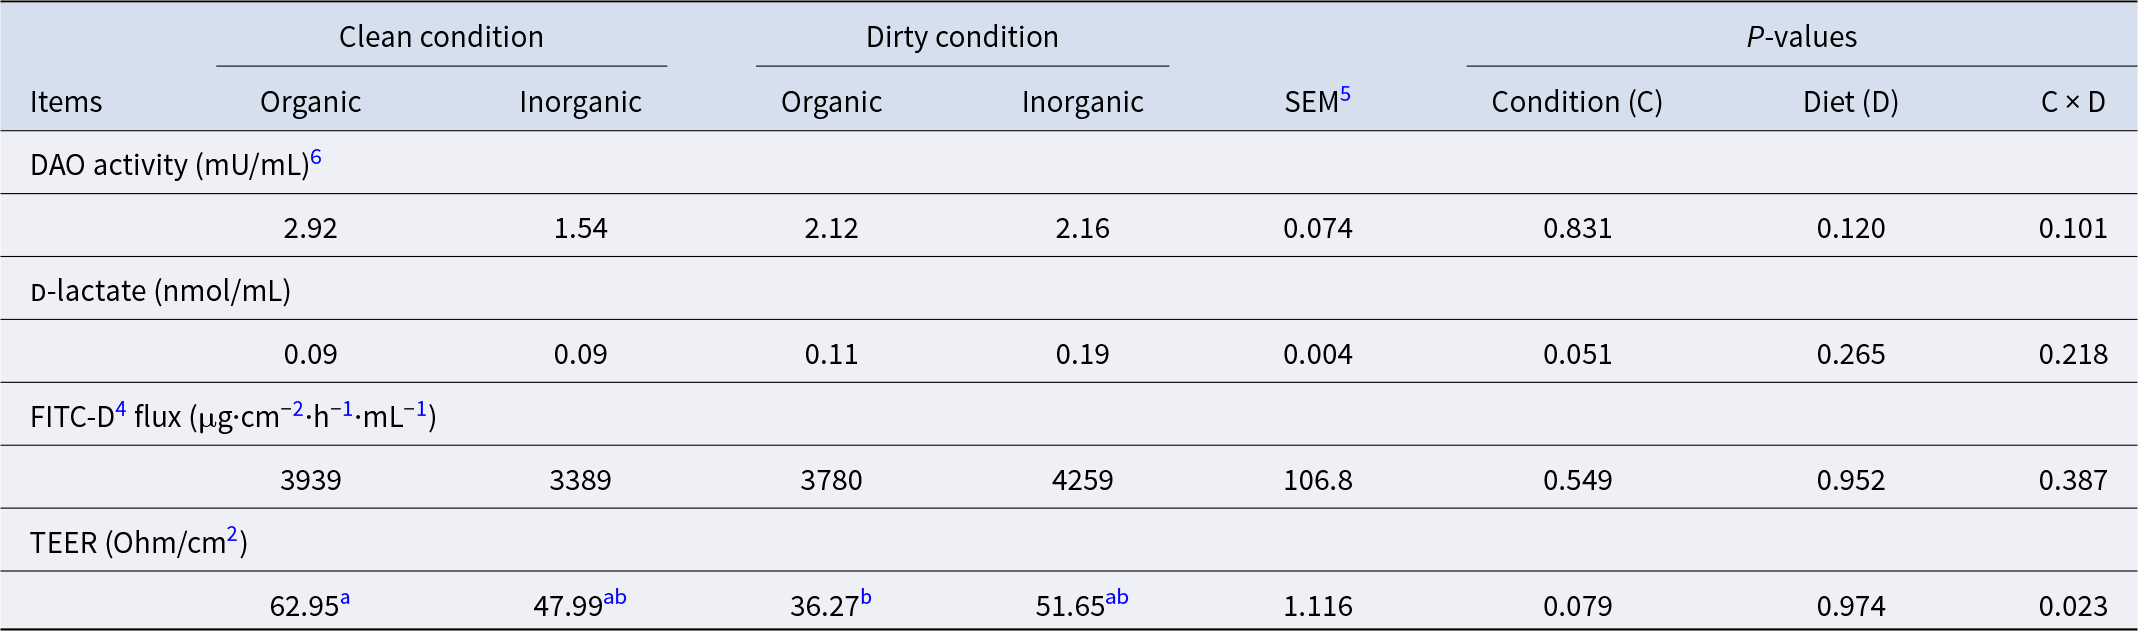
Table 7 Long description
The table reports gut barrier and blood markers in post-weaned nursery pigs after phase 2 feeding, comparing two iron sources (organic vs inorganic) under clean or dirty sanitary conditions. DAO activity was 2.92, 1.54, 2.12, and 2.16 mU per mL for clean organic, clean inorganic, dirty organic, and dirty inorganic, with no significant effects. Serum D-lactate was 0.09, 0.09, 0.11, and 0.19 nmol per mL, showing a borderline condition effect but no clear diet effect. Jejunum FITC-dextran flux was 3939, 3389, 3780, and 4259, with no significant differences. TEER showed the clearest pattern: clean organic was highest at 62.95, dirty organic was lowest at 36.27, and both inorganic groups were intermediate at 47.99 (clean) and 51.65 (dirty). The TEER results indicate a significant interaction between sanitary condition and diet, meaning the effect of hygiene differed depending on iron source; other outcomes did not show statistically reliable differences.
1 Organic diet is supplemented with iron polysaccharide complex (QualiTech, Inc., MN) as the iron source.
2 Inorganic diet is supplemented with ferrous sulfate as an iron source.
3 Diamine oxidase.
4 Fluorescein-5-isothiocyanate-Dextran.
5 SEM: standard error mean (n = 32).
a,b means in the same row with different superscripts differ significantly (P < 0.05).
6 U is defined as one unit of diamine oxidase, which is the amount of enzyme that generates 1.0 µmol of H2O2 per min at pH 7.4 and 37°C.
Relative mRNA expression of nutrient transporters and tight junction proteins in jejunum
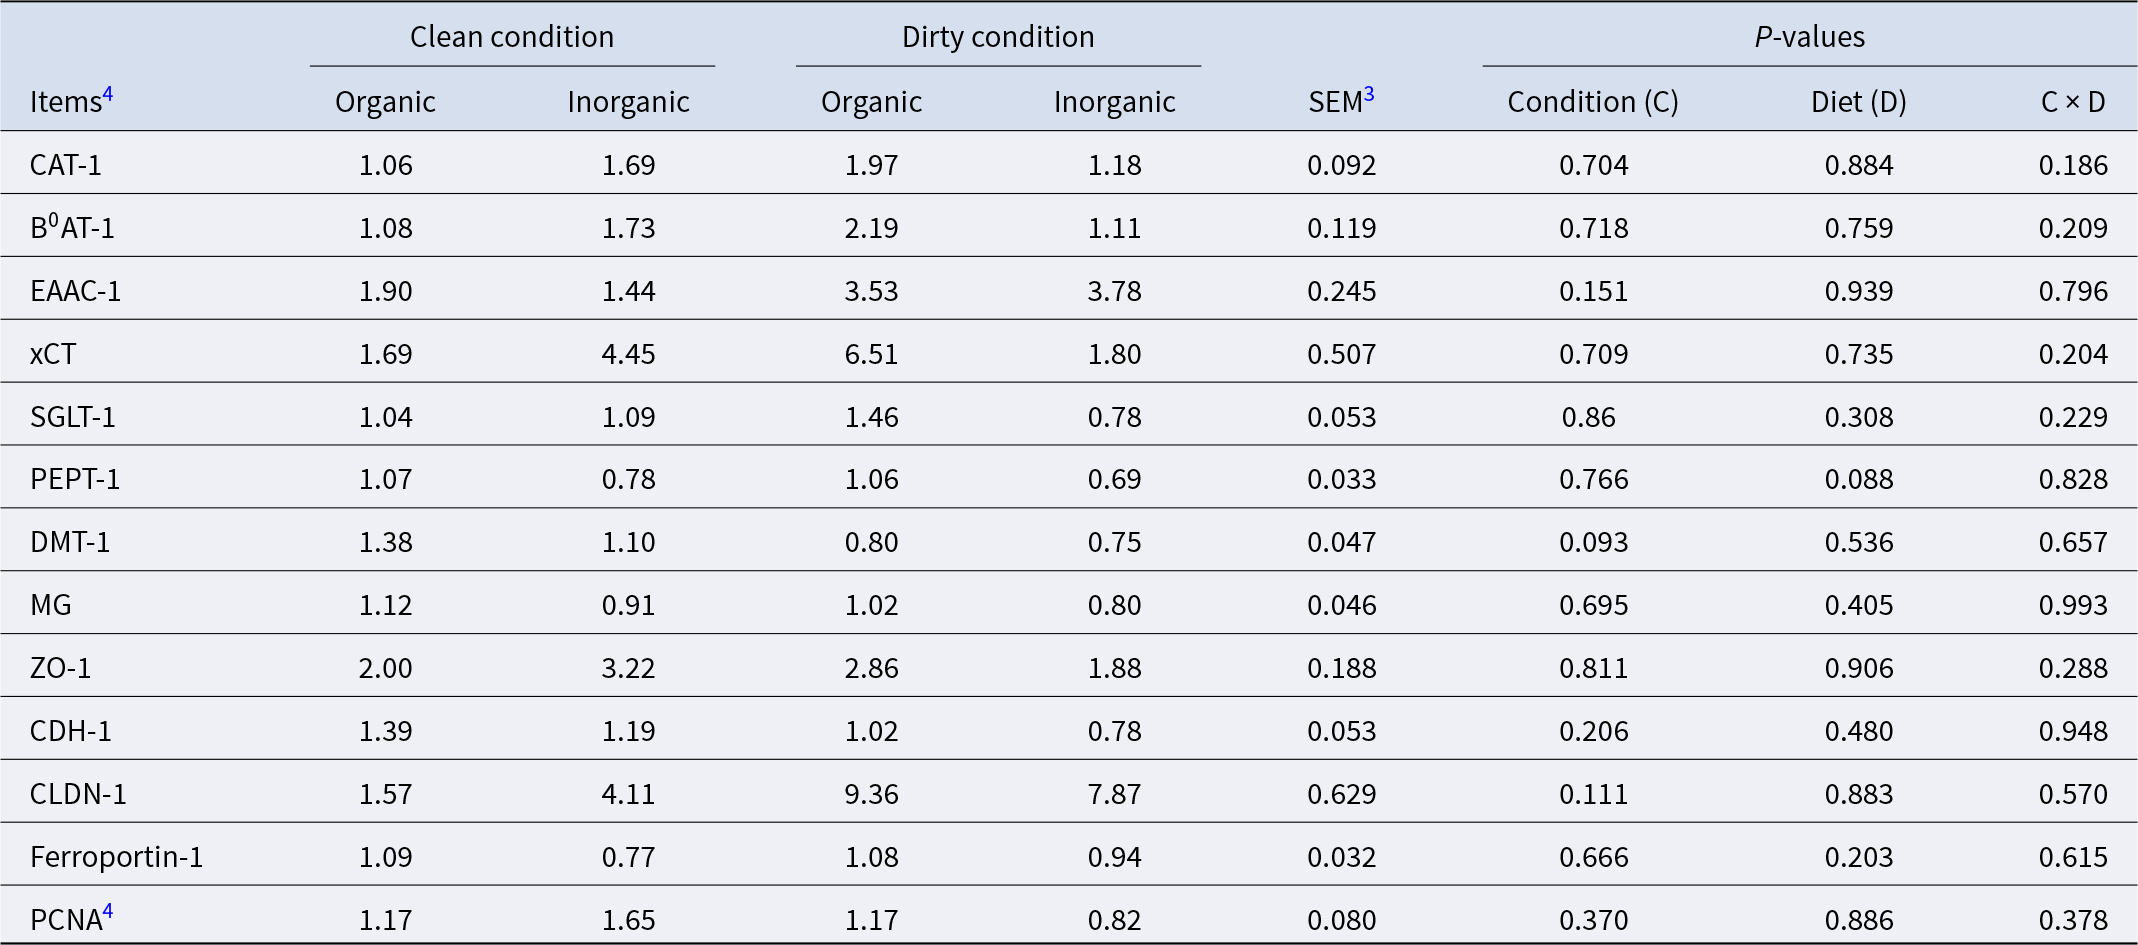
To evaluate the effects of iron source and sanitary conditions on nutrient absorption capacities and epithelial barrier function, the relative mRNA expression of various nutrient transporters, i.e., CAT-1, broad neutral amino acid transporter 1 (B0AT-1), EAAC-1, xCT, SGLT-1, PEPT-1, and MG and of several TJ proteins, i.e., ZO-1, CDH-1, and claudin-1, were considered (Table 8). Also, to gain further insight into iron homeostasis in the pigs fed the two different iron sources and raised under either clean or dirty conditions, the relative expression of DMT-1 and Ferroportin-1 was measured (Table 8). The relative expression of PCNA for piglets fed with inorganic or organic iron and raised under clean or dirty conditions was also compared. PCNA is an indicator of cellular proliferation. This protein is involved in DNA replication and repair, and its presence is an indication of active cell proliferation often seen in tissues undergoing growth.
Effects of the sources of iron (organic iron1 and inorganic iron2) and sanitary conditions (clean vs. dirty) on the relative mRNA expression (2−ΔΔCt) of nutrient transporters and tight junction proteins in post-weaned pig jejunum samples measured at the end of phase 2 feeding5
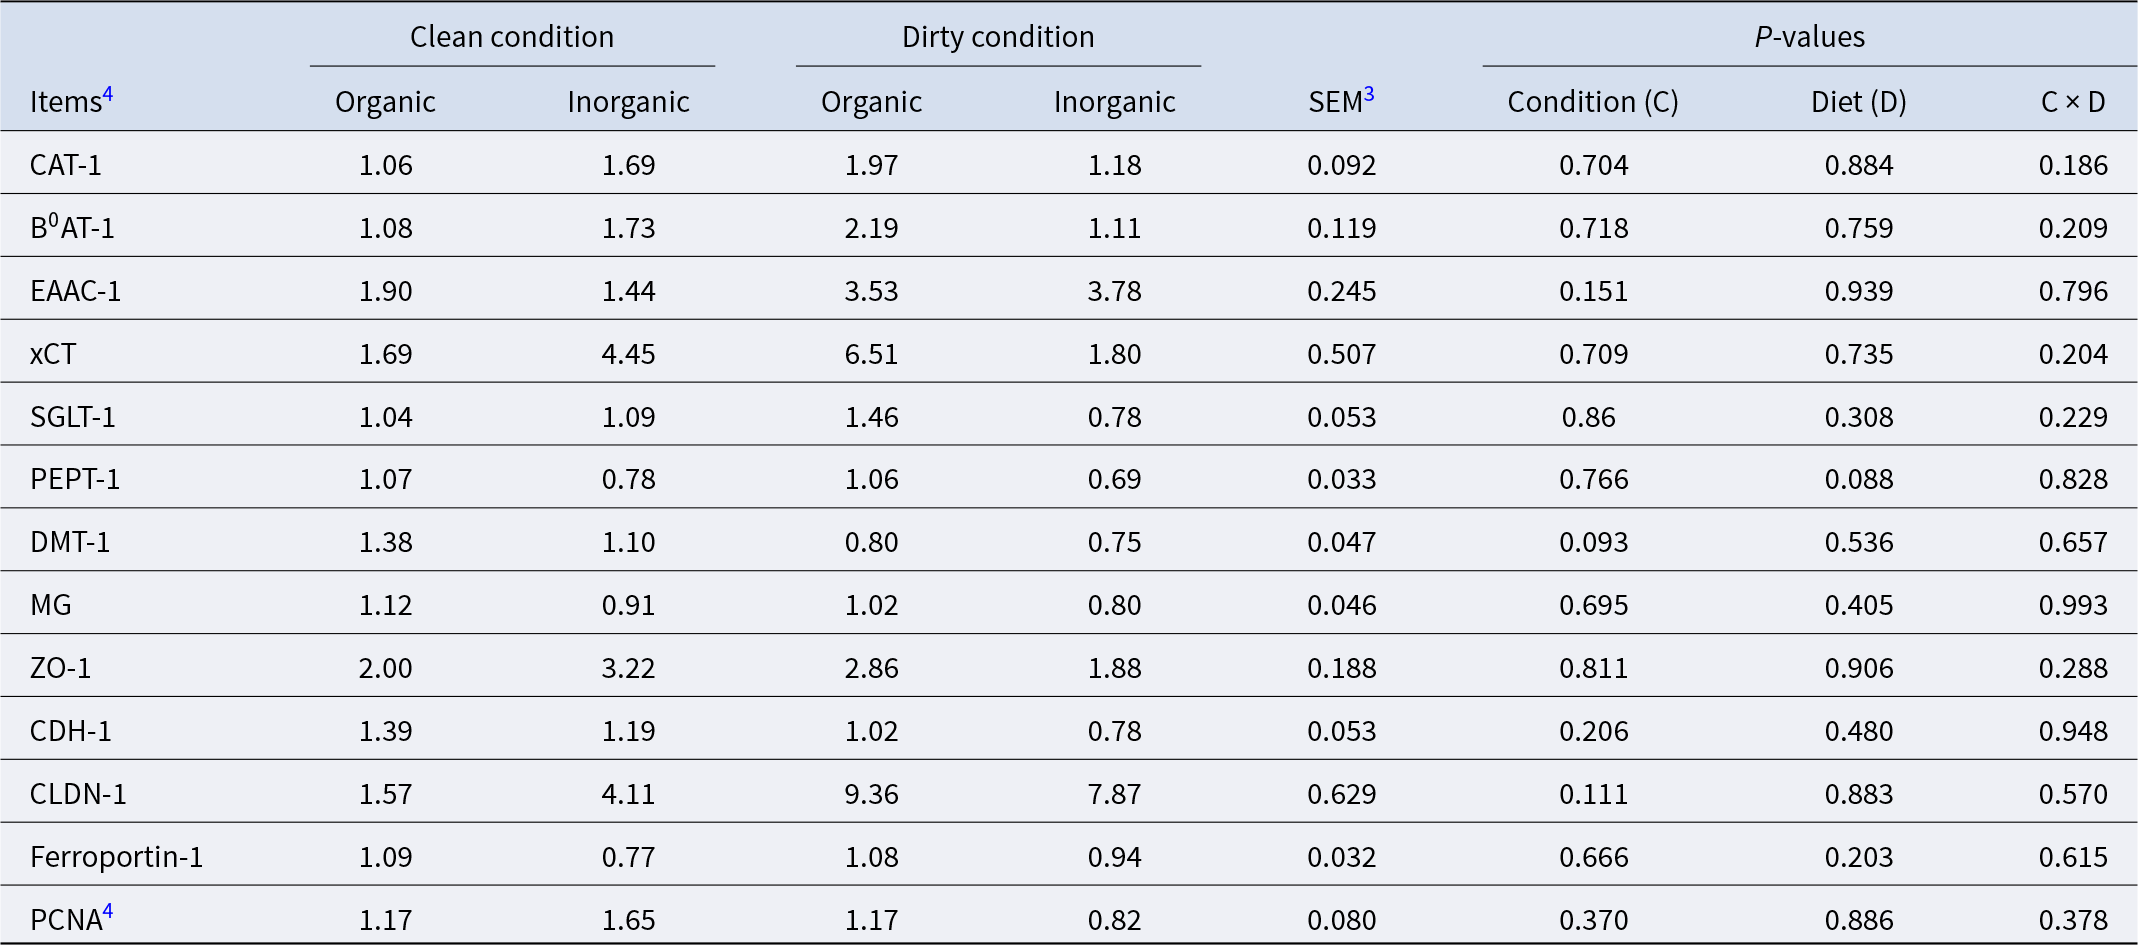
Table 8 Long description
Relative messenger RNA expression in pig jejunum is reported for nutrient transporters and tight junction proteins across four groups: clean or dirty conditions with organic or inorganic iron. Values are normalized to the clean organic group, with a standard error of the mean provided for each gene. Across all genes, the reported p-values for condition, diet, and their interaction are all above 0.05, indicating no statistically clear differences among groups. Notable numeric contrasts include CLDN-1 rising from 1.57 in clean organic and 4.11 in clean inorganic to 9.36 in dirty organic and 7.87 in dirty inorganic, and xCT increasing to 6.51 in dirty organic compared with 1.69 in clean organic and 4.45 in clean inorganic. EAAC-1 is higher in dirty groups (3.53 to 3.78) than in clean groups (1.44 to 1.90), while DMT-1 trends lower in dirty groups (0.75 to 0.80) than in clean groups (1.10 to 1.38) but remains not statistically clear. Other genes show modest shifts, such as ZO-1 ranging from 1.88 to 3.22 and PepT-1 ranging from 0.69 to 1.07. Interpret results cautiously because several large-looking differences are not supported by statistical significance in this dataset.
1 Organic diet is supplemented with iron polysaccharide complex (QualiTech, Inc., MN) as the iron source.
2 Inorganic diet is supplemented with ferrous sulfate as an iron source.
3 SEM: standard error mean (n = 32).
4 CAT-1, cationic amino acid transporter-1; B0AT-1, neutral amino acid transporter; xCT, cysteine/glutamate antiporter; SGLT- 1, sodium-dependent glucose transporter-1; PEPT-1, peptide transporter-1; MG, maltase-glucoamylase; ZO-1, zonula occludens; CDH-1, cadherin-1; CLDN-1, claudin-1; DMT-1, divalent metal transporter-1; PCNA, proliferating cell nuclear antigen; EAAC-1, excitatory amino acid carrier 1.
5 The relative data were expressed as a ratio of the target gene to the Clean organic gene, using the formula 2−∆∆Ct
where ∆∆Ct = (Cttarget − Ctcyca) treatment − (Cttarget − Ctcyca) clean organic. Cyca, cyclophilin-A.
As shown in Table 8, there were no iron source or sanitary condition or interaction of these two effects on nutrient transporters and TJ proteins studied, with the exception of a tendency for the relative mRNA abundance of PepT-1 to be higher in the piglets fed with the organic iron than in the piglets fed with the inorganic iron (P = 0.088). There were also no treatment effects on the relative expression of DMT-1, ferroportin-1, and PCNA (P > 0.05).
Gut microbiota
Gut microbiota composition
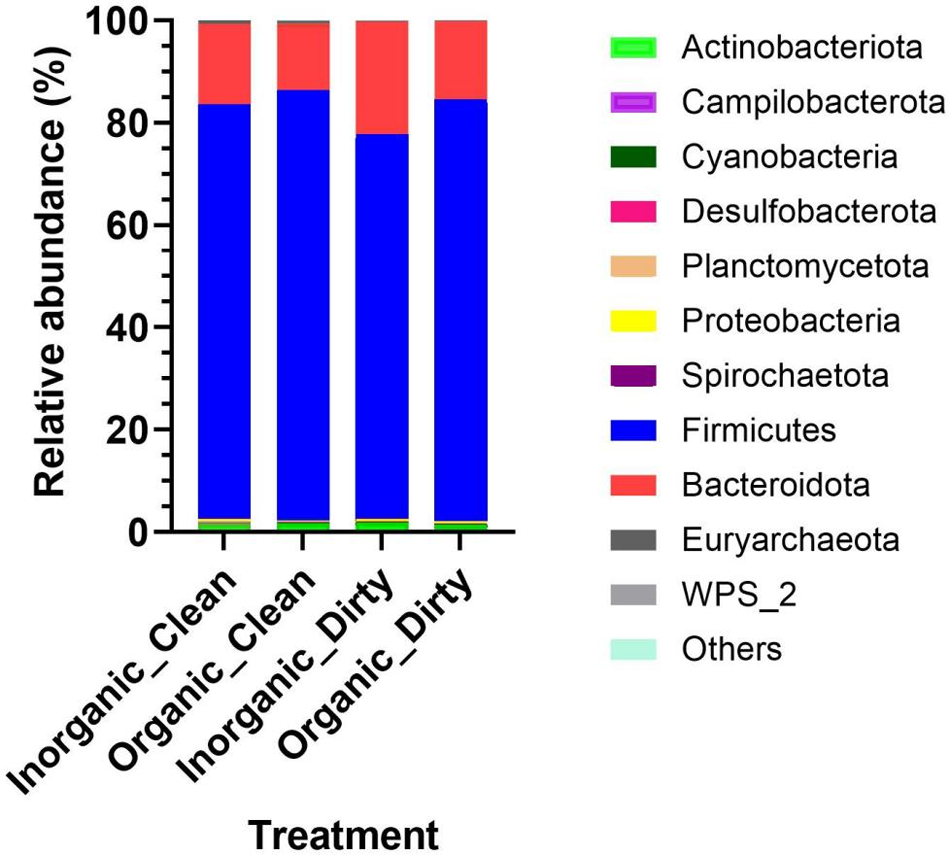
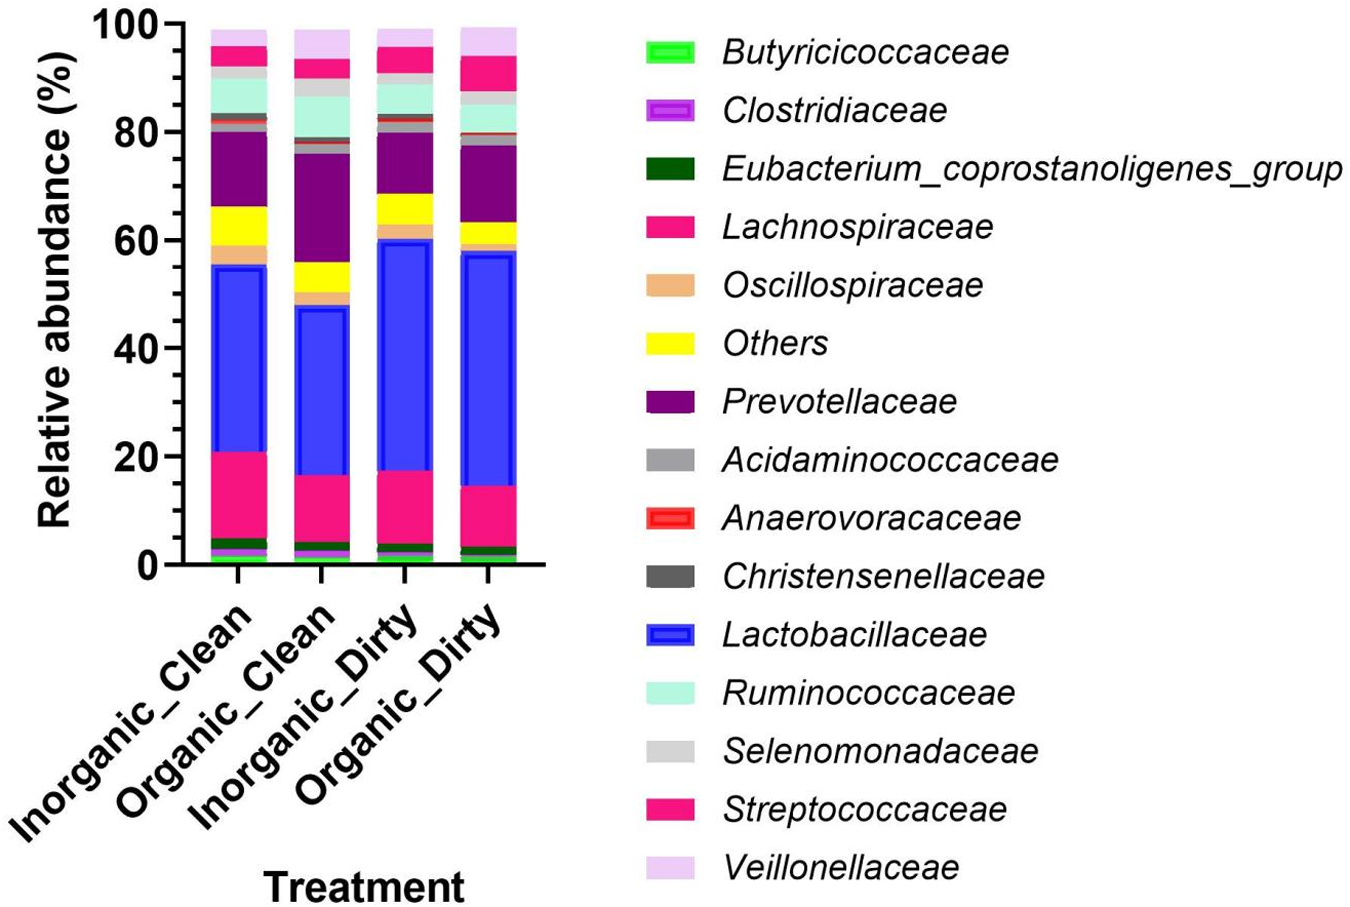
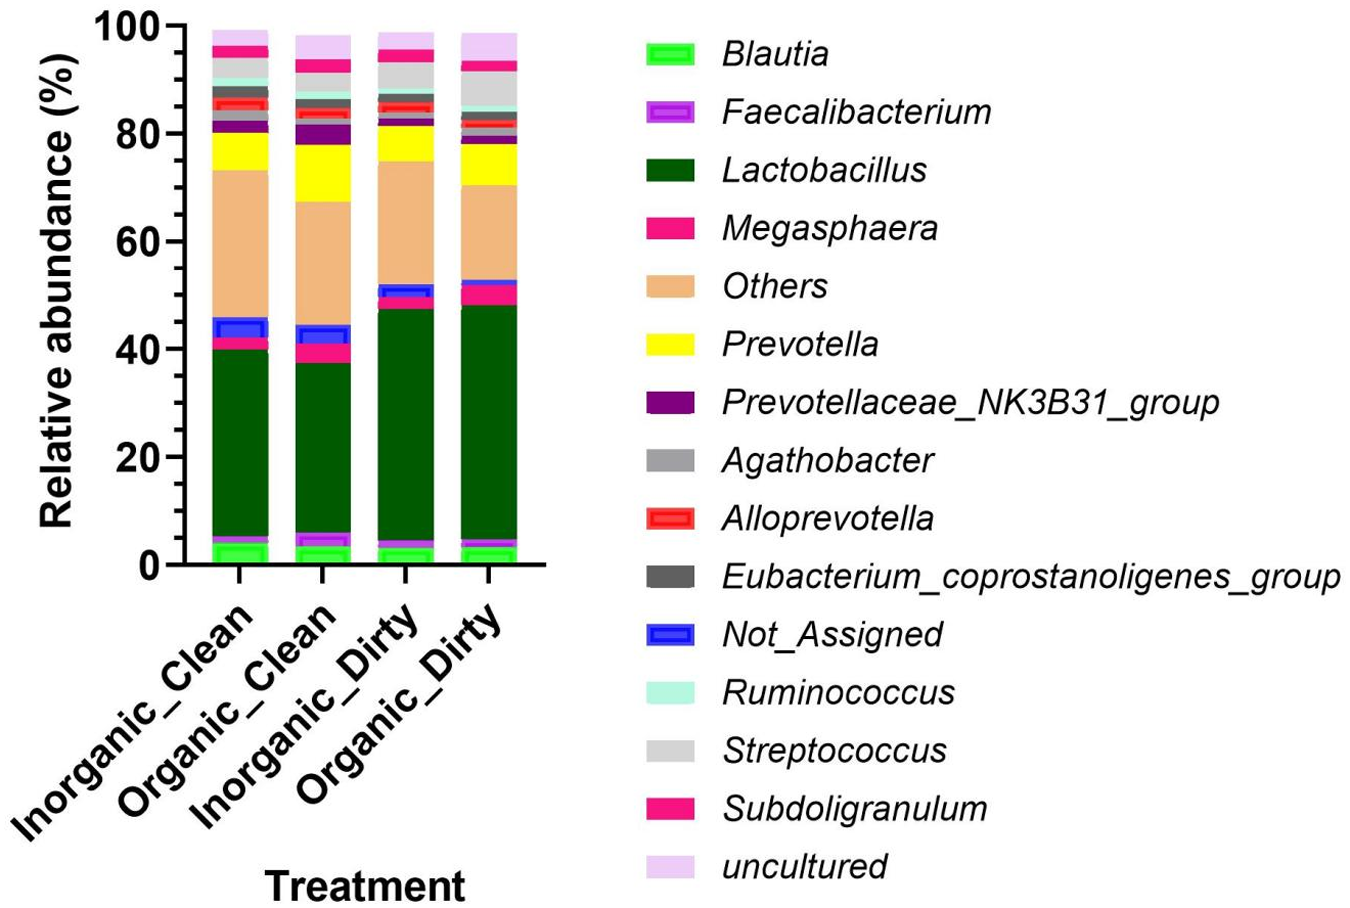
In the current study, 335,720 qualified reads in total were obtained. After quality control with DADA2, an average of 10,491 reads per sample and 2771 ASVs in total were identified. The top phyla in the colon digesta across treatments were, by far, Firmicutes (>80%) and to a less extent Bacteroidota (>16%) and Actinobacteriota (<2%) (Fig. 1, Supplementary Table S1). There were no significant phylum differences among treatments. Most abundant families across all treatments included Lactobacillaceae (>38%), Prevotellaceae (<15%), Lachnopiraceae (<14%), and Ruminococcaceae (>6%) (Fig. 2). There were no significant family differences among treatments (Fig. 2, P > 0.05). The most abundant genus across all treatments was Lactobacillus (>38%) (Fig. 3). Other top genera were Prevotella (<8%), Streptococcus (<5%), and Blautia (<4%). There were no significant differences among these genera across all treatments (P > 0.05).
Stacked bar plot showing the relative abundance of bacterial phyla in the colon digesta of pigs fed either inorganic iron (ferrous sulfate) or organic iron (SQM® iron) and reared under clean or dirty conditions.

Figure 1 Long description
A stacked vertical bar graph with y axis label Relative abundance left parenthesis percent right parenthesis and x axis label Treatment. The y axis ranges from 0 to 100 with tick labels at 0, 20, 40, 60, 80, 100. The x axis has four categories, in this order: Inorganic Clean, Organic Clean, Inorganic Dirty, Organic Dirty. A legend lists these categories: Actinobacteriota, Campylobacterota, Cyanobacteria, Desulfobacterota, Planctomycetota, Proteobacteria, Spirochaetota, Firmicutes, Bacteroidota, Euryarchaeota, WPS underscore 2, Others. Each treatment bar is stacked to a total of 100 percent. In all four bars, the largest segment is Firmicutes. Smaller segments appear for Bacteroidota and several other listed groups. Exact segment percentages for each legend category are not labeled on the bars.
Stacked bar plot showing the relative abundance of the top 15 bacterial families in the colon digesta of pigs fed either inorganic iron (ferrous sulfate) or organic iron (SQM® iron) and reared under clean or dirty conditions.
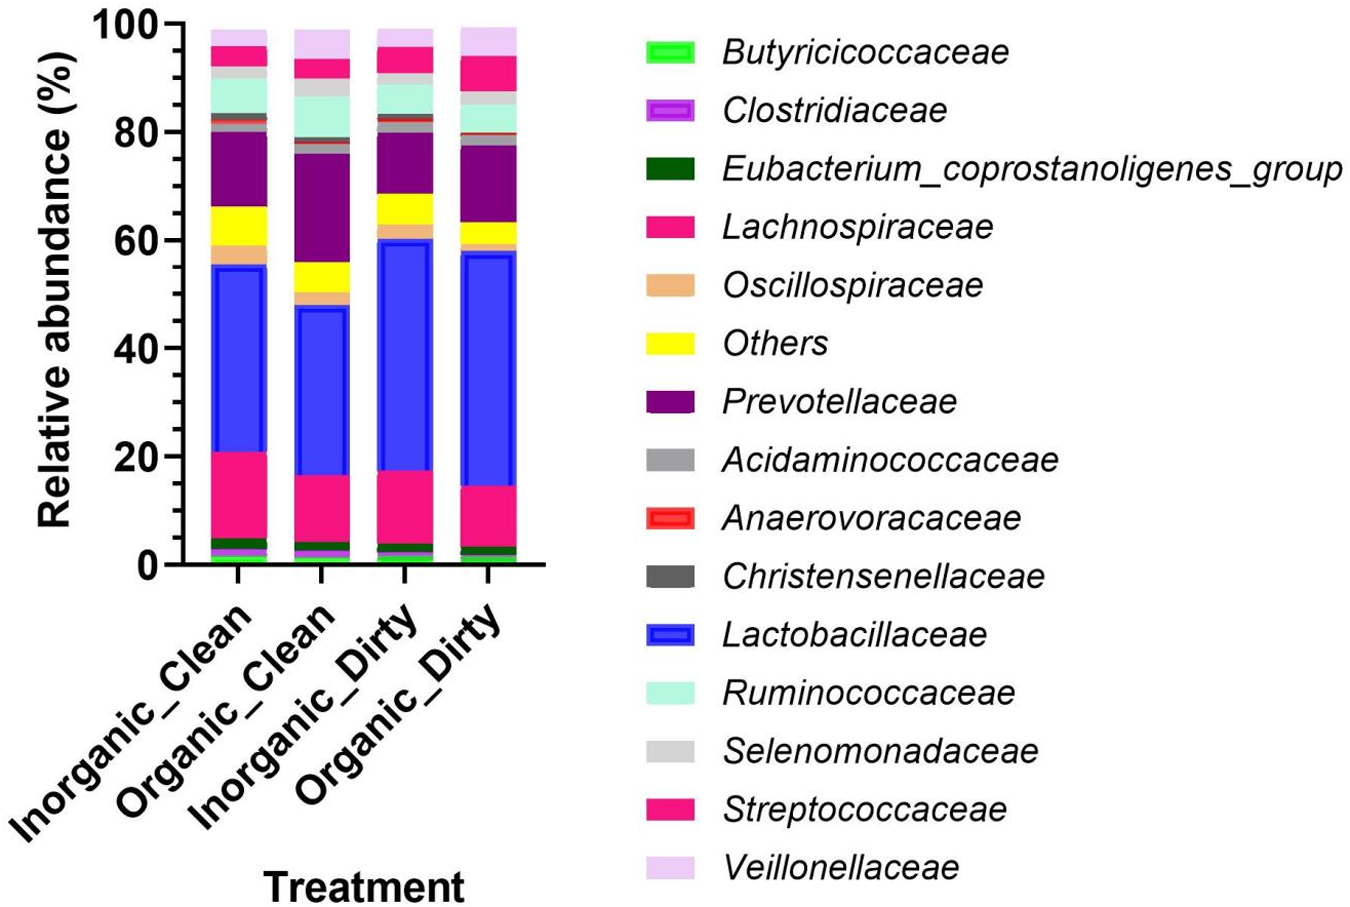
Figure 2 Long description
The stacked bar graph displays the relative abundance of bacterial families in pig colon digesta under four treatments: Inorganic clean, Organic clean, Inorganic dirty and Organic dirty. The x-axis is labeled Treatment and the y-axis is labeled Relative abundance left parenthesis percent right parenthesis, ranging from 0 to 100. Vertical bars are stacked, with colors representing different bacterial families as indicated in the legend. The legend includes Butyricicoccaceae, Clostridiaceae, Eubacteriumcoprostanoligenesgroup, Lachnospiraceae, Oscillospiraceae, Others, Prevotellaceae, Acidaminococcaceae, Anaerovoracaceae, Christensenellaceae, Lactobacillaceae, Ruminococcaceae, Selenomonadaceae, Streptococcaceae and Veillonellaceae. Lactobacillaceae and Prevotellaceae are among the most abundant families, with Lactobacillaceae showing significant presence across all treatments. The composition varies, with notable differences between clean and dirty conditions and inorganic versus organic iron treatments. The graph highlights how bacterial family abundance shifts under different environmental and dietary conditions, with Lactobacillaceae consistently dominating, while others like Prevotellaceae and Clostridiaceae show variations. The use of color differentiates the bacterial families, aiding in visual comparison across treatments.
Stacked bar plot showing the relative abundance of the top 15 bacterial genera in the colon digesta of pigs fed either inorganic iron (ferrous sulfate) or organic iron (SQM® iron) and reared under clean or dirty conditions.

Figure 3 Long description
The stacked bar graph displays the relative abundance of bacterial genera in the colon digesta of pigs. The y axis is labeled Relative abundance left parenthesis percent right parenthesis, ranging from 0 to 100 percent. The x axis is labeled Treatment, with four categories: Inorganic Clean, Inorganic Dirty, Organic Clean, Organic Dirty. Each bar represents a treatment group and is divided into segments corresponding to different bacterial genera. The legend lists the genera: Blautia, Faecalibacterium, Lactobacillus, Megasphaera, Others, Prevotella, Prevotellaceae_N K 3 B 3 1_group, Agathobacter, Alloprevotella, Eubacterium coprostanoligenes group, Not Assigned, Ruminococcus, Streptococcus, Subdoligranulum and uncultured. Lactobacillus is the most dominant genus across all treatments, with a relative abundance exceeding 38 percent. Prevotella and Streptococcus are notable minor taxa, with relative abundances less than 8 percent and 5 percent, respectively. The graph highlights differences in bacterial composition based on iron treatment and environmental conditions, with variations in the abundance of specific genera across treatments.
Alpha and beta diversity
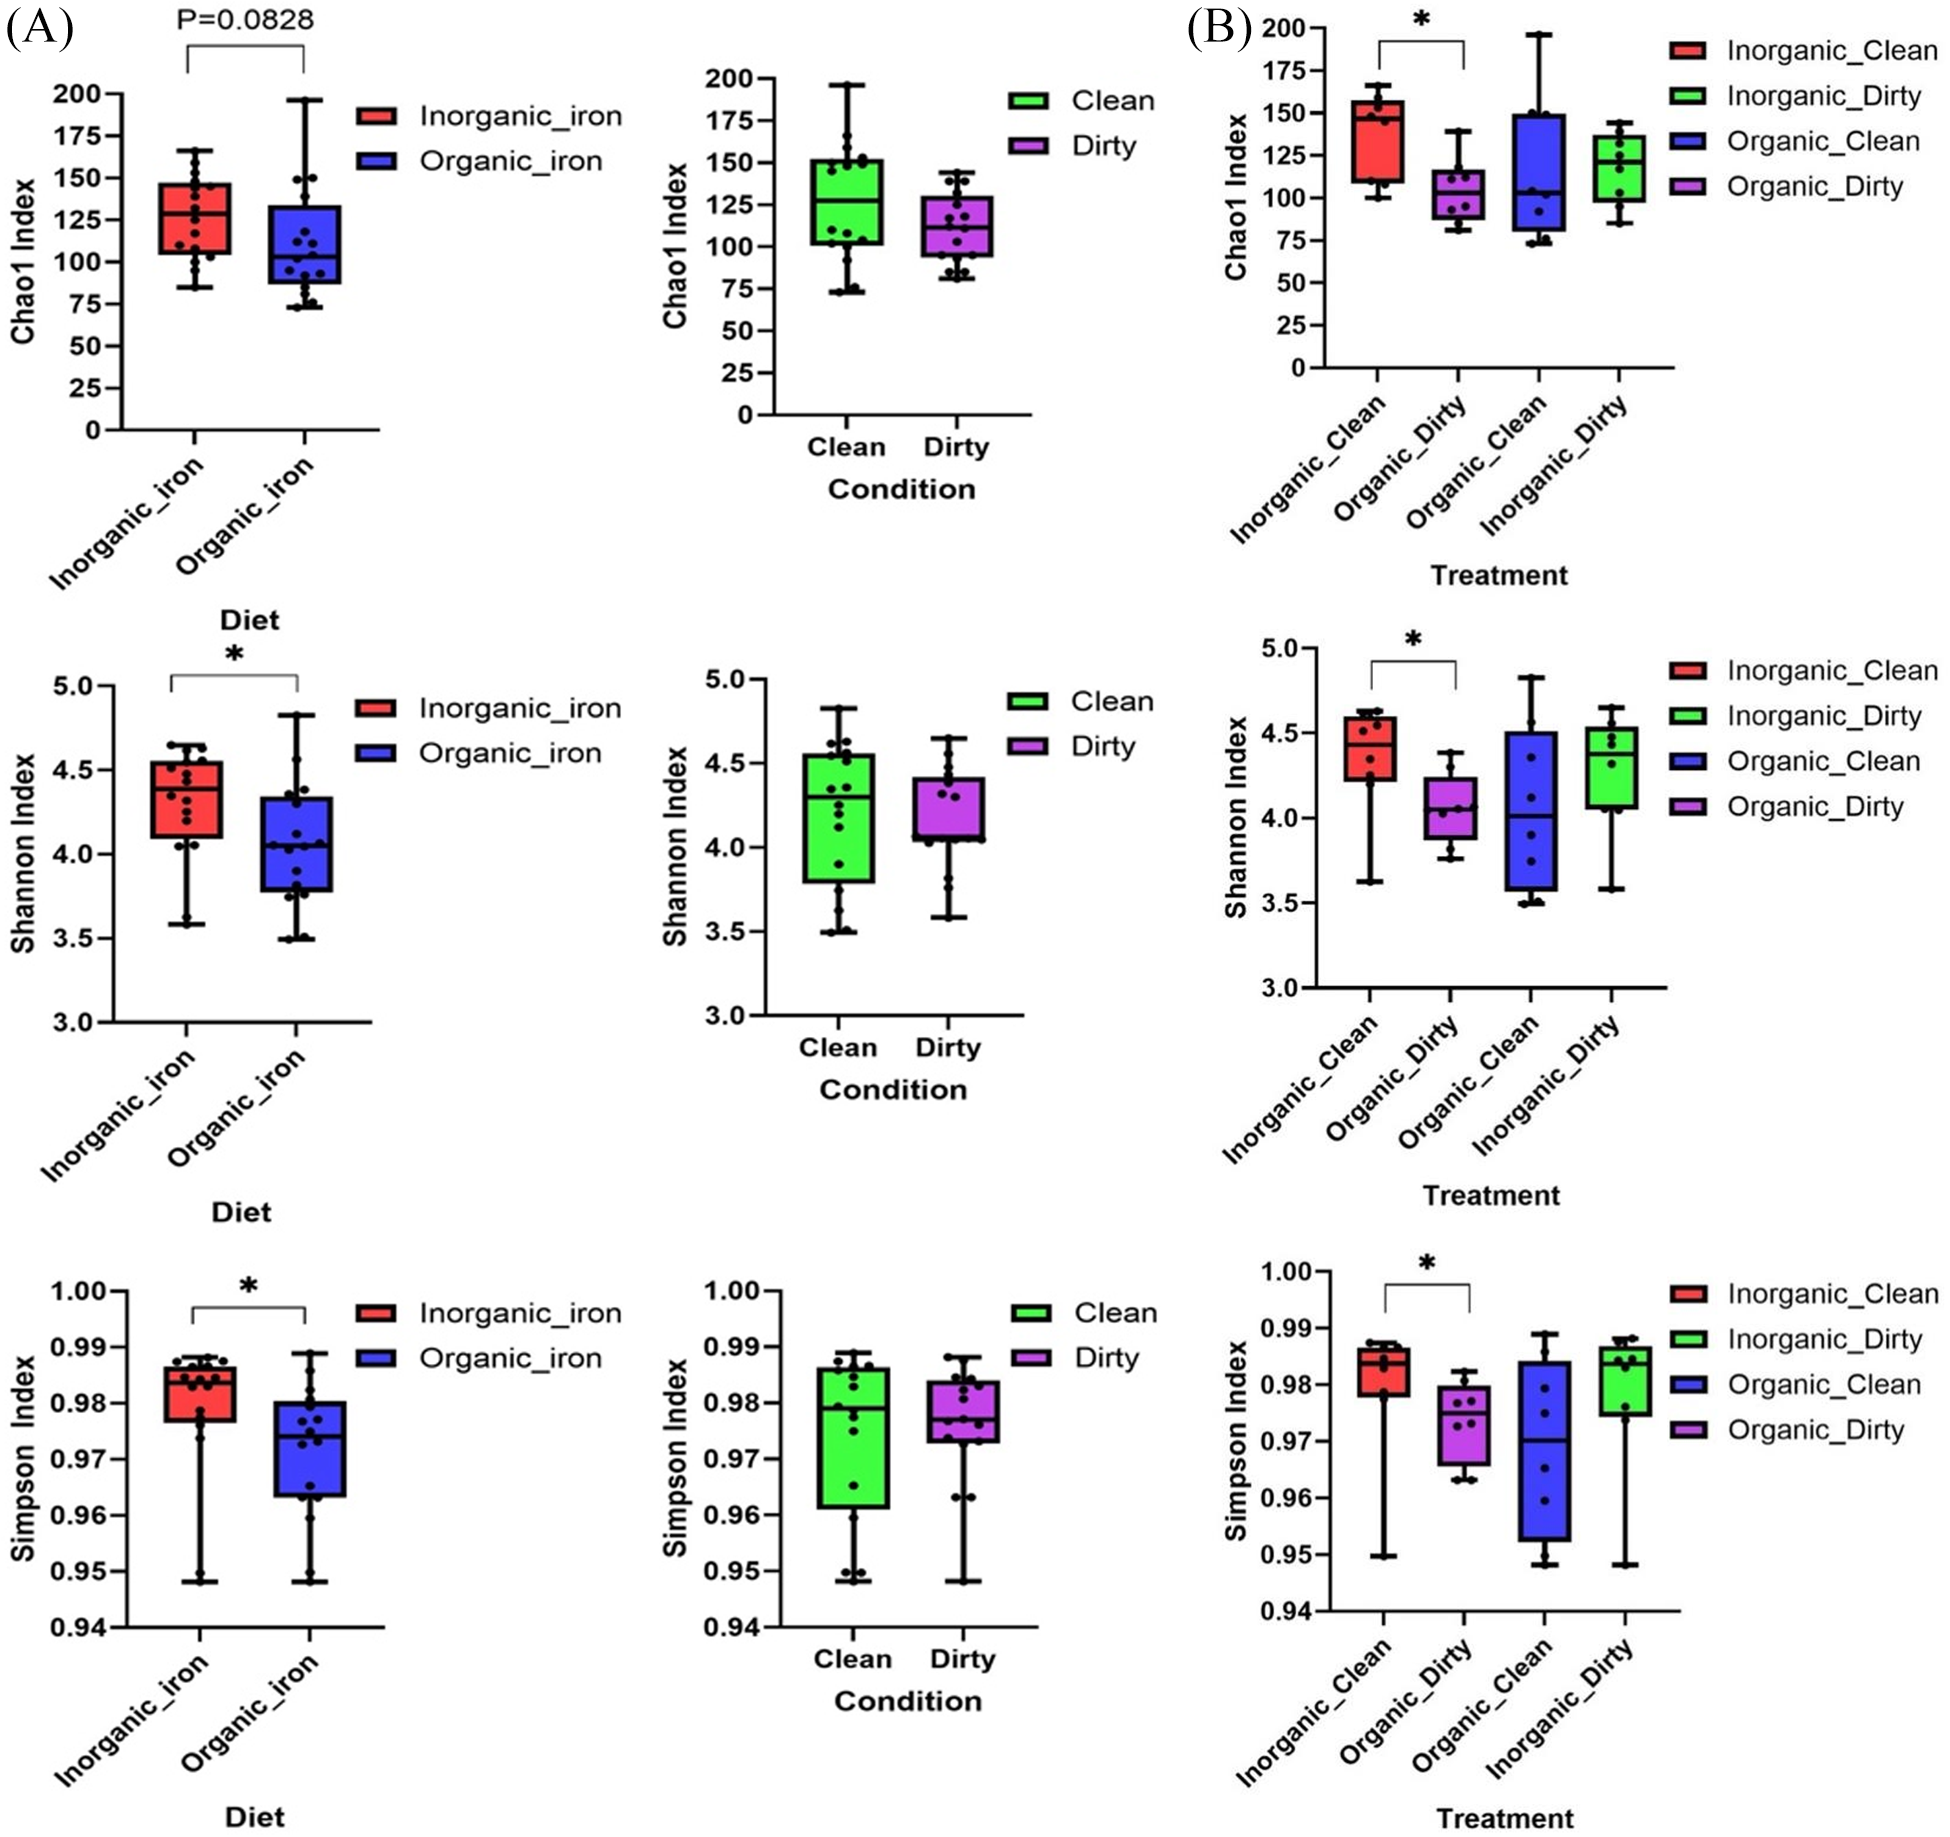
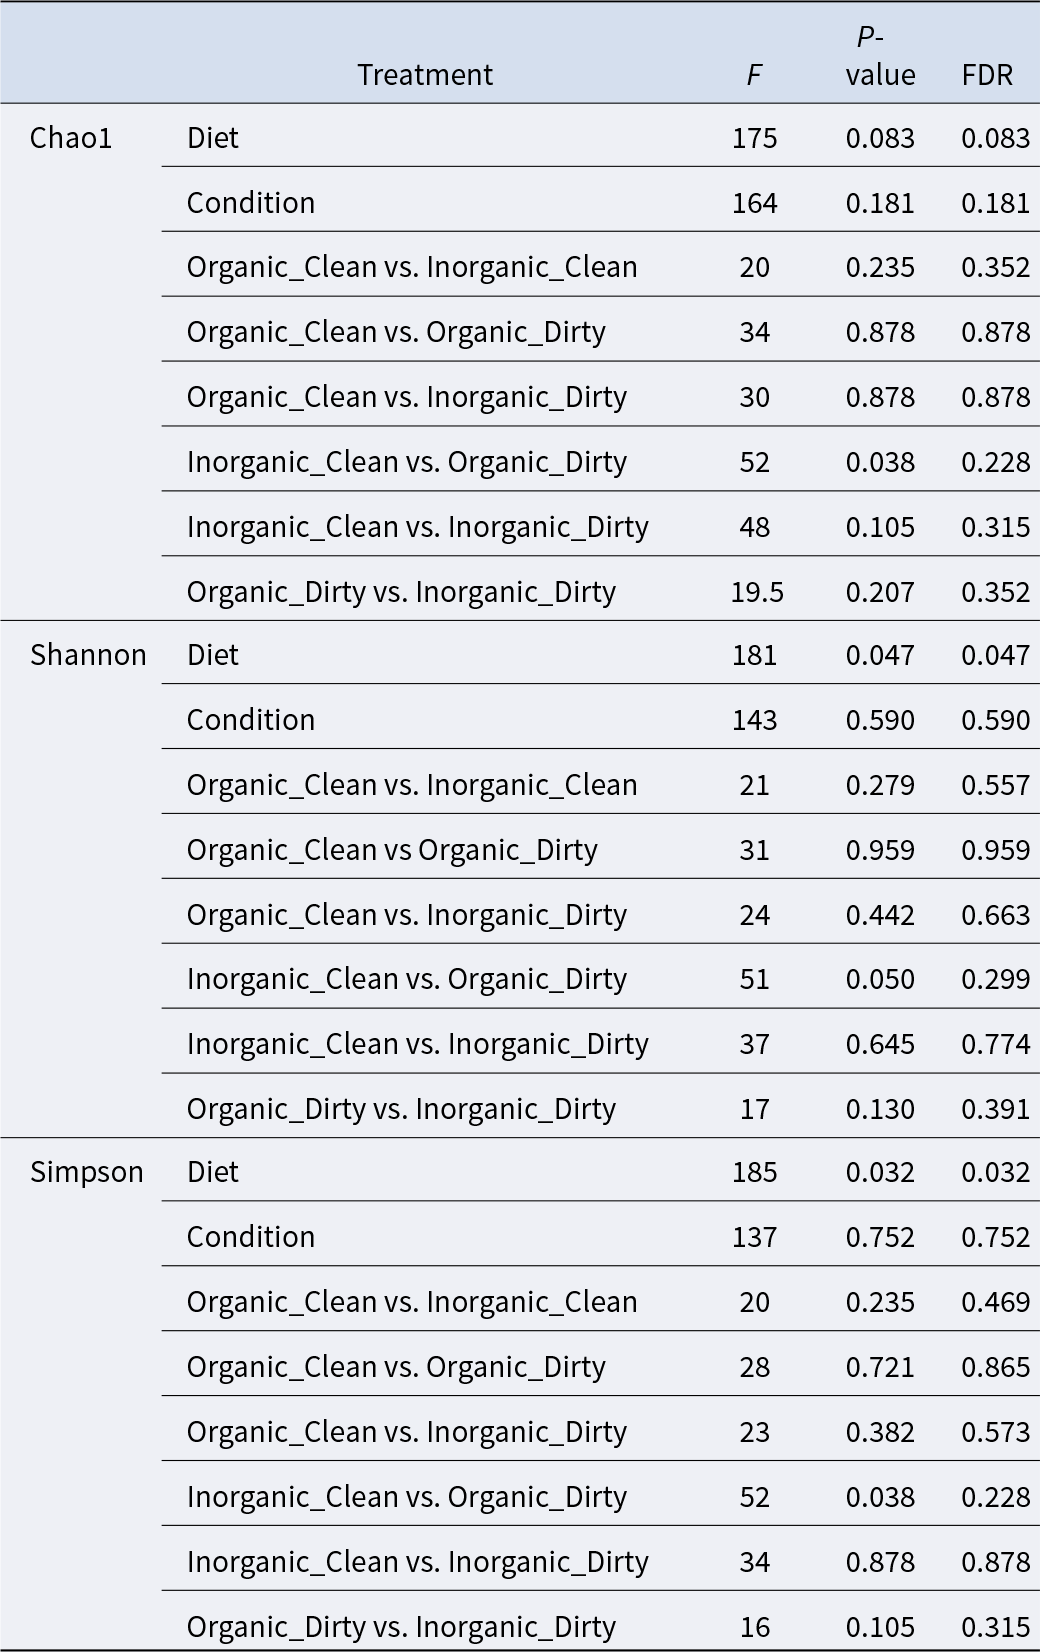
Alpha diversity results, including the Chao1, Shannon, and Simpson indexes, are summarized in Fig. 4A and B and Table 9. Sanitary conditions did not significantly affect any of the alpha diversity indexes. However, the Shannon and Simpson indexes were significantly higher in pigs fed inorganic iron compared to those fed organic iron (P < 0.05). This significance remained after adjusting for FDR. Although Chao1 did not differ significantly between the two diets, there was a trend toward a higher Chao1 value with the inorganic iron source compared to the organic iron (P = 0.0828, Fig. 4).
Alpha diversity as indicated by Chao1, Shannon, and Simpson indexes of colon digesta microbiota of pigs fed either inorganic iron (ferrous sulfate) or organic iron (SQM® iron) and reared under clean or dirty conditions (A) or iron source × sanitary conditions (B). Pairwise comparisons of alpha diversity indexes. a,b,cMeans without a common superscript or * are different (P < 0.05).

Figure 4 Long description
Panel A shows three box plots comparing alpha diversity indexes across diet and condition. The first plot displays Chao1 index by diet, with inorganic iron showing higher median values than organic iron. The second plot shows Chao1 index by condition, with clean and dirty conditions having similar medians. The third plot compares Chao1 index by treatment, with inorganic clean and inorganic dirty showing higher medians than organic clean and organic dirty, marked by an asterisk indicating significance. Panel B presents three box plots comparing indexes across treatment. The first plot shows Shannon index by diet, with inorganic iron having a higher median than organic iron, marked by an asterisk. The second plot displays Shannon index by condition, with similar medians for clean and dirty conditions. The third plot compares Shannon index by treatment, with inorganic clean and inorganic dirty showing higher medians than organic clean and organic dirty, marked by an asterisk. The final row shows Simpson index comparisons. The first plot displays Simpson index by diet, with inorganic iron having a higher median than organic iron, marked by an asterisk. The second plot shows Simpson index by condition, with similar medians for clean and dirty conditions. The third plot compares Simpson index by treatment, with inorganic clean and inorganic dirty showing higher medians than organic clean and organic dirty, marked by an asterisk. The legend differentiates groups by color: inorganic iron, organic iron, clean, dirty, inorganic clean, inorganic dirty, organic clean and organic dirty.
Statistics, P values, and FDR-adjusted P values for iron source and sanitation conditions on alpha diversity indexes Chao1, Shannon, and Simpson indexes
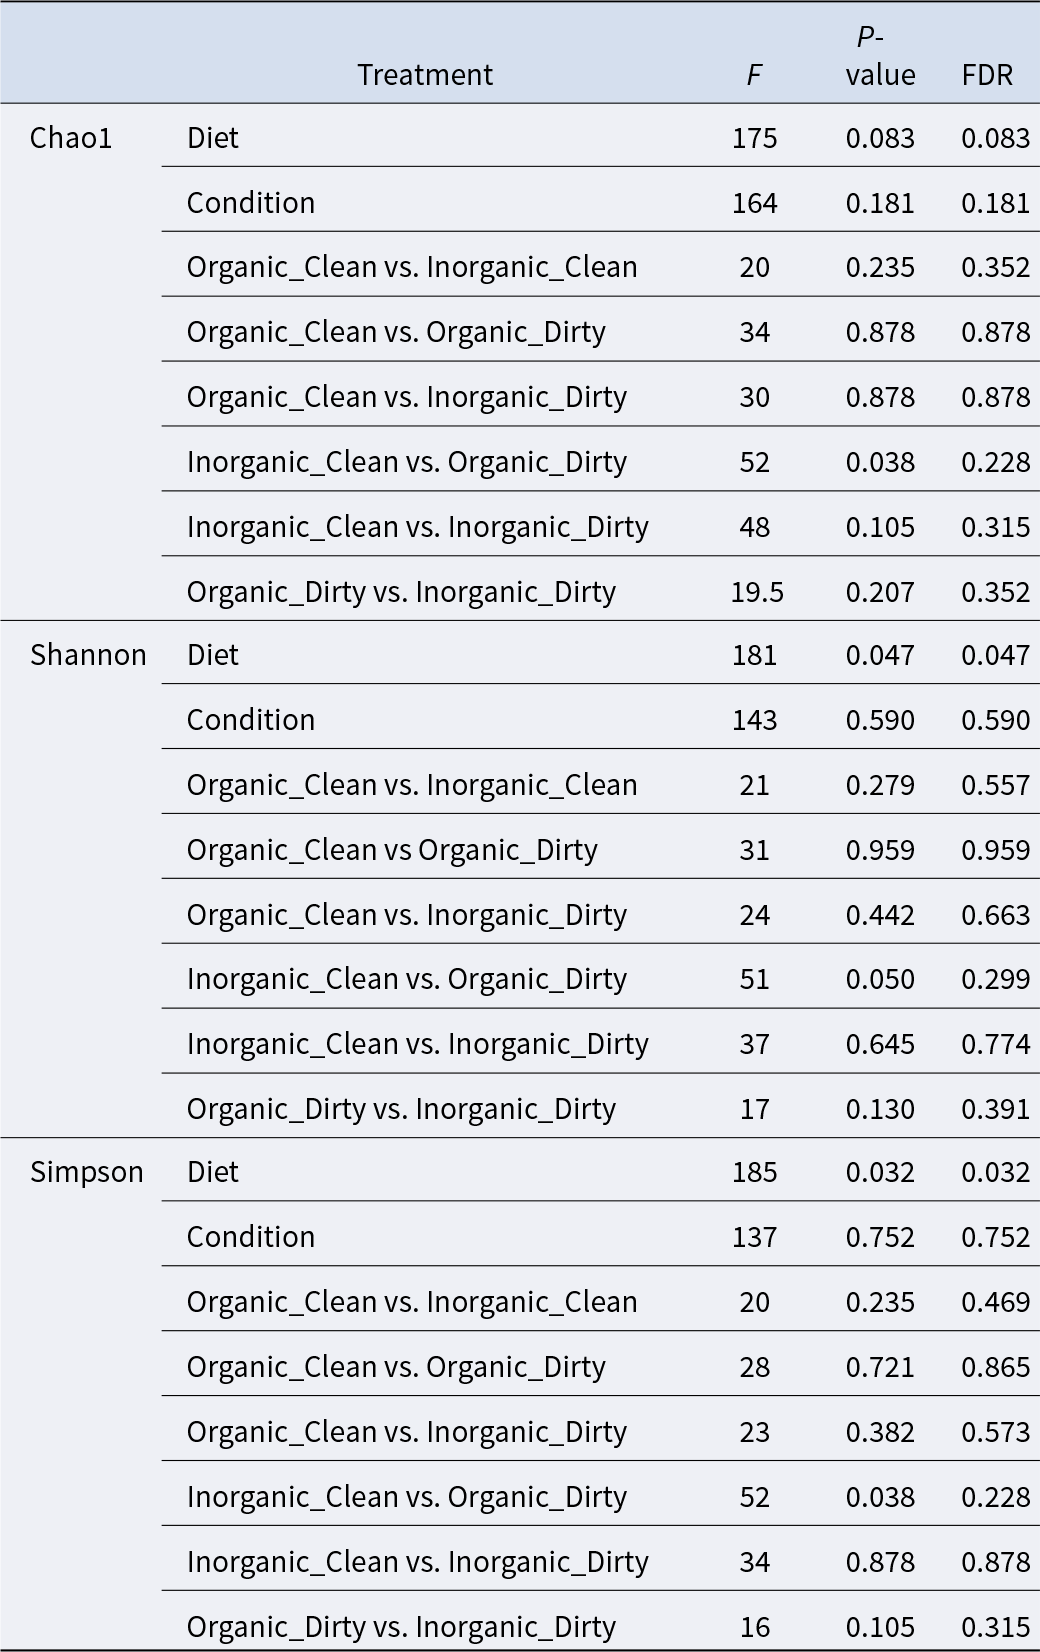
Table 9 Long description
The table reports F statistics, unadjusted P values, and false discovery rate adjusted P values for effects of iron source (diet) and sanitation condition on three alpha diversity indices: Chao1, Shannon, and Simpson. After adjustment, diet is significant for Shannon (F 181, P 0.047, FDR 0.047) and Simpson (F 185, P 0.032, FDR 0.032), but not for Chao1 (F 175, P 0.083, FDR 0.083). Sanitation condition is not significant for any index after adjustment (Chao1 FDR 0.181; Shannon FDR 0.590; Simpson FDR 0.752). Pairwise comparisons among Organic Clean, Inorganic Clean, Organic Dirty, and Inorganic Dirty are all non-significant after FDR adjustment for all indices. The smallest unadjusted pairwise P values occur for Inorganic Clean versus Organic Dirty in Chao1 and Simpson (P 0.038), but these do not remain significant after adjustment (FDR 0.228). Overall, results suggest alpha diversity differences are more related to diet than sanitation, with multiple-testing adjustment reducing evidence for specific group contrasts.
FDR, false discovery rate. Adjusted P-value.
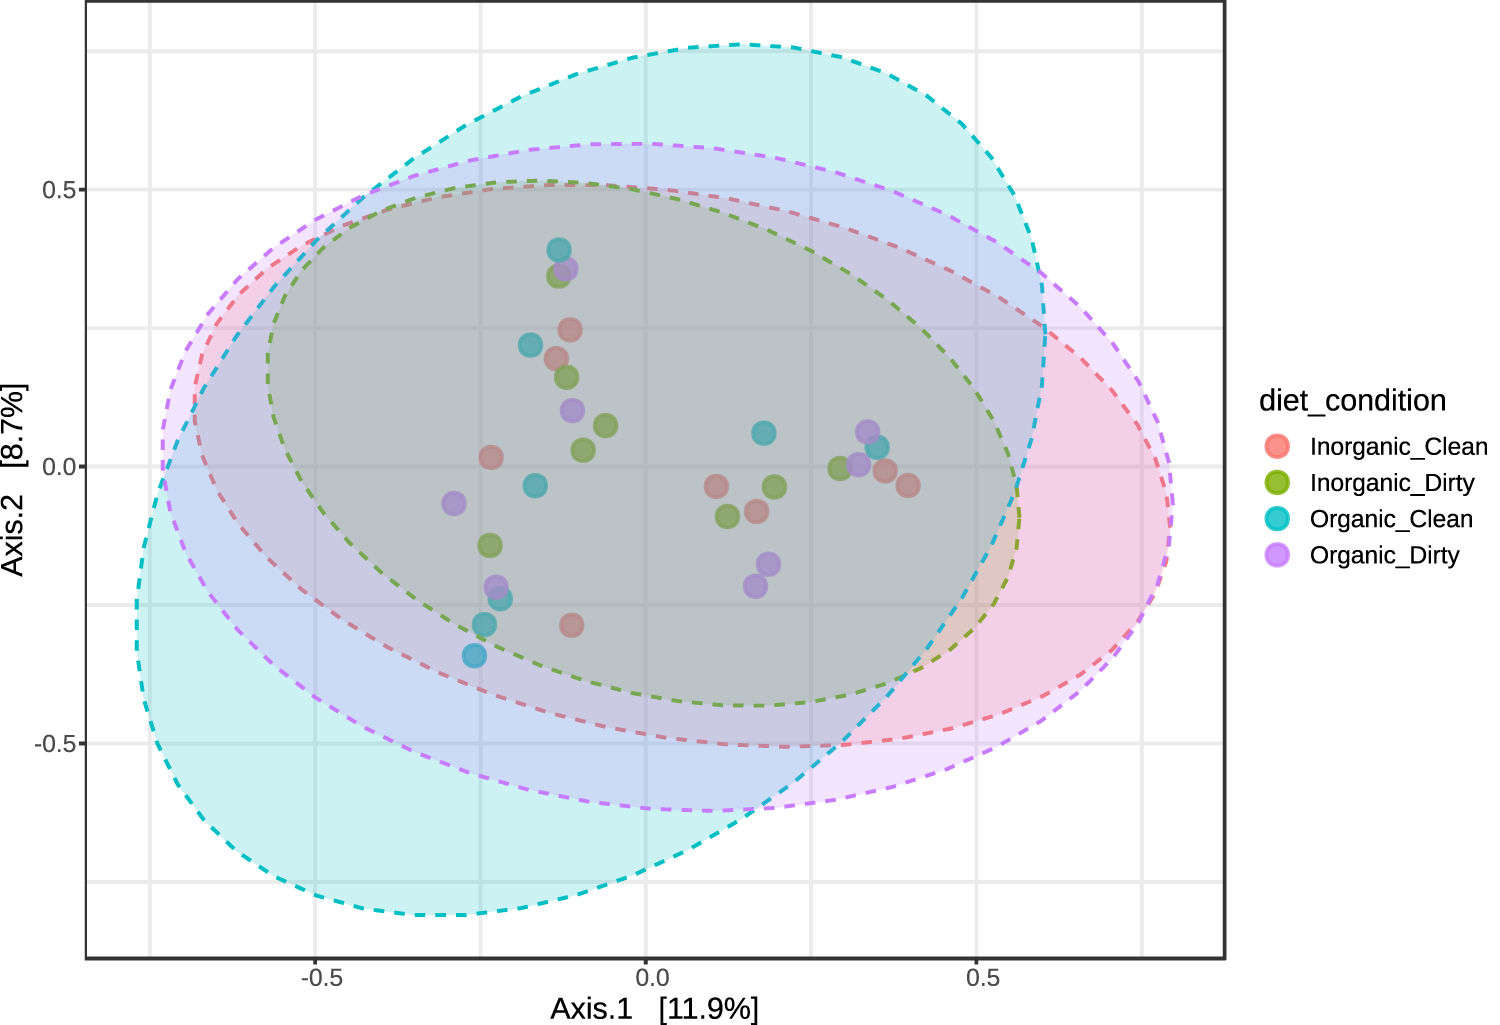
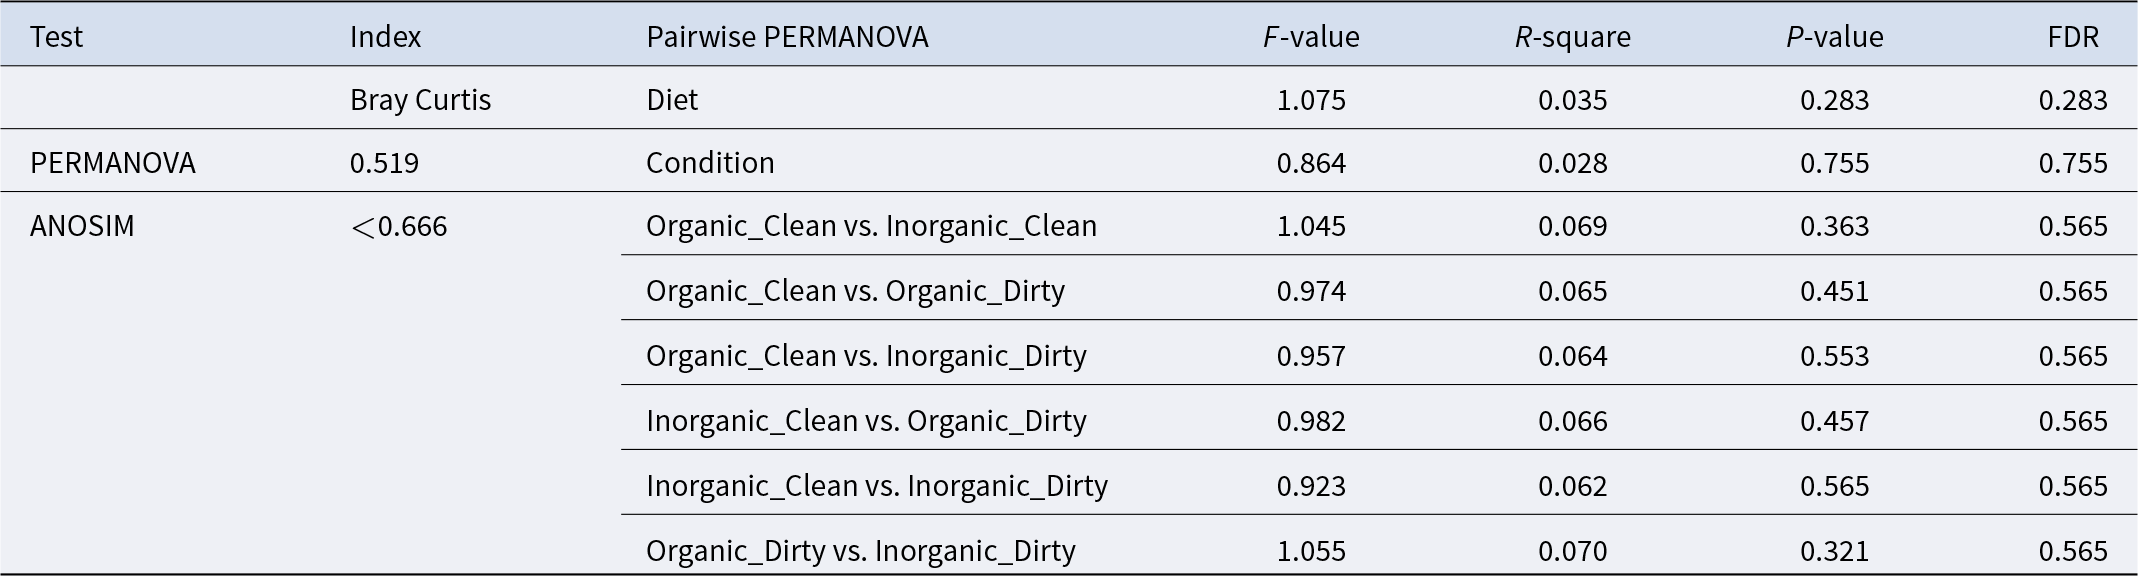
The beta diversity PCoA plot is shown in Fig. 5. Based on the Bray-Curtis dissimilarity matrix, there were no significant differences in beta diversity among treatments (PERMANOVA, P > 0.05; ANOSIM, P > 0.05, Table 10).
Principal component analysis (PCA) plot of beta diversity indexes of microbiota in the colon digesta of pigs fed either an inorganic iron source (ferrous sulfate) or organic iron (SQM® iron) and reared either under clean or dirty conditions based on Bray–Curtis dissimilarities analysis.

Figure 5 Long description
The horizontal axis label is Axis.1 with 11.9 percent. The vertical axis label is Axis.2 with 8.7 percent. A legend titled dietcondition lists InorganicClean, InorganicDirty, OrganicClean and Organic_Dirty. Points are plotted as filled circles for all four diet_condition groups. Dashed elliptical outlines surround each group. The four elliptical outlines overlap in the central area of the plot. Visible tick labels on Axis.1 include negative 0.5, 0.0 and 0.5. Visible tick labels on Axis.2 include negative 0.5, 0.0 and 0.5. Most points appear within the region bounded by Axis.1 from about negative 0.5 to 0.5 and Axis.2 from about negative 0.5 to 0.5. A denser cluster of points appears near Axis.1 around 0.0 and Axis.2 around 0.0, with additional points spread around that area.
Statistics, P-values, and FDR-adjusted P-values of PERMANOVA and ANOSIM analysis of beta diversity indexes according to Bray–Curtis dissimilarities

Table 10 Long description
The table reports beta diversity results using Bray Curtis dissimilarities, summarized with PERMANOVA and ANOSIM statistics plus p values and false discovery rate adjusted p values. PERMANOVA tests diet and condition: diet has F 1.075, R squared 0.035, p 0.283 with the same adjusted p value, and condition has F 0.864, R squared 0.028, p 0.755 with the same adjusted p value. ANOSIM pairwise comparisons among Organic Clean, Inorganic Clean, Organic Dirty, and Inorganic Dirty show R values below 0.666. For ANOSIM, p values range from 0.321 to 0.565, and all adjusted p values are 0.565. Across all tests, none of the comparisons reach statistical significance after adjustment, so the results do not support detectable group separation in beta diversity for these factors in this dataset.
FDR, false discovery rate adjusted P-value.
Differential analysis
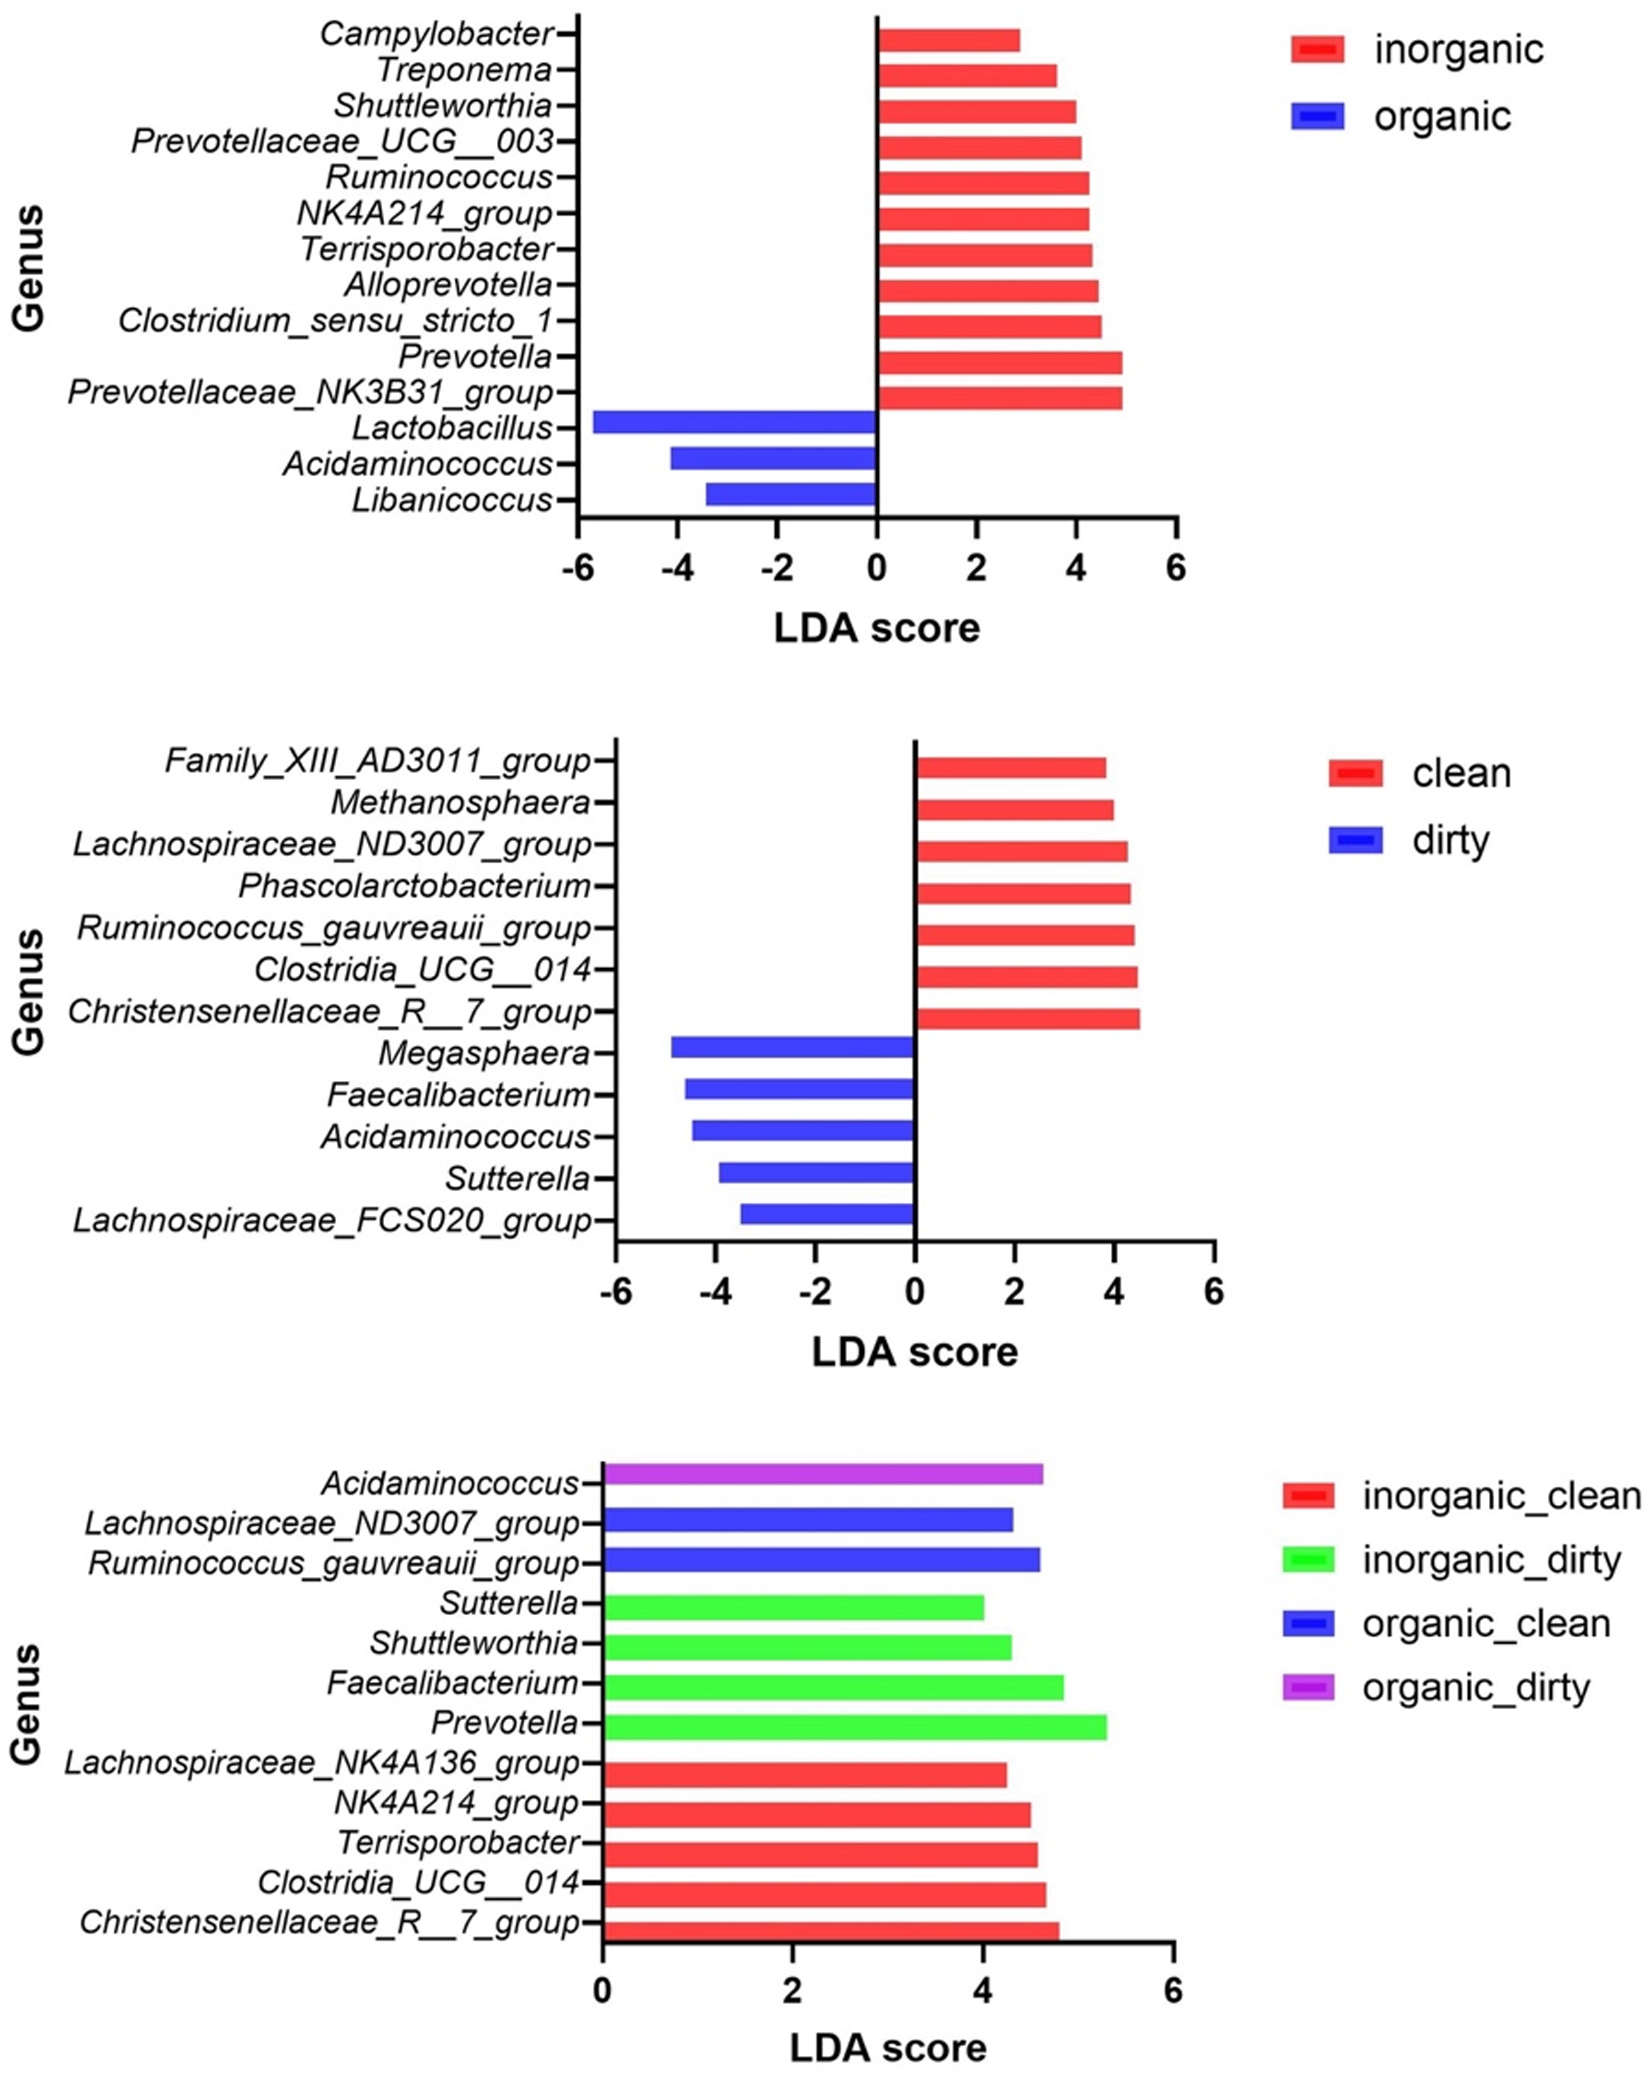
In order to identify differential features, in particular, bacterial taxa that are differentially abundant between treatments, Linear discriminant analysis Effect Size (LEfSE) was performed (Fig. 6). LDA score of 2 or −2 and FDR-adjusted P-value cutoff of 0.1 were chosen. Under these criteria, there were no diet or diet × sanitary condition differences. When considering FDR-adjusted P-values, there were, however, two genera that were distinct for the pigs raised under dirty conditions, i.e., Sutterella (P < 0.05) and Acidaninococcus (P = 0.0913), while Clostridia_UGC_014 was associated with pigs raised under clean conditions (P = 0.0643) (Fig. 6, Supplementary Table S2A, B, and C).
LEfSe analysis showing differential abundant taxa between pigs fed the inorganic (ferrous sulfate) or organic iron (SQM® iron) and reared under clean and dirty conditions. Histograms of a linear discriminant analysis (LDA) scores (−2 < threshold > 2) of microbiota in colon digesta of weaned pigs. Analysis done by diet (A), sanitary condition (B) or diet × condition (C).

Figure 6 Long description
The image contains three horizontal bar graphs labeled A, B and C. Each graph has the x-axis labeled LDA score and the y-axis labeled Genus. Bars extending to the right indicate positive LDA scores associated with the first listed group and bars extending to the left indicate negative LDA scores associated with the second listed group. Image A compares inorganic versus organic diet groups. The x-axis ranges from minus 6 to 6. Bars extending to the right correspond to inorganic and bars extending to the left correspond to organic. Taxa enriched in inorganic include Campylobacter, Treponema, Shuttleworthia, PrevotellaceaeUCG003, Ruminococcus and Terrisporobacter, with Campylobacter showing the largest positive LDA score of approximately 5. Taxa enriched in organic include Libanicoccus, Acidaminococcus, Lactobacillus, Prevotella, PrevotellaceaeNK3B31group, Clostridiumsensustricto1, Alloprevotella and NK4A214group, with Libanicoccus showing the largest negative LDA score of approximately minus 5. Image B compares clean versus dirty sanitary conditions. The x-axis ranges from minus 6 to 6. Bars extending to the right correspond to clean and bars extending to the left correspond to dirty. Taxa enriched in clean include FamilyXIIIAD3011group, Methanobrevibacter, LachnospiraceaeND3007group and Phascolarctobacterium, with FamilyXIIIAD3011group showing the largest positive LDA score of approximately 5. Taxa enriched in dirty include LachnospiraceaeFCS020group, Sutterella, Acidaminococcus, Faecalibacterium, Megasphaera, ChristensenellaceaeR7group and ClostridiaUCG014, with LachnospiraceaeFCS020group showing the largest negative LDA score of approximately minus 6. Image C compares four combined groups: inorganicclean, inorganicdirty, organicclean and organicdirty. The x-axis ranges from 0 to 6. Each genus bar is associated with one of the four groups. Listed taxa include Acidaminococcus, LachnospiraceaeND3007group, Ruminococcusgnavreauiigroup, Sutterella, Shuttleworthia, Faecalibacterium, Prevotella, LachnospiraceaeNK4A136group, NK4A214group, Terrisporobacter, ClostridiaUCG014 and ChristensenellaceaeR7group. ChristensenellaceaeR7group and ClostridiaUCG014 show the largest LDA scores of approximately 6.
Discussion
In this study, we evaluated SQM® iron, a PIC, as an alternative iron source for nursery pigs under clean and dirty sanitary conditions. We assessed growth performance, gut health, gut permeability, iron-related responses, and gut microbiota composition.
Growth performance and relative organ weight
Supplementing pig diets with organic SQM® iron improved growth performance, particularly during the early post-weaning period. This finding is consistent with Ma et al. (Reference Ma, Sun and Zhou2012), who reported enhanced growth performance in broilers fed an organic iron source, iron glycine chelate. In the present study, pigs fed SQM® iron also had greater BW at days 14 and 28 than those fed ferrous sulfate, and pigs raised under clean sanitary conditions had greater BW at day 28 than those raised under dirty conditions. These BW responses are consistent with the observed improvements in ADG during the early post-weaning period and indicate that the growth-promoting effect of SQM® iron was maintained over time. The improved growth observed with SQM® iron is noteworthy, as organic iron sources typically do not yield growth benefits (Huang et al. Reference Huang, Yang and Xie2023b; Zhang et al. Reference Zhang, Lu and Zhang2016). In contrast, Zhang et al. (Reference Zhang, Lu and Zhang2016) found no significant impact on growth performance in broilers fed various organic iron sources compared to ferrous sulfate. Similarly, Huang et al. (Reference Huang, Yang and Xie2023a) observed that organic iron peptides improved iron retention in the liver, kidney, and spleen but did not affect ADG, ADFI, or gain-to-feed ratio in piglets. These discrepancies in growth performance may result from variations in iron sources, inclusion levels, pig age, or study conditions (Sun et al. Reference Sun, Yu and Luo2022; Zhuo et al. Reference Zhuo, Yu and Li2019). Additionally, clean sanitary conditions were associated with better growth and FCR, in line with Floc’h et al. (Reference Floc’h, Knudsen and Gidenne2014), who reported a 20% decrease in growth performance under poor hygiene. Poor hygiene may have reduced feed intake and contributed to lower growth in pigs fed inorganic iron in dirty conditions. Poor hygiene is also linked to metabolic and behavioral changes that affect growth (Pastorelli et al. Reference Pastorelli, Le Floc’h and Merlot2012).
Iron fecal excretion and diarrhea incidence
In our study, fecal iron contents were similar between organic SQM® iron and ferrous sulfate on day 14, indicating comparable iron absorption. However, by day 21, pigs receiving organic iron showed higher fecal iron content. This result contrasts with studies showing better bioavailability and absorbability of organic iron sources (Bai et al. Reference Bai, Cao and Ma2021; Huang et al. Reference Huang, Yang and Xie2023a; Thomaz et al. Reference Thomaz, Watanabe and Pascoal2015). The higher fecal iron concentration observed in pigs fed SQM® iron at day 21 may indicate greater luminal iron remaining at the time of sampling. However, fecal iron concentration reflects iron output in the intestinal lumen and should not be interpreted directly as evidence of lower iron digestibility or utilization, as it may also be influenced by luminal retention and excretion dynamics at the time of sampling. Therefore, this finding should be interpreted cautiously. Nevertheless, our findings were consistent with Lee et al. (Reference Lee, Shinde and Choi2008), who reported similar fecal iron levels when ferrous sulfate was supplemented at high levels (100–250 ppm). Our iron levels exceeded the pigs’ requirements (National Research Council 2012), and feed ingredients contributed significantly to the dietary iron, which could explain the lack of significant improvement with SQM® iron. Feng et al. (Reference Feng, Ma and Xu2009) also did not see a significant reduction in fecal iron concentration when pigs were fed with 120 ppm as iron glycine compared with 120 ppm iron as ferrous sulfate, suggesting similar iron absorbability for these two iron sources. Variations between studies may arise from differences in iron supplementation levels, sources, diet content, and pig age.
Sanitary conditions did not affect fecal iron content or diarrhea incidence. Floc’h et al. (Reference Floc’h, Knudsen and Gidenne2014) also found no significant impact of hygiene on diarrhea incidence. Diarrhea scores were similar between iron sources, except for a better score on day 27 for pigs fed organic iron. A better fecal score with the organic iron reflects less diarrhea incidence, suggesting overall better gut health of pigs fed the organic iron. This is consistent with other studies where PIC reduced the incidence of diarrhea and less gastrointestinal irritation in humans (e.g., Jing et al. Reference Jing, Zhang and Li2022). The reason why the benefits of SQM® iron on fecal score were not seen earlier in our study may be due to the compromised gut health status of the younger piglets that had just been recently weaned.
Gut integrity and permeability
Ferrous sulfate has been associated with increased gut permeability and reduced expression of TJ proteins in some studies (Chen et al. Reference Chen, Wu and Wang2020; Ding et al. Reference Ding, Yu and Chen2020a, b). In the present study, iron source did not significantly affect FITC permeability or TEER overall, although TEER was higher in pigs fed SQM® iron under clean conditions than in pigs fed ferrous sulfate under dirty conditions. This suggests that the effects of iron source on intestinal barrier function were selective rather than uniform. No significant differences were observed in the expression of TJ-related genes among treatments. This differs from Sun et al. (Reference Sun, Yu and Luo2022), who reported increased ZO-1 expression with ferrous glycine, possibly reflecting differences in organic iron source or supplementation level.
Nutrient absorption capacity and gut health
In our study, we examined the impact of different iron sources (SQM® iron vs. iron sulfate) and sanitary conditions on nutrient absorption capacity and gut health in weaned pigs. For this, we assessed the relative expression of various nutrient transporters and found no significant effects of iron source or sanitary conditions, except for a trend of higher PepT-1 expression with organic iron, consistent with Fang et al. (Reference Fang, Zhuo and Fang2013), who also observed higher PepT-1 levels with organic iron. However, no differences were observed in the expression of DMT-1 and ferroportin-1, indicating no effects on iron homeostasis. Similarly, Sun et al. (Reference Sun, Yu and Luo2022) found no significant differences in the relative expression of DMT-1 between ferrous sulfate and ferrous glycine. In contrast, a study on broilers by Sun et al. (Reference Sun, Liu and Shi2015) reported a decrease in DMT-1 mRNA expression as the amount of ferrous glycine increased. According to these authors, this suggests that ferrous glycine is more easily absorbed than ferrous sulfate, as the higher intracellular iron levels could downregulate DMT-1 expression.
In the present study, no significant differences were observed in the expression of DMT-1 or ferroportin between iron sources. One possible explanation is that the basal diet already contained 89.2 mg Fe/kg, and after supplementation with 100 mg Fe/kg, the total dietary iron concentration reached 189.2 mg/kg, exceeding the requirement for nursery pigs recommended by NRC (2012). Under these conditions, the relatively high total dietary iron supply may have reduced the sensitivity to detect treatment-related differences in intestinal iron transporter expression. Ferroportin is the only known intracellular iron export protein (Recalcati et al. Reference Recalcati, Gammella and Buratti2017). Upregulation of this protein expression may be an adaptive mechanism for iron removal from the enterocytes. Excess iron has been associated with increases in ferroportin (Espinoza et al. Reference Espinoza, Morales and Arredondo2014). In our study, however, there was no change in the expression of ferroportin in the enterocytes, suggesting that there was no excess of iron in these cells. The liver stores excess iron. It is possible that the expression of this transporter would be increased in the hepatocytes, and this warrants investigation.
We also measured serum indicators of gut health, such as d-lactate and DAO. Although there were no significant differences in these indicators between iron sources, a trend for higher serum d-lactate in pigs raised under dirty conditions suggests increased gut permeability in these pigs due to probably intestinal mucosa damage. This finding contrasts with Sun et al. (Reference Sun, Yu and Luo2022), who reported lower d-lactate with organic iron (ferrous glycine), highlighting potential differences due to the specific organic iron source used. Moreover, the level of d-lactate in the blood is dependent on the degree of intestinal mucosa damage, and this may have been different between our study and the study by Sun et al. (Reference Sun, Yu and Luo2022).
Gut microbiota composition
Iron sulfate has been linked to shifts in gut microbiota, often favoring pathogenic bacteria (Chen et al. Reference Chen, Wu and Wang2020; Pajarillo et al. Reference Pajarillo, Lee and Kang2021; Sun et al. Reference Sun, Tan and Zhang2024). Our study found that Firmicutes, currently known as Bacillota and Bacteroidota, were the dominant phyla in the pig colon microbiota, with no differences among treatments. This contrasts with Ma et al. (Reference Ma, Liu and Piao2022), who observed lower Firmicutes abundance with organic iron (ferrous glycine chelate) or with Zeng et al. (Reference Zeng, Jiang and Zhou2023), who reported higher Firmicutes with yeast iron supplementation. The discrepancies highlight how specific organic iron sources and pig age affect gut microbiota (Ma et al. Reference Ma, Liu and Piao2022; Zeng et al. Reference Zeng, Jiang and Zhou2023). Among microbial families, Lactobacillaceae and Ruminococcaceae were the most abundant across treatments. Ma et al. (Reference Ma, Liu and Piao2022) found varying abundances of Lactobacillaceae and Clostridiaceae with organic iron, illustrating iron source- dependent gut microbiota responses.
Sanitary conditions also did not significantly affect overall microbiota composition in our study, despite differences in room hygiene and pathogen exposure. This contrasts with earlier reports showing hygiene-related changes in microbial communities (Floc’h et al. Reference Floc’h, Knudsen and Gidenne2014; Luise et al. Reference Luise, Le Sciellour and Buchet2021; Montagne et al. Reference Montagne, Arturo-Schaan and Floc’h2010; Mulder et al. Reference Mulder, Schmidt and Stokes2009; Schmidt et al. Reference Schmidt, Mulder and Musk2011), again indicating that the impact of sanitary challenge may vary with study design and rearing conditions.
Alpha and beta diversity
In our study, no significant differences in species richness (Chao1 index) were observed between the two sanitary conditions. However, there was a trend suggesting that pigs fed inorganic iron had higher species richness than those fed organic iron, especially under clean conditions. The Simpson index (species dominance) and the Shannon index (species richness and evenness) were significantly higher for pigs fed inorganic iron compared to those fed organic iron. Additionally, both species richness and evenness were greater in pigs fed inorganic iron and raised in clean conditions than in those fed organic iron and raised in dirty conditions. Ma et al. (Reference Ma, Liu and Piao2022) reported that supplementation with ferrous glycine chelate increased microbial diversity indices (Ace, Chao1, and Simpson) in 14-day-old pigs, suggesting increased microbial richness and evenness. However, by 28 days, there were no significant differences in microbial diversity between organic iron and ferrous sulfate groups, indicating that microbial richness and diversity may be age-dependent. Regarding beta-diversity, our study found no differences based on the Bray–Curtis distance algorithm. This aligns with Ma et al. (Reference Ma, Liu and Piao2022), who also did not see significant effects of an organic iron source on the beta-diversity of 28-day-old pigs. These authors, however, did see a significant effect for 14-day piglets, suggesting that the effects of iron source on microbial structure are age-dependent.
Differential analysis
In our study, LEfSe analysis, using FDR-adjusted P-values, did not reveal significant differences in genus abundances between dietary treatments. This contrasts with Ma et al. (Reference Ma, Liu and Piao2022), who identified differential genera associated with iron sources, noting decreases in Olsenella, Prevotella, and Slackia, and increases in Tezzerella and Sutterella in pigs fed ferrous glycine chelate. The differing organic iron sources might explain the contrasting results. Differences between studies could also stem from variations in pig breeds, ages, diets, or statistical methods.
For sanitary conditions, LEfSe detected two genera enriched under dirty conditions: Sutterella and Acidaninococcus, while Clostridia_UCG-014 was associated with clean conditions. Sutterella, a pathogenic bacterium linked to diarrhea (Lv et al. Reference Lv, Liu and Ye2017), may have contributed to the higher diarrhea rates observed in pigs raised in dirty conditions. Clostridia_UCG-014, on the other hand, is a commensal bacterium that has been reported to be positively associated with bacterial diversity and barrier function in healthy humans (Leibovitzh et al. Reference Leibovitzh, Lee and Xue2022). The higher relative abundance of these bacteria in pigs raised under clean conditions suggests improved barrier function in these pigs which is consistent with the higher TEER values.
Although pigs fed SQM® iron showed lower Shannon and Simpson indices than pigs fed inorganic iron, the biological significance of this finding should be interpreted cautiously. Reduced alpha diversity is generally not considered an ideal ecological change when viewed in isolation. However, in the present study, the lower alpha diversity observed with SQM® iron was not accompanied by significant differences in beta diversity, major bacterial taxa, or clear diet-associated discriminatory features in LEfSe analysis. In addition, this pattern was not paralleled by clear deterioration in the measured gut health indicators. Therefore, SQM® iron was associated with reduced within-sample microbial diversity under the conditions of this study, but this pattern was not accompanied by broader microbial disruption in the present dataset.
Limitation
One limitation of the present study is that systemic and tissue iron status was not comprehensively evaluated. The original experimental design was primarily intended to assess growth performance, fecal iron excretion, intestinal health, and gut microbiota responses to different dietary iron sources under contrasting sanitary conditions. As a result, serum iron levels, tissue iron concentrations in major iron storage and metabolic organs such as the liver, spleen, and kidney, and key hepatic regulatory markers, including hepcidin, were not determined. Therefore, the present study does not provide a complete evaluation of whole-body iron absorption, distribution, and retention. Future studies should include these parameters to better characterize iron bioavailability and systemic iron homeostasis associated with different dietary iron sources.
Conclusion
The organic iron supplementation improved the growth performance of weaned pigs. It also improved gut health, evidenced by improved gut permeability (higher TEER). It was also associated with a lower incidence of diarrhea. Iron source and sanitation conditions modulated the colon microbiota of weaned pigs. Microbiota richness and evenness were higher with the inorganic iron source than with the organic iron, while sanitary conditions had no effect on these indexes. Overall, organic iron could serve as an alternative iron source for nursery pigs based on the measured biological responses in this study.
Supplementary material
The supplementary material for this article can be found at https://doi.org/10.1017/anr.2026.10050.
Data Availability Statement
The datasets supporting the conclusions of this article will be deposited in the NCBI Sequence. All other data are contained within the main manuscript.
Acknowledgements
We would like to thank Arantxa Asun, Fernando Esposito, Dr. Jieyuan Jiang, Yujia Wu, Haoxiang Xu, and Jason Bourcier for their help in the animal trial and sample collection. In addition, we would like to thank the assistance from Dr. Jieyuan Jiang for the laboratory analysis.
Author Contributions
J.G., J.J., M.D., and C.Y. conceived and designed the research. Z.C. performed the research. S.J., P.A., B.Z., and J.Z. analyzed the data. Z.C., P.A., H.D., and C.Y. wrote the manuscript, and all other authors revised the manuscript. All authors read and approved the final manuscript.
Financial Support
Funding was provided by Qualitech Inc., project number 56398.
Conflict(s) of Interest
No conflicts of interest, financial or otherwise, are declared by the authors apart from that Joshua Jendza works for QualiTech.



 Open access

