


Impact Statements
This study provides one of the first harmonised, community-level assessments of drinking water quality across 839 communities in Australia and Canada. By showing that Indigenous status and remoteness are strong predictors of poor drinking water outcomes even in high-income countries, the findings highlight the role of structural inequities in water governance rather than technical or geographic constraints alone. The results can inform more equitable water policy, targeted infrastructure investment and improved accountability for progress towards Sustainable Development Goal 6.1.
Introduction
Sustainable Development Goal (SDG) 6.1 seeks universal access to safe and affordable drinking water for all by 2030. Despite global commitments, enduring inequities in water access, allocation, governance and participation continue to impede progress towards this goal (Fanaian et al., Reference Fanaian, Manero, Nguyen and Grafton2025). In 2022, over 2 billion people worldwide still lacked access to safely managed drinking water (Rajapakse et al., Reference Rajapakse, Otoo and Danso2023; UN, 2023). Among the 38 Organization for Economic Co-operation and Development (OECD) countries, ~8% of the population, or more than around 100 million people, lacked access to safely managed drinking water; Mexico had the highest proportion at 57% (UNWater, 2022). The extant literature for OECD countries reveals persistent water quality issues and profound disparities in access to good-quality drinking water (Meehan, Jepson, et al., Reference Meehan, Jepson, Harris, Wutich, Beresford, Fencl, London, Pierce, Radonic, Wells, Wilson, Adams, Arsenault, Brewis, Harrington, Lambrinidou, McGregor, Patrick, Pauli, Pearson, Shah, Splichalova, Workman and Young2020; Rachel, Reference Rachel2021; Balasooriya et al., Reference Balasooriya, Rajapakse and Gallage2023; Brown et al., Reference Brown, Acey, Anthonj, Barrington, Beal, Capone, Cumming, Pullen Fedinick, MacDonald Gibson, Hicks, Kozubik, Lakatosova, Linden, Love, Mattos, Murphy and Winkler2023).
Indigenous and rural populations, including within high-income countries (Allaire et al., Reference Allaire, Wu and Lall2018; Meehan, Jepson, et al., Reference Meehan, Jepson, Harris, Wutich, Beresford, Fencl, London, Pierce, Radonic, Wells, Wilson, Adams, Arsenault, Brewis, Harrington, Lambrinidou, McGregor, Patrick, Pauli, Pearson, Shah, Splichalova, Workman and Young2020; Balasooriya et al., Reference Balasooriya, Rajapakse and Gallage2023; Sinha et al., Reference Sinha, Glynn, Gardoni, Tang, Sebens, Dyckman, Helgeson, Berk, Thompson, Williams, Graf, Vallabhaneni, Malkawi, Baumann, Dermody, Wiersema, Sinclair, Hyer, Johnson and Eggers2025), and marginalised groups, such as the homeless and Roma within Europe, are disproportionately affected by a lack of access to good drinking water. These groups share several structural characteristics: they are often positioned at the periphery of formal service systems, have limited political representation and experience regulatory neglect or fragmented governance arrangements. Water justice scholars show that unequal water access and governance reflect power asymmetries embedded in institutional design that disadvantage certain populations (Fanaian et al., Reference Fanaian, Manero, Nguyen and Grafton2025). However, community disadvantage does not manifest uniformly (Arvin et al., Reference Arvin, Jalaei, Taheri, Badakhshan, Ghane and Sharifi2025). The impacts of marginalisation are highly context-specific, shaped by community histories, governance structures, geographic conditions and socio-economic trajectories. Consequently, both the forms of drinking-water insecurity and the pathways for addressing them vary substantially across settings.
Higher deprivation and rurality have been linked to elevated chemical and microbiological contaminant levels and are associated with social and environmental drivers of inequality (Huber et al., Reference Huber, Rickert, Schmoll and Vargha2024; Andries et al., Reference Andries, Garrido and De Stefano2025; Chen et al., Reference Chen Chen, Letellier, Benmarhnia and Delpla2025). In settler-colonial states, such as Australia and Canada, colonial legacies of dispossession, fragmented governance and institutional separation have produced persistent structural vulnerabilities in water security, which continue to shape contemporary policy despite formal commitments to reconciliation and rights recognition. In Australia, a recent national assessment found that 40% of locations that had exceeded health-based guideline values were remote, Indigenous communities, affecting tens of thousands of people (Wyrwoll et al., Reference Wyrwoll, Manero, Taylor, Rose and Grafton2022; Manero et al., Reference Manero, Adamowicz, Akter, Spencer-Cotton, Coombes, Wyrwoll, Horne, Lansbury, Creamer, Taylor, Fanaian and Grafton2024). In Canada, many Indigenous communities face chronic water insecurity (De Coste et al., Reference De Coste, Saleem, Mian, Chhipi-Shrestha, Hewage, Mohseni and Sadiq2024), with over 30 long-term drinking water advisories reported across 29 communities as of 2024 (Indigenous Services Canada, 2024c).
The intersection between water, poverty and health outcomes highlights the broader social determinants of water inequality (Hall et al., Reference Hall, Creamer, Anders, Slatyer and Hill2020; Sheel et al., Reference Sheel, Kotwal, Dumka, Sharma, Kumar and Tyagi2024; Sinha et al., Reference Sinha, Glynn, Gardoni, Tang, Sebens, Dyckman, Helgeson, Berk, Thompson, Williams, Graf, Vallabhaneni, Malkawi, Baumann, Dermody, Wiersema, Sinclair, Hyer, Johnson and Eggers2025). Limited or unreliable access to safe drinking water imposes multiple burdens on communities, including mental stress, health risks and financial strain. Unsafe water may force households to purchase alternatives, such as bottled water, and reduce the net income of those affected (Liu and Klaiber, Reference Liu and Klaiber2023). Structural barriers, including remoteness, underinvestment in local water systems and limited support for community-led governance, exacerbate inequities across households (Brown et al., Reference Brown, Acey, Anthonj, Barrington, Beal, Capone, Cumming, Pullen Fedinick, MacDonald Gibson, Hicks, Kozubik, Lakatosova, Linden, Love, Mattos, Murphy and Winkler2023; Sinha et al., Reference Sinha, Glynn, Gardoni, Tang, Sebens, Dyckman, Helgeson, Berk, Thompson, Williams, Graf, Vallabhaneni, Malkawi, Baumann, Dermody, Wiersema, Sinclair, Hyer, Johnson and Eggers2025).
National-level water quality data vary substantially across OECD countries. In Aotearoa New Zealand, data are reported by water systems for locations serving more than 100 people, focusing on compliance with the Health Act and national standards for bacterial, protozoal and chemical parameters. Nevertheless, detailed measurements or deviations from standards are not available (Taumata Arowai, 2024). Canada reports advisory notices and compliance status, but with limited detailed measurements (Indigenous Services Canada, 2024c). In the United States, data are reported at the level of individual water systems, including violations, selected contaminant levels (e.g., lead, arsenic and nitrate), duration of non-compliance, enforcement actions and system characteristics, but not by geographic location (EPA, 2025b). Australia publishes data by water providers but lacks a national standard for reporting across states, and persistent data gaps remain, especially for small communities. Consequently, both cross-country and within-country comparisons remain a challenge (Wyrwoll et al., Reference Wyrwoll, Manero, Taylor, Rose and Grafton2022).
Due to the lack of systematic and standardised data, much of the existing literature on water quality disparities relies on qualitative evidence (e.g., case studies and interviews) and descriptive quantitative reports (Balasooriya et al., Reference Balasooriya, Rajapakse and Gallage2023; De Coste et al., Reference De Coste, Saleem, Mian, Chhipi-Shrestha, Hewage, Mohseni and Sadiq2024; Levin et al., Reference Levin, Villanueva, Beene, Cradock, Donat-Vargas, Lewis, Martinez-Morata, Minovi, Nigra, Olson, Schaider, Ward and Deziel2024). While such approaches provide valuable insights into lived experiences and local contexts, they are limited in their ability to capture broader trends or for quantitative comparison across communities. That is, the scale and burden of inequities in drinking water access and quality, particularly among Indigenous, remote and small communities, remain insufficiently understood.
We respond to data and information gaps in four keyways. First, we construct a community-level meta-panel dataset that brings together five jurisdictions across Australia and Canada. The Australian data is from the Northern Territory, South Australia, Victoria and Western Australia and comprises 680 communities with fewer than 10,000 residents. The Canadian data are from 159 communities in Ontario. Second, we merge the datasets with socio-economic and demographic data from both countries to analyse possible factors that may explain disparities in water quality and access across communities. Third, we apply logistic regression to estimate the probability that communities in Australia and Canada have access to good-quality drinking water and to assess the factors that influence such access. Fourth, we supplement these analyses with an Indigenous water quality data and policy gap overview of OECD countries.
Our study responds to two questions: First, what is the quantitative impact of Indigenous status, geographic remoteness, population size and socio-economic condition on the likelihood that communities have access to good-quality drinking water in selected jurisdictions in Australia and Canada? Second, what are the Indigenous data and policy gaps in OECD countries in relation to drinking water quality? By combining novel datasets, rigorous statistical analyses and a detailed review of results and data gaps, we provide empirical evidence of the structural and socio-economic determinants of water quality disparities across small communities in Australia and Canada.
Methods
Logistic regression model specification
Our study investigates the probability that small communities in Australia and Canada had access to good-quality drinking water during the 5-year period from July 2018 to June 2022. The explanatory variables are Indigenous status, remoteness, population size and socio-economic condition, and the dependent variable is whether drinking water quality is compliant (good) or non-compliant (not good) with the relevant drinking water standards.
We estimated a logistic regression model, a widely used method for estimating probabilities when the dependent variable is binary. The estimates are expressed in terms of the log-odds (logit) of the probability that a community $ i $
in year
$ i $
in year $ t $
has good-quality drinking water, as shown in Equation (1):
$ t $
has good-quality drinking water, as shown in Equation (1):
 $$ {\displaystyle \begin{array}{l}\mathrm{Logit}\left(P\left({Y}_{it}=1\right)\right)=\ln \left(\frac{P\left({Y}_{it}=1\right)}{\Big(1-P\left({Y}_{it}=1\right)}\right)={\beta}_0\\ {}\hskip8.7em +{\beta}_1{Indigenous}_i+{\beta}_2{Remoteness}_i\\ {}\hskip8.7em +\hskip2px {\beta}_3{Population}_{it}+{\beta}_4{SEC}_i+{\delta}_t\end{array}} $$
where $ i $
represents communities in Australia and Canada;
$ i $
represents communities in Australia and Canada; $ t $
is year;
$ t $
is year; $ {\beta}_0 $
,
$ {\beta}_0 $
, $ {\beta}_1, $ $ {\beta}_2 $
,
$ {\beta}_2 $
, $ {\beta}_3 $
and
$ {\beta}_3 $
and $ {\beta}_4 $
are the coefficients to be estimated; and
$ {\beta}_4 $
are the coefficients to be estimated; and $ {\delta}_t $
is the vector of year-specific dummy variables.
$ {\delta}_t $
is the vector of year-specific dummy variables.
The predicted probability can be derived by transforming Equation (1) into the event probability, as shown in Equation (2):
 $$ P\left({Y}_{it}=1\right)=\frac{1}{1+{e}^{-{X}_i\beta }} $$
where $ {X}_i\beta $
represents the linear combination of covariates and their respective coefficients, including year dummies to account for potential time effects.
$ {X}_i\beta $
represents the linear combination of covariates and their respective coefficients, including year dummies to account for potential time effects. $ {Y}_{it} $
is the outcome variable representing good-quality drinking water, taking the value 1 if a community
$ {Y}_{it} $
is the outcome variable representing good-quality drinking water, taking the value 1 if a community $ i $
in year
$ i $
in year $ t $
has good drinking water quality and 0 otherwise. In our study, the dependent variable captures compliance with Australian Drinking Water Guidelines (ADWG) values for health parameters and for nine key aesthetic parameters: true colour, turbidity, hardness, Total Dissolved Solids, pH, sodium, iron, manganese and chloride in Australia and the absence of boil water advisories (BWAs) in Canada.
$ t $
has good drinking water quality and 0 otherwise. In our study, the dependent variable captures compliance with Australian Drinking Water Guidelines (ADWG) values for health parameters and for nine key aesthetic parameters: true colour, turbidity, hardness, Total Dissolved Solids, pH, sodium, iron, manganese and chloride in Australia and the absence of boil water advisories (BWAs) in Canada.
The explanatory variables capture key socio-economic and geographical factors that may influence drinking water quality. A description of these variables is given below. $ {Indigenous}_i $
represents the Indigenous status of the community
$ {Indigenous}_i $
represents the Indigenous status of the community $ i $
. This variable takes the value 1 if the community is Indigenous and 0 otherwise. In Australia, for the purposes of this study, communities in which more than 50% of the population identifies as Indigenous are classified as Indigenous. In Ontario, communities are classified as Indigenous or non-Indigenous by Statistics Canada.
$ i $
. This variable takes the value 1 if the community is Indigenous and 0 otherwise. In Australia, for the purposes of this study, communities in which more than 50% of the population identifies as Indigenous are classified as Indigenous. In Ontario, communities are classified as Indigenous or non-Indigenous by Statistics Canada. $ {Remoteness}_i $
is a categorical explanatory variable indicating the distance from the community
$ {Remoteness}_i $
is a categorical explanatory variable indicating the distance from the community $ i $
to the nearest medium or large population centre or capital city. It takes three values: regional (<200 km), remote (≥200–500 km) or very remote (≥500 km), depending on the distance. Remoteness is included in the regression model because it captures more than geographic distance; it measures structural accessibility to the systems that deliver and regulate drinking water. Communities that are more remote face higher infrastructure costs, weaker oversight and reduced service capacity, which systematically increase water quality risks. This allows us to test whether spatial isolation interacts with Indigenous status to shape drinking-water inequities.
$ i $
to the nearest medium or large population centre or capital city. It takes three values: regional (<200 km), remote (≥200–500 km) or very remote (≥500 km), depending on the distance. Remoteness is included in the regression model because it captures more than geographic distance; it measures structural accessibility to the systems that deliver and regulate drinking water. Communities that are more remote face higher infrastructure costs, weaker oversight and reduced service capacity, which systematically increase water quality risks. This allows us to test whether spatial isolation interacts with Indigenous status to shape drinking-water inequities. $ {Population}_{it} $
is a categorical explanatory variable representing the population size of the community
$ {Population}_{it} $
is a categorical explanatory variable representing the population size of the community $ i $
in the year
$ i $
in the year $ t $
. It takes four values: very small (<200 people), small (≥200–1,000 people), medium (≥1,000–5,000 people) or large (≥5,000 people), depending on the community’s population.
$ t $
. It takes four values: very small (<200 people), small (≥200–1,000 people), medium (≥1,000–5,000 people) or large (≥5,000 people), depending on the community’s population. $ {SEC}_i $
is a categorical explanatory variable indicating the socio-economic condition of the community
$ {SEC}_i $
is a categorical explanatory variable indicating the socio-economic condition of the community $ i $
. It takes values from 1 to 5, where 1 represents the most disadvantaged and 5 the least disadvantaged. In Australia, it is measured by the quintiles of the Index of Relative Socio-economic Advantage and Disadvantage (IRSAD) and in Canada by the Economic Dependency dimension of the Canadian Index of Multiple Deprivation (CIMD).
$ i $
. It takes values from 1 to 5, where 1 represents the most disadvantaged and 5 the least disadvantaged. In Australia, it is measured by the quintiles of the Index of Relative Socio-economic Advantage and Disadvantage (IRSAD) and in Canada by the Economic Dependency dimension of the Canadian Index of Multiple Deprivation (CIMD).
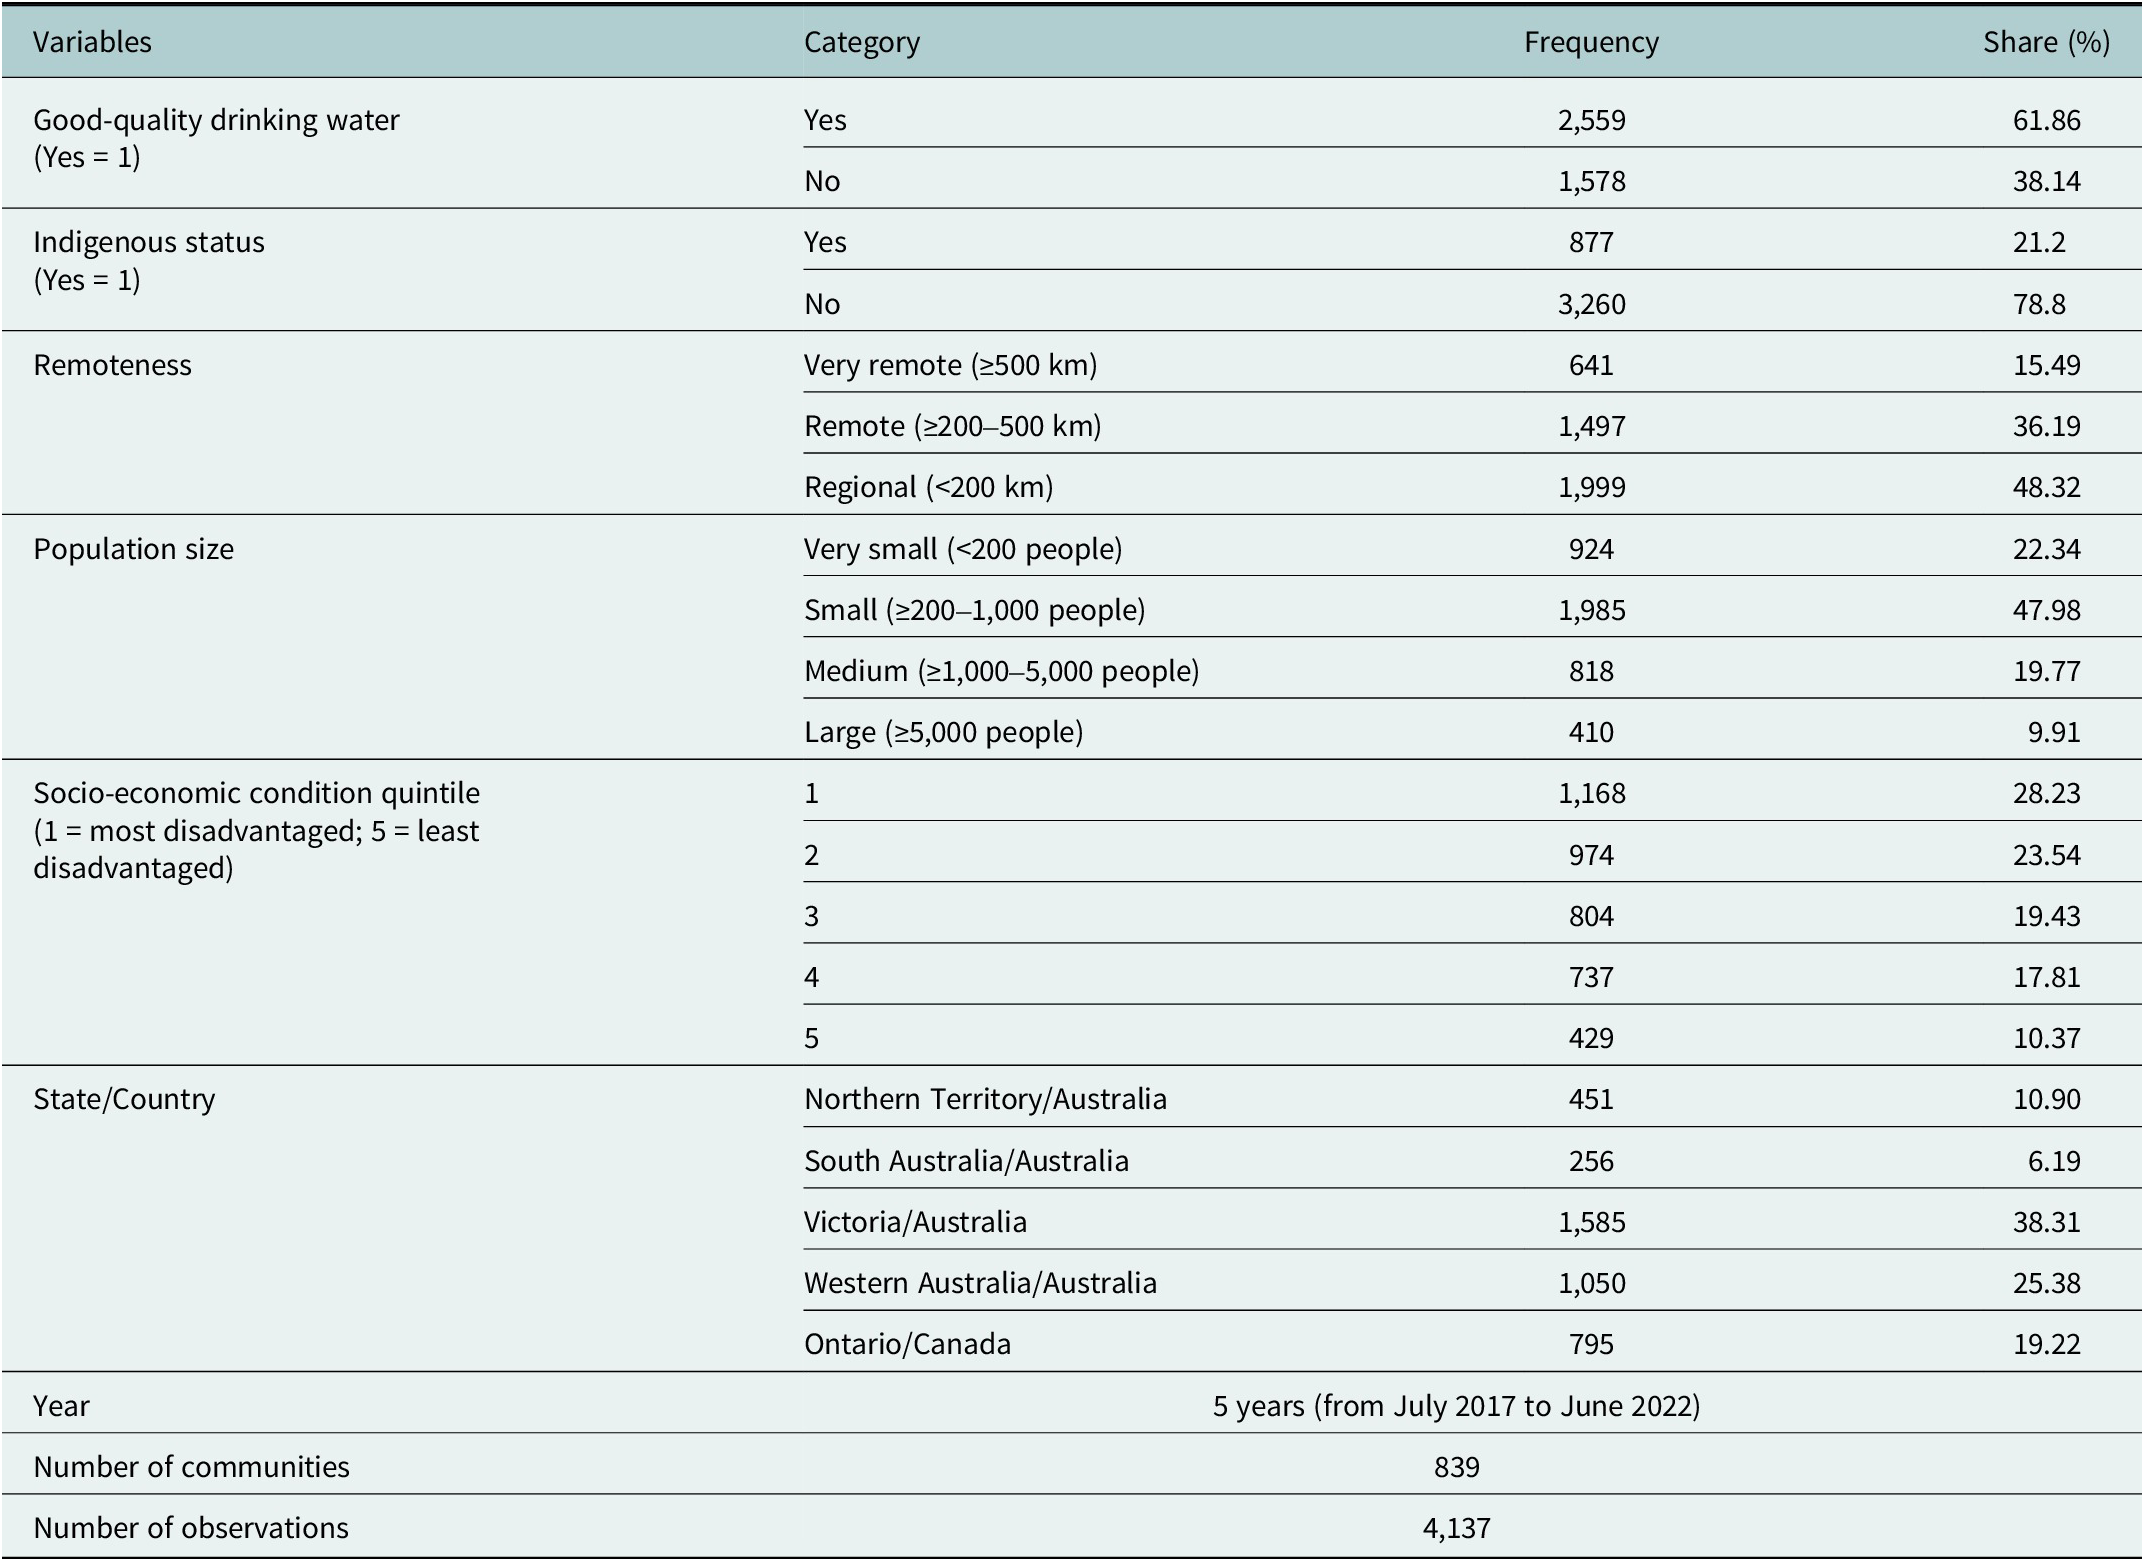
Table 1 provides a description of all the variables. Our analyses use a community-level meta-panel dataset that we compiled from public sources that comprises 4,137 observations from 839 communities: 680 communities in Australia (91 in the Northern Territory, 52 in South Australia, 327 in Victoria and 210 in Western Australia) and 159 communities in Ontario, Canada.
Description of Australian and Canadian community-level variables

Estimation and robustness tests
We tested for multicollinearity among explanatory variables. All Cramer’s V values were below 0.50, with the highest value (0.41) observed between remoteness and Indigenous status. This indicates moderate associations at most, with no evidence of problematic collinearity. We controlled for time-varying factors, which are ‘year fixed effects’, such as policy changes in water governance, economic conditions and climate variability. We did not include state fixed effects because all control variables are categorical and exhibit greater variation between states than within them. That is, including state fixed effects could absorb much of this variation, leading to multicollinearity in the state fixed effect models, degrading the quality of the statistical estimates and limiting our ability to identify their effects. Instead, we addressed potential spatial dependence by clustering standard errors at both the community and year levels, ensuring robust inference.
For robustness checks, we estimated five additional models. Model (1) is the baseline model from Equation (1). Model (2) includes an interaction term between Indigenous status and remoteness to explicitly test whether the effect of remoteness differs between Indigenous and non-Indigenous communities. Models (3)–(5) re-estimate the baseline model using different subsets of the data, pairing each of three Australian states with Ontario, Canada (Northern Territory–Ontario; South Australia–Ontario; Western Australia–Ontario). We did not include Victoria-Ontario because in our data, Victoria does not have any communities with more than 50% Indigenous residents.
To assess model performance, we report a combination of goodness-of-fit, explanatory power and predictive accuracy measures commonly applied in logistic regression analysis. Specifically, we use the Akaike Information Criterion (AIC) and the Bayesian Information Criterion (BIC) to evaluate overall model fit, McFadden’s R 2 to assess explanatory strength and both the area under the receiver operating characteristic curve (AUC) and the Brier Score to evaluate predictive accuracy. Further, we tested statistical differences in the frequency of drinking water noncompliance across the four community characteristics to identify the groups most affected in accessing good-quality drinking water.
Data
We constructed a community-level meta-panel dataset using information from multiple sources in Australia and Canada on drinking water quality over 5 financial years, from July 2017 to June 2022 (FY2018-FY2022).
In Australia, drinking water quality was measured using publicly reported data extracted from the annual water quality reports of Power and Water Corporation (Northern Territory) (PowerWater, 2024), SA Water (South Australia) (SAWater, 2023), Water Corporation (Western Australia) (Water Corporation, 2023) and multiple water service providers in Victoria.Footnote 1 The datasets encompass health-based and aesthetic measures, as well as compliance reviews undertaken by service providers. Noting that South Australia only reports water quality at the system level, with multiple communities sharing identical values, we excluded these communities to avoid violating the assumption of independent observations and inflating the sample size.
Australian Indigenous status was defined by communities in which 50% or more of the population identified as Indigenous, based on the 2016 and 2021 Australian Bureau of Statistics (ABS) Census. Distances were calculated by the authors from each community to the nearest capital city (Darwin, Adelaide, Perth or Melbourne) using geographic coordinates (latitude and longitude). Socio-economic status was derived from the 2016 and 2021 ABS Census using the IRSAD.
In Canada, drinking water quality comes from BWAs for both Indigenous (Indigenous Services Canada, 2024a, 2024b) and non-Indigenous communities (Government of Canada, 2024b). Population size was obtained from the 2016 and 2021 Statistics Canada Censuses (Statistics Canada, 2016; 2021). Distances were calculated by the authors from each community to the nearest medium or large population centre using geographic coordinates (latitude and longitude). Socio-economic status was measured using the Economic Dependency dimension of the CIMD (Statistics Canada, 2024).
Results
Drinking water quality in Australia and Canada
Good-quality drinking water is defined as being compliant with ADWG values for health parameters and nine key aesthetic parameters in Australia, and the absence of any BWAs in Canada. The ADWG (NHMRC, 2024) provide national standards for monitoring and managing drinking water quality. ADWG has health-based guideline values for microbial, chemical and radiological contaminants associated with short- and long-term health risks, and aesthetic guideline values for characteristics affecting taste, smell, colour and infrastructure. Exceedances with the ADWG are classified as health-based when a test result surpasses a health guideline and acceptability-based when annual averages exceed an aesthetic threshold.
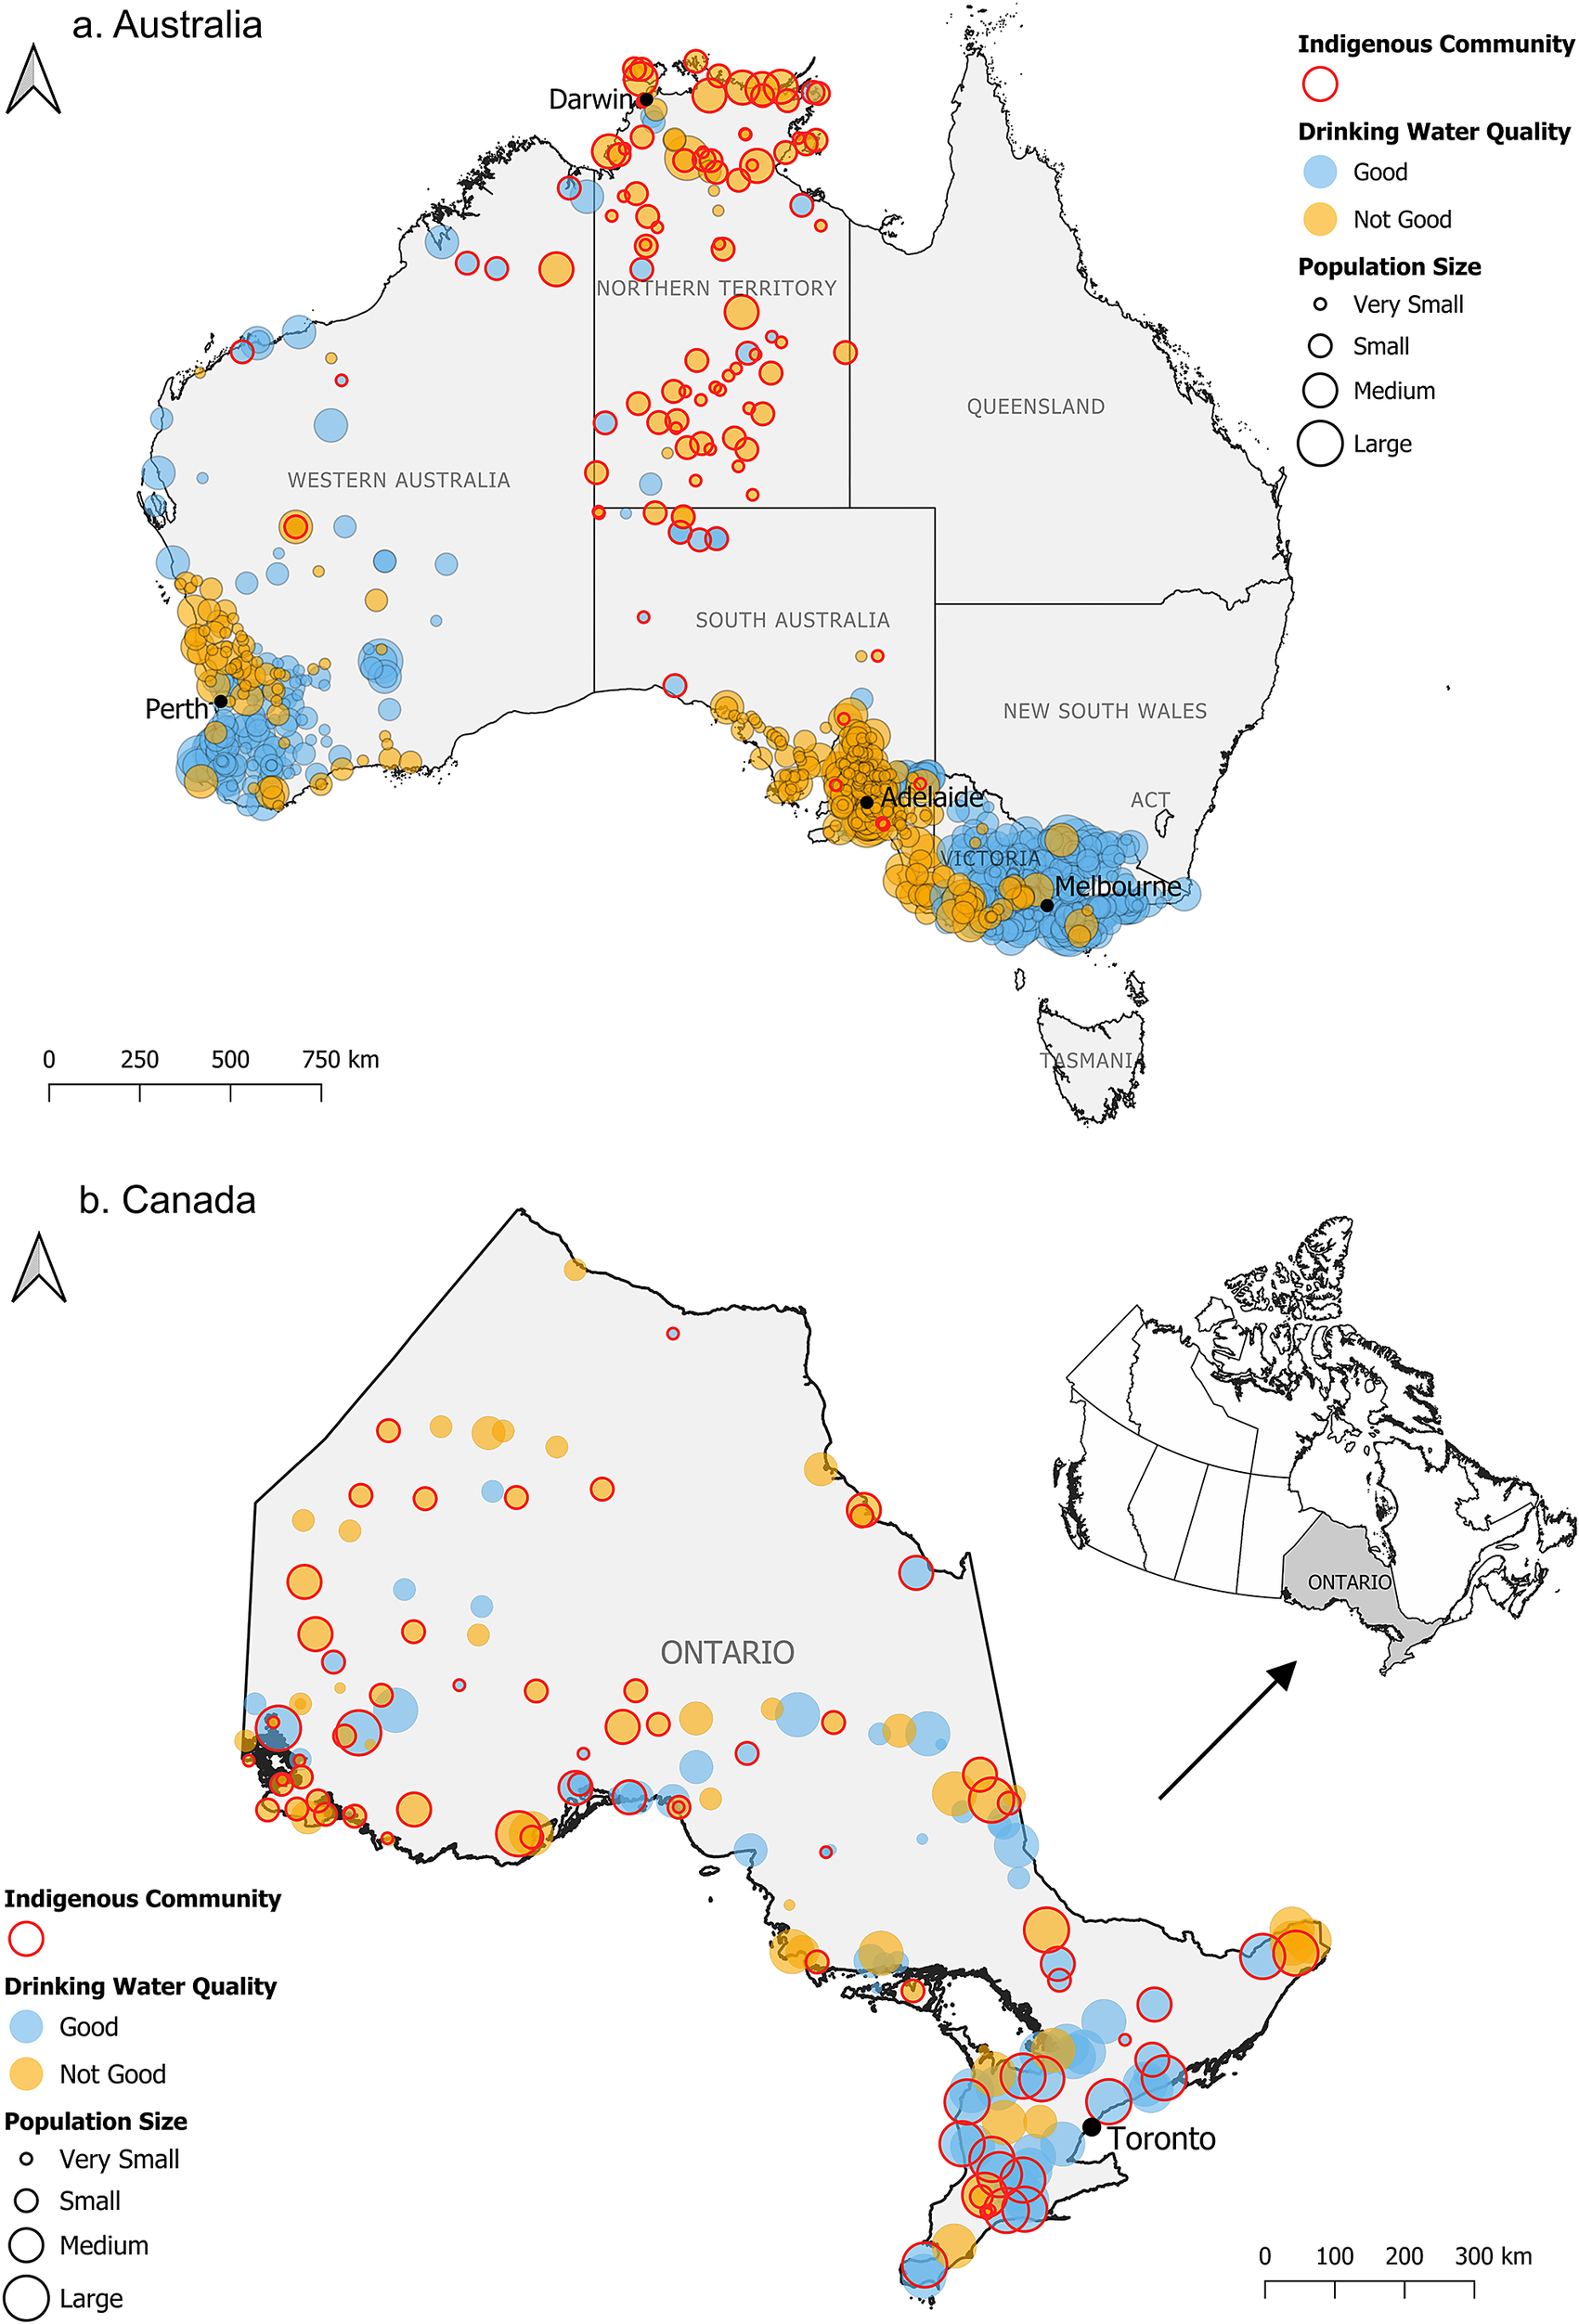
In Australia, community drinking water quality is classified into two categories. Not good-quality drinking water refers to supplies failing at least one health-based guideline or one of nine aesthetic standards (true colour, turbidity, hardness, Total Dissolved Solids, pH, sodium, iron, manganese and chloride) in a year. Good-quality drinking water at a community level is achieved when there is compliance with both sets of guidelines over a 12-month period. Our analyses include only communities of fewer than 10,000 residents located outside major cities and use data from the Northern Territory, South Australia, Victoria and Western Australia (see Figure 1a).
(a), (b) Good-quality drinking water in Indigenous and non-Indigenous communities in Australia and Canada in 2022.

In Canada, good-quality drinking water is defined by a community that does not have any BWAs over a 12-month period. A BWA is issued when water must be boiled for at least 1 min before drinking or other domestic uses, typically due to insufficient chlorine levels or the presence of disease-causing viruses, bacteria or parasites (Government of Canada, 2024a). Communities experiencing at least one BWA or any unresolved BWA within a given year are classified as having not good-quality drinking water.
Ontario, home to the largest Indigenous population in Canada, has historically recorded the highest incidence of BWAs in Indigenous communities (Statistics Canada, 2022; Indigenous Services Canada, 2023b). Between 2017 and 2022, more than 11% of Indigenous people in Ontario – approximately 42,600 individuals – were affected by BWAs. Figure 1b illustrates community access to good-quality drinking water in Ontario in 2022. Most Indigenous communities with BWAs are concentrated in the northwest of the province, while non-Indigenous communities with advisories are more dispersed across Ontario, spanning communities of diverse population sizes.
Frequency of drinking water noncompliance
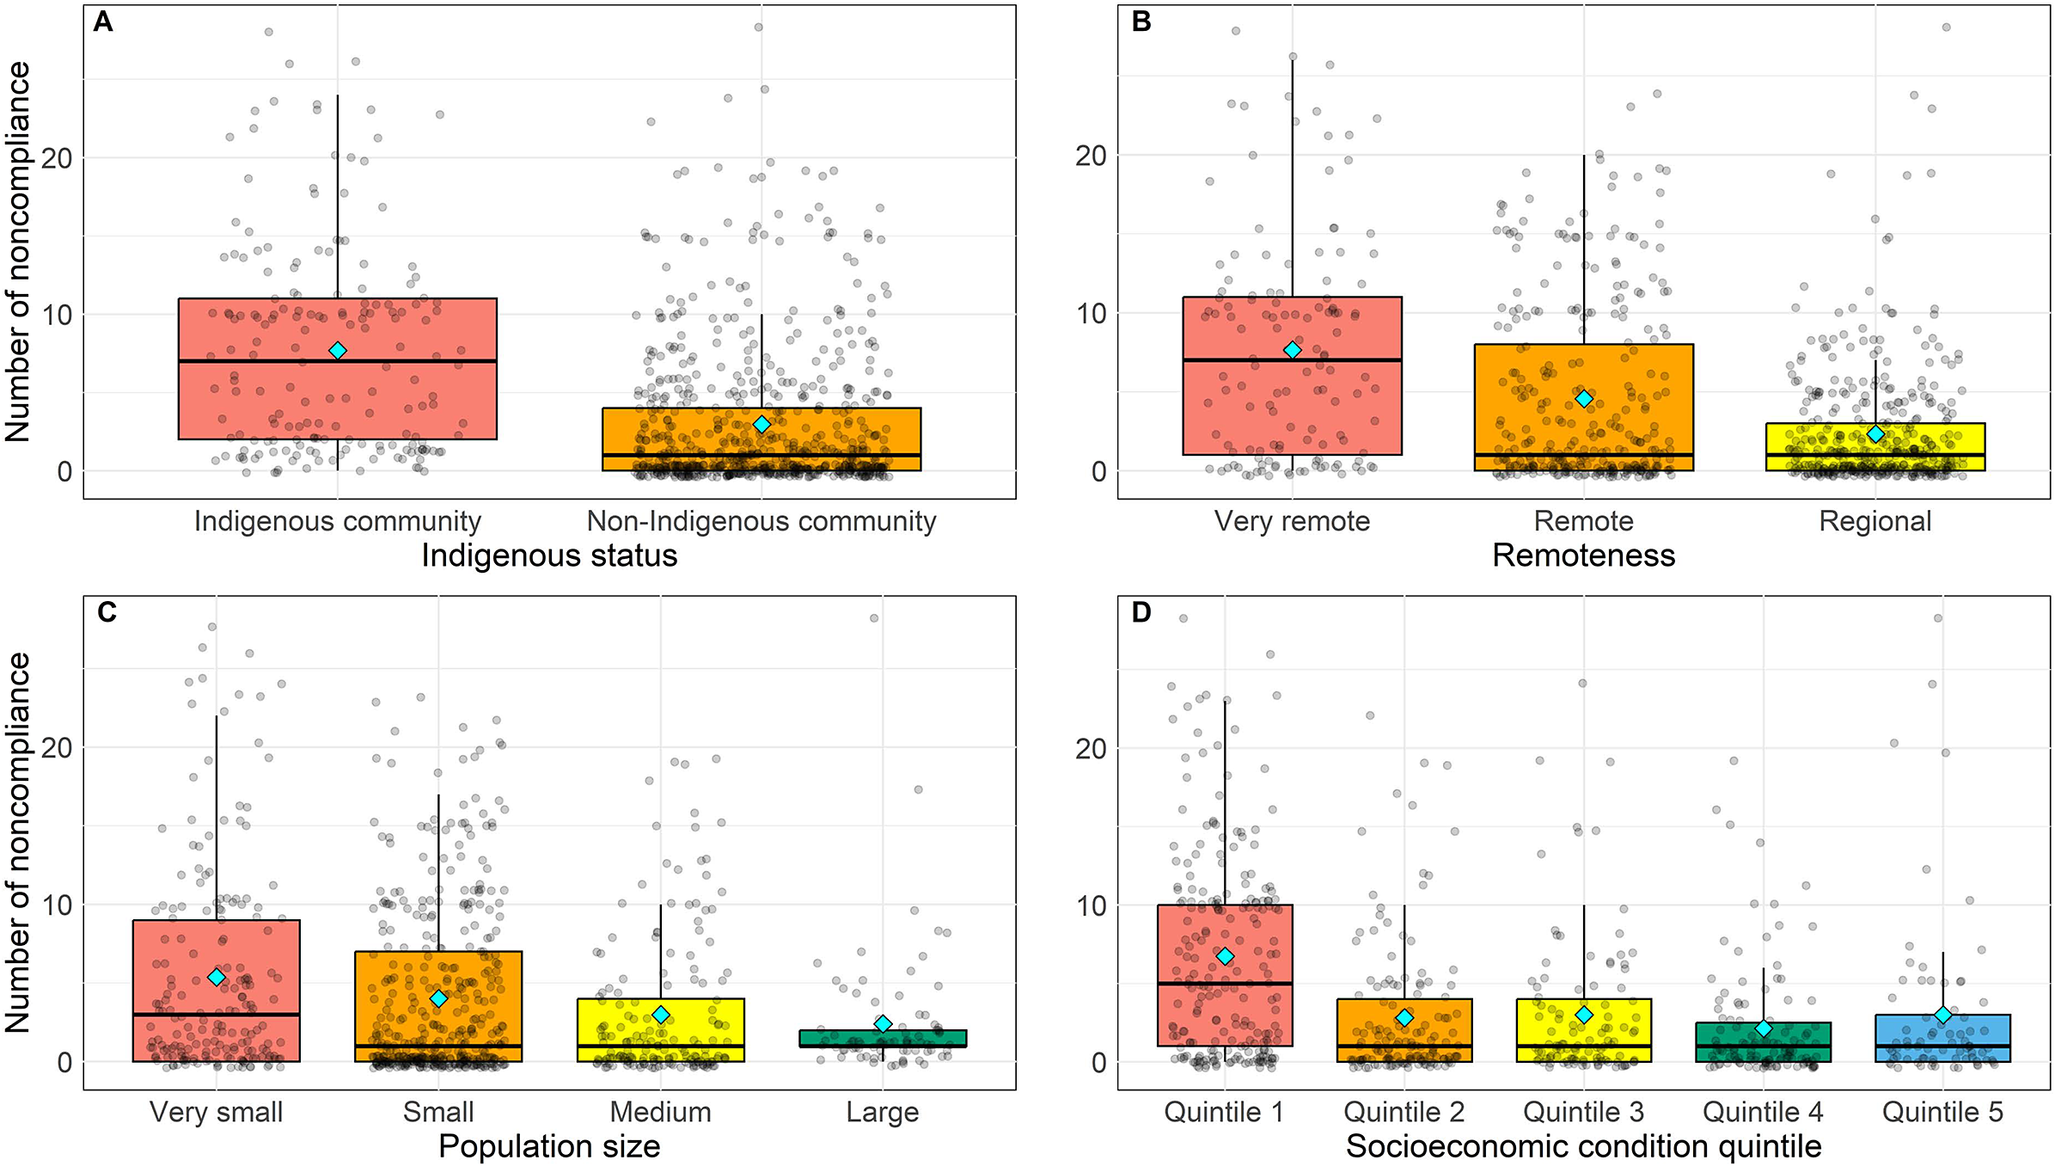
Figure 2 shows the frequency of drinking water non-compliance across the four explanatory variables (Indigenous, remoteness, population size and socio-economic condition) defined at a community level and for each year. We observe that Indigenous communities experienced substantially higher levels of non-compliance than non-Indigenous communities.
Frequencies of non-compliance by different community characteristics.

A gradient is observable across remoteness categories: very remote communities recorded the highest frequency of non-compliance, followed by remote communities, while regional communities had the lowest. Similarly, population size was inversely related to noncompliance. Very small and small communities were most affected, whereas medium and large communities reported substantially fewer exceedances.
Socio-economic condition is strongly associated with drinking water quality outcomes. Communities in the most disadvantaged quintile (Q1) reported the greatest burden of non-compliance, while those in more advantaged quintiles (Q4 and Q5) experienced relatively few exceedances and narrower distributions.
Overall, the results reveal systematic community-level disparities in drinking water quality. Indigenous, very remote, very small and socio-economically disadvantaged communities are disproportionately affected by repeated non-compliance. These differences are statistically significant (p < 0.001) across all four explanatory variables.
Logistic regression analysis on the likelihood of accessing good-quality drinking water
Indigenous status
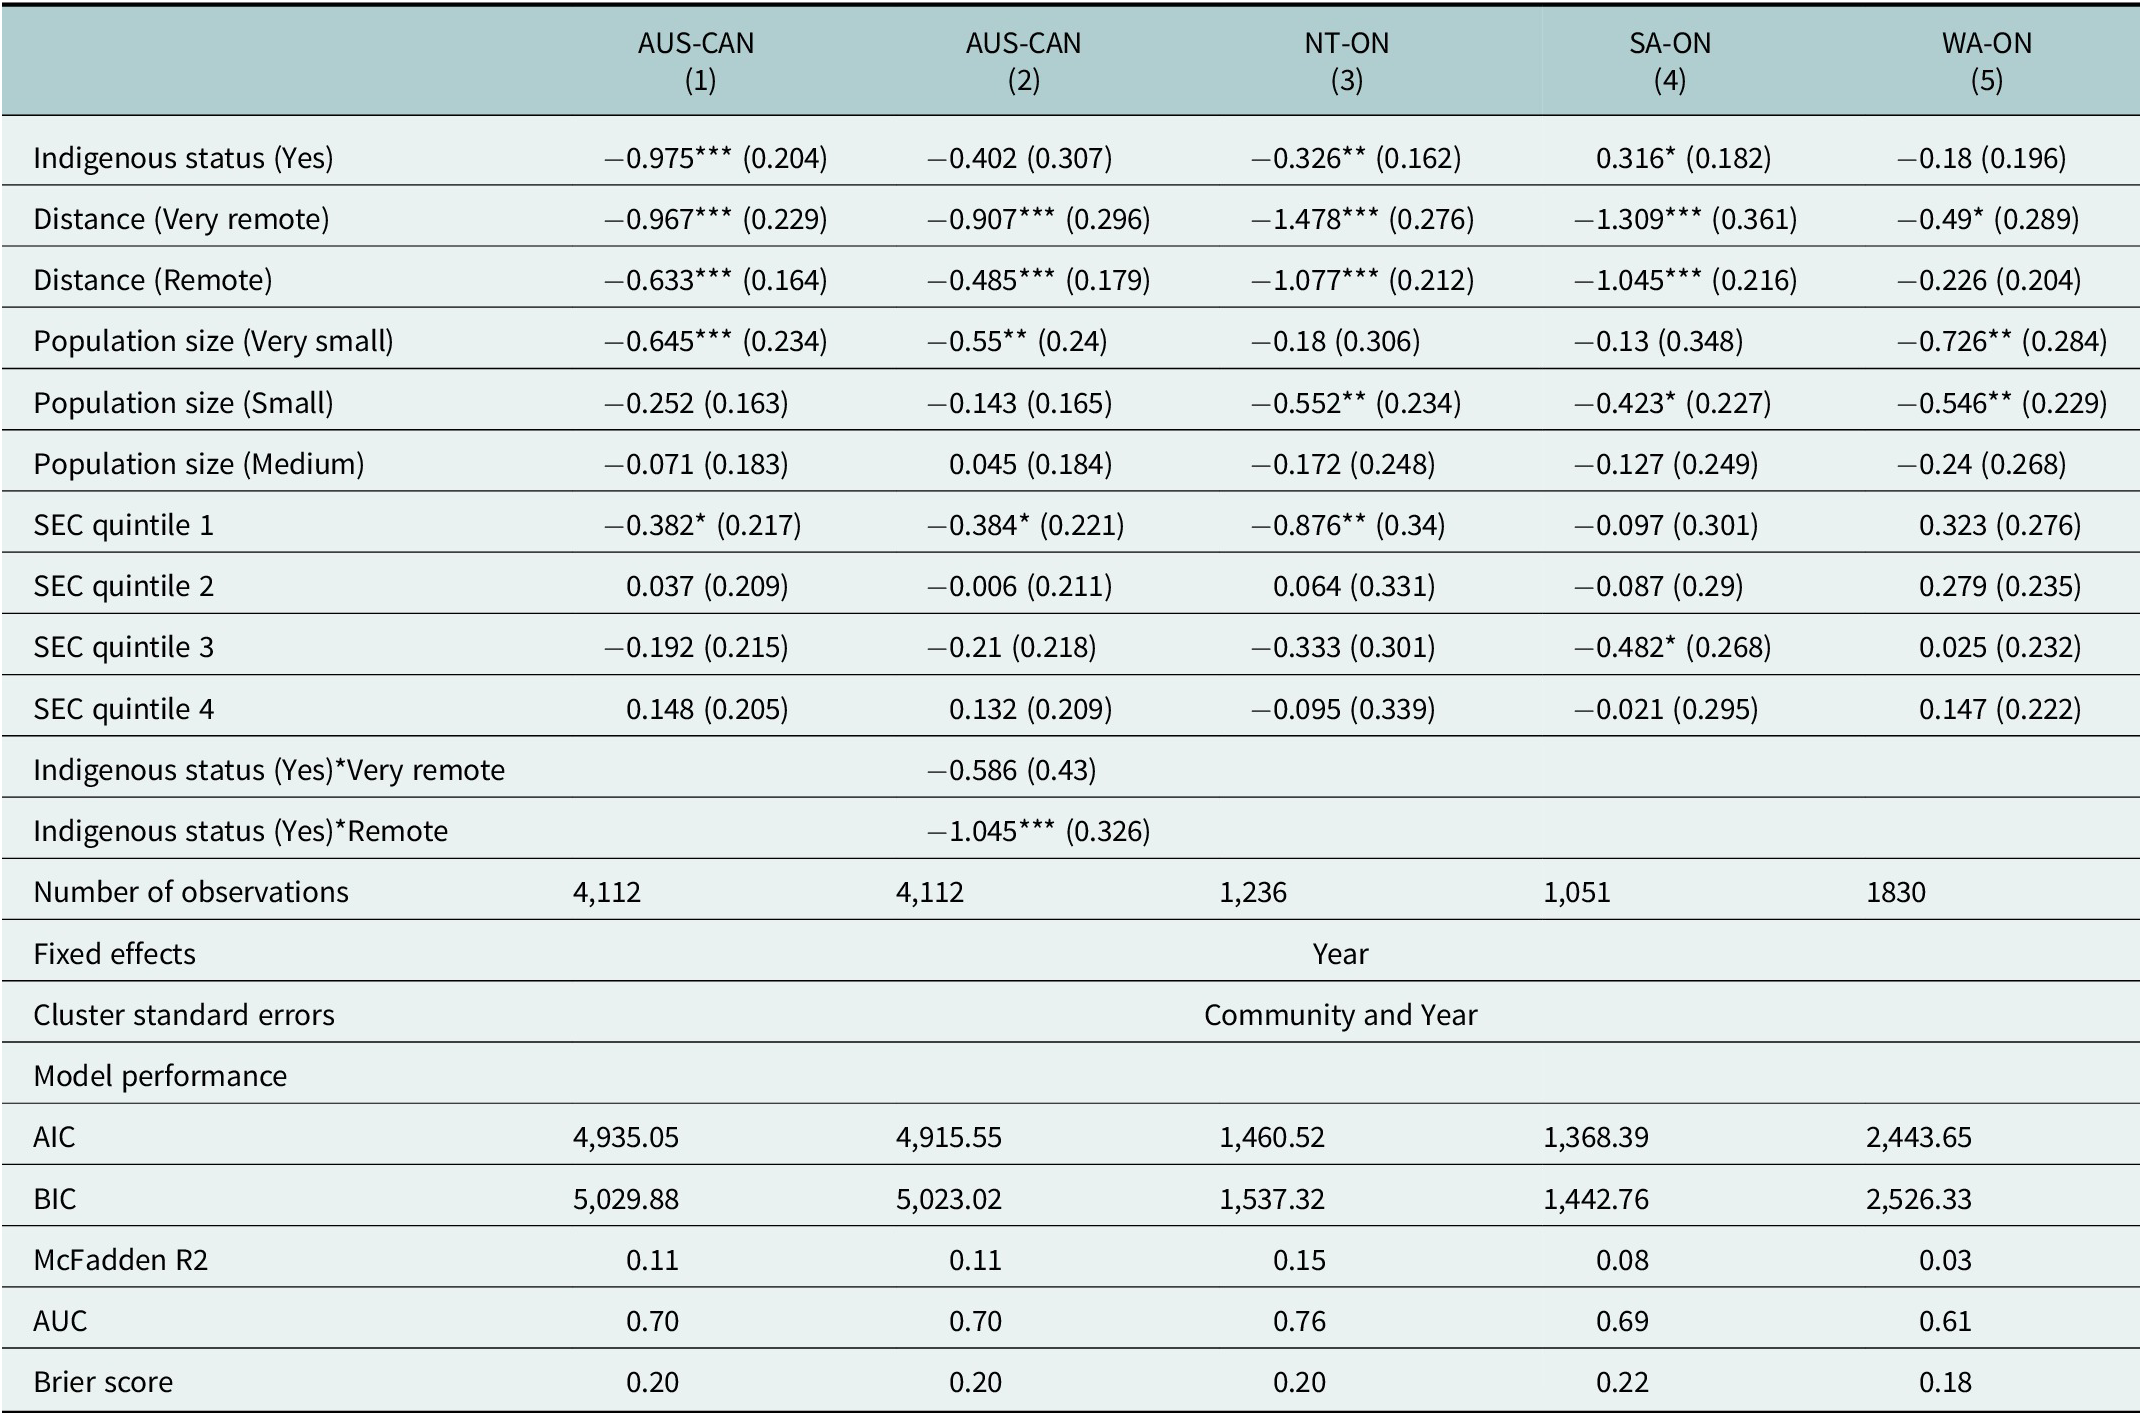
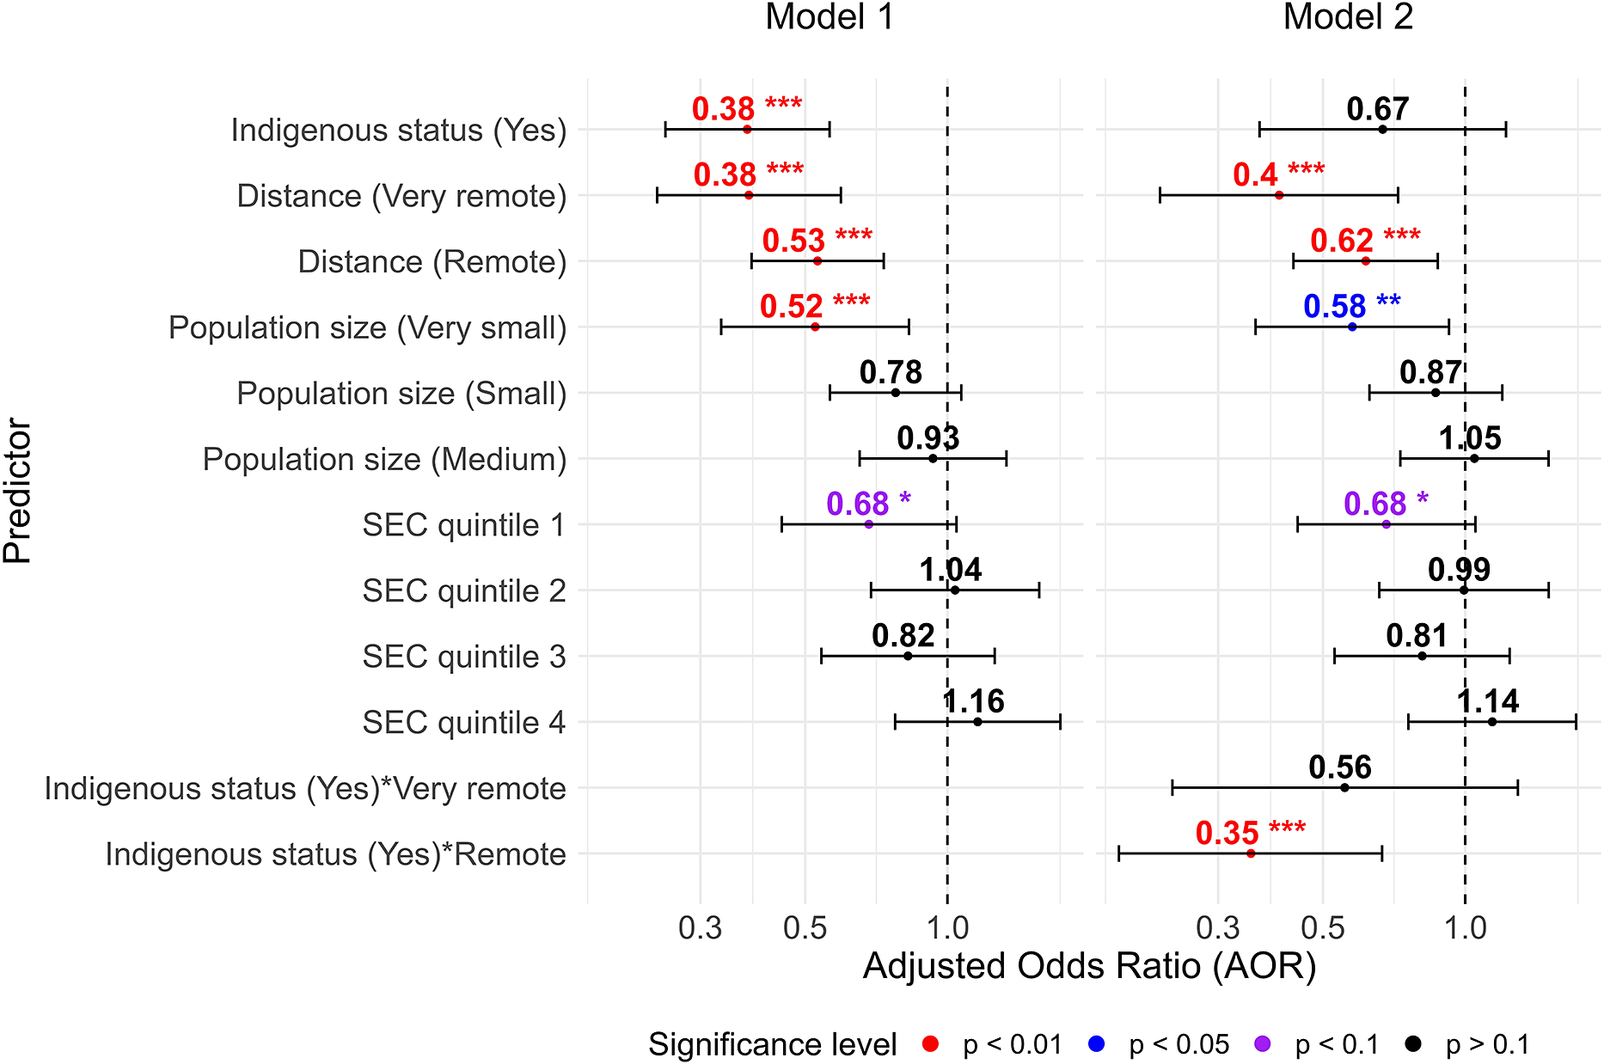
Table 2 reports the logistic regression estimates of the probability that communities in Australia and Canada have access to good-quality drinking water. The logistic regression estimates the effects of a community’s Indigenous status, remoteness by distance, community population size and socio-economic condition quintile on the likelihood of a community having good-quality drinking water. Figure 3 reports the adjusted odds ratio (AOR).
Logistic regression results

Note: Standard errors are in brackets.
Significance levels: *** p < 0.01; ** p < 0.05; * p < 0.1.
Forest plot of adjusted odds ratios.

The results show that Indigenous status is consistently associated with lower probabilities of accessing good-quality drinking water. In the baseline model, the estimated coefficient of −0.975, statistically significant at the 1% level, indicates a substantial disadvantage for Indigenous communities. The AOR of having access to good-quality drinking water of Indigenous communities was only 38% of that of non-Indigenous communities (AOR = 0.38), after controlling for remoteness, population size, socio-economic conditions and year fixed effects.
Our focus is on the baseline model, but we also compared the results across different subsets as a robustness check. In Model (3), Indigenous communities show lower probabilities of accessing good-quality drinking water compared with non-Indigenous communities, and the effect is statistically significant at the 5% level. In Model (5), the coefficient is negative but not statistically significant, which can be explained by the fact that only 3% of communities in Western Australia are identified as Indigenous. In Model (4) (South Australia–Ontario), the coefficient is positive and statistically significant at the 10% level. This is because most Indigenous communities in South Australia are in very remote areas and distance from the nearest medium or large population centre or capital city strongly predicts poorer water quality outcomes, thereby overshadowing the independent effect of Indigenous status. The positive association in Model (4) is possibly a result of both the small sample size (only 256 observations) and possible targeted investment in the limited number of Indigenous communities.
Remoteness
Remoteness exerts a strong and consistent negative effect. Remote communities are significantly less likely to have access to good-quality drinking water, and the disadvantage becomes even more pronounced for very remote communities, which display larger negative coefficients that are statistically significant across models. This pattern highlights the systematic disadvantage faced by remote and very remote communities. In the baseline model, the AOR of having access to good-quality drinking water in very remote communities was only 38% of that of regional communities (AOR = 0.38). For remote communities, the AOR of having access to good-quality drinking water was only 53% of that of regional communities (AOR = 0.53).
Population size
Population size is also associated with water quality outcomes. Very small communities, relative to large communities, are significantly less likely to have access to good-quality drinking water. In the baseline model, the AOR of having access to good-quality drinking water in very small communities was only 52% of that of large communities (AOR = 0.52).
Socio-economic conditions
Socio-economic conditions, measured by quintiles of the socio-economic index, also influence outcomes in the baseline model. Communities in the most disadvantaged quintile (SEC 1) were significantly less likely to have access to good-quality drinking water (p < 0.10). The AOR of having access to good-quality drinking water in the most disadvantaged communities was 68% of that of the least disadvantaged quintile (SEC 5) (AOR = 0.68).
Interaction between Indigenous status and remoteness
In Model (2), which includes interactions between Indigenous status and remoteness, the results indicate a compounded disadvantage for Indigenous communities located 200–500 km from major cities (coefficient = −1.045, p < 0.01). The AOR of having access to good-quality drinking water in these communities was only 35% of that of non-Indigenous communities at the same distance (AOR = 0.35).
While the coefficient for distances >500 km is also negative, it is not statistically significant. These findings indicate the intersectional vulnerability of Indigenous status with remoteness.
Model performance
Model 2 shows a modest improvement over Model 1, with slightly lower AIC and BIC values, indicating better fit, although McFadden’s R 2 (0.11), AUC (0.70) and Brier score (0.20) remain unchanged. This suggests that while the interaction terms (Indigenous status with remoteness) marginally improve the fit, the overall explanatory and predictive power of the two models is similar.
Overall, our results highlight that Indigenous status, remoteness, population size and socio-economic conditions all play important roles in shaping disparities in drinking water access. Notably, communities that are Indigenous, located in very remote areas, have very small populations and fall within the most disadvantaged socio-economic quintile are significantly less likely to have access to good-quality drinking water.
Indigenous data gaps in drinking water quality in OECD countries
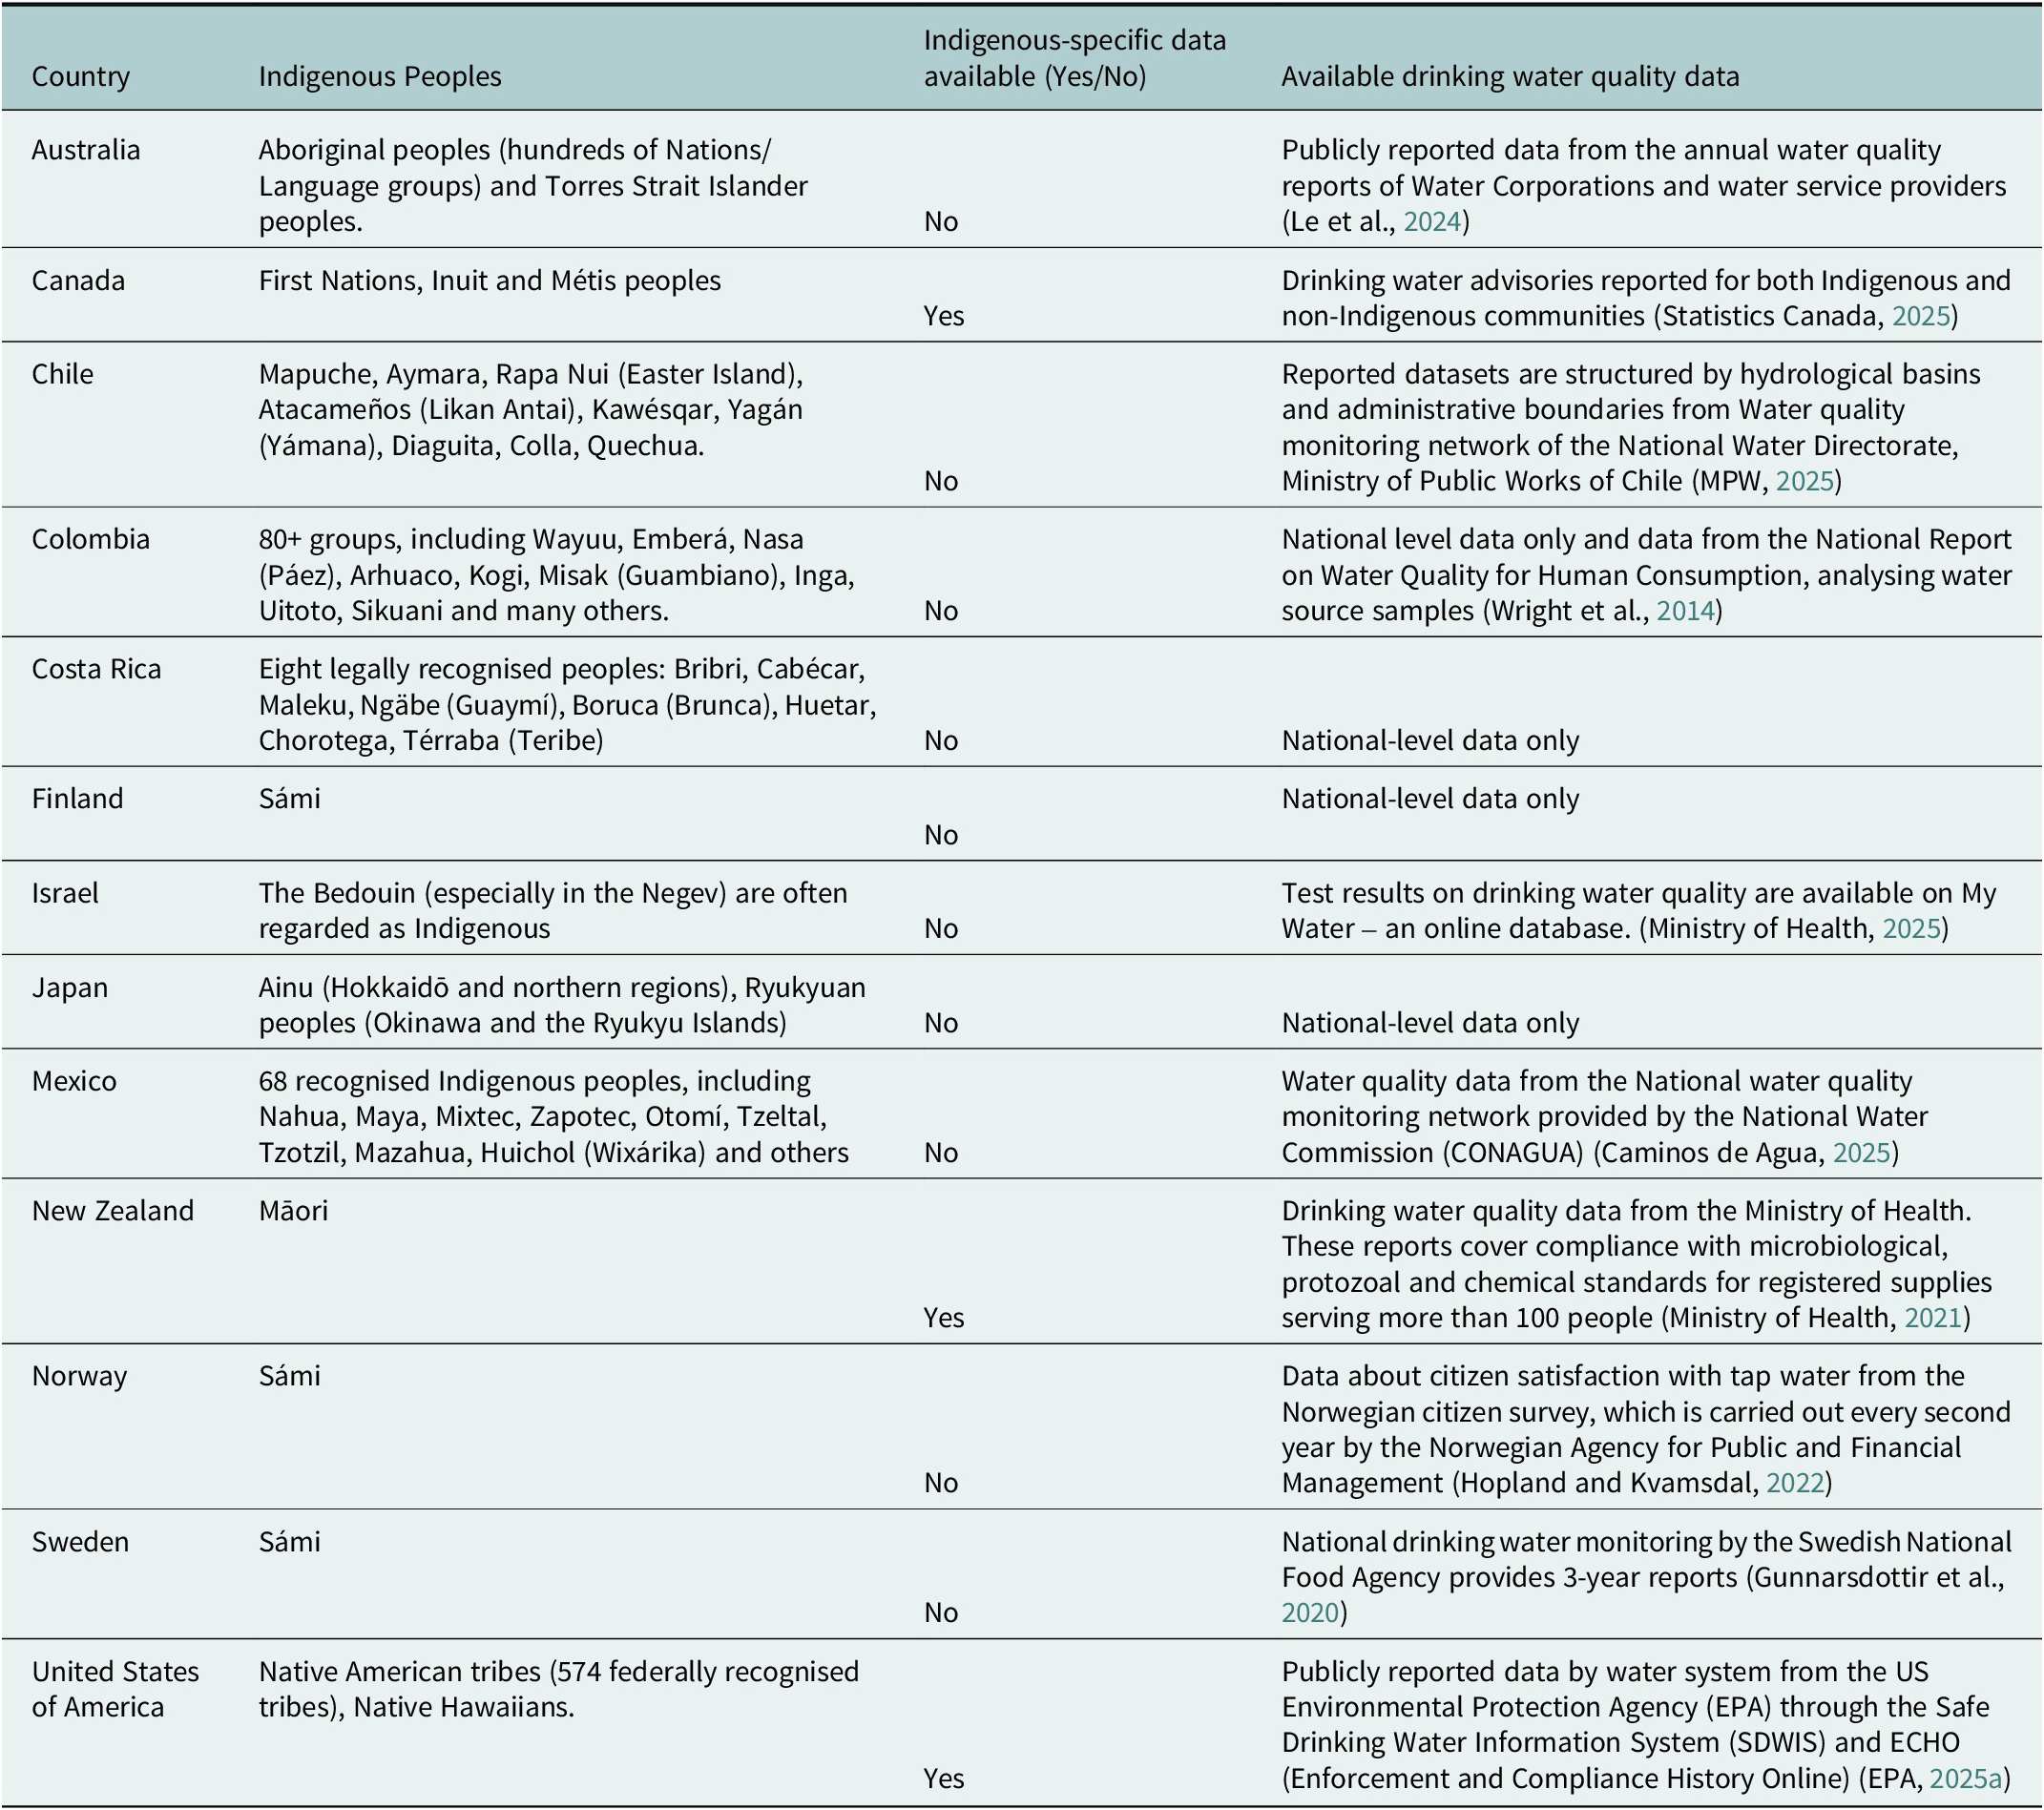
Across OECD countries, drinking water quality monitoring systems are extensive, yet critical gaps remain with respect to Indigenous communities. Table 3 highlights that despite widespread monitoring at national and regional levels, there is a persistent lack of disaggregated data specific to Indigenous populations. This omission is evident in countries with large Indigenous populations (e.g., Australia and Mexico) and in those with smaller but constitutionally or culturally recognised groups (e.g., Norway, Sweden, Finland and Japan).
Indigenous drinking water quality data gaps in OECD countries

Note: ‘Yes’ does not mean that Indigenous-specific data are defined in the same way across countries.
Canada and the United States are the only countries where water quality outcomes are systematically collected at the community level, including Indigenous communities. Reporting relies on BWAs (Canada) or compliance databases (United States). In the United States, the primary source of treated drinking water quality data is the US Environmental Protection Agency (EPA) through the Safe Drinking Water Information System (SDWIS) (EPA, 2025b). The EPA provides reports by water system and information on violations and contaminants for selected parameters (e.g., lead, arsenic and nitrate), duration of violations, enforcement actions and system characteristics. These data are available from 2013 to 2025. Another important EPA data source is Enforcement and Compliance History Online, which provides visual summaries and downloadable datasets on the compliance and violation histories of individual water systems (EPA, 2025a).
In Aotearoa New Zealand, the primary source of drinking water data is the Ministry of Health, which publishes annual reports on drinking water quality. These reports cover compliance with microbiological, protozoal and chemical standards for registered supplies serving more than 100 people (Ministry of Health, 2020). Data are available from 2017 to 2021.
Some jurisdictions in Australia provide community-level drinking water quality data through state and territory water providers, but these datasets are not disaggregated for Aboriginal and Torres Strait Islander peoples. Conversely, other jurisdictions report data based on individual water systems, leading to a lack of national consistency. Elsewhere, reporting frameworks remain predominantly national in scope and are typically available only through general reports. Chile, Mexico, Costa Rica, Finland, Norway, Sweden and Japan maintain extensive monitoring networks, but their datasets are structured by hydrological basins, administrative boundaries or supply zones rather than Indigenous territories or communities. As a result, Indigenous populations such as the Mapuche in Chile, the Sámi in the Nordic countries or the Ainu in Japan remain statistically invisible in official water quality data. In Latin America, countries such as Colombia and Costa Rica face similar issues; national reporting exists, but Indigenous populations are not separately identified.
We find that a key challenge is not so much the absence of water quality monitoring but rather the lack of systematic, disaggregated reporting on Indigenous communities. That is, while national, regional or average indicators are valuable for cross-country comparisons, they do not substitute for community-level monitoring and reporting, nor track progress toward universal access to good drinking water. Without such data, the scale of disparities in drinking water access and safety remains obscured, constraining the design of effective policy interventions. This data gap is a particular concern given the persistent water quality challenges faced by Indigenous communities in remote, rural or socio-economically disadvantaged contexts, as we quantified for Australia and Canada.
Discussion
Our findings complement existing studies on disparities in water quality and access that have primarily been qualitative and/or case-based studies based on descriptive statistics (Hall, Reference Hall2019; Hall et al., Reference Hall, Creamer, Anders, Slatyer and Hill2020; Hall et al., Reference Hall, Abeysuriya, Jackson, Agnew, Beal, Barnes, Soeters, Mukheibir, Suzanne and Bradley2022; Rajapakse et al., Reference Rajapakse, Hudson, Brown and Rajapakse2022; Wyrwoll et al., Reference Wyrwoll, Manero, Taylor, Rose and Grafton2022; Balasooriya et al., Reference Balasooriya, Rajapakse and Gallage2023). Existing studies indicate poor drinking water quality across urban, rural and remote geographies (Allaire et al., Reference Allaire, Wu and Lall2018), among racial and ethnic groups (Jaffee, Reference Jaffee2023) and within households that depend on income and housing conditions (Meehan, Jurjevich, et al., Reference Meehan, Jurjevich, Chun and Sherrill2020, Meehan et al., Reference Meehan, Beresford, Amador Cid, Avelar Portillo, Marin, Odetola and Pacheco‐Vega2023), as well as other socio-economic factors (Mueller and Gasteyer, Reference Mueller and Gasteyer2021). Residents of surveyed Indigenous communities and also non-Indigenous communities in small, rural or remote communities are especially affected by community-specific cases of unsafe, unreliable, unaffordable, unpalatable, inadequately tested or otherwise unacceptable and mistrusted drinking water (Hall et al., Reference Hall, Creamer, Anders, Slatyer and Hill2020; Chambers et al., Reference Chambers, Hobbs and Broadbent2023; De Coste et al., Reference De Coste, Saleem, Mian, Chhipi-Shrestha, Hewage, Mohseni and Sadiq2024; Dobbin et al., Reference Dobbin, Hernandez, Bostic, Harrison, Singhal, Barnett, Vasquez‐Rodriguez, Pierce and Sawyer2024).
Our analyses show that the observed gaps in drinking water quality are not only caused by environmental or technical challenges. Rather, water quality gaps are connected to cross-community differences that, in turn, are determined by location, history and socio-economic factors. In part, cross-community drinking water quality differences in Australia and Canada are because of history. Both are settler states with a record of colonial policies that involved the dispossession of Indigenous ancestral territories and their exclusion from decision-making. These actions created structural disadvantages that persist today (Hartwig et al., Reference Hartwig, Jackson, Markham and Osborne2021; Wilson et al., Reference Wilson, Montoya, Arseneault and Curley2021). Australia and Canada are the only settler-colonial federations in which Indigenous drinking-water services are delivered through mainstream public service systems rather than sovereign-based governance, making them institutionally comparable for analysing water justice.
In recent years, global water policies and governance are undergoing a shift away from historical colonial policies towards frameworks that recognise Indigenous sovereignty and self-determination. In Canada, the First Nations Clean Water Act (Bill C-61) (Indigenous Services Canada, 2023a), introduced in late 2023, affirms the inherent right to self-government by transitioning control of water services to Indigenous-led institutions. Similarly, Australia is currently renewing its National Water Agreement (DCCEEW, 2024) (originally from 2004) to formally integrate Aboriginal knowledge into national planning, supported by the National Water Grid Fund (NWG, 2024). This transition is also evident internationally. In the United States, through the ongoing expansion of the Primacy Mechanism under the Safe Drinking Water Act, and in Aotearoa New Zealand, where the Water Services Act 2021 (Department of Internal Affairs, 2021) institutionalised the Te Mana o te Wai concepts and customs. This Māori-led framework seeks to establish a hierarchy of obligations that prioritises the health and well-being of the water itself above human and economic needs, with the intent of legally embedding Indigenous spiritual and cultural values into water management.
While the European Union does not explicitly frame policy around Indigenous sovereignty, its modernised Drinking Water Directive (2020) (EU, 2020) reflects a parallel shift towards inclusive governance. Through Article 16, the EU mandates improved water access for ‘vulnerable and marginalised groups’, requiring member states to identify and support those historically excluded from public services.
These international developments suggest that Indigenous disadvantage in drinking-water outcomes is not inevitable but is strongly shaped by governance design and institutional accountability. However, the emergence of these progressive frameworks does not automatically remediate the legacies of colonial policies and guarantee equitable outcomes. The practical implementation of these policies remains strained by systemic tensions between rights-based aspirations and fragmented governance structures. These efforts are further complicated by inconsistent standards and enforcement, as well as substantial technical and financial barriers.
Shortcomings in governance and regulatory implementation appear to have exacerbated inequities in water service delivery (Meehan, Jepson, et al., Reference Meehan, Jepson, Harris, Wutich, Beresford, Fencl, London, Pierce, Radonic, Wells, Wilson, Adams, Arsenault, Brewis, Harrington, Lambrinidou, McGregor, Patrick, Pauli, Pearson, Shah, Splichalova, Workman and Young2020; Wilson et al., Reference Wilson, Montoya, Arseneault and Curley2021). In part, this is because water services are interconnected across uses, sectors and ecosystems, while water regulation and management are often fragmented. This feature can compromise drinking water quality and equitable access (Grafton, Reference Grafton2024; Grafton et al., Reference Grafton, Fanaian, Horne, Katic, Nguyen, Ringler, Robin, Talbot-Jones, Wheeler, Wyrwoll, Avarado, Biswas, Borgomeo, Brouwer, Coombes, Costanza, Hope, Kompas, Kubiszewski, Manero, Martins, McDonnell, Nikolakis, Rollason, Samnakay, Scanlon, Svensson, Thiam, Tortajada, Wang and Williams2024).
Another challenge is inconsistent enforcement of standards. In the United States, for example, rural municipalities face uneven service provision, with political fragmentation at both local watershed and regional scales (Kim et al., Reference Kim, Keane and Bernard2015). Similarly, in Spain, many small municipalities directly manage urban water services through city councils that may, in turn, contribute to technical and financial deficiencies. Delays in implementing updated water quality legislation, combined with the absence of independent regulatory oversight, appear to have created compliance gaps that leave certain communities without reliable access to safe drinking water (García-Martínez et al., Reference García-Martínez, Osorio and González-Gómez2025). Canada’s fragmented approach to water governance, which includes jurisdictional overlaps, conflicts and legislative gaps, has a greater impact on Indigenous communities because of mixed federal and provincial responsibilities (Bakker et al., Reference Bakker, Simms, Joe, Harris, Boelens, Perreault and Vos2018).
Socio-economic disadvantage reduces the capacity of communities to advocate for infrastructure improvements or to fund necessary upgrades. In Australia and Canada, high infrastructure costs and difficulties in retaining skilled technical staff constrain the effectiveness of drinking water service provision, reinforcing these populations’ vulnerability to poor water quality (Doble et al., Reference Doble, London, Horner, Thiruvenkatachari, Priestley and O’Brien2023; Allaire et al., Reference Allaire, Brusco, Bakchan, Elliott, Jordan, Maxcy-Brown and White2024; De Coste et al., Reference De Coste, Saleem, Mian, Chhipi-Shrestha, Hewage, Mohseni and Sadiq2024). In some countries, subsidies help offset funding shortfalls, but they do not fully compensate for the operational and geographic difficulties of delivering high-quality drinking water to remote communities, especially when subsidies are not always efficient or transparent, as observed in Portugal (Marques et al., Reference Marques, Simões and Marques2024).
Factors contributing to poor drinking water quality at a community level often converge (Brown et al., Reference Brown, Acey, Anthonj, Barrington, Beal, Capone, Cumming, Pullen Fedinick, MacDonald Gibson, Hicks, Kozubik, Lakatosova, Linden, Love, Mattos, Murphy and Winkler2023; Sinha et al., Reference Sinha, Glynn, Gardoni, Tang, Sebens, Dyckman, Helgeson, Berk, Thompson, Williams, Graf, Vallabhaneni, Malkawi, Baumann, Dermody, Wiersema, Sinclair, Hyer, Johnson and Eggers2025). Compounding effects of geography, demography and socio-economic context, as well as historical and ongoing inequities, result in intersectional disadvantage. Such water injustice highlights the critical need for policies that are applied across sectors and jurisdictions and the importance of responding to multidimensional vulnerabilities. That is, policies and actions that focus solely, or even primarily, on technical improvements in water services will fall short for vulnerable and marginalised communities, particularly those in smaller, remote locations.
We find that persistent data gaps are not confined to a single country but reflect broader, transnational challenges, at least within the OECD. While many very high-income countries (e.g., Australia and Canada) are assumed to have universal access to safe drinking water, persistent inequities in access to safe drinking water remain, especially in disadvantaged communities. Our results from Australia and Canada highlight that governments and water authorities, at multiple levels, need to prioritise interventions that target the most disadvantaged. Data gaps at the community level and based on Indigenous status highlight the importance of improved monitoring and accountability, complemented by standardised frameworks for water data collection and reporting, especially in remote and Indigenous communities.
Our study has implications for drinking-water policy and investment strategies in Australia, Canada and other contexts where Indigenous or remote communities experience drinking-water inequality. The results demonstrate that poor drinking-water quality is not randomly distributed, but is systematically associated with structural factors, most notably Indigenous status and remoteness. This indicates that funding allocation and regulatory attention at federal, state/provincial and territorial levels should explicitly prioritise these determinants, rather than relying on uniform or population-based infrastructure approaches alone. In practice, this requires investment frameworks to move beyond a narrow focus on physical infrastructure deficits and to incorporate the higher costs, regulatory challenges and service delivery constraints faced by Indigenous and remote communities. Without such targeting, existing financing mechanisms risk perpetuating spatial and social inequities, even where overall investment levels increase.
More broadly, our results suggest that achieving SDG6 cannot be understood solely as a technical challenge, as persistent water inequities reflect deeper socio-economic and governance structures related to decision-making power, prioritisation and community agency. Accordingly, global and national SDG monitoring frameworks should incorporate distributional and equity-sensitive indicators, particularly for Indigenous and remote populations, to ensure that progress towards ‘safely managed’ drinking water does not mask ongoing structural exclusion. Responding to these concerns is essential if water policies and infrastructure investments are to contribute meaningfully to broader goals of social justice, health equity and sustainable development.
Our study has two key caveats: First, the Australian and Canadian datasets are derived from different regulatory frameworks and are not directly equivalent measures of drinking-water quality. Australian data reflect exceedances of health-based and aesthetic guideline values under the ADWG, based on routine compliance monitoring, whereas Canadian data are based on the issuance of BWAs, which represent risk-based regulatory responses to system failures. We harmonised these indicators to capture relative exposure to unsafe water within each national context, but cross-country comparisons should still be interpreted as differences in regulatory and service performance rather than in contaminant levels. Data quality is further affected by variation in monitoring intensity, reporting frequency and administrative capacity, particularly in small and remote systems, which may lead to under-detection and an underestimate of drinking water quality inequality. Second, while our study focused on Indigenous communities in Canada and Australia, the findings should not be assumed to translate directly to other disadvantaged populations (e.g., urban refugees), where institutional constraints and service delivery challenges differ in fundamental ways. Our results, therefore, speak to a particular configuration of structural disadvantage, rather than to a universal model of water insecurity for all disadvantaged communities.
Conclusion
Our meta-analyses, using data from Australia and Canada, detail persistent inequalities across communities. We find that Indigenous, more remote, smaller-sized communities with poorer socio-economic conditions have a much higher and statistically significant likelihood of not having good drinking water quality. A key implication of our work is that remote and marginalised communities, especially Indigenous Peoples, need to be prioritised if good drinking water for all is to ever be achieved, including within very high-income countries like Australia and Canada.
Achieving safe and equitable drinking water depends on embracing holistic, system-wide approaches that integrate social, environmental and governance dimensions. Responding to the needs and concerns of disadvantaged and vulnerable communities, protecting source waters and fostering inclusive, evidence-based decision-making are all essential. Better data and targeted investments are key to building more equitable and resilient water delivery systems capable of sustainably serving all, in rich and poor countries alike.
Open peer review
To view the open peer review materials for this article, please visit http://doi.org/10.1017/wat.2026.10015.
Data availability statement
The data used in this study are available from the authors upon request.
Acknowledgements
The authors would like to acknowledge Indigenous Australians who have sustainably cared for their own Country since the beginning of time and who have been, and always will be, the Traditional Custodians of Australia’s waters, including its aquifers, streams and rivers. The authors would also like to thank Quoc Anh Ho for his assistance in analysing the data.
Author contribution
Conceptualisation: N-M.N., R.Q.G.; Data Curation: N-M.N., T.H.L.L.; Formal Analysis: N-M.N., T.H.L.L., L.C., R.Q.G.; Funding Acquisition: R.Q.G.; Methodology: N-M.N., T.H.L.L., L.C., R.Q.G.; Supervision: R.Q.G.; Visualisation: N-M.N., T.H.L.L.; Writing – Original Draft: N-M.N., T.H.L.L., L.C., R.Q.G.; Writing – Review and Editing: N-M.N., T.H.L.L., L.C., R.Q.G.
Financial support
This research was undertaken under the auspices of the Water Justice Hub and was funded, in part, by the Australian Research Council grant FL190100164 ‘Water Justice: Indigenous Water valuation and Resilient Decision-making’.
Competing interests
The authors declare none.
Ethics statement
This research did not entail primary data collection and, thus, no ethics protocol was required.

 Open access
Comments
11 September 2025
Professor Dragan Savic,
Editor in Chief
Cambridge Prisms: Water
Dear Professor Savic,
Re: Submission of ‘Community disparities in drinking water quality: A Meta-Analysis from Australia, Canada, and Beyond’
Thank you for the invitation to submit a manuscript for peer review at Cambridge Prisms: Water.
Our study responds to disparities in drinking water quality in Australia and Canada. More than 95% of their respective populations have reliable access to good drinking water quality, but hundreds of thousands, mainly in small and remote communities, do not. By quantifying the relative importance for four key factors (Indigenous status, remoteness, population size, and socio-economic conditions) on drinking water quality of some 839 communities we show what factors are contributing to poor water quality outcomes. Our findings provide the basis of evidence-based interventions to deliver ‘water for all’ in disadvantaged communities.
We look forward to the outcome of the peer review process.
Sincerely,
R. Quentin Grafton
Corresponding Author