


Introduction
Orchids are a highly diverse and ecologically significant group of plants with over 25 000 species distributed worldwide (Givnish et al., Reference Givnish, Spalink, Ames, Lyon, Hunter, Zuluaga, Doucette, Caro, McDaniel, Clements, Arroyo, Endara, Kriebel, Williams and Cameron2016). In tropical Africa, orchids are widespread, with many species found in the Central African region (Govaerts et al., Reference Govaerts, Bernet, Kratochvil, Gerlach, Carr, Pridgeon, Alrich, Pfahl, Campaccil, Baptista, Tigges, Shaw, Cribb, George, Kreuz and Wood2025). This region is home to approximately 600 orchid species, with Cameroon (∼450 species) being the country with higher species richness (Droissart et al., Reference Droissart, Simo-Droissart, Sonké, Geerinck and Stévart2025). It is estimated that more than 30 new species have been discovered and described from this area in the last 20 years (e.g. WWF, 2024). At the same time, the large Angraecineae subtribe, which includes approximately 350 epiphytic species distributed in Central Africa, has been the focus of extensive sampling and phylogenetic studies in recent years (Simo-Droissart et al., Reference Simo-Droissart, Plunkett, Droissart, Edwards, Farminhão, Ječmenica, D’haijère, Lowry, Sonké, Micheneau, Carlsward, Azandi, Verlynde, Hardy, Martos, Bytebier, Fischer and Stévart2018; Farminhão et al., Reference Farminhão, Verlynde, Kaymak, Droissart, Simo-Droissart, Collobert, Martos and Stévart2021). Notwithstanding their numerical significance and the substantial threats confronting numerous species, the study of orchids in this region has been limited, and much remains to be discovered about their morphology, ecology, and evolution.
One important approach to study orchids is through the use of morphometric analysis, which involves the measurement and analysis of various morphological features of the plant. Morphometric analysis has been widely used in botanical research, particularly for understanding the systematics and evolution of plant species (e.g. Henderson, Reference Henderson2006; Cope et al., Reference Cope, Corney, Clark, Remagnino and Wilkin2012; Simo-Droissart et al., Reference Simo-Droissart, Sonké, Droissart, Micheneau, Lowry, Hardy, Plunkett and Stévart2016; Portillo et al., Reference Portillo, Ball, Wallace, Murphy, Pérez-Díaz, Ruiz-Alonso, Aceituno and López-Sáez2020). By analysing morphological traits such as leaf shape, flower size or seed morphology, researchers can better understand the relationships between different orchid species and the factors that have influenced their evolution (Shipunov and Bateman, Reference Shipunov and Bateman2005; Bateman and Rudall, Reference Bateman and Rudall2006, Reference Bateman and Rudall2023). Orchidaceae represent an excellent model family as they combine well-characterized lifeforms and floral variation with repeated evolutionary shifts that can be mapped onto modern phylogenies (Collobert et al., Reference Collobert, Perez-Lamarque, Dubuisson and Martos2023).
Orchid seeds are generally described as ‘dust-like’, because they are small compared to most other Angiosperms (Arditti and Ghani, Reference Arditti and Ghani2000). In reality, orchid seeds show extreme variations in size and shape, which could explain both phylogenetic relationships and ecological adaptations (Nakanishi, Reference Nakanishi2022; Alfaro Pinto et al., Reference Alfaro Pinto, McGill, Nadarajan, Archila Morales and Clavijo Mccormick2023; Collier et al., Reference Collier, Fisher, Gribbins, Yoder and Zettler2023; Lee and Yeung, Reference Lee and Yeung2023). For instance, the width and length of orchid seeds can respectively vary by a ratio of 90 to 120× depending on the species (Arditti and Ghani, Reference Arditti and Ghani2000). Some studies have highlighted that certain seed characters, such as testa ornamentation or seed size, are phylogenetically conserved and thus could provide valuable taxonomic characters to support species delimitation (Aytaş Akçin et al., Reference Aytaş Akçin, Kömpe and Akcin2010; Alomia et al., Reference Alomia, Muñoz, Acosta-Rangel and Otero2016; Rewicz et al., Reference Rewicz, Kolanowska, Kras and Szlachetko2022). Other studies tend to show that the morphometric diversity of orchid seeds may be more related to different ecological adaptations and dispersal modes than to taxonomy, biogeographical origin or lifestyle. In fact, orchid seed characters may be related to seed dispersal (Diantina et al., Reference Diantina, McGill, Millner, Nadarajan, Pritchard and Clavijo Mccormick2020; Aprilianti et al., Reference Aprilianti, Handini and Puspitaningtyas2021), dormancy (Prasongsom et al., Reference Prasongsom, Thammasiri and Pritchard2017) or germination (Oikonomidis and Thanos, Reference Oikonomidis and Thanos2024) and thus represent important traits for survival and reproduction in various environmental conditions. To date, despite the high diversity and ecological significance of orchids in Africa, relatively little is known about morphometric variations of orchid seeds in this region (but see Kurzweil, Reference Kurzweil1993; Barthlott et al., Reference Barthlott, Große-Veldmann and Korotkova2014; Gamarra et al., Reference Gamarra, Ortúñez, Galan Cela and Merencio2018).
Therefore, the present study aimed to fill this knowledge gap by conducting an extensive analysis of seed morphometry in selected African orchid genera and species occurring in Cameroon. By analysing a range of morphological features of seeds from multiple species and genera, we hope to highlight the importance of seed morphometry as a tool for understanding the evolution and ecology of orchids, particularly in the context of their distribution and adaptation to the diverse habitats found in Central Africa. The main question we want to address here is whether seed morphometry is linked to the current distribution of species, or whether it is more related to a phylogenetic determinism.
Material and methods
Cameroonian orchid seed bank
The orchid seeds used in this study were obtained from a seed bank developed since 2014 at the Plants Systematics and Ecology Laboratory of the Higher Teachers’ Training College in Yaoundé, Cameroon. The seeds were obtained from mature fruits that were either collected in the field or from living plants cultivated in the Yaoundé orchid shade house (Stévart et al., Reference Stévart, Akouangou, Andriamahefarivo, Andriatsiferana, Azandi, Bakita, Biteau, D’haijère, Farminhão, Kamdem, Lowry, Mayogo, Nyangala, de Oliveira, Rajaonarivelo, Rakotoarivony, Ramandimbisoa, Randrianasolo, Razafindramanana, Razanatsima, Simo-Droissart, Sonké, Verlynde, Williams, Droissart, Hermans, Hermans, Linsky and Li2020). The seeds obtained from mature fruits were dried using the same protocol: placed in a desiccator containing a lithium chloride solution for seven days, reducing their relative humidity to approximately 12% (Hosomi et al., Reference Hosomi, Custódio, Seaton, Marks and Machado-Neto2012; Seaton et al., Reference Seaton, Hosomi, Custódio, Marks, Machado-Neto, Pritchard, Y-I and Ec-t2018). The seeds were then stored in labelled microtubes in a freezer (−20 °C). The orchid seed bank in Yaoundé may contain several collections of the same species, but for the present study, we only used one collection/sample per species, ensuring that the seeds in that collection had fully developed/mature embryos.
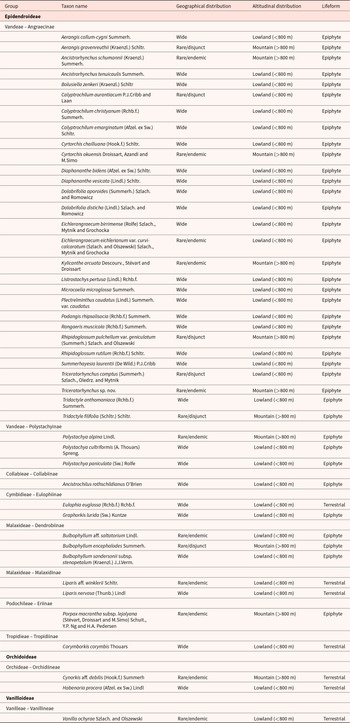
To explore the seed diversity of Central African orchids, we have selected and studied samples representing 45 taxa (including species and infra-specific ranks) belonging to 29 genera, 10 subtribes, 8 tribes and 3 subfamilies (see Table 1). The selection is primarily based on the availability and quality of the seed samples in the seed bank. Our aim is to cover as many genera as possible, and, wherever possible, to include two species per genus. Species were also selected according to their geographical distribution (widespread vs. range-restricted), their habitat (lowland vs. mountain) and their lifeforms (terrestrial vs. epiphytic) (Table 1). We have followed the classification of POWO (2025), for the scientific names, with the exception of the genera Dolabrifolia (Pfitzer) Szlach. and Romowicz and Eichlerangraecum Szlach., Mytnik and Grochocka. Recent molecular data (Farminhão et al., Reference Farminhão, Verlynde, Kaymak, Droissart, Simo-Droissart, Collobert, Martos and Stévart2021) have confirmed that these genera do indeed represent distinct genera within the polyphyletic genus Angraecum Bory.
Systematics, distribution and lifeforms of the 45 African orchid taxa investigated. Taxa are grouped by subfamily and by tribe–subtribe. Among the range-restricted taxa, we distinguished between the ‘rare/endemic’ taxa, which are those that have been recently discovered and/or are endemic to Atlantic Central Africa (see Droissart, Reference Droissart2009), and the ‘rare/disjunct’ taxa, which are those that are only known from two or three localities, usually more than 1000 km apart. All ‘rare’ taxa usually have an area of occupancy (sensu IUCN, 2022) not exceeding 2000 km2. Seeds morphology are illustrated in Appendix 1

Photography and measuring using a light microscope
The seeds were photographed under a light microscope, and all morphometric measurements were performed on those seed photographs. The photographic equipment consisted of a digital SLR camera (Canon EOS 760D) connected to a computer mounted on a light microscope (Zeiss Axio Lab A1). The photographs were mainly taken at two magnifications: ×40 and ×5. A series of 6–10 images were taken at each magnification and stacked together into a clear image using the freeware ‘focus-stack’ (https://github.com/PetteriAimonen/focus-stack; Forster-Heinlein et al., Reference Forster-Heinlein, Van De Ville, Berent, Sage and Unser2004). At ×5 magnification, the series of photographs had to show at least five seeds, while at ×40 magnification, the series of photographs had to show an entire seed to produce an illustrated catalogue of the seeds examined (Appendix 1). For seeds that were not visible in their entirety at ×40 magnification, ×10 magnification was used.
All measurements were made on photographs taken at ×5 magnification, with five seeds per individual measured, to capture within-individual variation. As stated above, the five seeds per species were obtained from the same collection/sample (i.e. corresponding to one or several seedpods that were collected at the same time on the same individual). Measurements were made using the OPTIKA PROVIEW software, which allows the image to be calibrated using a micrometre slide. Each time a measurement is taken, the software directly generates a cross-rule. We measured four main parameters (see Appendix 2): the seed length (SL, in µm), the seed width (SW, in µm), the seed surface (SS, in µm2) and the embryo surface (ES, in µm2). We have also derived two calculated parameters. The seed air space (SAS) to obtain an estimate of the space/volume of air in the seed that is less dependent on seed size. It was calculated as the difference between the seed surface and the embryo surface divided by the seed surface and multiplied by 100 ((SS − ES)/SS × 100). We developed this new approach because it takes into account the different shapes of the individual seeds compared to the method of Arditti and Ghani (Reference Arditti and Ghani2000), commonly used in the literature and which assimilates the orchid seed to two cones joined at the base. Finally, we also calculated the ratio between seed length (SL) and seed width (SW).
Statistical approach
To assess the link between seed morphology and phylogenetic relationship among the 29 studied orchid genera, a phylogenetic tree was reconstructed using data from the NCBI global database (Schoch et al., Reference Schoch, Ciufo, Domrachev, Hotton, Kannan, Khovanskaya, Leipe, McVeigh, O’Neill, Robbertse, Sharma, Soussov, Sullivan, Sun, Turner and Karsch-Mizrachi2020) and a recent revision of the 18 genera belonging to the Angraecinae subtribe (Farminhão et al., Reference Farminhão, Verlynde, Kaymak, Droissart, Simo-Droissart, Collobert, Martos and Stévart2021). The Interactive Tree Of Life (iTOL) online tool was used to produce the final topology of the phylogenetic tree (Letunic and Bork, Reference Letunic and Bork2024).
Using the phylogenetic tree, we assessed the phylogenetic signal of each morphometric parameter using the phylosig function (Pagel, Reference Pagel1999) from the Phytools R package (Revell, Reference Revell2024) using the lambda method. This method allows us to assess how much of the variation in a trait between different species/genera is explained by their evolutionary relationships. The method is based on a statistic called Pagel’s lambda (λ), which ranges from 0 to 1. If λ is close to 0, it means that the trait variation is not influenced by evolutionary history of the studied taxa (i.e. the trait is evolving independently in each species/genera). Conversely, if λ tends to 1, this means that trait tends to evolve in a way that is consistent with its phylogenetic tree. We also calculated the local phylogenetic association index (LIPA) using the lipaMoran function (Anselin, Reference Anselin1995) from the phylosignal R package (Keck et al., Reference Keck, Rimet, Bouchez and Franc2016). This index allows the identification of phylogenetic autocorrelation hotspots (i.e. taxa with similar traits values due to their phylogenetic proximity). The LIPA can be positive, negative or equal to zero. If LIPA < 0, we speak of negative phylogenetic autocorrelation (i.e. trait values are less similar or not similar between phylogenetically close species), for LIPA = 0, there is no phylogenetic autocorrelation (i.e. trait values are random and independent of phylogeny), for LIPA > 0, it is positive phylogenetic autocorrelation (i.e. the trait values are similar between phylogenetically close species). The lipaMoran function performs a non-parametric randomization test on each LIPA value and returns a p-value. A p-value < 0.05 indicates a positive and significant LIPA.
As sample size exceeded 30 observations per group and residual diagnostics (Q–Q plots and residuals-versus-fitted plots) did not indicate substantial violations of ANOVA assumptions, we analysed each morphometric parameter using a one-way ANOVA. Pairwise differences among species were then assessed using Tukey’s HSD post-hoc test, with a significance level of α = 0.05. As an additional robustness check, we also verified that the main conclusions were consistent with a non-parametric alternative (Kruskal–Wallis test followed by Dunn’s post-hoc test with p-value adjustment for multiple comparisons), which further supports the reliability of our results.
To observe the distance between species regarding their lifeforms, and their altitudinal and geographic distributions, we performed a principal component analysis (PCA) using the PCA function of the FactoMineR R package (Lê et al., Reference Lê, Josse and Husson2008), based on the six morphometric parameters detailed above. We subsequently performed a hierarchical clustering on the principal component scores using the HCPC function, with Euclidean distance as the dissimilarity measure, to evaluate whether the clustering pattern was driven by predefined species groups. When clustering did not clearly reflect the predefined groups, we further tested for group differences by applying a non-parametric Kruskal–Wallis test to individual scores on the first two PCA axes.
All the above analyses were performed using R software version 4.5.1 (R Core Team, 2025).
Results
Seed morphometry and phylogenetic relationship
In this study, the seeds of 45 taxa in 29 genera were photographed (Appendix 1) and examined, whose phylogenetic relationships are shown in Fig. 1. Visual examination of the tree shows a clear difference in size between epiphytic and terrestrial species. The most remarkable variation is the average seed surface of terrestrial orchid seeds (115 304.38 ± 72 044.36 µm2), which is nine times larger than that of epiphytes (12 526.34 ± 6931.22 µm2) (see Appendix 3 for exact measurements for each species). The Fig. 1 also highlights a large diversity in shape and size among the 18 genera of the monophyletic Angraecinae subtribe.
Link between phylogenetic relationships and ‘visual’ seed morphology of the 29 African orchid genera studied in this paper. The topology of the cladogram was constructed using data from the NCBI global database (Schoch et al., Reference Schoch, Ciufo, Domrachev, Hotton, Kannan, Khovanskaya, Leipe, McVeigh, O’Neill, Robbertse, Sharma, Soussov, Sullivan, Sun, Turner and Karsch-Mizrachi2020) and a recent revision of 18 genera of the Angraecinae subtribe (Farminhão et al., Reference Farminhão, Verlynde, Kaymak, Droissart, Simo-Droissart, Collobert, Martos and Stévart2021). All the seeds illustrated are reproduced to the same scale to facilitate visual size comparisons. Green and Orange bullets indicate the main lifeform of the species belonging to each genus. The species used to illustrate each genus are indicated in Appendix 3. Cynorkis, Graphorkis, Habenaria and Liparis contain species with different lifeforms.

Variability in size is considerable within the studied species (Appendix 3). The length of the seeds varies by a factor of 12 between the longest (Corymborkis corymbis, 2062.0 ± 162.6 µm) and the shortest (Bulbophyllum aff. saltatorium, 131.4 ± 15.6 µm), and these two species also present the maximum and minimum values for the seed surface. Vanilla ochyrae seed, the widest one (387.0 ± 49.7 µm), is 11 times wider than the ‘thinnest’ one (Microcoelia microglossa, 34.6 ± 6.1 µm). The embryo surface varied between 154324.0 µm2 (Vanilla ochyrae) and 2556.8 µm2 (Summerhayesia laurentii). The SAS ranged from ∼96% in Corymborkis corymbis to ∼16% in Vanilla ochyrae.
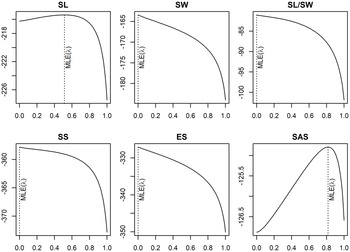
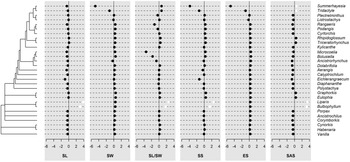
The test of phylogenetic signal in the morphometric traits (Fig. 2) showed a high signal intensity for length (Ⲗ = 0.5) and SAS (Ⲗ = 0.81). This reflects a link between phylogenetic relationship among studied genera and these traits. Width, length to width ratio, seed surface and embryo surface show almost no phylogenetic signal (Ⲗ ≈ 0). The local phylogenetic association index shows values close to zero for most of the traits measured for each genus (Fig. 3), indicating that there is no phylogenetic autocorrelation. Only Liparis and Bulbophyllum showed significant positive values of autocorrelation for length, SAS, length to width ratio (SL/SW) and seed surface (Fig. 3). Summerhayesia and Tridactyle also showed significant positive autocorrelation for SASs (Fig. 3). We also noted that only the length and SAS did not show negative autocorrelation in all 29 genera (Fig. 3).
Value of the phylogenetic signal of the six morphometric traits measured for the 29 studied orchid genera. The x-axis represents the value of the phylogenetic signal (Pagel’s lambda (λ) tends to 1 when seed traits evolve in a way that is consistent with its phylogenetic tree) and the y-axis the log-likelihood associated with Ⲗ. SL, seed length; SW, seed width; SS, seed surface; ES, embryo surface; SAS, seed air space.

Values of the local phylogenetic association index (LIPA) for six morphometric characteristics of the 29 studied orchid genera. White points indicate significant LIPA values and phylogenetic autocorrelation hotspots (genera whose values for a trait are similar due to their phylogenetic proximity). SL, seed length; SW, seed width; SS, seed surface; ES, embryo surface; SAS, seed air space.

Seed morphometry and species’ ecology
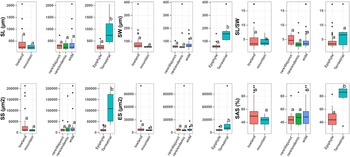
The analysis of variance carried out on life forms, altitudinal range and geographical distribution using the six measured or calculated morphometric traits (Fig. 4), shows significant differences only for the lifeform and for all traits except the ratio between seed length and seed width. There are no significant differences between the species with different geographical distribution (widespread vs. range-restricted) or altitudinal range (lowland vs. mountain).
Boxplots for each morphometric character among different geographical (rare/disjunct = 8 species; rare/endemic = 9 species; wide = 28 species), altitudinal (lowland = 35 species; mountain = 10 species) and lifeform (epiphyte = 38 species; terrestrial = 7 species) groups. The boxplots with different letters show a significant difference at the 0.05 significance level using the Tukey test. SL, seed length; SW, seed width; SS, seed surface; ES, embryo surface; SAS, seed air space.

Multivariate analysis performed on the seed morphology of 45 orchid species also separates epiphytes from terrestrial orchids (Fig. 5A). Most of the epiphytic species are grouped along the first two axes of PCA, which account for 86.3% of the explained variance. Terrestrial orchids are stretched along axis 1 of the PCA, which accounts for 53.7% of the total variance (Fig. 5A). This axis is correlated with seed length, seed width, and SAS (Appendix 4).
Morphometric variation between seeds of 45 African orchid species. (A) Principal Component Analysis (PCA) biplot for six seed characteristics comparing 45 orchids’ taxa occurring in Cameroon with two lifeforms. (B) Hierarchical clustering (Euclidian distance) on principal component scores at the 0.05 significance level.

Following the PCA, we performed a hierarchical classification based on the principal components (HCPC) and obtained four different groups (Fig. 5B). The first, red-coloured group contains only epiphytic orchids. The second green-coloured group contains epiphytic orchids (Graphorkis lurida) and terrestrial orchids belonging to genera that also have epiphytic species. The third group is represented by a liana-like species (Vanilla ochyrae) whose lifeform is initially terrestrial and eventually becomes epiphytic as the plant grows. The last group contains two terrestrial orchids. The dispersal gradient of terrestrial orchid species along the axis 1 of the PCA and the grouping of Graphorkis lurida with terrestrial orchids tend to reflect an evolutionary process from one lifeform to another.
Seed morphometry and epiphytic species distribution
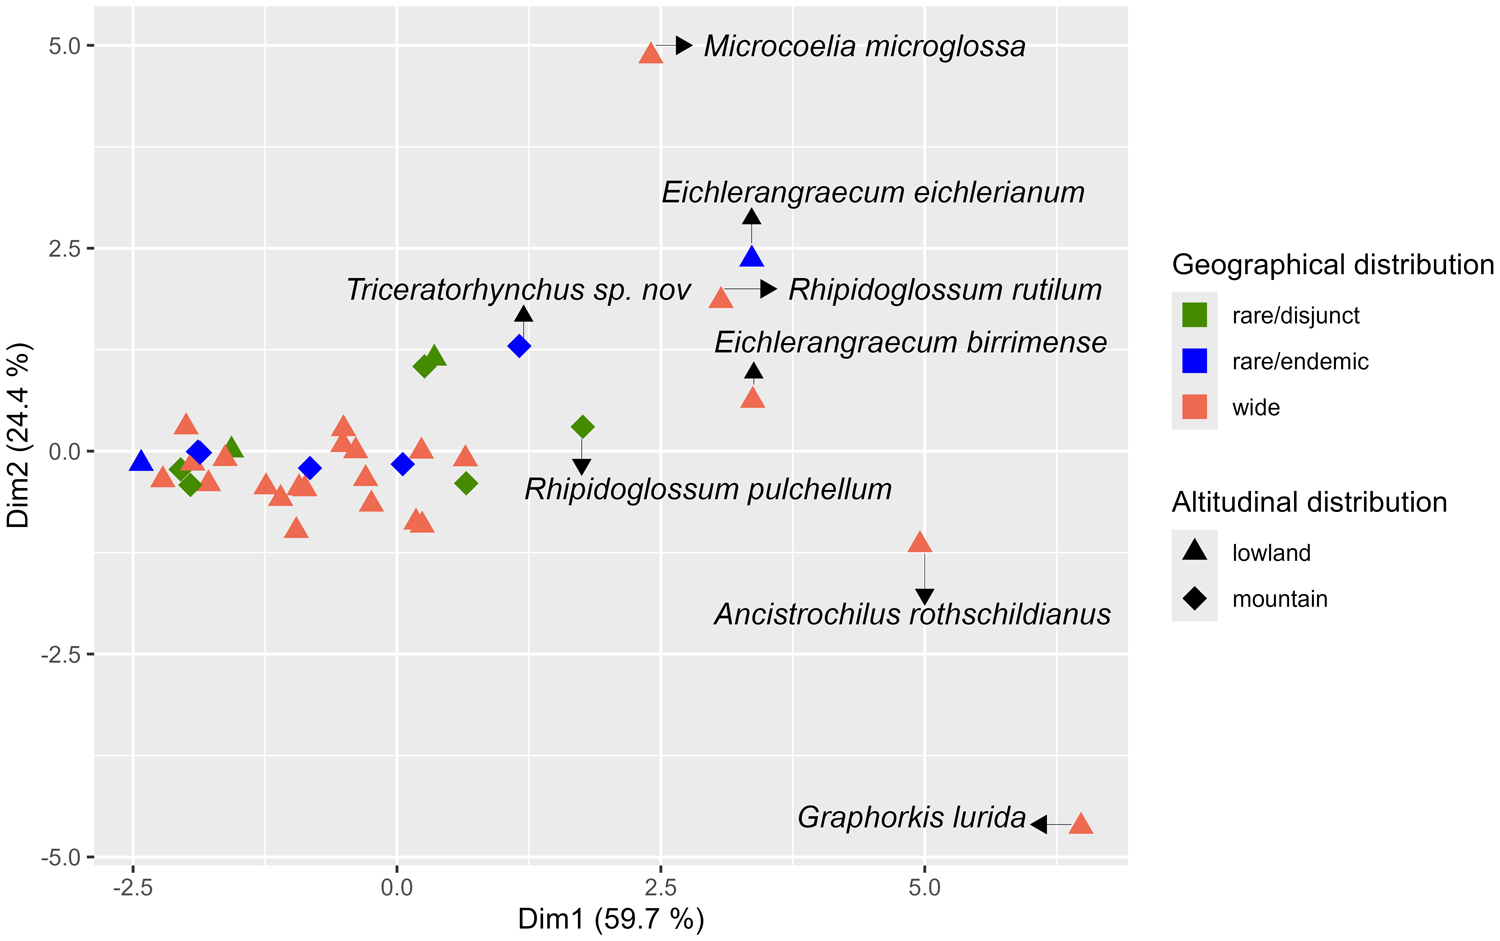
Based on the seed morphometric variables measured on epiphytic species, no correlation could be established between the seed morphology and the geographical and altitudinal distributions of the species to which they belong. The PCA based on morphological characteristics shows a grouping of epiphytic species regardless of their distribution (Fig. 6), although some species such as Ancistrochilus rothschildianus, Graphorkis lurida, Microcoelia microglossa, Summerhayesia laurentii stand out from the group. In addition, the Kruskal–Wallis test carried out on axes 1 and 2 (which account for 83.5% of the total variance) of the PCA shows that there is no significant difference between the morphology of the seeds of mountain orchids (>800 m) and lowland orchids (<800 m) (P-value of 0.64 on axis 1 and 0.59 on axis 2). Similarly, there was no significant difference between the seeds of orchids with a wide distribution and those with a restricted distribution (P-value = 0.71 on axis 1 and 0.20 on axis 2).
Morphometric variation between seeds of epiphytic African orchid species in relation to their geographical and altitudinal distributions. The graph shows the results of a Principal Component Analysis (PCA) for six seeds characteristics and comparing 38 species with contrasted geographical range (rare/disjunct = 7 species; rare/endemic = 7 species; wide = 24 species) and altitudinal distribution (lowland = 28 species; mountain = 10 species).

Discussion
The morphometry of orchid seeds and its taxonomic significance
Seed morphology is a well-established taxonomic tool for studying orchid diversity (Gamarra et al., Reference Gamarra, Galán, Herrera and Ortúñez2008, Reference Gamarra, Ortúñez, Galán Cela and Guadaño2012; Barthlott et al., Reference Barthlott, Große-Veldmann and Korotkova2014). Our results confirm that some seed traits, such as length and SAS, exhibit strong phylogenetic signals for African orchid species. In this context, seed morphometry appears to provide valuable complementary information about the phylogenetic placement of species (Collier et al., Reference Collier, Fisher, Gribbins, Yoder and Zettler2023). However, the strength of phylogenetic signals may varies depending on the taxonomic scale (Keck et al., Reference Keck, Rimet, Bouchez and Franc2016). Our local phylogenetic analysis (LIPA) of selected African orchid genera revealed a heterogeneous signal. For example, genera such as Liparis and Bulbophyllum displayed significant phylogenetic structuring for seed length, surface area, length-to-width ratio, and SAS, whereas most of the other genera showed no clear patterns (Fig. 3). This suggests that the evolutionary history of individual genera strongly shapes the expression of seed traits, while in others these characters may have undergone ecological filtering or convergence. Traits lacking a phylogenetic signal are particularly interesting, as they may reflect adaptive evolution decoupled from ancestry (Desdevises, Reference Desdevises2018).
Using scanning electron microscopy (SEM), Barthlott et al. (Reference Barthlott, Große-Veldmann and Korotkova2014) also identified fine features of the testa cells as key taxonomic criteria in orchids. Although our optical microscopy study does not permit ultrastructural observation, we believe that our methodological approach is still suitable for large-scale quantitative morphometry. Light microscopy has several advantages: it is widely accessible, cost-effective and non-destructive, and it preserves specimen colouration. Although SEM provides superior resolution and ultrastructural detail, the cost and required sample preparation may limit its applicability in comparative studies such as ours. Future studies could combine both approaches, using optical microscopy for large datasets and SEM for detailed analyses of critical taxa.
Morphology of orchid seeds and species ecology
Seed morphology offers insights into evolutionary mechanisms within Orchidaceae (Fan et al., Reference Fan, Chomicki, Hao, Liu, Xiong, Renner, Gao and Huang2020). Phylogenomic studies indicate that the ancestral condition of orchids was terrestrial, followed by multiple independent transitions to epiphytism (Zhang et al., Reference Zhang, Hu, Huang, Huang, Liu, Zhang, Hu, Downing, Liu and Ma2023). Our results are consistent with this evolutionary trajectory, since African seed morphology clearly differentiates terrestrial from epiphytic orchids. Terrestrial seeds tend to be longer and show highest SASs than epiphytic ones (Fig. 3). Such differences in seed structure are thought to optimize dispersal under contrasting ecological conditions (Diantina et al., Reference Diantina, McGill, Millner, Nadarajan, Pritchard and Clavijo Mccormick2020; Fan et al., Reference Fan, Chomicki, Hao, Liu, Xiong, Renner, Gao and Huang2020).
Interestingly, genera that include both terrestrial and epiphytic species, such as Cynorkis, Graphorkis, Habenaria and Liparis, tend to exhibit intermediate seed morphologies (Fig. 5). This intermediate phenotype may reflect ecological plasticity and/or ongoing transitions between lifeforms, corroborating the dynamic evolutionary history of Orchidaceae. However, we were unable to link these intermediate/transitional genera to specific environmental conditions or distribution patterns.
Our findings also reinforce the idea that seed size and the proportion of air cavities are directly linked to ecological adaptations (Arditti and Ghani, Reference Arditti and Ghani2000). Chaudhary et al. (Reference Chaudhary, Chattopadhyay and Banerjee2014) demonstrated that temperate Dendrobium species have larger air spaces than their tropical counterparts, facilitating flotation and thereby enhancing their dispersal. In our dataset, the consistently higher air content in terrestrial seeds might be linked to their in low-wind understory habitats, as their potential for long-distance anemochory is reduced compared to epiphytes exposed to canopy-level winds. Animal-mediated dispersal provides complementary pathways, with both endozoochory and ectozoochory now demonstrated in Vanilla: mammals consume indehiscent fleshy fruits and defecate viable seeds, while bees remove seeds from dehiscent fruits attracted by vanillin volatiles (Karremans et al., Reference Karremans, Bogarín, Fernández Otárola, Sharma, Watteyn, Warner, Rodríguez Herrera, Chinchilla, Carman, Rojas Valerio, Pillco Huarcaya and Whitworth2023). This highlights how habitat structure and dispersal ecology interact to shape orchid seed morphology.
Morphology of orchid seeds and species distribution patterns
A fundamental question guiding this research was to ascertain whether African orchids with restricted distribution possess seeds with a distinct morphology. The link between orchid seed morphology and dispersal capacity has long been hypothesized (Arditti and Ghani, Reference Arditti and Ghani2000); seeds with higher air content enjoy prolonged suspension and may disperse farther. In contrast to this expectation, our study did not detect a significant correlation between seed air content and either geographical or altitudinal distribution of species. This aligns with Aprilianti et al. (Reference Aprilianti, Handini and Puspitaningtyas2021), who showed that in Bulbophyllum and Dendrobium, SAS does not predict distribution range but may instead influence micro-scale dispersal mechanisms.
The majority of the range-restricted species selected for this study (11 out of 17, see Table 1) are found in montane forests above 800 m, which are a scarce and more and more threatened habitat in Central Africa (Abera et al., Reference Abera, Heiskanen, Maeda, Muhammed, Bhandari, Vakkari, Hailu, Pellikka, Hemp, van Zyl and Zeuss2024). Cuni-Sanchez et al. (Reference Cuni-Sanchez, Sullivan, Platts, Lewis, Marchant, Imani, Hubau, Abiem, Adhikari, Albrecht, Altman, Amani, Aneseyee, Avitabile, Banin, Batumike, Bauters, Beeckman, Begne, Bennett, Bitariho, Boeckx, Bogaert, Bräuning, Bulonvu, Burgess, Calders, Chapman, Chapman, Comiskey, de Haulleville, Decuyper, DeVries, Dolezal, Droissart, Ewango, Feyera, Gebrekirstos, Gereau, Gilpin, Hakizimana, Hall, Hamilton, Hardy, Hart, Heiskanen, Hemp, Herold, Hiltner, Horak, Kamdem, Kayijamahe, Kenfack, Kinyanjui, Klein, Lisingo, Lovett, Lung, Makana, Malhi, Marshall, Martin, Mitchard, Morel, Mukendi, Muller, Nchu, Nyirambangutse, Okello, Peh, Pellikka, Phillips, Plumptre, Qie, Rovero, Sainge, Schmitt, Sedlacek, Ngute, Sheil, Sheleme, Simegn, Simo-Droissart, Sonké, Soromessa, Sunderland, Svoboda, Taedoumg, Taplin, Taylor, Thomas, Timberlake, Tuagben, Umunay, Uzabaho, Verbeeck, Vleminckx, Wallin, Wheeler, Willcock, Woods and Zibera2021) estimated that these forests occupy less than 5% of Cameroon’s primary humid forest area. Droissart et al. (Reference Droissart2009) also demonstrated that the majority of orchid species endemic to Atlantic Central Africa are disproportionately concentrated in mountainous regions. Such mountain systems have been shown to function as ‘cradles’ of diversification, where topographic complexity, habitat heterogeneity and isolation promote lineage splitting and the emergence of narrowly distributed taxa, like the studied ‘rare/endemic’ putative new species (Bulbophyllum aff. saltatorium, Cynorkis aff. debilis, Liparis aff. winklerii, and Triceratorhynchus sp. nov.). Alternatively, such systems can be regarded as ‘museums’ that preserve diversity through time by providing relatively stable refugial condition (Couvreur et al., Reference Couvreur, Dauby, Blach-Overgaard, Deblauwe, Dessein, Droissart, Hardy, Harris, Janssens, Ley, Mackinder, Sonké, Sosef, Stévart, Svenning, Wieringa, Faye, Missoup, Tolley, Nicolas, Ntie, Fluteau, Robin, Guillocheau, Barboni and Sepulchre2021). The latter role is consistent with the persistence of the studied ‘rare/disjunct’ species (e.g., Aerangis gravenreuthii, Bulbophyllum encephalodes, Calyptrochilum aurantiacum, Rhipidoglossum pulchellum var. geniculatum, Triceratorhynchus comptus, Tridactyle filifolia).Other ecological or biotic factors appear relevant to explaining distribution patterns of tropical orchids. Duffy and Johnson (Reference Duffy and Johnson2017) suggest that pollinator distributions may limit the geographical ranges of flowering plants with specialized pollination systems, which are frequently observed in orchids. Symbiotic associations with mycorrhizal fungi are critical to orchid establishment, and their absence or patchy distribution can strongly limit species ranges (Waud et al., Reference Waud, Busschaert, Lievens and Jacquemyn2016; Li et al., Reference Li, Wu, Yang, Selosse and Gao2021). Likewise, for epiphytic orchids, substrate specificity plays a major role: bark type influences seedling establishment (Birindwa et al., Reference Birindwa, Cubaka, Cirimwami, Katusi and Mangambu2023), while microclimatic variables such as humidity, temperature and light availability drive preferences for particular phorophytes (Kimpouni et al., Reference Kimpouni, Sacadura, Kalath and Kiangana-Ngoyi2017). These multi-factorial constraints likely explain local clustering and range restriction, and may override potential dispersal ability conferred by seed morphology.
Conclusion
The morphometric analysis of central African orchid seeds reveals a complex interplay between phylogenetic constraints and ecological adaptations. We confirmed a consistent pattern whereby epiphytic species possess smaller seeds with reduced air content compared to their terrestrial counterparts, suggesting that the evolutionary transition to epiphytism involved specific modifications of seed morphology. Some orchid seed traits appear to be phylogenetically conserved, making them potentially valuable for systematic studies within the family. Integrating such morphometric data with emerging phylogenomic datasets could help resolving taxonomic uncertainties and reconstructing the evolutionary history of seed adaptations in orchids.
Contrary to expectations, we could not establish any clear link between seed morphology and distribution patterns among epiphytic species, regardless of their geographical range or elevation preferences. This finding indicates that factors other than seed dispersal capacity, including mycorrhizal associations, host tree specificity and local environmental conditions, are probably more important in determining where orchid species can successfully establish and persist. As no germination data like that used by Oikonomidis and Thanos (Reference Oikonomidis and Thanos2024) are currently available for the Central African orchid species investigated here, there is a significant knowledge gap in regional seed biology. Targeted comparative studies of germination behaviour would be especially valuable in testing evolutionary hypotheses and informing conservation and restoration strategies for Orchidaceae in Central Africa.
Moving forward, we suggest that research efforts should focus on expanding morphometric surveys to encompass a wider taxonomic representation across African Orchidaceae, while also incorporating functional studies that directly measure dispersal effectiveness and germination success. Additionally, distribution models would benefit from explicitly accounting for the multiple and complex ecological interactions that orchids depend upon. This multivariate approach should provide deeper insights into the mechanisms driving diversification in this remarkably species-rich plant family.
Supplementary material
The supplementary material for this article can be found at https://doi.org/10.1017/S0960258526100117.
Acknowledgements
The authors are grateful to the authorities of Higher Teachers’ Training College, University of Yaoundé I, for hosting the Yaoundé shade house and for allowing authors to access their facilities. We express our sincere gratitude to Gislène Kamdem, Narcisse Kamdem and Sandrine Mayogo for maintenance work and collection of seeds in the Yaoundé shadehouse. We acknowledge the use of artificial intelligence tools (DeepL Write) for grammar checking and language refinement during the manuscript preparation.
Author contributions
P.D.A. conceived the study under direction of V.D., B.S. P.D.A. designed and performed the analysis with assistance from V.D. P.D.A., and V.D. collected the data. M.S.D. contributed to the interpretation of the results. V.D. and P.D.A. wrote the manuscript with the assistance of M.S.D and B.S.
Funding statement
We are indebted to the American Orchid Society, National Geographic Society Conservation Trust (grant number C303-15, V. Droissart as PI), Mohammed bin Zayed Species Conservation Fund (grant number 16255698, V. Droissart as PI) and Meise Botanic Garden that financially supported the building and maintenance of the Yaoundé shadehouse and the associated orchid seedbank. We gratefully acknowledge the Agence Universitaire de la Francophonie (AUF) for financial support enabling the acquisition of microscopy equipment at the Higher Teachers’ Training College, University of Yaoundé I.
Competing interests
The authors declare none.
Data availability
All data generated or analysed during this study are included in the article. Please contact the corresponding author for more data requests.


 Open access