

1 Introduction
Mathematics skills are among the most influential educational factors contributing to economic prosperity in industrialized countries (Hunt & Wittmann, Reference Hunt and Wittmann2008). Accordingly, there has been considerable interest in the causes and consequences of numeracy (Huff & Geis, Reference Huff and Geis1954; Paulos, Reference Paulos1988), which refers specifically to mathematical or quantitative literacy (Steen, Reference Steen1990). The more basic levels of numeracy are concerned with the “real number line, time, measurement, and estimation” whereas higher levels focus on “an understanding of ratio concepts, notably fractions, proportions, percentages, and probabilities” (Reyna, Nelson, Ham, & Dieckman, Reference Reyna, Nelson, Han and Dieckmann2009). Much of the research on numeracy has involved assessment of a wide range of mathematical skills among large and diverse samples. More recently, however, research and theory in the decision sciences has focused on a subset of numeracy that is important for informed and accurate risky decision making—i.e., statistical numeracy (Galesic, Garcia-Retamero & Gigerenzer, Reference Galesic, Garcia-Retamero and Gigerenzer2009; Lipkus, Samsa, & Rimer, Reference Lipkus, Samsa and Rimer2001; Peters et al., Reference Peters, Västfjäll, Slovic, Mertz, Mazzocco and Dickert2006; Reyna et al., Reference Reyna, Nelson, Han and Dieckmann2009).
In this paper, we use “statistical numeracy” specifically to refer to an understanding of the operations of probabilistic and statistical computation, such as comparing and transforming probabilities and proportions (Lipkus et al., Reference Lipkus, Samsa and Rimer2001; Schwartz, Woloshin, Black, & Welch, Reference Schwartz, Woloshin, Black and Welch1997). These statistical aspects of numeracy are key features of risk assessment in business and engineering (Ayyub, Reference Ayub2003; Covello & Mumpower, Reference Covello and Mumpower1985; Froot, Scharfstein, & Stein, Reference Froot, Scharfstein and Stein1993), and play central roles in health risk quantification and communication (Lipkus & Peters, Reference Lipkus and Peters2009; see also Gigerenzer, Gaissmaier, Kurz-Milcke, Schwartz, Woloshin, Reference Gigerenzer, Gaissmaier, Kurz-Milcke, Schwartz and Woloshin2007). Moreover—although risk commonly refers to many topics (e.g., variability in probability distributions; the effect of uncertainty on objectives; exposure to danger and loss; Figner & Weber, Reference Figner and Weber2011; Fox & Tennenbaum, Reference Fox and Tannenbaum2011; Gigerenzer, Swijtink, Porter, Daston, Beatty, Kruger, Reference Gigerenzer, Swijtink, Porter, Daston, Beatty and Krüger1989)—economic and psychological theory have long held that decision making under risk is that involving known “statistical probabilities” and quantitative “probabilistic reasoning” (Knight, Reference Knight1921; for a recent review see Rakow, Reference Rakow2010).Footnote 1 In these ways and others, statistical numeracy is one factor that gives rise to risk literacy—i.e., the ability to accurately interpret and act on information about risk.Footnote 2 Indeed, statistical numeracy has been shown to be a predictor of decision strategies, affective reactions, comprehension and normative choices across many risky economic, health, and consumer decisions (Banks, O’Dea, & Oldfield, Reference Banks, O’Dea and Oldfield2010; Cokely & Kelley, Reference Cokely and Kelley2009; Lipkus & Peters, Reference Lipkus and Peters2009; Peters & Levin, Reference Peters and Levin2008; Peters et al., Reference Peters, Västfjäll, Slovic, Mertz, Mazzocco and Dickert2006; Reyna et al., Reference Reyna, Nelson, Han and Dieckmann2009).
Efforts to measure individual differences in statistical numeracy and risk literacy come primarily in three forms. Some research examines risky decisions in relation to individual differences in overall educational attainment, cognitive abilities, or cognitive styles (Frederick, Reference Frederick2005; Stanovich & West, Reference Stanovich and West2000, Reference Stanovich and West2008). Other research primarily focusing on clinical and health domains has developed a valid subjective instrument for self-reported estimations of numeracy (Galesic & Garcia-Retamero, Reference Galesic and Garcia-Retamero2010; Zikmund-Fisher, Smith, Ubel, & Fagerlin, Reference Zikmund-Fisher, Smith, Ubel and Fagerlin2007). Most common, however, is the use of objective performance measures of numeracy—i.e., psychometric tests (for a list of tests see Reyna et al., Reference Reyna, Nelson, Han and Dieckmann2009; but see also Black, Nease, & Tosteson, Reference Black, Nease and Tosteson1995; Galesic & Garcia-Retamero, Reference Galesic and Garcia-Retamero2010; Lipkus et al., Reference Lipkus, Samsa and Rimer2001; Peters et al., Reference Peters, Västfjäll, Slovic, Mertz, Mazzocco and Dickert2006; Schwartz et al., Reference Schwartz, Woloshin, Black and Welch1997; Weller, Dieckmann, Tusler, Mertz, Burns, & Peters, Reference Weller, Dieckmann, Tusler, Mertz, Burns and Peters2011).
In this paper, we review the development of the most widely used statistical numeracy instruments (Lipkus et al., Reference Lipkus, Samsa and Rimer2001; Schwartz et al., Reference Schwartz, Woloshin, Black and Welch1997), examining successes and psychometric limits. We then introduce a new test of statistical numeracy and risk literacy—i.e., the Berlin Numeracy Test. The Berlin Numeracy Test can be used in multiple formats (i.e., computer adaptive, paper-and-pencil, multiple choice, single-item median-split), providing a fast, valid, and reliable tool for research, assessment, and public outreach. Specifically, we show that the new test offers unique predictive validity for comprehension of everyday risks beyond other cognitive ability and numeracy tests (e.g., cognitive reflection, working memory span, and fluid intelligence). Furthermore, we show that the Berlin Numeracy Test dramatically improves psychometric discriminability among highly-educated individuals (e.g., college students and graduates, medical professionals), across diverse cultures and different languages. We close with a discussion of construct validity, underlying mechanisms, and applications (e.g., custom-tailored, interactive, and adaptive risk communication).
1.1 Numeracy and risk literacy in educated samples
In 2001, Lipkus et al. (Reference Lipkus, Samsa and Rimer2001) published the numeracy test for highly-educated samples, as an extension of previous work by Schwartz et al. (Reference Schwartz, Woloshin, Black and Welch1997). Lipkus et al. (Reference Lipkus, Samsa and Rimer2001) conducted a series of 4 studies (n = 463) on community samples of well-educated adult participants (at least 40 years of age) in North Carolina. Among other tasks, all participants answered 11 total numeracy questions including (i) one practice question, (ii) three numeracy questions taken from the work of Schwartz et al. (Reference Schwartz, Woloshin, Black and Welch1997), and (iii) seven other questions (one of which had two parts) that were framed in the health domain (e.g., if the chance of getting a disease is 10% how many people would be expected to get the disease: (a) out of 100, (b) out of 1000). Two questions had multiple choice options while all others were open-ended. All questions were scored (0 or 1) with data aggregated across several studies and entered into a factor analysis, showing that a one factor solution was appropriate. Overall, results indicated that the refined test by Lipkus et al. (Reference Lipkus, Samsa and Rimer2001) was a reliable and internally consistent measure of high-school and college educated individuals’ statistical numeracy.
The results of Lipkus et al. (Reference Lipkus, Samsa and Rimer2001) were interesting for a number of reasons. First, the results provided additional evidence that even among educated US community samples some sizable proportion of individuals were likely to be statistically innumerate (e.g., 20% failed questions dealing with risk magnitude). Such findings were and continue to be important as many efforts designed to support informed and shared decision making rest on an erroneous assumption that decision-makers are numerate (or at least sufficiently statistically numerate; see also Guadagnoli & Ward P, Reference Guadagnoli and Ward1998; Schwartz et al., Reference Schwartz, Woloshin, Black and Welch1997). Second, results indicated that domain framing (e.g., medical versus financial versus abstract gambles) did not necessary differentially affect test performance or comprehension. This finding indicates that various domain-specific items (e.g., items framed in terms of financial or medical or gambling risks) can provide a reasonable basis for the assessment of general statistical numeracy skills that will have predictive power across diverse domains. Overall, for nearly a decade, the Lipkus et al. (Reference Lipkus, Samsa and Rimer2001) test, and its predecessor from Schwartz et al. (Reference Schwartz, Woloshin, Black and Welch1997) have provided relatively short, reliable, and valuable instruments that have been used in more than 100 studies on topics such as medical decision making, shared decision making, trust, patient education, sexual behavior, stock evaluations, credit-card usage, graphical communication, and insurance decisions, among many others (Lipkus & Peters, Reference Lipkus and Peters2009).
1.2 Psychometrics
Despite its many successes and its influential role in advancing risky decision research, as anticipated by Lipkus et al. (Reference Lipkus, Samsa and Rimer2001), a growing body of data suggests some ways the current numeracy instrument could be improved (for an item response theory based analysis see Schapira, Walker, & Sedivy, Reference Schapira, Walker and Sedivy2009; see also Weller et al. Reference Weller, Dieckmann, Tusler, Mertz, Burns and Peters2011). For example, one major concern is that the Lipkus et al. test is not hard enough to adequately differentiate among the higher-performing, highly-educated individuals who are often studied (e.g., convenience samples from universities). To illustrate, in one study of college students at the Florida State University, data indicated that, although the Lipkus et al. (Reference Lipkus, Samsa and Rimer2001) test was a significant predictor of risky decisions, the Lipkus et al. test showed extensive negative skew with scores approaching the measurement ceiling (e.g., most participants answered more than 80% of items correctly; Cokely & Kelley, Reference Cokely and Kelley2009; for similar results see Peters et al., Reference Peters, Västfjäll, Slovic, Mertz, Mazzocco and Dickert2006, Reference Peters, Dieckmann, Dixon, Slovic, Mertz and Hibbard2007a, Reference Peters and Levin2008; Schapira et al., Reference Schapira, Walker and Sedivy2009; and for similar patterns from physicians-in-training see Hanoch, Miron-Shatz, Cole, Himmelstein, & Federman, Reference Hanoch, Miron-Shatz, Cole, Himmelstein and Federman2010). Another recent study using large probabilistically representative samples of the whole populations of two countries (the United States and Germany) revealed negative skew in numeracy scores even among participants from the general population (Galesic & Garcia-Retamero, Reference Galesic and Garcia-Retamero2010). Although most people are not college educated, most people in these two countries are likely to get the majority of questions right. These data suggest that most individuals tend to produce distributions of scores that are negatively skewed and are subject to measurement ceiling effects.
A second psychometric concern is that there is relatively little known about the relations between either the Lipkus et al. (Reference Lipkus, Samsa and Rimer2001) or Schwartz et al. (Reference Schwartz, Woloshin, Black and Welch1997) numeracy test and other individual differences, such as basic cognitive abilities (Liberali, Reyna, Furlan, Stein, & Pardo, Reference Liberali, Reyna, Furlan, Stein and Pardo2011). To illustrate, one might argue that statistical numeracy is a useful predictor of risky choice simply because it is correlated with measures of fluid intelligence. It is well known that tests of general intelligence, including those designed to measure fluid intelligence, are valid and reliable predictors of a wide variety of socially desirable cognitive, behavioral, occupational, and health-related outcomes (Neisser et al., Reference Neisser, Boodoo, Bouchard, Boykin, Brody, Ceci, Halpern, Loehlin, Perlo, Sternberg and Urbina1996).Footnote 3 Fluid intelligence tests such as Raven’s Standard or Advanced Progressive Matrices tend to be more time consuming yet also confer considerable benefits in terms of psychometric rigor and cross-cultural fairness (Raven, Reference Raven2000). To date, however, few tests have investigated the extent to which the Lipkus et al. (Reference Lipkus, Samsa and Rimer2001) or Schwartz et al. (Reference Schwartz, Woloshin, Black and Welch1997) instruments provide unique predictive power beyond other cognitive ability instruments either within or across cultures (Cokely & Kelley, Reference Cokely and Kelley2009; Galesic & Garcia-Retamero, Reference Galesic and Garcia-Retamero2010; Garcia-Retamero & Galesic, Reference Garcia-Retamero and Galesic2010a, Reference Garcia-Retamero and Galesic2010b; Liberali et al., Reference Liberali, Reyna, Furlan, Stein and Pardo2011; Okan, Garcia-Retamero, Cokely, & Maldonado, Reference Garcia-Retamero, Okan and Cokelyin press).
A third psychometric issue is that, even if numeracy is compared with other abilities, the observed measurement skew and ceiling effects will complicate comparative evaluations (e.g., intelligence v. statistical numeracy). Consider a recent study designed to investigate the extent to which each of several individual differences (e.g., executive functioning, cognitive impulsivity, numeracy) influenced decision-making competence (Del Missier, Mäntylä, & Bruine de Bruin, Reference Del Missier, Mäntylä and Bruine de Bruin2011; but see also Reference Del Missier, Mäntylä and Bruine de Bruin2010). The study found that numeracy was less related to some decision-making competencies than were measures of executive functioning or cognitive impulsivity, measured by the cognitive reflection test (Frederick, Reference Frederick2005). It is however possible that, at least in part, some measurement ceiling effects in numeracy scores among the college student sample could have limited differentiation of those individuals with the highest levels of numeracy. In contrast, both executive functioning and the cognitive reflection tests are known to provide discrimination even among highly-educated individuals. To be clear, our reading of the individual differences study by Del Missier et al. (Reference Del Missier, Mäntylä and Bruine de Bruin2011) is that it represents precise and careful research using many of the best available methods and tools. However, the potential psychometric limits inherent in the now decade old numeracy test leave open important questions. To the extent that a numeracy instrument does not adequately or accurately estimate variation in the sub-populations of interest it is not an efficient basis for theory development or policy evaluations.
2 Test development and validation
Building on the work of Lipkus et al. (Reference Lipkus, Samsa and Rimer2001) and Schwartz et al. (Reference Schwartz, Woloshin, Black and Welch1997) we aimed to develop a new psychometrically sound statistical numeracy test that could be used with educated and high-ability samples.Footnote 4 Our goal was not to develop a high-fidelity comprehensive test of statistical numeracy or of its sub-skills. Rather, the goal was to develop a brief, valid, and easy-to-use instrument, with improved discriminability. Development of the Berlin Numeracy Test began with pre-testing on a pool of items including all items from both the Lipkus et al. (Reference Lipkus, Samsa and Rimer2001) and Schwartz et al. (Reference Schwartz, Woloshin, Black and Welch1997) tests along with other items that were internally generated. Following a protocol analysis in which participants solved all numeracy problems while thinking aloud (Barton, Cokely, Galesic, Koehler, & Haas, Reference Barton, Cokely, Galesic, Koehler, Haas, Taatgen and van Rijn2009; see also Fox, Ericsson, & Best, Reference Fox, Ericsson and Best2011), we analyzed responses and selected 28 candidate questions for inclusion in the next stage of test development (i.e., 12 original items plus 16 new items).
2.1 Participants
We tested a community sample of 300 participants (57% women) from Berlin, Germany at the Max Planck Institute for Human Development. Participants were primarily current or former undergraduate or graduate students from the Humboldt, Free, and Technical Universities of Berlin. The mean participant age was approximately 26 years old (i.e., 25.86, SD=3.98; range=18–44). Each participant completed about six hours of testing over the course of two to three weeks in exchange for 40 euro (ca. $55).
2.2 Materials and procedure
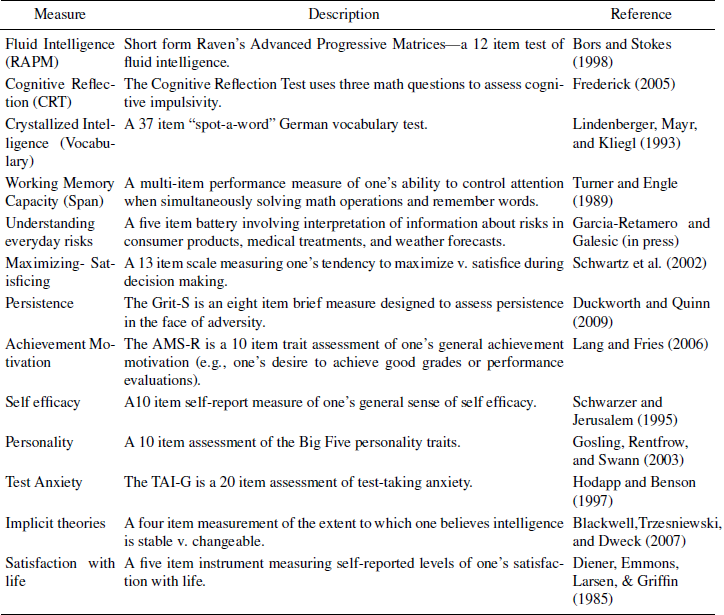
A number of different instruments were used to provide convergent, discriminant, and criterion (predictive) validity for the Berlin Numeracy Test. All comparative instruments are listed and described in Table 1. Participants were tested in three separate phases. In phase 1, all participants were tested individually via computer and/or with the assistance of a laboratory technician as required by the particular instrument. The first testing session lasted for approximately two hours and consisted primary of cognitive ability instruments and cognitive performance tasks, including assessment of all candidate numeracy items. Note that participants only answered each candidate numeracy question once. During this session calculators were not allowed; however, participants were provided with paper and pens/pencils for notes. In phase 2, participants completed an online assessment from their home including a variety of self-report personality and other survey instruments. All participants agreed to complete the online portion of the study in one session in which they sat alone, in a quiet room. In phase 3, participants returned about two weeks after their first session and completed another two hours of testing. All participants were again tested individually via computer and/or with the assistance of a laboratory technician as required by the particular instrument/task. The final two hours of testing involved new cognitive performance tasks including a battery of everyday risky decision-making comprehension questions that served as a means of assessing predictive validity (Galesic & Garcia-Retamero, submitted; Garcia-Retamero & Galesic, Reference Garcia-Retamero, Okan and Cokelyin press).
2.3 Test construction and test items
Performance quartiles for all participants were assessed according to performance on all 28 candidate statistical numeracy questions (i.e., 12 questions from the Lipkus et al., Reference Lipkus, Samsa and Rimer2001 set, plus 16 new questions). A subset of five questions with a 4-level tree structure was identified using the categorization tree application from the predictive modeling and forecasting software DTREG (Sherrod, Reference Sherrod2003). The tree structure was constructed such that participants arriving at each branch of the tree had approximately a 50% probably of answering correctly/incorrectly. The test’s tree structure was subjected to cross-validation and showed less than 10% misclassification.Footnote 5 Subsequent analyses indicated that reducing the 4-level solution to a simpler 3-level solution (i.e., removing one problem) did not affect test classification performance or validity yet reduced test-taking time (i.e., 10% reduction), increased test format flexibility (i.e., simplified paper-and-pencil format scoring), and provided improved discriminability among new samples (see “cross-cultural discriminability” below). All final Berlin Numeracy Test formats are based on the four questions used for the optimal 3-level categorization tree as follows (answers provided in each blank):
1. Out of 1,000 people in a small town 500 are members of a choir. Out of these 500 members in the choir 100 are men. Out of the 500 inhabitants that are not in the choir 300 are men. What is the probability that a randomly drawn man is a member of the choir? Please indicate the probability in percent. ___25%___
2a. Imagine we are throwing a five-sided die 50 times. On average, out of these 50 throws how many times would this five-sided die show an odd number (1, 3 or 5)? __30__ out of 50 throws.
2b. Imagine we are throwing a loaded die (6 sides). The probability that the die shows a 6 is twice as high as the probability of each of the other numbers. On average, out of these 70 throws how many times would the die show the number 6? ___20___out of 70 throws.
3. In a forest 20% of mushrooms are red, 50% brown and 30% white. A red mushroom is poisonous with a probability of 20%. A mushroom that is not red is poisonous with a probability of 5%. What is the probability that a poisonous mushroom in the forest is red? ___50%___
2.4 Test formats and scoring
Different research environments have different constraints such as computer-access, group-testing options, data-security requirements, etc. Accordingly, we designed the test to be flexible, offering multiple formats (for the multiple choice test see the “A Multiple Choice Format” section). A test format recommendation system is available online at http://www.riskliteracy.org. This system asks 1–4 questions (e.g., how much time is available for testing; what type of sample will you test) in order to recommend appropriate formats and provide sample materials.
2.4.1 Computer adaptive test format
In this format, 2–3 questions (of 4 possible questions) are asked to participants (Appendix II). Questions are adaptively selected based on participants’ past success in answering previous questions (see Figure 1 for test structure). The adaptive structure means that all questions have about a 50% probability of being answered correctly with subsequent questions adjusted on the basis of participants’ prior answers. If an answer is correct/incorrect then a harder/easier question is automatically provided. A participant’s skill-level can then be determined from answers to 2–3 questions in roughly half the time normally required for the Lipkus et al. (Reference Lipkus, Samsa and Rimer2001) numeracy test (less than three minutes; see Table 2). To facilitate access, the computer adaptive Berlin Numeracy Test is available online in a format that automatically scores participants’ responses and reports data to researchers in terms of estimated participant quartile scores. Scores are typically batched such that the researcher requests a certain number of test scores and when that number is reached the full results are emailed. The test can be found at www.riskliteracy.org, which also provides access via other internet ready devices (e.g., smart phones). The online forum allows the public to complete the test and receive feedback on their performance relative to others, along with information about potential challenges they may face when making risky decisions. However, before completing any online test items, the adaptive test seamlessly redirects participants to a secure online server. All Berlin Numeracy Test data collection is managed and hosted via the Unipark survey software system designed for academic research (www.unipark.de). We request that researchers use the computer adaptive test format whenever possible as this format provides an efficient balance between speed and psychometric accuracy, and also allows us to continue to collect data that can be used to further refine the test.
The structure of the Computer Adaptive Berlin Numeracy Test. Each question has a 50% probably of being right/wrong. If a question is answered right/wrong a harder/easier question is provided that again has a 50% probability of being right/wrong.

a Cronbach’s alpha cannot be computed. Principal component analysis indicates that the four items used in Berlin Numeracy Test all loaded highly on a single factor explaining 45% of variance.
b Approximately 50%, conditional on previous responses.
2.4.2 Traditional (paper and pencil) format
The alternative, traditional format (Appendix III) requires that participants answer all four questions from the Berlin Numeracy Test in sequence. Scoring involves totaling all correct answers (i.e., 0–4 points possible). In this format the structure of the adaptive test is ignored, although the adaptive scoring algorithm can be applied following data collection as might be useful (e.g., to estimate quartiles compared to available norms for college educated samples). This alternative (traditional) format may be useful when computerized testing is impractical, such as in group testing or when computer access is limited. Testing requires about as long as the original Lipkus et al. (Reference Lipkus, Samsa and Rimer2001) numeracy test (i.e., less than 5 minutes).
2.4.3 Single-item (median) format
In cases where time is extremely limited, it is possible to use only the first item of the test (question 1) as a means of estimating median splits (Appendix IV). Those who answer the question right are estimated to belong to the top half of educated participants while all others are assigned the bottom half. Given the relatively small time savings over the adaptive format we recommend this option be avoided in favor of the computer adaptive version whenever practical. Generally, this test format takes about as long as the Schwartz et al. (Reference Schwartz, Woloshin, Black and Welch1997) instrument (i.e., about 1 minute).
2.5 Results and discussion: Psychometric properties
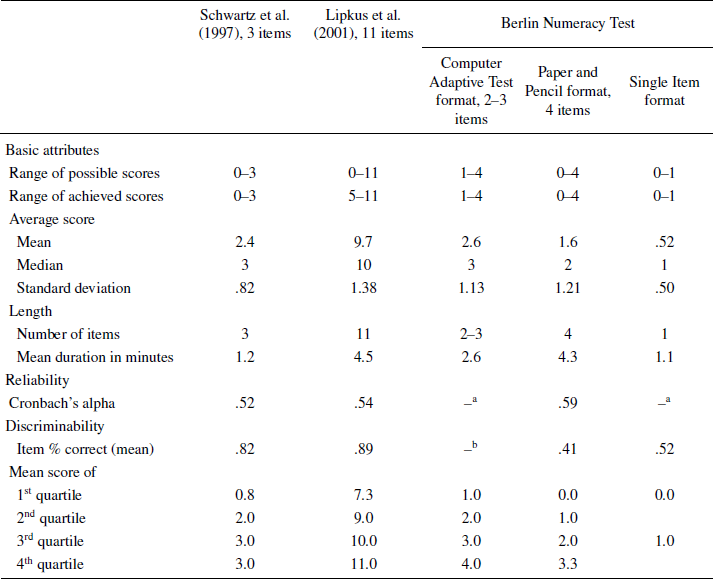
Results of psychometric analyses are presented in Tables 2–4. Three formats of the Berlin Numeracy Test—i.e., Computer Adaptive, Traditional Paper and Pencil, and Single Item—are compared with the standard numeracy test by Lipkus et al. (Reference Lipkus, Samsa and Rimer2001) as well as with the brief three item test by Schwartz et al. (Reference Schwartz, Woloshin, Black and Welch1997).
2.5.1 Basic attributes
In our educated sample, scores on the Lipkus et al. (Reference Lipkus, Samsa and Rimer2001) numeracy scale show dramatic negative skew (Table 2). Although possible scores range from 0 to 11, the lowest observed score was 5 (45% correct). Both the mean and median are close to the measurement ceiling (i.e., 88% and 91% correct, respectively). Similar levels of skew are observed for the Schwartz et al. (Reference Schwartz, Woloshin, Black and Welch1997) test. In contrast, scores on the Berlin Numeracy Test are distributed evenly across the whole range of possible scores regardless of format. Estimates of internal consistency for the Berlin Numeracy Test show some modest improvement over other existing numeracy tests. However, as is common for very short tests, the Cronbach’s alpha level of all numeracy tests was below the typical .7 aspiration level.Footnote 6 A principal axis factor analysis of the four items from the Berlin Numeracy Test indicated that all items loaded highly on a single factor explaining 45% of the observed variance. An additional study at Michigan Technological University found that, when the test was taken two different times, five days apart, it showed high levels of test-retest reliability, r(11)=.91, p=.001. All Berlin Numeracy Test formats also typically take less time to complete than the Lipkus et al. (Reference Lipkus, Samsa and Rimer2001) numeracy test.
2.5.2 Convergent and discriminant validity
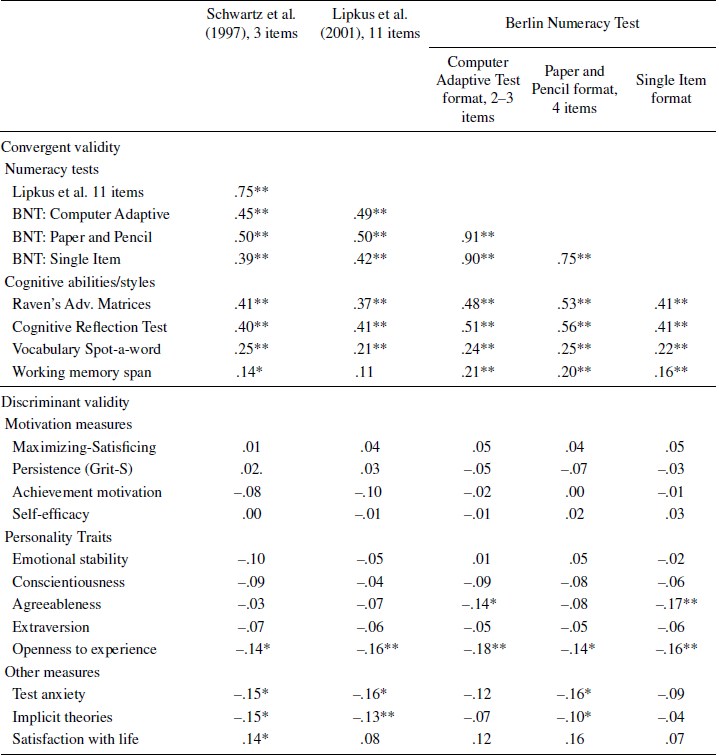
If the Berlin Numeracy Test is successful in assessing levels of statistical numeracy, it should correlate with other numeracy tests and with measures of cognitive ability (i.e., convergent validity). Moreover, to the extent the Berlin Numeracy Test primarily measures statistical numeracy it should not correlate with essentially unrelated constructs, such as motivation, personality, beliefs, or attitudes (i.e., discriminant validity). As Table 3 shows, both requirements—high correlations with related constructs and low with unrelated constructs—are satisfied for all three forms of Berlin Numeracy Test.Footnote 7
* p=.05;
** p<.01.
2.5.3 Predictive validity
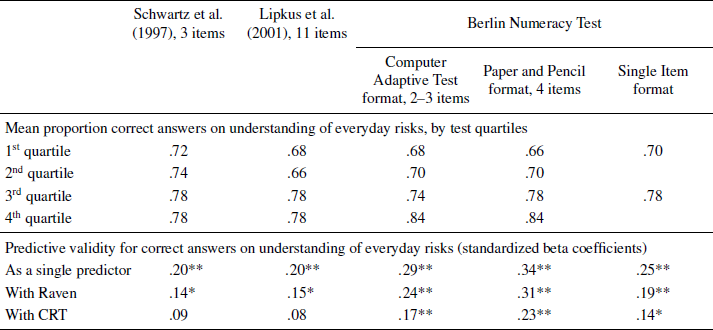
One of the intended purposes of the Berlin Numeracy Test is predicting people’s understanding of information about risk in consumer, medical, and everyday contexts—i.e., predicting risk literacy. To investigate the predictive validity of the Berlin Numeracy Test, we administered a short battery of items dealing with information about everyday risks related to common consumer, health, and medical choices (e.g., evaluating the efficacy of toothpastes and cancer screenings), as well as information about probabilities typically used in weather forecasts (Garcia-Retamero & Galesic, Reference Garcia-Retamero, Okan and Cokelyin press; see Appendix for examples). Table 4 shows correlations of different numeracy tests with the overall accuracy of interpretations of these items. All formats of the Berlin Numeracy Test were superior to the previous numeracy tests. Both the Computer Adaptive test and the Paper and Pencil format doubled the predictive resolution of the previous tests. When either of these formats was included in the model the previous numeracy tests lost all of their unique predictive power. We next investigated the extent to which the Berlin Numeracy Test explained additional variance in risk understanding controlling for the strongest alternative predictors of performance—i.e., fluid intelligence and cognitive reflection. As Table 4 shows, all formats of the Berlin Numeracy Test explain a substantial portion of additional variance after these others tests are included in a hierarchical regression model.Footnote 8 In contrast, both previous numeracy tests lose most (or all) of their predictive power when intelligence or cognitive reflection tests are included. Overall, results indicate that the Berlin Numeracy Test is a reliable and valid test of statistical numeracy and risk literacy, offering higher levels of discriminability and overcoming the major psychometric limitations of the Lipkus et al. (Reference Lipkus, Samsa and Rimer2001) test and Schwartz et al. (Reference Schwartz, Woloshin, Black and Welch1997) tests.
* p<.05;
** p<.01
3 Additional validation studies
3.1 Cross-cultural discriminability
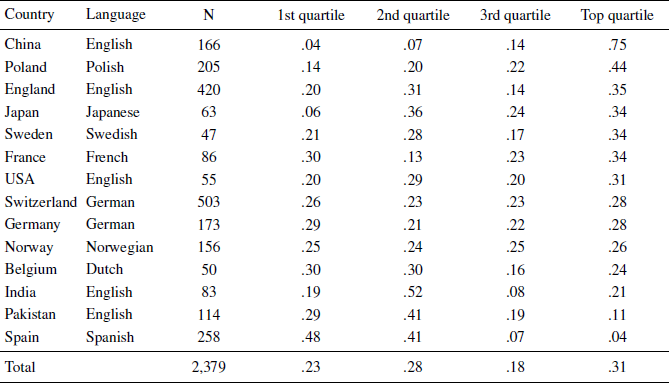
The initial validation of the Berlin Numeracy Test was completed on a sample of highly-educated people living in a major metropolitan city in Germany. As a means of out-of-sample validation, we sought to assess the extent to which test discriminability generalized to other highly-educated samples from different cultures, presented in different languages. Specifically, we examined test performance in studies conducted in 15 different countries with diverse cultural backgrounds. Studies were conducted by different research groups, examining college student samples at research-active universities, primarily testing participants from introduction to psychology participant pools. Studies were conducted in China (Tsinghua University), England (University College London), France (Universite de Lausanne), Germany (Max Planck Institute for Human Development), India (Thapar University), Japan (University of Tokyo), the Netherlands (Katholieke Universiteit Leuven), Norway (University of Oslo),Footnote 9 Pakistan (University of Punjab), Poland (Wroclaw University), Portugal (University of Porto),Footnote 10 Spain (University of Granada), Sweden (Uppsala University), Switzerland (University of Basel), and the United States (Michigan Technological University).Footnote 11 In total, additional data from n=2685 college students was examined. All reported data are scored via the adaptive Berlin Numeracy Test algorithm, where 2–3 questions (out of 4) are used to estimate statistical numeracy quartiles for each participant.Footnote 12
Overall results show the test generally discriminated within desirable tolerances (i.e., pm 10%) for each quartile (Table 5). Aggregating across samples, the mean test score was 51.7% correct, which closely approximated the ideal score of 50%. This score indicates that on average the first test item of the Berlin Numeracy Test achieved the intended 50% discriminability. We also observed some modest underestimation of the third quartile and commensurate overestimation in the top quartile. In part, higher top quartile scores may reflect the fact that several of our samples were collected from elite universities and selective technical/engineering universities (e.g., University College London; Tsinghua University). Visual inspection shows some specific positive and negative skewing of scores across various countries.Footnote 13 For example, Spain, Pakistan, and India all show moderate positive skew. In contrast, the highest performing sample, which was collected in China, showed very strong negative skew. Taken together, aggregated scores closely approximated the intended quartiles. The observed distributions indicate that with only 2–3 statistical numeracy questions the Berlin Numeracy Test achieves good discriminability across most countries even when presented in different languages or when used at elite or technological universities.
3.2 Physician assistants
One goal for the Berlin Numeracy Test is to offer an instrument that can quickly assess statistical numeracy and risk literacy in highly-trained professionals. Of particular interest are those professionals who commonly make risky decisions and communicate risks. One such group in the United States is physician assistants. Physician assistants are independently licensed medical professionals who work under the supervision of physicians in all medical subspecialties (e.g., emergency medicine, family practice, surgery). Physician assistants independently diagnose and treat patients, and provide care similar to that provided by a physician, with professional training typically involving two or three years of post graduate study and clinical rotations.
Previous studies of physicians-in-training in the UK (Hanoch et al., Reference Hanoch, Miron-Shatz, Cole, Himmelstein and Federman2010) revealed dramatic skew in responses to the Lipkus et al. (Reference Lipkus, Samsa and Rimer2001) test. Specifically, in one sample of physicians-in-training, Hanoch and colleagues found that the average Lipkus et al. test score was 95% correct, with 64% of participants answering all questions correctly. Here, we assessed performance of the Berlin Numeracy Test by administering a paper and pencil format to a group of physician assistant students (n = 51) who were completing their final semester of training at the University of Oklahoma.Footnote 14 Results revealed slight positive skew (.16) suggesting the test was well calibrated, if somewhat difficult. A similar distribution was observed when the adaptive scoring algorithm was applied (Table 6). The mean adaptive test score was 44.3% correct, which reasonably approximated the ideal score of 50%. Note that, in contrast to other highly-educated samples, these data show some central clustering of scores. To the extent this pattern generalizes it suggests physician assistants are less likely to have very low levels of statistical numeracy, as would be expected. Overall, results indicate that the Berlin Numeracy Test is well suited for use with these and other highly-educated professionals who are often charged with interpreting and communicating risks. Ongoing research is assessing test performance among other diverse professional groups (e.g., dieticians, financial advisors, judges, lawyers, physicians, professional athletes, and poker players).

3.3 Numeracy in the general population: Data from Sweden
The Berlin Numeracy Test was designed to estimate differences in risk literacy among educated individuals. Considering the observed skew in scores from the Lipkus et al., (Reference Lipkus, Samsa and Rimer2001) test, the Berlin Numeracy Test may also be suitable for use among general, non-highly educated populations. As part of a larger validation and translation study, data were collected from a quota sample of adults living in the Uppsala area of Sweden (ages 20–60) who were matched against the known population on age and gender (Lindskog, Kerimi, Winman, & Juslin, Reference Lindskog, Kerimi, Winman and Juslin2011).Footnote 15 Approximately 370 of 2000 potential participants responded to a request for participation, of which 213 were selected for testing in the current study. Of the 213 participants included in this sample approximately 30% had only high-school education with 20% completing a masters degree or higher. The test was presented in Swedish and was administered using the adaptive format. Results show the average test score was 48.8% correct, which closely approximated the theoretically ideal score of 50%. Distributions of estimated quartiles were somewhat concentrated around the middle quartiles, particularly quartile two (Table 6).
In addition to the Berlin Numeracy Data, data were also collected for the Lipkus et al., (Reference Lipkus, Samsa and Rimer2001) test. As expected, results showed marked skew in scores with an average score of 83.5% correct and clear negative skew (-1.94). We next compared these Lipkus et al. test scores with other data from previous studies that had been collected using probabilistic, representative sampling in the USA and Germany (Galesic & Garcia-Retamero, Reference Galesic and Garcia-Retamero2010). Results indicate that this sample of Swedish residents’ scores showed considerably more negative skew reflecting significantly higher levels of statistical numeracy compared to the populations in Germany, t (1209)=9.29, p = .001 (skewness = –.55), or the USA, t (1375) = 13.51, p = .001, (skewness = –.33).
Overall, results indicate that the Berlin Numeracy Test is well suited for estimating numeracy among some segments of the general population of Sweden or other similar community samples. However, because the current sample from Sweden is more numerate than that of either the USA or Germany, we can expect some positive skew in representative samples of the general population from the US, Germany, or other similar countries. Accordingly, when assessing statistical numeracy in representative samples of the general population we suggest including at least one other test in addition to the Berlin Numeracy Test (e.g., Weller et al., Reference Weller, Dieckmann, Tusler, Mertz, Burns and Peters2011). One promising strategy that adds only about 1 minute in testing time is to combine the three item Schwartz et al. (Reference Schwartz, Woloshin, Black and Welch1997) test with the Berlin Numeracy Test (for an example see the next section on web panel data). Ongoing studies are examining this strategy in representative samples of residents of the USA.
3.4 United States web panel data from Mechanical Turk
Behavioral scientists are increasingly using paid web panels for data collection and hypothesis testing. One popular option for data collection is Amazon.com’s Mechanical Turk Web Panel (for a review see Paolacci, Chandler, & Ipeirotis, Reference Paolacci, Chandler and Ipeirotis2010). The first published study to assess numeracy among participants from Mechanical Turk was published in 2010 (Paolacci et al., Reference Paolacci, Chandler and Ipeirotis2010). In this study, Paolacci and colleagues assessed numeracy using the subjective numeracy scale (Fagerlin et al., Reference Fagerlin, Zikmund-Fisher, Ubel, Jankovic, Derry and Smith2007), which is known to correlate with the objective Lipkus et al. (Reference Lipkus, Samsa and Rimer2001) test (Paolacci et al., Reference Paolacci, Chandler and Ipeirotis2010). Results revealed an average subjective numeracy score of 4.35 (67% of maximum), which is similar to previously reported scores (e.g., participants recruited from a university hospital showed a modest skew (–.3); see Fagerlin et al., Reference Fagerlin, Zikmund-Fisher, Ubel, Jankovic, Derry and Smith2007). Similarly, we recently investigated numeracy using the Schwartz et al., (Reference Schwartz, Woloshin, Black and Welch1997) test on a convenience sample from Mechanical Turk (n =250) (Okan, Garcia-Retamero, Galesic, & Cokely, in press). Consistent with results from the subjective numeracy test, results revealed moderate negative skew (-1.2), indicating an average score of 2.11 (i.e., 70% correct). A total of 42% of the sample also answered 100% of the questions correct.
To evaluate the performance of web panelists on the Berlin Numeracy Test we administered an adaptive test to a large Mechanical Turk web panel sample (n=1612). All reported data were scored via the adaptive algorithm, where 2–3 questions (out of 4) were used to estimate statistical numeracy quartiles for each participant. As anticipated, we observed positive skew (.90) in the sample scores indicating that the test was moderately difficult.Footnote 16
In the previous web panel studies we observed positive and negative skew for the Berlin Numeracy Test and the Schwartz et al. (Reference Schwartz, Woloshin, Black and Welch1997) test, respectively. It stands to reason that combining the two tests would yield a better distribution, providing increased discriminability. Therefore, we conducted a new study including both the Schwartz et al. test and the Berlin Numeracy Test with participants on Mechanical Turk (n=206). When scored separately, we replicated the negative (–.62) and positive (.48) skewing of scores on the two tests. However, simply adding the two scores together yielded a normal distribution with no evidence of skew (–.016). In summary, results suggest that combining the Berlin Numeracy Test with the Schwartz et al. test provides a very fast assessment (< 4 minutes) with good discriminability. This combined assessment is well suited for use with Mechanical Turk and should also be appropriate for estimating the wider range of differences in statistical numeracy that exist in samples of the general population.
3.5 A multiple choice format
In some cases researchers may require more flexibility than the current Berlin Numeracy Test formats provide. For example, many psychometric tests are given in a multiple choice format. Unfortunately, providing potential answers to participants increases the benefits of guessing. With four options, guessing would be expected to yield a score of approximately 25% correct. In contrast, in all other “fill in the blank” formats of the Berlin Numeracy Test, the contribution of a guessing parameter is essentially zero. To address this issue, multiple choice test format development began with an analysis of patterns of incorrect responses to previous tests from participants in the aforementioned Mechanical Turk study (n=1612). For each question, we listed the most frequently given incorrect options (each recorded in 8–20% of incorrect answers). Then, for each Berlin Numeracy Test question we included the correct answer, the two most frequent incorrect answers, and a “none of the above” option (Appendix V).
Next, we collected data from participants at the Michigan Technological University (n=269). Participants included convenience samples primarily from departments of Psychology, Mechanical Engineering, and Computer Science. The majority of participants were undergraduate students, with a small proportion of the sample composed of either graduate students or faculty. Participants were either sent a link asking them to complete a survey via internal listservs or tests were administered in classes. Participants were presented with one of two versions of the multiple choice format differing only in the wording of one problem (Appendix V).Footnote 17 This manipulation was conducted because we received feedback that some professional groups may be more willing to participate if questions seemed related to their areas of expertise (e.g., some medical doctors will see more face validity in questions about genetic mutations as compared to choir membership). Accurate responses to the new (M=.56) v. old (M=.60) items did not significantly differ χ 2 (1) = .259. Distributions of scores also did not significantly differ between tests, t(267)=1.383, p=.17, and so data sets were combined for subsequent analyses. Overall, the mean multiple choice test score was 55% correct, which reasonably approximated the ideal score of 50%. Analysis of distributions of responses indicated the multiple choice format showed no skew (–.006). Results indicate that the multiple choice format provided good discriminability and remained well balanced even when used with highly numerate individuals (e.g., computer science students).
4 General discussion
Over the last decade, the Schwartz et al. (Reference Schwartz, Woloshin, Black and Welch1997) and Lipkus et al. (Reference Lipkus, Samsa and Rimer2001) numeracy tests have proven useful and sometimes essential for various aspects of theory development, as well as for applications in risk communication. However, as anticipated by Lipkus and colleagues, in the 10 years since publication of their test, research has identified a number of limitations and opportunities for improvement in measures of statistical numeracy. Building on the work of Lipkus et al. (Reference Lipkus, Samsa and Rimer2001), Schwartz et al. (Reference Schwartz, Woloshin, Black and Welch1997), and many others (e.g., Peters et al., Reference Peters, Västfjäll, Slovic, Mertz, Mazzocco and Dickert2006, Reference Peters, Hibbard, Slovic and Dieckmann2007b; Reyna et al., Reference Reyna, Nelson, Han and Dieckmann2009), we have developed a flexible, multi-format test of statistical numeracy and risk literacy for use with diverse samples (e.g., highly-educated college graduates from around the world). Next we turn to discussion of construct validity, underlying cognitive mechanisms, and emerging applications in adaptive decision support.
4.1 Construct validity, limits, and future directions
The Berlin Numeracy Test specifically measures the range of statistical numeracy skill that is important for accurately interpreting and acting on information about risk—i.e., risk literacy. Our studies showed that a very short, adaptive numeracy test could provide sound assessment with dramatically improved discriminability across diverse samples, cultures, education levels, and languages. Content validity is clear in the types of questions included in the test—i.e., math questions involving ratio concepts and probabilities. Convergent validity was documented by showing high intercorrelations with other numeracy tests, as well as with other assessments of general cognitive abilities, cognitive styles, and education. Discriminant validity was documented by showing the test was unrelated to common personality and motivation measures (e.g., uncorrelated with emotional stability or extraversion). Criterion validity was documented by showing that the Berlin Numeracy Test provided unique predictive validity for evaluating both numeric and non-numeric information about risks. This unique predictive validity held when statistically controlling for other numeracy tests and for other general ability and cognitive-style instruments. Taken together, results converge and contribute to our evolving understanding of the construct validity of both numeracy and risk literacy.Footnote 18
Going forward, more research is needed to document the causal connections between numeracy, risk literacy and risky decision making. Theoretically, improving some types of mathematics skills will improve risk literacy and risky decision making. However, the evidence of such benefits along with quantification of the magnitudes of these benefits is surprisingly limited (e.g., how much study time is required to help less numerate individuals overcome denominator neglect? Does the same level of training continue to inoculate participants under conditions of high emotional stress as might be expected in medical decisions?). As well, despite the utility of current theoretical frameworks, our understanding of underlying cognitive mechanisms is still somewhat underspecificed (for discussion see next section). Future studies are likely to benefit by more closely aligning with current research in mathematics and general literacy education, as well as research on mathematics development, mathematics expertise, and training for transfer (Seigler, Reference Siegler1988). Additionally, there is a need for statistical numeracy tests that provide larger item pools and parallel forms that can be administered to the same participants multiple times without inflating test scores (e.g., limiting item familiarity effects). This option for repeated measurement is necessary for the assessment of developmental changes associated with skill acquisition. Related test development efforts are currently underway for the Berlin Numeracy Test.
It is important to again note that the Berlin Numeracy Test is designed specifically for educated and highly-educated samples (e.g., college students; business, medical, and legal professionals). Discriminability will be reduced when assessing individuals who have lower levels of educational attainment (e.g., the Berlin Numeracy Test may show some positive skew in samples of high school students or among older adults). When this is a concern, researchers can include an additional instrument such as the fast three item test by Schwartz et al. (Reference Schwartz, Woloshin, Black and Welch1997). The results of our Mechanical Turk web panel study show that this strategy can produce excellent discriminability with virtually no skew, estimating variation among relatively low and very high ranges of statistical numeracy.
Because the Berlin Numeracy Test provides a broad estimate of variation in statistical numeracy and risk literacy it is not able to provide a detailed assessment of specific differences in numeracy, such as identifying deficits in reasoning about probability as compared to performing multiplication. This level of analysis is necessary because, although risk literacy is a major concern, numeracy is important for thinking and general decision making well beyond its influence on risk comprehension (Peters, in press). Of note, other factor analytic research by Liberali and colleagues (Reference Liberali, Reyna, Furlan, Stein and Pardo2011) indicates that, at least with respect to some risky decisions and some judgments, component numeracy skills (e.g., multiplication vs. probability) can be differentially beneficial.Footnote 19 We also currently do not have any theoretical account systematically linking component numeracy skills and competencies with the many various types of risky decisions people commonly face (e.g., retirement planning v. medical screening decisions, etc.). There is a need for larger scale cognitive process tracing and factor analytic assessments to be conducted across a wider range of numeracy, risk literacy, and risky decision making. Initial studies may benefit by examining relations between established numeracy tests, component math skills, and other established instruments such as the advanced decision making competency tests (Bruine de Bruin, Parker, Fischhoff, Reference Bruine de Bruin, Parker and Fischhoff2007; Parker & Fischhoff, Reference Parker and Fischhoff2005).
Future research will also need to use methods that provide details about the ecological frequencies of problematic risky decisions, including those related to risk literacy, using techniques such as representative sampling (Dhami, Hertwig, & Hoffrage, Reference Dhami, Hertwig and Hoffrage2004). This type of epidemiological data could then be used to start to quantify the relative economic, personal, and social impact of specific weaknesses in numeracy and risk literacy (e.g., when and how often does denominator neglect affect high-stakes vs. lower stakes risky decisions among less numerate individuals; for a related discussion see Garcia-Retamero, Okan, & Cokely, in press). This ecological approach would provide essential input for relative prioritization of different interventions (i.e., which kind of problems do the most harm and which interventions would provide the greatest benefit; for a recent review see Reyna et al., Reference Reyna, Nelson, Han and Dieckmann2009). Of course, given the wide influence of numeracy, analyses will need to be conducted across and within various domains (medicine vs. finance) and sub-domains (e.g., retirement planning versus credit decisions). Because there are many cognitive skills involved in statistical numeracy and risk literacy a test of all component skills may turn out to be prohibitively long, necessitating the use of more complex adaptive testing (Thompson & Weiss, Reference Thompson and Weiss2011). Generally, more comprehensive assessments will also need to address the wide range of cognitive mechanisms that link numeracy, risk literacy, and decision making.
4.2 Underlying cognitive mechanisms
At its core, numeracy refers to one’s ability to represent, store, and accurately process mathematical operations (Peters, in press). As with all complex skills, individual differences in numeracy will reflect the interaction of many cognitive and affective mechanisms that vary by situation. The recent review by Reyna and colleagues (Reference Reyna, Nelson, Han and Dieckmann2009) provides an overview of some of the causal frameworks that are used to understand the relationship between numerical processing and risky decision making. For example, in the psychophysical tradition, theory emphasizes individual differences in the representation of internal mental magnitudes (e.g., linear v. logarithmic). In part, differences in risky decisions result from independent contributions of both evolved and acquired numerical estimation systems. That is, in part individual differences in numeracy reflect differences in one’s intuitive number sense and the affective meaning issued by this sense (Peters, in press; Peters et al., Reference Peters, Slovic, Västfjäll and Mertz2008; Slovic & Peters, Reference Slovic and Peters2006).
A second framework used to understand the relation between numeracy and risky decision making draws on fuzzy trace theory (Reyna, Reference Reyna2004; Reyna & Lloyd, Reference Reyna and Lloyd2006; Reyna et al., Reference Reyna, Nelson, Han and Dieckmann2009). Following traditions in psycholinguistics, fuzzy trace theory explains differences in numerical processing in terms of cognitive representations and memory. Cognition is said to involve simultaneous encoding of verbatim information (“literal facts”) and gist information (“fuzzy meaning or interpretations”) into two separable forms of memory. For example, when evaluating two options with different prices, participants can be shown to encode both verbatim information (e.g., “option one costs $25 dollars and option two costs $0”) as well as gist information (e.g., “the cost is something versus nothing”). Moreover, theoretically, people have a fuzzy-processing preference such that responses tend to be based on one’s gist representation. That is, people tend to base choices on the fuzziest or the least precise representation of numeric information. There is a well developed literature linking fuzzy trace theory to judgment and decision making, including a mathematical model that explains some types of memory illusions and judgment processes. However, there is currently no validated instrument that can be used to assess or predict individual differences in one’s likelihood of relying on gist versus verbatim numeric representations.Footnote 20
A third framework used to understand numeracy involves computational approaches in the information processing tradition of Newell and Simon (Reference Newell and Simon1972), and many others (Anderson, Reference Anderson1982; Reference Anderson1996; Gigerenzer, Todd, & the ABC Research Group, Reference Gigerenzer and Todd1999; Siegler, Reference Siegler1988). A central goal of this tradition is the development of precise, integrative computational models that allow for high-fidelity cognitive simulations (e.g., ACT-R computational models; Anderson Reference Anderson1996, Marewski & Mehlhorn, Reference Marewski and Mehlhorn2011; Schooler & Hertwig, Reference Schooler and Hertwig2005; see also Katsikopoulos & Lan, Reference Katsikopoulos and Lan2011). Accordingly, this tradition relies heavily on cognitive process tracing studies, including studies of reaction times, eye-tracking, information search, and think-aloud protocols (Ericsson & Simon, Reference Ericsson and Simon1980; Schulte-Mecklenbeck, Kuhberger, & Ranyard, Reference Schulte-Mecklenbeck, Kühberger and Ranyard2011). These methods provide data on how cognition unfolds over time, often producing relatively direct evidence about strategies (e.g., heuristics) and essential mechanisms (e.g., the influence of an incorrect understanding of math operations). Cognitive process tracing methods are also thought to be essential components of test construction and construct validation (Cronbach & Meehl, Reference Cronbach and Meehl1995; Messick, Reference Messick1995). Among other virtues these methods avoid the perils of making inferences about specific cognitive processes based on averaged responses. That is, because participants sometimes use different strategies on different trials—and because different people often use different strategies—one cannot reliably identify or infer “the” underlying cognitive strategy because multiple strategies are at play (Siegler, Reference Siegler1987; see also Cokely & Kelley, Reference Cokely and Kelley2009).
Although there is a considerable body of experimental research emphasizing differences in information processing, such as differences in analytical versus intuitive processing,Footnote 21 there are only a few cognitive process tracing studies on statistical numeracy and its relationship to risky decision making (Barton, Cokely, Galesic, Koehler, & Haas, Reference Barton, Cokely, Galesic, Koehler, Haas, Taatgen and van Rijn2009). In one study of decisions in simple risky lotteries, a retrospective think-aloud protocol analysis was used in combination with assessments of decision reaction times and decision performance (Cokely & Kelley, Reference Cokely and Kelley2009).Footnote 22 Results indicated that numeracy and other abilities (e.g., working memory) predicted more normative risky decisions. However, in contrast to theory assuming that more normative decisions resulted from more normative cognitive processes (i.e., calculating expected value), numeracy was shown to predict more elaborative encoding and heuristic search (e.g., transforming probabilities, comparing relative magnitudes, and considering the time required to earn equivalent sums of money). In turn, the differences in elaborative encoding and search (e.g., reaction time) were found to fully mediate the relationship between numeracy and superior risky decision making. Similarly, individuals who score higher on general cognitive ability measures are known to spend more time preparing for tasks and more deliberatively encode task relevant information (Baron, Reference Baron and Underwood1978; 1990; Ericsson & Kintsch, Reference Ericsson and Kintsch1995; Hertzog & Robinson, Reference Hertzog, Robinson, Wilhelm and Engle2005; Jaeggi et al., Reference Jaeggi, Buschkuehl, Jonides and Shah2011; McNamara & Scott, Reference McNamara and Scott2001; Sternberg, Reference Sternberg1977; Turley-Ames & Whitfield, Reference Turley-Ames and Whitfield2003; Vigneau, Caissie, & Bors, Reference Vigneau, Caissie and Bors2005; Jaeggi et al., Reference Jaeggi, Buschkuehl, Jonides and Shah2011; see also Duckworth, Quinn, Lynam, Loeber, & Stouthamer-Loeber, Reference Duckworth, Quinn, Lynam, Loeber and Stouthamer-Loeber2011). Research shows that elaborative encoding causes information in working memory to be stored in long-term memory, thereby freeing-up additional resources and functionally increasing information processing capacity (Cokely, Kelley, & Gilchrist, Reference Cokely, Kelley and Gilchrist2006; Unsworth & Spillers, Reference Unsworth and Spillers2010). Other experimental data also shows that varying encoding and search causes changes in numerical processing and decision making performance (Natter & Berry, Reference Natter and Berry2005; Smith & Windschitl, Reference Smith and Windschitl2011). However, cognitive abilities such as numeracy do not simply result in more complex decision algorithms (Broder, Reference Broder2003; Mata, Schooler, & Rieskamp, Reference Mata, Schooler and Rieskamp2007). Rather, cognitive abilities tend to predict more adaptive allocation of limited cognitive resources, which tends to include more reflective, careful, and elaborative encoding even when decisions are ultimately based on heuristics (Cokely & Kelley, Reference Cokely and Kelley2009; see also Broder, Reference Broder2003; Keller et al., Reference Keller, Cokely, Katsikopoulos and Wegwartwh2010; Mata, Schooler, & Rieskamp, Reference Mata, Schooler and Rieskamp2007).
More research is needed to improve theoretical specification of how and when differences in numeracy will predict differences in encoding and search. One hypothesis is that higher levels of general abilities, including numeracy, are associated with differences in metacognition, which enables greater sensitivity to feedback (Mitchum & Kelley, Reference Mitchum and Kelley2010; see also Flavell, Reference Flavell1979). In turn, better detection of task feedback can give rise to more adaptive decision making as participants may become more likely to exploit cognitive niches (Marewski & Schooler, Reference Marewski and Schooler2011). These metacognitive processes likely include a host of simple heuristics such as (i) double checking, (ii) performance predicting, and (iii) searching for disconfirming evidence—which may be useful components of reflective thinking (for a detailed theoretical account of reflective thinking, see Baron, Reference Baron1985).
The link between abilities and elaborative encoding may in part explain why including the cognitive reflection test in our hierarchical model reduced the strength of the relationship between the Berlin Numeracy Test and risk comprehension (see validation study one). The predictive power of the Berlin Numeracy Test may have decreased because the cognitive reflection test captured shared-variance owing to differences in encoding and search. Research in our laboratories has demonstrated that the cognitive reflection test is sometimes uniquely associated with differences in information search, predicting differences in encoding, memory, and judgment in financial estimation tasks (Cokely, Parpart, & Schooler, Reference Cokely, Parpart, Schooler, Taatgen and van Rijn2009; in preparation). Factor analytic research by Liberali and colleagues indicates that the cognitive reflection test loads on a factor that is distinct from numeracy (Liberali et al., Reference Liberali, Reyna, Furlan, Stein and Pardo2011). This cognitive reflection test factor predicted differences in one’s memory for stimulus items, which in turn was one of the strongest predictors of task performance—consistent with an elaborative encoding account.
Beyond other mechanisms, knowledge of specific mathematical operations and rules is at the heart of numeracy (Buttersworth, Reference Buttersworth, Ericsson, Charness, Feltovich and Hoffman2006). Research shows that major differences in skill and expert performance primarily reflect differences in knowledge and proceduralization of skill caused by differences in deliberate practice (Anderson, Reference Anderson1996; Ericsson, Charness, Feltovich, & Hoffman, Reference Ericsson, Charness, Feltovich and Hoffman2006; Ericsson, Krampe, & Tesch-Römer, Reference Ericsson, Krampe and Tesch-R?mer1993). As with all forms of learning and expertise, skill tends to be domain-specific and generalizes or transfers only to the extent that the skill and the new task involve similar elements (Thorndike & Woodworth, 1901). For example, if a participant had an excellent working knowledge of multiplication then other tasks that involve multiplication would also benefit (e.g., risky decision tasks that require calculation of expected values). As noted, recent factor analytic research indicated that both multiplication and proportion-comprehension skills accouted for unique variance when predicting ratio biases and conjunction/disjunction fallacies (Liberali et al., Reference Liberali, Reyna, Furlan, Stein and Pardo2011).
In summary, individual differences in statistical numeracy and risk literacy result from the complex interaction of many factors including one’s (1) intuitive number sense; (2) gist v. verbatim representations; (3) reflective and elaborative encoding; and (4) skilled understanding of mathematical operations. Moreover, there are likely many other important factors to consider. For example, the initial validation study for the Berlin Numeracy Test indicated that test anxiety was another factor that can be negatively related to test performance. We speculate that in some cases anxiety may reduce motivation to engage in elaborative encoding of numerical information, limiting one’s willingness to practice and develop one’s skills. However, other individuals who do not experience anxiety may instead experience higher levels of affective meaning from numbers which could inspire further encoding, reflection, and learning. In turn, greater levels of elaborative encoding and knowledge may lead to richer and more contextualized (if still imprecise) gist based representations and reasoning. Further research is needed to disentangle and map the interplay of these factors in close connection with specific task characteristics.Footnote 23
5 Conclusions
We make sense of our complex and uncertain world with data about risks that are presented in terms of ratio concepts such as probabilities, proportions, and percentages. Whether patients, consumers, and policy-makers correctly understand these risks—i.e., whether or not they are risk literate—depends in part on their statistical numeracy (see Lipkus et al., Reference Lipkus, Peters, Kimmick, Liotcheva and Marcom2010 for a recent example in medicine). Rather than develop a long or comprehensive test assessing a wide-range of statistical numeracy skills, our efforts here focused on developing a fast test of statistical numeracy that leveraged available computing technology and internet accessibility (e.g., online data collection and scoring; accessible via smart phones and other internet ready devices). We believe this type of technology integration with psychometric refinement is timely given the growing need for assessment of factors that interact with risky decision-making in basic and applied domains (Cokely & Kelley, Reference Cokely and Kelley2009; Lipkus & Peters, Reference Lipkus and Peters2009; Galesic & Garcia-Retamero, Reference Galesic and Garcia-Retamero2010; Garcia-Retamero & Cokely, Reference Garcia-Retamero, Okan and Cokelyin press; Peters et al., Reference Peters, Västfjäll, Slovic, Mertz, Mazzocco and Dickert2006; Reyna et al., 2011).
Looking forward, there are many emerging opportunities to use this and other validated tests to enhance adaptive decision support systems (i.e., custom-tailored risk communication; Lipkus et al., Reference Lipkus, Peters, Kimmick, Liotcheva and Marcom2010). For example, waiting patients or new employees selecting benefits might answer a couple of questions on a tablet computer in order to notify professionals about the appropriate level of subsequent risk discourse necessary for informed decision making. Similarly, following a diagnosis of certain diseases or the introduction of new technologies, interactive information brochures could be accessed online with custom-tailored information adaptively delivered according to one’s level of risk literacy. These instruments hold the promise of not only helping facilitate risk communication but they may also be important for mitigating legal and ethical concerns. An appropriate risk literacy test could provide additional evidence that people who are considering loans or elective surgeries have sufficient numeracy to interpret the risks in the formats that are presented. Of course, there are several promising simple solutions for transparent risk communication like visual aids and natural frequencies that are widely understandable and should be used when practical (Galesic, Garcia-Retamero, & Gigerenzer, Reference Galesic, Garcia-Retamero and Gigerenzer2009; Garcia-Retamero & Cokely, Reference Garcia-Retamero and Cokely2011; Garcia-Retamero et al., Reference Garcia-Retamero, Okan and Cokelyin press; Gigerenzer & Hoffrage, Reference Gigerenzer and Hoffrage1995). Nevertheless, one size cannot fit all—different situations will sometimes require different thresholds of numeracy and risk literacy for accurate understanding and informed decision making (Chapman & Lui, Reference Chapman and Liu2009; Gaissmaier et al., 2011).
Beyond applications in risk communication and adaptive decision support, adaptive tests like the Berlin Numeracy Test may also find use in selecting appropriate interactive tutorials for learning about risk literacy itself. Using adaptive tests can quickly get students to ability-appropriate examples of common errors in risk interpretation (e.g., confusing relative and absolute risk formats). In these cases, tests could help ensure that tutorials are not too hard or too easy, and may limit boredom and frustration. Given the importance of statistical numeracy for economic prosperity and informed citizenship even modest educational benefits may confer considerable valuable. Research on all these topics is ongoing in our laboratories along with efforts to develop other similar fast, adaptive tests (e.g., graph literacy, knowledge of sexual health risks, nutritional knowledge). Across all these endeavors, development and applications should adhere to standards for educational and psychological testing (1999). As new tools, interactive activities, and improved tests become available they will be added to the content on http://www.riskliteracy.org (see also Appelt, Milch, Handgraaf, & Weber, Reference Appelt, Milch, Handgraaf and Weber2011; http://www.sjdm.org/dmidi).
Appendix I: Example of everyday risky decision-making
Weather forecasting (from Gigerenzer, Hertwig, van den Broek, Fasolo, & Katsikopoulos, Reference Gigerenzer, Hertwig, van den Broek, Fasolo and Katsikopoulos2005)
Imagine there is a 30% chance of rain tomorrow. Please indicate which of the following alternatives is the most appropriate interpretation of the forecast.
-
1. It will rain tomorrow in 30% of the region.
-
2. It will rain tomorrow for 30% of the time.
-
3. It will rain on 30% of the days like tomorrow.
The correct answer is (3).
Example 2: Everyday risky decision-making
Zendil–Gum Inflammation (from Garcia-Retamero & Galesic, Reference Garcia-Retamero, Okan and Cokelyin press)
Imagine that you see the following advertisement for a new toothpaste:
Zendil—50% reduction in occurrence of gum inflammation. Zendil is a new toothpaste to prevent gum inflammation. Half as many people who used Zendil developed gum inflammation when compared to people using a different toothpaste.
Which one of the following would best help you evaluate how much a person could benefit from using Zendil?
-
1. The risk of gum inflammation for people who do not use Zendil
-
2. The risk of gum inflammation for people who use a different brand of toothpaste for the same purpose
-
3. How many people there were in the group who used a different toothpaste
-
4. How old the people who participated in the study were
-
5. How much a weekly supply of Zendil costs
-
6. Whether Zendil has been recommended by a dentists’ association for this use
The correct answer is (1).
Appendix II: Adaptive Berlin Numeracy Test format
Go to www.riskliteracy.org for a unique link to a secure adaptive test that can be embedded in your experiment and will automatically score responses. Alternatively, you can program your own adaptive test as follows:
Instructions: Please answer the questions that follow. Do not use a calculator but feel free to use the scratch paper for notes.
[See Figure 1 for adaptive test structure.]
-
1. Out of 1,000 people in a small town 500 are members of a choir. Out of these 500 members in the choir 100 are men. Out of the 500 inhabitants that are not in the choir 300 are men. What is the probability that a randomly drawn man is a member of the choir? Please indicate the probability in percent. ______ %
-
2a. Imagine we are throwing a five-sided die 50 times. On average, out of these 50 throws how many times would this five-sided die show an odd number (1, 3 or 5)? ______ out of 50 throws.
-
2b. Imagine we are throwing a loaded die (6 sides). The probability that the die shows a 6 is twice as high as the probability of each of the other numbers. On average, out of these 70 throws how many times would the die show the number 6? ________out of 70 throws.
-
3. In a forest 20% of mushrooms are red, 50% brown and 30% white. A red mushroom is poisonous with a probability of 20%. A mushroom that is not red is poisonous with a probability of 5%. What is the probability that a poisonous mushroom in the forest is red? ________
Scoring = Based on answers to 2-3 questions following the adaptive structure.
Correct answers are as follows: 1 = 25; 2a = 30; 2b = 20; 4 = 50.
Appendix III: Berlin Numeracy Test traditional paper and pencil format
Instructions: Please answer the questions below. Do not use a calculator but feel free to use the space available for notes (i.e., scratch paper).
-
1. Imagine we are throwing a five-sided die 50 times. On average, out of these 50 throws how many times would this five-sided die show an odd number (1, 3 or 5)? ________ out of 50 throws.
-
2. Out of 1,000 people in a small town 500 are members of a choir. Out of these 500 members in the choir 100 are men. Out of the 500 inhabitants that are not in the choir 300 are men. What is the probability that a randomly drawn man is a member of the choir? (please indicate the probability in percent). ___________ %
-
3. Imagine we are throwing a loaded die (6 sides). The probability that the die shows a 6 is twice as high as the probability of each of the other numbers. On average, out of these 70 throws, how many times would the die show the number 6? ___________ out of 70 throws.
-
4. In a forest 20% of mushrooms are red, 50% brown and 30% white. A red mushroom is poisonous with a probability of 20%. A mushroom that is not red is poisonous with a probability of 5%. What is the probability that a poisonous mushroom in the forest is red? _____________%
Scoring = Count total number of correct answers.
Correct answers are as follows: 1 = 30; 2 = 25; 3 = 20; 4 = 50.
Appendix IV: Berlin Numeracy Test single item (median) format
Instructions: Please answer the questions below. Do not use a calculator but feel free to use the space available for notes (i.e., scratch paper).
-
1. Out of 1,000 people in a small town 500 are members of a choir. Out of these 500 members in the choir 100 are men. Out of the 500 inhabitants that are not in the choir 300 are men. What is the probability that a randomly drawn man is a member of the choir? (please indicate the probability in percent). ___________ %
Scoring = Count total number of correct answers.
Correct answers are as follows: 1 = 25.
Appendix V: Berlin Numeracy Test multiple choice format
Instructions: Please answer the questions below. Do not use a calculator but feel free to use the space available for notes (i.e., scratch paper).
-
1. Imagine we are throwing a five-sided die 50 times. On average, out of these 50 throws how many times would this five-sided die show an odd number (1, 3 or 5)
-
a) 5 out of 50 throws
-
b) 25 out of 50 throws
-
c) 30 out of 50 throws
-
d) None of the above
-
-
2. Out of 1,000 people in a small town 500 are members of a choir. Out of these 500 members in the choir 100 are men. Out of the 500 inhabitants that are not in the choir 300 are men. What is the probability that a randomly drawn man is a member of the choir? Please indicate the probability in percent
-
a) 10%
b) 25%
c) 40%
d) None of the above
-
-
3. Imagine we are throwing a loaded die (6 sides). The probability that the die shows a 6 is twice as high as the probability of each of the other numbers. On average, out of these 70 throws, about how many times would the die show the number 6?
a) 20 out of 70 throws
b) 23 out of 70 throws
c) 35 out of 70 throws
d) None of the above
-
4. In a forest 20% of mushrooms are red, 50% brown and 30% white. A red mushroom is poisonous with a probability of 20%. A mushroom that is not red is poisonous with a probability of 5%. What is the probability that a poisonous mushroom in the forest is red?
a) 4 %
b) 20 %
c) 50 %
d) None of the above
Scoring = Count total number of correct answers.
Correct answers are: 1 = c; 2 = b; 3 = a; 4 = c.


 Open access