1. Introduction
The Bohai Bay Basin (BBB), situated in the eastern part of the North China Platform, is one of the major petroliferous basins in China. It starts from north of Shenyang and terminates in the south around Kaifeng, and covers an area of about 200000 km2 with the Taihang Mountain to its west, the Yanshan Mountain to its north, the Luxi Uplift to its south and the Jiaoliao Uplift to its east (Tian & Han, Reference Tian and Han1991; Tian, Han & Xu, Reference Tian, Han and Xu1992; Allen et al. Reference Allen, Macdonald, Xun, Vincent and Brouet-Menzies1997) (Fig. 1). The basin has a total length of about 1000 km, a maximum width of up to 400 km in its middle part, a width of 50–100 km at its north and south extremities and a general NNE trend (Liu, Reference Liu1987). The basin includes the northern part of the North China Plain, the marine Bohai Bay and the Xialiaohe Plain (Liu & Liu, Reference Liu and Liu1983; Ren et al. Reference Ren, Liu, Qiu, Han and Zhou2008; Gong et al. Reference Gong, Wang, Liu, Li, Han, Li and Cai2008; Qi, Zhou & Wang, Reference Qi, Zhou and Wang2010). Based on the distribution of Paleocene deposits which have a variable thickness (2000–12000 m) (Liu, Reference Liu1987; Ren et al. Reference Ren, Liu, Qiu, Han and Zhou2008; Qi, Zhou & Wang, Reference Qi, Zhou and Wang2010) as well as tectonic features, the Bohai Bay Basin has been previously subdivided into six depressions and four uplifts (Chang, Reference Chang1991; Tian & Han, Reference Tian and Han1991; Allen et al. Reference Allen, Macdonald, Xun, Vincent, Brouet-Menzies, Holdsworth, Strachan and Dewey1998). However, some authors (Guo et al. Reference Guo, Shi, Qiu, Wu, Yang and Xiao2007; Qi & Yang, Reference Qi and Yang2010) have recently subdivided the whole basin into eight depressions and five uplifts/highs (Fig. 1). The eight depressions (Jizhong Depression, JZD; Huanghua Depression, HHD; Jiyang Depression, JYD; Bozhong Depression, CBD; Linqing Depression, LQD; Changwei Depression, CWD; Liaodongwan Depression, LDWD; Xialiaohe Depression, XLHD) and five uplifts (Changxian Uplift, CXU; Xingheng Uplift, XHU; Chengning Uplift, CNU; Haizhong Uplift, HZU; Neihuang Uplift, NHU) are fault-bounded (Fig. 1).
Cenozoic structural map of the Bohai Bay Basin showing the main elements (modified from Qi & Yang, Reference Qi and Yang2010). JZD – Jizhong Depression; HHD – Huanghua Depression; LQD – Linqin Depression; XLHD – Xialiaohe Depression; LDWD – Liaodongwan Depression; JYD – Jiyang Depression; CWD – Changwei Depression; CBD – Central Bohai Depression; DPS – Dongpu Sag; TYG – Tangyin Graben; CXU – Cangxian Uplift; XHU – Xingheng Uplift; NHU – Neihuang Uplift; HZU – Haizhong Uplift; CNU – Chengning Uplift. (1) Shenyang–Weifang strike-slip fault zone; (2) the Huanghua–Dongming strike-slip fault zone; (3) the Baxian–Shulu–Handan strike-slip fault zone; and (4) Taihangshan strike-slip fault zone.

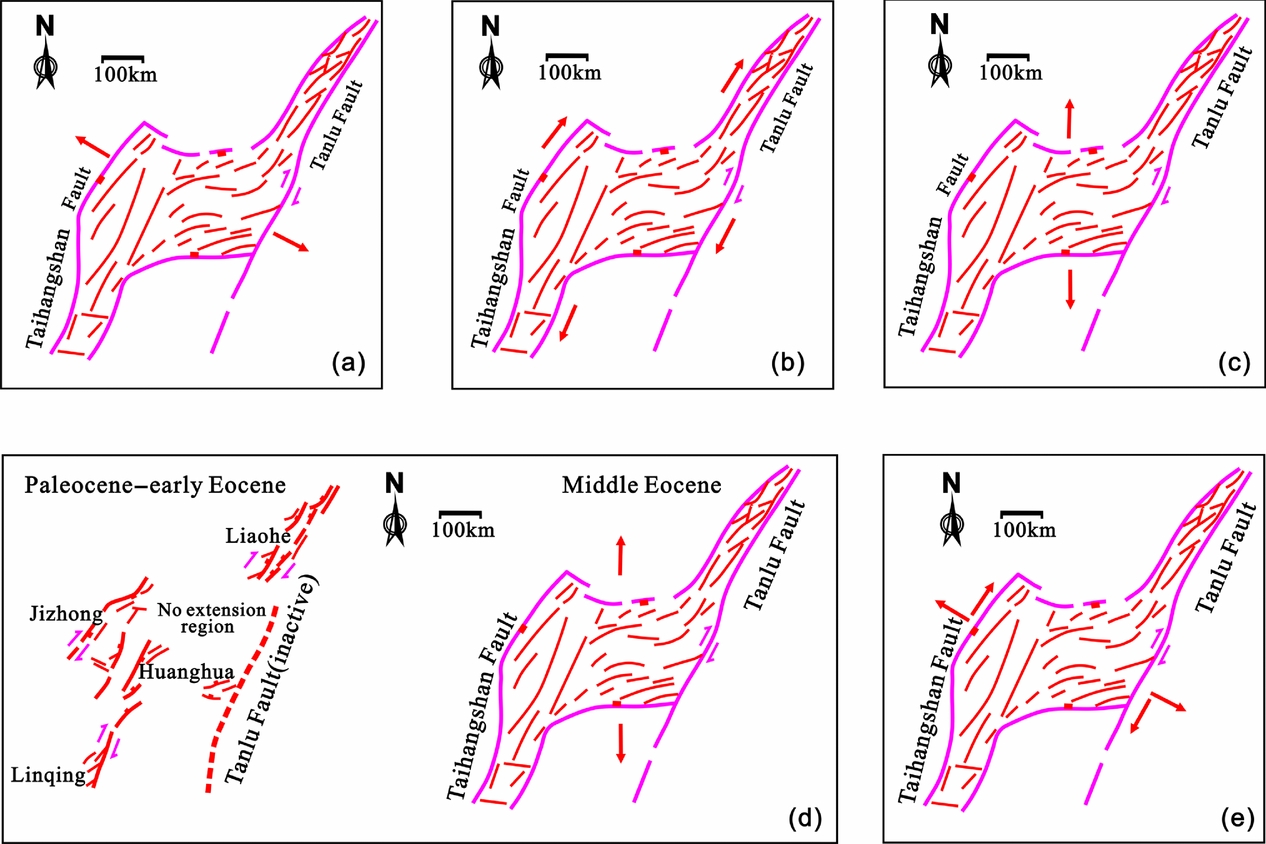
Based on seismic interpretation and regional geological background, five different models have been proposed for the tectonic evolution of the Bohai Bay Basin during Cenozoic time (Fig. 2). Some workers (Li, Reference Li1980; Ye et al. Reference Ye, Shedlock, Hellinger and Sclater1985; Liu, Reference Liu1987; Qi et al. Reference Qi, Lu, Zhang, Yang and Chen1995 a, b, c; Hu et al. Reference Hu, Paul, O'Sullivan and Barry2001; Xu et al. Reference Xu, Gao, Sun and Song2001) proposed a rift basin formed by NW–SE extension during Cenozoic time with little or no strike-slip displacement along the bounding Taihangshan and Tanlu faults (Fig. 2a). The rifting was attributed to NW–SE regional extension induced by mantle convection (Li & Xue, Reference Li and Xue1980; Liu & Liu Reference Liu and Liu1983; Ma et al. Reference Ma, Liu, Wang and Wang1983; Ma, Liu & Su, Reference Ma, Liu and Su1984; Ye et al. Reference Ye, Shedlock, Hellinger and Sclater1985; Liu, Reference Liu1987; Tian & Han, Reference Tian and Han1991), India–Eurasia collision (Molnar & Tapponnier, Reference Molnar and Tapponnier1975; Yin, Reference Yin2000; Liu, Cui & Liu, Reference Liu, Cui and Liu2004) or by roll-back of the subducted Pacific Plate (Ye, Zhang & Mao, Reference Ye, Zhang and Mao1987; Northrup, Royden & Burchfiel, Reference Northrup, Royden and Burchfiel1995; Zhang et al. Reference Zhang, Ma, Yang, Shi and Dong2003; Schellart & Lister, Reference Schellart and Lister2005, Guo et al. Reference Guo, Xia, Chen, Wang, Ding, Wang and Huang2005). Another group of researchers (Klimetz, Reference Klimetz1983; Mann et al. Reference Mann, Hempton, Bradley and Burke1983; Nabelek, Chen & Ye, Reference Nabelek, Chen and Ye1987; Chen & Nabelek, Reference Chen and Nabelek1988) proposed a giant pull-apart basin model to emphasize the significance of strike-slip movements along the NE-trending faults (Fig. 2b). According to this model, the basin is due to right-lateral strike-slip movement along the NE-trending large-scale Taihangshan and Tanlu faults (Hu, Reference Hu1982; Nabelek, Chen & Ye, Reference Nabelek, Chen and Ye1987; Hou, Qian & Song, Reference Hou, Qian and Song1998; Hou, Qian & Cai, Reference Hou, Qian and Cai2001; Hsiao, Graham & Tilander, Reference Hsiao, Graham and Tilander2004). The third model attributed formation of the basin to one phase of Cenozoic N–S extension due to the slab window effect caused by subduction of the ridge between the Kula and Pacific plates (Zhou & Zhou, Reference Zhou and Zhou2006; Zhou et al. Reference Zhou, Zhou, Dong, Wang and Chang2009) (Fig. 2c). Two subsequent N–S phases of dextral transtension scenarios were also proposed for the formation of the BBB (Fig. 2d). This includes early dextral transtension resulting in the formation of isolated rifts (e.g. JZD, LQD, JYD, HHD and XLHD) during Paleocene–Eocene time and a later extension during middle Eocene time, creating the Bozhong Depression (Allen et al. Reference Allen, Macdonald, Xun, Vincent and Brouet-Menzies1997, Reference Allen, Macdonald, Xun, Vincent, Brouet-Menzies, Holdsworth, Strachan and Dewey1998). According to Allen et al. (Reference Allen, Macdonald, Xun, Vincent and Brouet-Menzies1997, Reference Allen, Macdonald, Xun, Vincent, Brouet-Menzies, Holdsworth, Strachan and Dewey1998), these two extension phases were followed by inversion due to E–W compression. The fifth model proposed for the evolution of BBB (Fig. 2e) outlines a rift basin caused by NW–SE extension superimposed by dextral strike-slip movement along several steeply dipping faults. According to this model, extension from the middle Paleocene – late Oligocene period was induced by upwelling of hot mantle material, whereas strike-slip deformation during Oligocene – Miocene time was probably related to a regional stress field induced by plate movement (Zhao, Reference Zhao1984; Wang, Reference Wang1986; Qi & Chen, Reference Qi and Chen1992; Qi et al. Reference Qi, Yang, Chen and Chen1994, Reference Qi, Deng, Zhou and Zhang2008, Reference Qi, Li, Yu and Yu2013; Li, Lu & Shi, Reference Li, Lu and Shi1995; Qi, Reference Qi2004; Yu et al. Reference Yu, Ji, Yang, Yu, Ma and Zhang2007, Reference Yu, Dong, Tong, Xiong and Long2015; Chen et al. Reference Chen, Zhou, Tang, Wang, Lu, Sun and Qu2010; Qi & Yang, Reference Qi and Yang2010; Li et al. Reference Li, Zhao, Liu and Fang2015).
Different kinematic models proposed for the Bohai Bay Basin in Cenozoic. (a) Rift basin caused by NW–SE extension (Ye et al. Reference Ye, Shedlock, Hellinger and Sclater1985; Liu, Reference Liu1987). (b) Giant pull-apart basin (Klimetz, Reference Klimetz1983; Hou, Qian & Song, Reference Hou, Qian and Song1998). (c) Rift basin caused by N–S extension (Zhou & Zhou, Reference Zhou and Zhou2006). (d) Two-phase dextral transtension basin (Allen et al. Reference Allen, Macdonald, Xun, Vincent and Brouet-Menzies1997, Reference Allen, Macdonald, Xun, Vincent, Brouet-Menzies, Holdsworth, Strachan and Dewey1998). (e) Rift basin caused by NW–SE extension superimposed by dextral strike-slip (Qi & Chen, Reference Qi and Chen1992).
Inversion features in Neogene sediments are documented in the different parts of the BBB such as in the Xialiaohe, Jizhong and Jiyang depressions (Yang & Wang, Reference Yang and Wang1985; Wang, Reference Wang1988; Hou et al. Reference Hou, Wu, Li and Yu2009). Some researchers (Zhao & Windley, Reference Zhao and Windley1990; Hu, Wei & Zhang, Reference Hu, Wei and Zhang2002; Su et al. Reference Su, Zhu, Lu, Xu, Yang and Zhang2009) have attributed these inversion structures to the E–W compression caused by the collision of Australia with the Philippine Sea Plate. However, other authors (Chen et al. Reference Chen, Yang, Jia, Sun and Cheng2005; Ma, Qi & Yu, Reference Ma, Qi and Yu2005; Tong, Yu & Geng, Reference Tong, Yu and Geng2008; Li et al. Reference Li, Qi, Tong, Yu and Wang2010, Reference Li, Jia, Chen, Zhang, Wang, Li, Li and Li2013) related the inversion features in the Xialiaohe Depression to Tanlu Fault dextral strike-slip movement.
Analogue modelling has been successfully used to simulate deformation in regions undergoing extension, and has proven to be a powerful tool in providing significant insights into the evolution of extensional regions (Corti, Reference Corti2012). In this study, we present the results of a series of scaled analogue models to provide a different tectonic model for the evolution of the BBB and compare it to previous tectonic models proposed for the basin by other researchers. We also compare model results with seismic sections from the basin to validate our models.
2. Geological setting
The Cenozoic Bohai Bay Basin in east China developed on the pre-Tertiary strata and experienced two major tectonic evolution stages (Allen et al. Reference Allen, Macdonald, Xun, Vincent and Brouet-Menzies1997, Reference Allen, Macdonald, Xun, Vincent, Brouet-Menzies, Holdsworth, Strachan and Dewey1998; Hou, Qian & Cai, Reference Hou, Qian and Cai2001; Hsiao, Graham & Tilander, Reference Hsiao, Graham and Tilander2004, Reference Hsiao, Graham and Tilander2010; Yang & Xu, Reference Yang and Xu2004). During the syn-rift stage, Palaeogene strata including the Kongdian Formation (subdivided into three members), the Shahejie Formation (subdivided into four members) and the Dongying Formation (subdivided into three members) deposited on the faulted basement (Fig. 3). A series of half-grabens and full-grabens filled by non-marine clastic succession developed along major NE-, NEE- and EW-trending fault systems (Huang & Pearson, Reference Huang and Pearson1999; Yang & Xu, Reference Yang and Xu2004; Qi & Yang, Reference Qi and Yang2010). The thickness of the syn-rift sediments ranges from a few thousand of metres to a maximum thickness of 6 km in the Bozhong Depression (Liu, Reference Liu1987; Qi, Zhou & Wang, Reference Qi, Zhou and Wang2010). A thickness of 12 km has been reported in Jiyang Depression (Ren et al. Reference Ren, Liu, Qiu, Han and Zhou2008). During the post-rift thermal subsidence phase, Miocene and Quaternary strata including the Guantao, Minghuazhen and Pingyuan formations, which are up to 4000–5000 m thick, deposited over the whole basin covering the syn-rift successions which were separated by a regional unconformity above the Dongying Formation (Huang & Pearson, Reference Huang and Pearson1999; Hu et al. Reference Hu, Paul, O'Sullivan and Barry2001). Prior to the Guantao deposition, the upper part of the Dongying Formation was subjected to erosion, removing about 300–900 m of sediments (Guo et al. Reference Guo, Ma, Shi, Lu, Zhu, Zhang, Shu and Jia1998; Hu et al. Reference Hu, Paul, O'Sullivan and Barry2001).
Generalized stratigraphy of the Bohai Bay Basin and the main tectonic phases (modified after Allen et al. Reference Allen, Macdonald, Xun, Vincent and Brouet-Menzies1997; Hu et al. Reference Hu, Paul, O'Sullivan and Barry2001; Hao et al. Reference Hao, Zhou, Zhu, Zou and Yang2010). Ek, Es, Ed, Ng and Nm denote Kongdian, Shahejie, Dongying, Guantao and Minghuazhen formations.

The elongate geometry of the Bohai Bay Basin is controlled by extensional fault systems which were mainly developed during middle Paleocene –late Oligocene time, and three strike-slip fault systems (Zhao, Reference Zhao1984; Wang, Reference Wang1986; Qi & Chen, Reference Qi and Chen1992; Qi et al. Reference Qi, Yang, Chen and Chen1994, Reference Qi, Deng, Zhou and Zhang2008, Reference Qi, Li, Yu and Yu2013; Li, Lu & Shi, Reference Li, Lu and Shi1995; Qi, Reference Qi2004; Yu et al. Reference Yu, Ji, Yang, Yu, Ma and Zhang2007, Reference Yu, Dong, Tong, Xiong and Long2015; Chen et al. Reference Chen, Zhou, Tang, Wang, Lu, Sun and Qu2010; Qi & Yang, Reference Qi and Yang2010; Li et al. Reference Li, Zhao, Liu and Fang2015). The extensional fault systems consist of normal faults predominantly trending NE with different attitudes and oblique-slip faults trending NW and WNW. The extensional faults are confined by four NNE-trending right-lateral strike-slip faults including the Tanlu (the Shenyang–Weifang strike-slip fault zone), Lanliao (the Huanghua–Dongming strike-slip fault zone), Shulu–Handan (the Baxian–Shulu–Handan strike-slip fault zone) and Taihangshan large-scale fault zones (Fig. 1). The Tanlu and Taihangshan fault zones define the eastern and western boundaries of the basin, respectively. The other two fault zones, Lanliao and Shulu–Handan, are intrabasinal faults. Each strike-slip fault zone is composed of one or several principal strike-slip fault(s) with secondary structural elements indicating a dextral strike-slip movement (Qi & Yang, Reference Qi and Yang2010). The structural styles of individual strike-slip zones may be different, and in some places an inversion deformation can be recognized in the NE part (the Xialiaohe Depression) of Tanlu Fault Zone (Chen et al. Reference Chen, Yang, Jia, Sun and Cheng2005; Tong, Yu & Geng, Reference Tong, Yu and Geng2008) (Figs 4, 5), whereas in other parts along the strike-slip zones steep strike-slip faults involved in basement exist (Zhu et al. Reference Zhu, Jiang, Zhang and Chen2012; Zhang et al. Reference Zhang, Hao, Dong, Chen, Cui, Yang, Liu, Li, Xu, Huang and Ren2015). Such inversion structures, which developed locally in the Xialiaohe Depression, for example Lengjia reverse fault (Li et al. Reference Li, Jia, Chen, Zhang, Wang, Li, Li and Li2013; Qi et al. Reference Qi, Li, Yu and Yu2013) and Rongxintun reverse fault (Chen et al. Reference Chen, Yang, Jia, Sun and Cheng2005), are clearly depicted on seismic data from the Xialiaohe Depression (Figs 4, 5).
Cenozoic structural map of the Xialiaohe Depression in the NE part of Bohai Bay Basin showing the main structural elements and location of seismic sections shown in Figure 5 (modified from Qi et al. Reference Qi, Li, Yu and Yu2013). For location, see the inset in Figure 1.

Interpretation of seismic profiles across the inversion areas of the western sag of Xialiaohe Depression (for section locations, see Fig. 4). F1 is the Taian–Dawa Fault and F2 is Lengjia Fault.

The dynamics of the Bohai Bay Basin during Cenozoic time is highly debated. Applying the two-stage extension model of McKenzies (Reference McKenzie1978), the Bohai Bay Basin was thought to have experienced the Palaeogene rifting and differential subsidence and Neogene post-rift thermal subsidence (Li, Reference Li1980; Ye et al. Reference Ye, Shedlock, Hellinger and Sclater1985; Hu et al. Reference Hu, Paul, O'Sullivan and Barry2001; Yang & Xu, Reference Yang and Xu2004; Feng et al. Reference Feng, Zhou, Ren, Zheng and Miao2010) (Fig. 3). Based on this model, the basin is interpreted to be a Cenozoic rift basin driven by regional extension induced by mantle convection, or subduction of the western Pacific Plate (Allen et al. Reference Allen, Macdonald, Xun, Vincent and Brouet-Menzies1997, Reference Allen, Macdonald, Xun, Vincent, Brouet-Menzies, Holdsworth, Strachan and Dewey1998; Northrup, Royden & Burchfiel, Reference Northrup, Royden and Burchfiel1995; Zhang et al. Reference Zhang, Ma, Yang, Shi and Dong2003; Yang & Xu, Reference Yang and Xu2004; Schellart & Lister, Reference Schellart and Lister2005). Some authors emphasized the significance of strike-slip movements along the NNE-trending deep fracture zones (Hsiao, Graham & Tilander, Reference Hsiao, Graham and Tilander2004) and interpreted the Bohai Bay Basin as a step-over strike-slip basin (Chen & Nabelek, Reference Chen and Nabelek1988) or a composite pull-apart basin (Nabelek, Chen & Ye, Reference Nabelek, Chen and Ye1987), whereas others emphasize the role of delamination (He, Wang & Han, Reference He, Wang and Han1998; Zhang et al. Reference Zhang, Qian, Wang, Wang, Zhao, Hao and Guo2001) or two-phase extension (Allen et al. Reference Allen, Macdonald, Xun, Vincent and Brouet-Menzies1997, Reference Allen, Macdonald, Xun, Vincent, Brouet-Menzies, Holdsworth, Strachan and Dewey1998).
3. Models
3.a. Set-up and kinematics
In order to simulate the tectonic evolution of the Bohai Bay Basin, layers of sand were placed on two metal plates with releasing bend geometry (Fig. 6). Initially, the plates were placed next to each other in a way that the northern edges (right) were juxtaposed whereas the southern edges (left) were 4.5 cm apart. During deformation, these edges accommodated the extension by oblique slip. The two plates were displaced at an angle of 25° oblique and divergent to the strike-slip margins (Fig. 6). In each experiment, a thin soft plastic sheet measuring 22 cm × 11.5 cm in the step-over was glued beneath the plates to initiate extension. Two fixed bars measuring 22 cm × 1 cm were placed on the soft plastic sheet to simulate the local topographic highs in the basement. A 1.5 cm wide plastic bar was placed in the middle of the west (left) strike-slip zone to facilitate the formation of a structural high. Such a plastic bar was not used in Model 4.
Model set-up showing plan view of basal metal plates used in the models.

In all models, the basal plates were covered by two layers of loose sand (5 mm thick each) simulating pre-kinematic layers (Fig. 3). During extension, additional layers of sand were placed on the surface of the models in order to reproduce the stratigraphic succession in the BBB. The total thickness of the loose sand layers was 40 mm (Fig. 3).
During the model runs, the two basal plates were pulled away from each other in opposite directions by stepper motors at an average rate of 2 cm/h (Fig. 6). The top surface of the models were photographed after every 2 mm of displacement and scanned with a laser after each 4 mm of displacement. The motors were stopped after a total of 5.6 cm extension. The results of five experiments (out of nine) with identical set-ups and initial bulk extension are described in this paper. However, after the initial bulk 5.6 cm extension, these five experiments were deformed differently. In Model 1, after an initial N–S extension, basal plate B was rotated 8° anticlockwise around a pole of rotation and the model was eroded. In Model 2, after an initial N–S extension basal plate B was rotated 5° anticlockwise around a pole of rotation without any erosion. In Model 3, after an initial N–S extension, both plates A and B were pushed towards each other in an E–W direction, resulting in the inversion of the basins. This model simulated one of the proposed tectonic scenarios by Allen et al. (Reference Allen, Macdonald, Xun, Vincent and Brouet-Menzies1997, Reference Allen, Macdonald, Xun, Vincent, Brouet-Menzies, Holdsworth, Strachan and Dewey1998) where an E–W shortening was proposed. Model 4 experienced no rotation and erosion after an initial N–S extension. Model 5 was a test model to simulate one of the tectonic scenarios proposed by Ye et al. (Reference Ye, Shedlock, Hellinger and Sclater1985) and Liu (Reference Liu1987), where they suggested a NW–SE extension without later inversion. This model was extended 5.6 cm in total in a NW–SE direction without any later shortening (Table 1). At their final stages, all models were impregnated with water and serial vertical sections were sliced at 1 cm intervals and photographed.
Kinematics of models presented in this study

3.b. Scaling
The five models presented here are scaled to the BBB geometrically, kinematically and also dynamically. Geometric similarity was obtained by using a thickness ratio of approximately 2.5 × 10⁻⁵ where 1 cm of loose sand in the models represents 2.5 km of sediments in nature. Kinematics similarity was achieved by simulating a sequence of events in the models that closely followed the interpreted evolution history in BBB. As such, based on our interpretation of seismic data and tectonostratigraphic relationships of different sedimentary formations, a two-stage evolution was proposed and mimicked in the models. In the first stage, models were extended in a N–S direction initiating orthogonal extension in the greater BBB, but transtension along the northeastern and southwestern strike-slip faults. This extension/transtension stage is followed by an inversion stage resulting from anticlockwise rotation of the eastern block of BBB relative to its western block. However, in one model (Model 3) a full-scale inversion of the entire basin was simulated by shortening the model in an E–W direction in order to test the tectonic model proposed by Allen et al. (Reference Allen, Macdonald, Xun, Vincent and Brouet-Menzies1997, Reference Allen, Macdonald, Xun, Vincent, Brouet-Menzies, Holdsworth, Strachan and Dewey1998). Sedimentation and erosion were simulated according to what the seismic profiles reveal.
Dynamic similarity was achieved by simulating the physical properties of the sedimentary units of BBB with appropriate modelling materials. In this respect the intrinsic material properties, such as the coefficient of cohesion (τ 0) and the coefficient of internal friction (μ), need to be approximated in the model and in nature (Koyi & Peterson, Reference Koyi and Peterson1993; Weijermars, Jackson & Vendeville, Reference Weijermars, Jackson and Vendeville1993; Koyi, Reference Koyi1997). The angle of internal friction of rocks in the upper crust (<10 km) is averaged to 40° (Brace & Kohlstedt, Reference Brace and Kohlstedt1980), which gives a coefficient of internal friction (μ) of 0.85. The angle of internal friction of the uncompacted loose sand used in the models is 36°, giving a coefficient of internal friction of 0.73 (Koyi, Reference Koyi2001; Koyi & Vendeville, Reference Koyi and Vendeville2003; Maillot & Koyi, Reference Maillot and Koyi2006), which is very close to rocks in the upper crust. Cohesion on the other hand is scaled by equality between the non-dimensional shear strength both in the model and nature:
 $$\begin{equation}
{\left( {\frac{{\rho \,l\,g}}{{{\tau _0}}}} \right)_{\rm{m}}} = {\left( {\frac{{\rho \,l\,g}}{{{\tau _0}}}} \right)_{\rm{n}}}
\end{equation}$$
$$\begin{equation}
{\left( {\frac{{\rho \,l\,g}}{{{\tau _0}}}} \right)_{\rm{m}}} = {\left( {\frac{{\rho \,l\,g}}{{{\tau _0}}}} \right)_{\rm{n}}}
\end{equation}$$
where ρ is density, l is length, g is the acceleration due to gravity and subscripts m and n denote the model and nature, respectively. This non-dimensionalized ratio was calculated for model and nature using the shear strength of sedimentary rocks to range over 1–10 MPa (Hoshino et al. Reference Hoshino, Koide, Lnami, Lwarmura and Mitsui1972). However, Schellart (Reference Schellart2000) reported that values of cohesion of rocks in nature range over 20–110 MPa. For upper crustal rocks, we have taken the cohesion to be 10–20 MPa and the density to be 2550 kg m−3. Our loose sand acquired cohesion during scraping. Its cohesion is approximately 140 Pa and its density is 1550 kg m−3. These figures give the non-dimensional shear strength in equation (1) a value of 1.1 and 3.1–6.3 for model and nature, respectively. However, using higher cohesion for upper crustal rocks (e.g. 50 MPa) reduces the ratio for nature to 1.2, which is the same as that in the models. These two ratios, which are within the same order of magnitude, suggest that our models approximate dynamic similarity with their prototype.
4. Model results
4.a. Plan view evolution
During the initial phases of deformation in Model 1 (0–0.8 cm transtensional displacement), dextral strike-slip faults (f1, f2, f3, f4) developed along the model strike-slip boundary trending NE and four normal faults (f5, f6, f7, f8) were generated along the step-over boundary trending E–W to form two narrow grabens (Fig. 7).
Plan view of different stages of the evolution of Model 1. Top: photographs and (Bottom), line drawing (1, normal fault; 2, reverse fault; 3, strike-slip fault; 4, rotation direction and amount; 5, interpreted fault number; 6, move direction; 7, displacement; 8, section location).

With further extension (between 1.6 cm and 2.4 cm), two new strike-slip faults (f9, f10) parallel to strike-slip boundary developed in the SW part of the basin accompanied by two NE-trending, narrow grabens bounded by faults f1 and f2, respectively, separated by a horst. Three normal faults (f11, f12, f13) trending EW developed in the middle of the step-over areas bounding elongate E–W-trending grabens.
Left-stepping en échelon oblique extensional faults trending NE formed within the strike-slip fault zones during further extension (3.2 cm to 5.6 cm). Normal faults f12 and f13 propagated longitudinally across the centre of the step-over to create a new graben. The normal faults in the step-over area joined the strike-slip faults either through bending into the strike-skip faults or were ‘truncated’ by the strike-slip faults (Fig. 8a).
Scanned images of surface of Model 1 at (a) transtension stage (Paleocene – early Oligocene) and (b) rotation stage (late Oligocene) showing depressions (blue) and structural highs (red). Note in (b) the structural high in the NE and depression in the SW during rotation.

The 8° anticlockwise rotation around a vertical axis, induced after 5.6 cm extension, resulted in inversion of the oblique faults f3 and f4 located within the strike-slip zone between newly formed thrust faults t1 and t2. Strike-slip faults (f2, f9) and normal faults (f7, f8, f12, f13) stayed active due to oblique-slip (Fig. 7), albeit with a lower amount of displacement, locally forming shallow grabens (Fig. 8b).
The transtensional evolution of Model 2 (from start up to 5.6 cm extension) and its inversion afterwards is similar to Model 1 (Fig. 9). However, inversion of Model 3 was initiated by shortening the model in an E–W direction, which was different from that of Model 1 where inversion was initiated due to anticlockwise rotation of the southeastern block relative to the northwestern block. Inversion in Model 3 developed along the northeastern strike-slip faults to generate thrust faults t1, t2 and inverted pre-existing normal faults such as f3, f4. The roughly E–W-trending pre-existing normal faults within the step-over area (f5, f6, f7, f8, f12, f13) were reactivated during this E–W-shortening as strike-slip faults with some normal dip slip, resulting in formation of shallow grabens (Fig. 9).
Plan view photographs and interpretation of the final stage (5.6 cm transtension) of Model 2 (left) and Model 3 (right). The dashed lines show the location of the sections shown in Figures 12–14.

Model 4 has a similar deformation history as Model 1, but did not include a stationary segment at the base of the SW transtension zone (between Taihangshan and Lanliao strike-slip faults in nature). Dextral strike-slip boundary faults (f1, f2, f3, f4) developed along the model boundary trending NE, and six normal faults (f6, f7, f8, f11, f12, f13) trending EW were generated along the step-over boundary to form three narrow grabens (Fig. 10). Unlike Model 1, in this model no narrow graben formed between the strike-slip faults in the SW transtension zone (faults f9 and f14 in Model 1) (Figs 7, 10). The normal faults trending E–W died out at the western end and bent into the strike-slip faults at the eastern end. The horst between faults f9 and f10 was wider than that in Model 1. No inversion was induced in this model, which was not subjected to compression and rotation.
(a) Plan view photograph and (b) interpretation of the final stage (5.6 cm transtension) of Model 4.

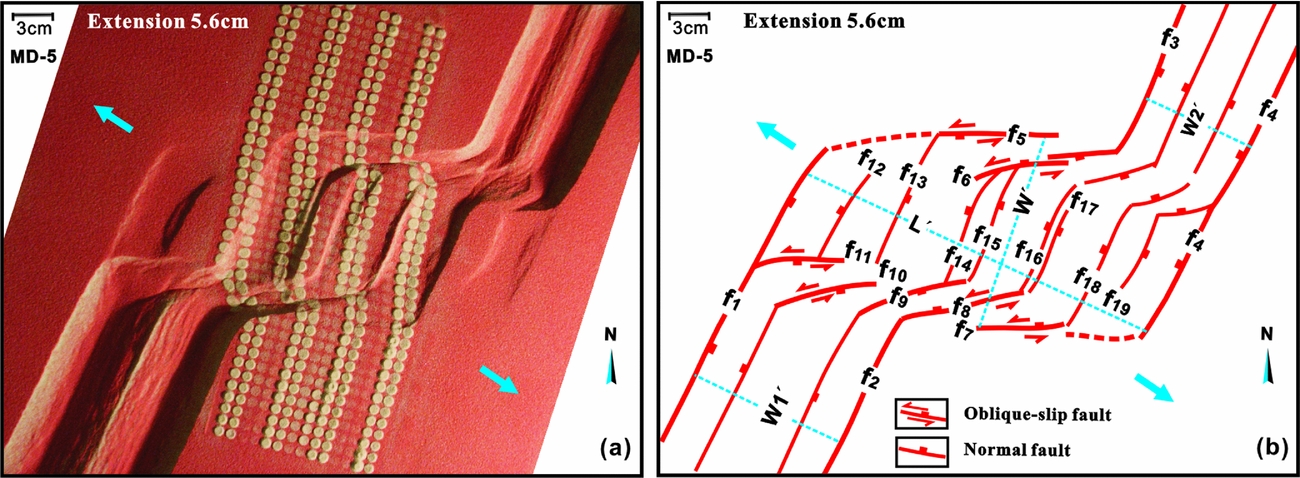
Model 5 simulated one of the tectonics scenarios proposed by Ye et al. (Reference Ye, Shedlock, Hellinger and Sclater1985) and Liu (Reference Liu1987), who suggested a NW–SE extension without later inversion. As such, this model was extended 5.6 cm in total in a NW–SE direction resulting in a different deformation pattern compared to the other four models. Normal boundary faults (f1, f2, f3, f4) trending NNE were generated within both the step-over part of the basin and Xialiaohe and Dongpu areas during extension (Fig. 11a, b). Right-stepping en échelon faults (f5, f6, f7, f8, f9, f10, f11) trending ENE formed two sinistral oblique-slip fault zones along the northern and southern model boundary. Within the step-over area, a number of NNE-trending normal faults (f12, f13, f14, f15, f16, f17, f18, f19) formed several grabens. No inversion was observed in this model.
(a) Plan view photograph and (b) interpretation of Model 5 after 5.6 cm NW–SE extension. Note that the normal faults are trending NNE and the strike-slip/oblique faults trend ENE.
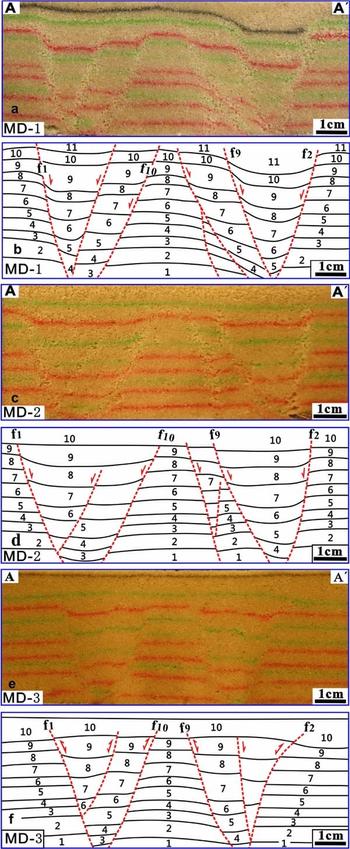
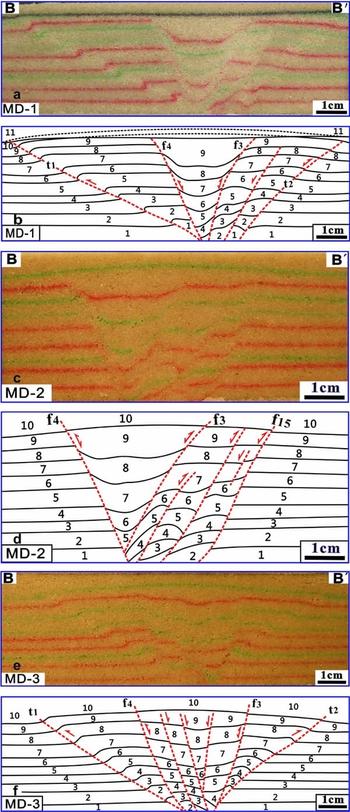
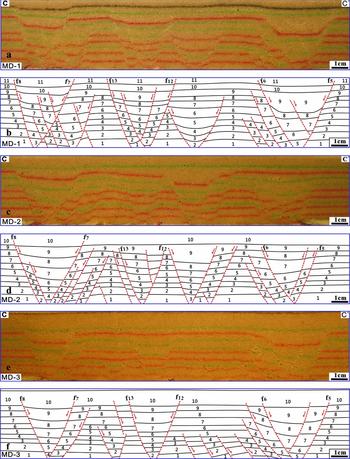
4.b. Vertical sections
Photographs of vertical sections taken from the same location in models 1, 2 and 3 were used to interpret the internal geometry of the models. In the southwestern part, two narrow grabens were separated by one horst formed between the boundary strike-slip faults f1 and f2 during the transtension stage (Fig. 12). During the rotation stage in models 1 and 2 however, faults f2 and f9 were reactivated and formed a narrow graben (Fig. 12a–d). Faults f1 and f10 in Model 1 were also reactivated during this rotation stage, forming a more subtle graben (Fig. 12a, b). However, in Model 3 the graben-bounding faults were inverted during the E–W shortening (Fig. 12e, f). During this inversion, the dip of fault f2 became gentler upwards (Fig. 12e, f).

In the northeastern part in all three models, a narrow graben formed during the transtension stage between the boundary strike-slip faults f3 and f4 (Fig. 13). However, the models showed different inversion structures. Models 1 and 3 show some similarities, but are different from Model 2. In Model 2, no new thrust faults formed during 5° anticlockwise rotation. The shortening due to this rotation was accommodated by inversion of the pre-existing, graben-bounding faults (f3 and f4). The width of the inverted area was about 6 cm. In models 1 and 3 on the other hand, in addition to inversion along the pre-existing, graben-bounding faults, two thrusts formed. As a result, the inverted area widens upwards (width of inversion zone above the graben in models 1 and 3 was about 10 cm). One of the thrusts in Model 1 (t2) used and inverted the lower segment of the pre-existing normal fault but became gentler at shallower level (Fig. 13a, b). All the thrusts solely link to the strike-slip fault at deeper levels.

Within the step-over area, symmetric grabens and horsts bounded by steeply dipping faults were formed (Fig. 14). Some of these faults intersected each other at depth (section CC' in Fig. 14a, b). Some subordinate faults cutting through the lower layers of the horsts developed to form narrow grabens.

5. Discussion
5.a. Comparison between model results and nature
The four transtensional models produced the broadly similar rhomboidal basin in plan view (Figs 7, 9, 10). This basin, which is bounded by strike-slip faults at its east and west margins, mimics some of the main features of the Bohai Bay Basin.
Model results at the final stage of extension are compared to the structural map of the BBB after the Paleocene – early Oligocene extension stage. This tectonic map does not include the inversion stage. Accordingly, the inversion stage in the models was compared to Liaohe area where compression structures are observed on seismic profiles. Below, we compare the results of each model to observations from the BBB in order to test the different proposed tectonic scenarios and determine which of the models correctly simulate the basin.
Model 1, which included the full estimated kinematics of the BBB, is used to outline the structural details of the BBB. Distribution and orientation of both the strike-slip fault zones (such as the Shenyang–Weifang, the Huanghua–Dongming, the Baxian–Shulu–Handan and the Taihangshan) and the major normal faults separating the depressions and structural highs (Figs 1, 15a) in the Bohai Bay Basin are reproduced in the models although in a simplified way (Fig. 15b). The normal faults that intersected the strike-slip faults at the end with acute angles indicate that the dextral transtensional displacements took place.
(a) Cenozoic structural tectonic map of the Bohai Bay Basin showing the main structural elements (modified from Qi & Yang Reference Qi and Yang2010). Fault names are the same as in Figure 1. (b) Line drawing of mapview of Model 1 at the end of extension (at 5.6 cm transtension).

Dimensions of the basal plates were estimated by roughly restoring the step-over area of the BBB to pre-extension state. During model runs, the models were extended to about 48% which is close to the rough estimation of the bulk extension (27–45%, Table 2) in the Jiyang Depression of the BBB. The final dimensions (width W and length L) of the models and the BBB show a good degree of similarity. The ratio (L/W= 1.30) in the step-over area of the BBB is close to the ratio of the model step-over area (L'/W' = 1.40). In addition, the width ratio of the basins in the NE and SW parts of the models (W 1'/W 2' = 1.94) show similar ratios to those in the BBB (W 1/W 2= 1.92).
Extension estimates of different depressions in BBB (for locations of seismic profile, see Fig. 1). ND – no deposition of Kongdian Formation and the fourth member of Shahejie Formation.
Seismic profile 1–8 from Tian & Han (Reference Tian and Han1990); 9–13 from Dong et al. (Reference Dong, Qi, Yang and Yuan2013); 14–18 from Cao (Reference Cao2008); 9–22 from Xiao, Chen & Li (Reference Xiao, Chen and Li2002) and Jiang et al. (Reference Jiang, Xu, Kang, Wang and Wang2007); and 23–25 from Li & Li (Reference Li and Li1994).
Model 1 also shows similarity in distribution and configuration of structural lows and highs with those developed in the Bohai Bay Basin (Fig. 15). The left-stepping en échelon oblique extensional faults within the NE part of the basin simulate similar features in the Xialiaohe (XLHD) and Liaodongwan (LDWD) depressions. However, the Haizhong uplift (HZU) and Changwei Depression (CWD) show a different dimension in the models compared to those seen in the BBB.
5.b. Extension calculation
In order to estimate the total amount of Cenozoic extension for different units of the Bohai Bay Basin, a variety of methods such as balanced section restorations (Liu, Reference Liu1988; Li & Li, Reference Li and Li1994; Xiao, Chen & Li, Reference Xiao, Chen and Li2002; Jiang et al. Reference Jiang, Xu, Kang, Wang and Wang2007; Cao, Reference Cao2008; Dong et al. Reference Dong, Qi, Yang and Yuan2013), trigonometric algorithm (Tian & Han, Reference Tian and Han1990) and calculations of the β factor applying the method of Jackson & White (Reference Jackson and White1989) (Allen et al. Reference Allen, Macdonald, Xun, Vincent and Brouet-Menzies1997) have been used. All of these analyses show that the extension ranges over 9.0–44.5% (Table 2). The average extension of the Jizhong, Huanghua and Jiyang depressions, Dongpu Sag and Tanlu Fault Zone is about 29.78%, 19.84%, 36.85%, 31.97% and 21.17%, respectively. The maximum extension of the Jiyang Depression (c. 44%) and Dongpu Sag (c. 34%) are relatively larger than in other places within the greater BBB. Bulk extension across the Xialiaohe Depression of the NE part of the BBB calculated from restored seismic section reaches up to 29% in some places. These figures do not necessarily represent the bulk extension across the larger BBB due to the lack of regional seismic sections across the entire basin. Extension in the models was slightly larger (48%) before block rotation and partial inversion. However, the total extension percentage across the southwestern and northeastern strike-slip zones was calculated by comparing initial and final widths. Total extension percentage across the southwestern strike-slip zone between faults f1 and f2 is about 41%, which is slightly higher than that in the Dongpu Sag. Total extension across the northeastern strike-slip zone between faults f3 and f4 is about 33%. In general, the amount of extension in the models is higher than that in nature, but still relatively close. The difference could be due to the fact that the extension in BBB has been calculated on seismic sections across segments of the basin, rather than the entire basin.
5.c. Inversion structure analysis
The mechanism responsible for the development of inversion structures in some parts of the Bohai Bay Basin during Cenozoic time is a matter of debate. This is mainly because evidence for inversion is not observed everywhere within the BBB, but only in some parts of the basin (namely in the Jizhong, Xialiaohe and Jiyang depressions). Based on interpretation of seismic sections of the Jizhong Depression, some authors concluded that the Maxi Fault at the foot of the Wenan Slope is a contemporaneous thrust fault which developed during deposition as result of gravity sliding (Yang & Wang, Reference Yang and Wang1985; Wang, Reference Wang1988). The inversion structure in the Jiyang Depression has not been possible to verify from the published seismic data (Hou et al. Reference Hou, Wu, Li and Yu2009). Only those reverse faults which have developed locally in the Xialiaohe Depression (Figs 4, 5) are therefore recognized as ‘typical’ inversion structures, for example the Lengjia reverse fault (Li et al. Reference Li, Jia, Chen, Zhang, Wang, Li, Li and Li2013; Qi et al. Reference Qi, Li, Yu and Yu2013) and the Rongxintun reverse fault (Chen et al. Reference Chen, Yang, Jia, Sun and Cheng2005). Some researchers (Zhao & Windley, Reference Zhao and Windley1990; Allen et al. Reference Allen, Macdonald, Xun, Vincent and Brouet-Menzies1997; Hu, Wei & Zhang, Reference Hu, Wei and Zhang2002; Su et al. Reference Su, Zhu, Lu, Xu, Yang and Zhang2009) have attributed this inversion to the E–W compression caused by the conversion between the Australia and the Philippine Sea plates or India–Eurasia continental collision. However, others (Chen et al. Reference Chen, Yang, Jia, Sun and Cheng2005; Ma, Qi & Yu, Reference Ma, Qi and Yu2005; Tong, Yu & Geng, Reference Tong, Yu and Geng2008; Li et al. Reference Li, Qi, Tong, Yu and Wang2010, Reference Li, Jia, Chen, Zhang, Wang, Li, Li and Li2013) related the inversion to dextral strike-slip movement along the Tanlu Fault.
Since inversion structures have been verified only in the Xialiaohe Depression, it is less likely that the BBB has been subjected to a full-scale inversion. Our interpretation of some of the available industry seismic profiles shows that Xialiaohe Depression has experienced two phases of inversion separated by an erosional episode (Fig. 5). Timing of the inversions is estimated based on thickness change of the sediments interpreted on seismic lines (Fig. 5). The first inversion phase, which seems to have been more rigorous, occurred during late Oligocene time (Ed reflectors in Fig. 5). Mesozoic–Eocene (Mz and Es in Fig. 5) and upper Oligocene (Ed) units show clear evidence of this inversion. The Mz and Es units are folded, whereas lower to middle parts of Ed units are inverted along the boundary faults F1 and F2 (Fig. 5). This inversion phase must have resulted in local uplift and subsequent erosion. In the NE part of Xialiaohe Depression, the entire Ed and upper parts of Es units are eroded (Fig. 5), whereas SW of the Xialiaohe Depression Es units are preserved and only the upper parts of Ed units are eroded (Fig. 5). This variation in the degree of erosion indicates that the first phase inversion must have been more effective in the NE part of the Xialiaohe Depression (and/or that the SW part was a deeper basin before inversion). The erosion phase is followed by deposition of Neogene sediments (Ng and Nm in Fig. 5). These units are inverted along the Taian–Dawa Fault (F1) outlining the second phase of inversion in the Xialiaohe Depression from early Neogene time onwards. There is a substantial thickness change of Guantao and Minghuazhen formations (Ng and Nm in Fig. 5) across the Taian–Dawa Fault (F1). The intensity of this second phase of inversion also decreases towards the SW part of the Xialiaohe Depression (Fig. 5).
In Model 3, which was subjected to E–W compression after it was initially extended, inversion structures were observed in different parts of the model (Fig. 9). These results illustrate that the localized inversion in Xialiaohe Depression in the NE part of Tanlu Fault cannot be attributed to an E–W full compression. The interpretation of seismic profiles traversing the western sag of the Xialiaohe Depression shows that the inversion only developed within the boundary fault zone (Taian–Dawa (F1) and Lengjia (F2) faults, Fig. 5). The inversion, which decreases from NE to SW, is overall subtle and is only visible along a few faults based on seismic interpretation.
The results of Model 2, where inversion was initiated by about 5° anticlockwise rotation of the eastern block around a pole located in the SE, are compatible with the characteristics of the first phase inversion detected on seismic profiles. In this model, during rotation only the NE part which simulated the Xialiaohe Depression experienced inversion. In this model, the faults (f3 and f4) bounding the basin were inverted and the deeper units accommodated the shortening by folding (Fig. 13). This is similar to inversion of pre-existing normal faults in the Xialiaohe Depression and the folding of the lower Mz units (Fig. 5). In nature, this inversion mechanism can be due to the rotation of the eastern block of Tanlu Fault, possibly driven by the convergence of the Pacific Plate with the Eurasian Plate and the opening of the Japan Sea during 32–18 Ma (Northrup, Royden & Burchfiel, Reference Northrup, Royden and Burchfiel1995; Allen et al. Reference Allen, Macdonald, Xun, Vincent and Brouet-Menzies1997).
In Model 1, which was subjected to a larger degree of rotation (c. 8°), the boundary faults were inverted and new thrust faults formed and propagated beyond the inverted boundary faults (Fig. 13). However, regarding the Xialiaohe Depression such thrusts are not reported in the literature and have not been observed on the seismic profiles which we had access to. As such, it is concluded that inversion must have been local and of a limited intensity.
5.d. Proposed new model for the Bohai Bay Basin
Previous rifting models and inversion mechanisms do not satisfactorily explain the structural configuration of the Bohai Bay Basin. Simple NW–SE extension proposed by Ye et al. (Reference Ye, Shedlock, Hellinger and Sclater1985) and Liu (Reference Liu1987) cannot explain the E–W-trending normal faults in the Bozhong and Jiyang depressions within the step-over part of the basin, or the major strike-slip faults in the NE and SW of the basin (Fig. 15). The result of Model 5 (Fig. 11), which simulated this tectonic scenario proposed by Ye et al. (Reference Ye, Shedlock, Hellinger and Sclater1985) and Liu (Reference Liu1987), verified that NW–SE extension only generates NNE-trending normal faults both in the NE and SW zones and the central step-over area. The right-stepping ENE-trending transtensional fault zones formed along the northern and southern boundaries of Model 5 do not exist in the Bohai Bay Basin, where these boundaries are normal faults. In addition, the length (L') to width (W') ratio in the step-over area of Model 5 (L'/W' = 2.07) is much larger than the ratio (L/W = 1.30) of BBB. The width ratio in the NE and SW parts of Model 5 (W 1'/W 2' = 1.51) is smaller than the same ratio for those areas in the BBB (W 1/W 2= 1.92; Fig. 11).
Furthermore, the pull-apart model and its variations proposed by Klimetz (Reference Klimetz1983) and Hou, Qian & Song (Reference Hou, Qian and Song1998) neglect the presence of 50–100 km wide rift zones in the Xialiaohe and Jizhong depressions in the NE and SW of the basin (Fig. 1). The Cenozoic NW–SE extension superimposed by the dextral strike-slip model proposed by Qi & Chen (Reference Qi and Chen1992) cannot explain the E–W-trending normal faults in the centre of the BBB outlining the Bozhong and Jiyang depressions.
The transtension model proposed by Allen et al. (Reference Allen, Macdonald, Xun, Vincent, Brouet-Menzies, Holdsworth, Strachan and Dewey1998) and N–S extension model proposed by Zhou & Zhou (Reference Zhou and Zhou2006) are similar to the model which we propose here. However, the model of Zhou & Zhou (Reference Zhou and Zhou2006) does not account for the local inversion which occurred during late Oligocene – Miocene time. Allen et al. (Reference Allen, Macdonald, Xun, Vincent, Brouet-Menzies, Holdsworth, Strachan and Dewey1998) proposed a two-phase dextral transtension for the formation of the greater BBB. Our models support the N–S extension models of Allen et al. (Reference Allen, Macdonald, Xun, Vincent, Brouet-Menzies, Holdsworth, Strachan and Dewey1998) and Zhou & Zhou (Reference Zhou and Zhou2006). However, our model results show that the basins can form in one transtension phase without the necessity for two phases of transtension. In addition, model results show that the documented inversion in the NE part of basin can be attributed to rotation rather than a full-scale shortening of the greater BBB. Anticlockwise rotation of the eastern margin of the BBB relative to its western margins around a pole located in the SE explains two main observations. It accounts for the local inversion which has been reported only in the NE segment of the BBB (Xialiaohe Basin) by for example Li et al. (Reference Li, Jia, Chen, Zhang, Wang, Li, Li and Li2013) and confirmed by interpretation of seismic data in this study. As evident from seismic data, this inversion decreases in intensity from NE to SW along the Tanlu Fault (Figs 4, 5). An anticlockwise rotation is compatible with a dextral strike-slip movement along the Tanlu Fault which, during the rotation, must have had both dip and strike-slip movement, that is, oblique slip. Such ‘local’ oblique inversion is modelled for two localities in the Middle Polish Trough, where inversion was attributed to oblique movement along a major strike-slip fault: the Holy Cross Fault (Gutowski & Koyi, Reference Gutowski and Koyi2007). Another significant feature which can be attributed to the rotation in the BBB is the extension that occurred in the SW part of the basin. At the same time (late Oligocene) as when the Xialiaohe Basin in the NE underwent inversion, the Dongpu Sag in the SW was undergoing extension. Seismic data show that Ng and Nm units are inverted along some of the faults in the Xialiaohe Depression in the NE. However, these units do not show any sign of inversion in the Dongpu Sag in the SW (Qi et al. Reference Qi, Wang, Chen, Zhao, Cheng, Xie and Xu2006). A simultaneous inversion in the NE and extension in the SW is only possible during rotation along a pole in the SE. This element is clearly demonstrated in the models presented here, where rotation of the eastern block around a pole in the SE led to shortening of the basins in the NE and further extension in the SW basins of the model.
Based on modelling results and seismic profile interpretation, we propose a tentative model for the evolution of the BBB (Fig. 16). During Paleocene (65 Ma) – early Oligocene time, the Kongdian (Ek) and Shahejie (Es) formations and the second member of Dongying Formation were deposited in the grabens and half-grabens generated by the roughly N–S extension. During late Oligocene time, the NE part of BBB was inverted while the SW part (Dongpu Sag) was extended due to anticlockwise rotation around a pole in the SE. This rotation could be due to convergence between Pacific and Eurasian plates. An erosion phase which preceded the inversion created a widespread Neogene unconformity throughout the BBB. However, erosion was most intensive in the inverted Xialiaohe Depression (Yu et al. Reference Yu, Ji, Yang, Yu, Ma and Zhang2007, Reference Yu, Dong, Tong, Xiong and Long2015). After erosion, the BBB underwent uniform thermal subsidence accompanied by a second inversion phase during Miocene–Pliocene time (from Ng to Nm formations).
Schematic evolution model showing the sequence of events in the BBB based on results of Model 1. (a–c) Line drawings of mapview of Model 1: (a) Ek–Es4 transtension; (b) Es3–Ed2 transtension; and (c) inversion stage (Ed1–Ng anticlockwise rotation and inversion). Note in (c) the compression structures in the NE and extension structures in the SW during rotation.

6. Conclusions
Based on our interpretation of reflection seismic data and the results of scaled analogue models, the following conclusions are drawn about the evolution of the Bohai Bay Basin.
1. The Cenozoic evolution of the BBB can be divided into three stages: (1) Paleocene – early Oligocene transtension; (2) late Oligocene rotation accompanied by the first phase of inversion and regional erosion; and (3) thermal subsidence accompanied by a second inversion phase during Miocene–Pliocene time. This last episode is deduced from seismic interpretation, but not simulated in the models.
2. Transtension was due to roughly N–S extension (with the angle of 25° between the extension direction and the strike-slip fault boundary) which occurred during Paleocene – early Oligocene time.
3. Inversion seen mainly in the NE part of the BBB (Xialiaohe Depression) was probably due to regional rotation of the eastern block of the BBB around a pole in the SE. Such rotation can account for synchronous inversion in the NE and extension in the SW (Dongpu Sag), which was probably driven by the subduction of the Pacific Plate beneath the Eurasian Plate during 32–18 Ma.
Acknowledgements
This study was funded by the National Natural Science Foundation of China (grant nos 41472116, 41372116) and the Jidong Oil Company of China National Petroleum Company (grant no. 20150081). We acknowledge the Liaohe Oil Company of CNPC for providing the seismic profiles. HK is funded by the Swedish Research Council (VR). This study was carried out during a one-year sabbatical of FY at the Hans Ramberg Tectonic Laboratory (Uppsala University). Constructive and detailed comments of Giacomo Corti improved both the content and presentation of this article. Comments from a second anonymous reviewer are also acknowledged.