


1. Introduction
1.1 The SDGs and agri-food systems
The global agricultural industry faces a major challenge: the production of sufficient food to feed a growing population whilst ensuring that negative environmental impacts are addressed. This comes at the back of a growing demand for food, which is projected to increase by 35–56% by 2050, compared to 2010 levels (van Dijk et al., Reference van Dijk, Morley, Rau and Saghai2021).
Food systems are responsible for about a third of global greenhouse gas (GHG) emissions (Crippa et al., Reference Crippa, Guizzardi, Schaaf, Solazzo, Muntean, Monforti-Ferrario, Olivier and Vignati2021a, Reference Crippa, Solazzo, Guizzardi, Monforti-Ferrario, Tubiello and Leip2021b). These emissions are due to the production of primary food commodities (e.g. crops, livestock for meat, fisheries, animal feed) and further processing and transport of food, waste management and industrial processes (Crippa et al., Reference Crippa, Guizzardi, Schaaf, Solazzo, Muntean, Monforti-Ferrario, Olivier and Vignati2021a, Reference Crippa, Solazzo, Guizzardi, Monforti-Ferrario, Tubiello and Leip2021b; Poore & Nemecek, Reference Poore and Nemecek2018). It is well documented that plant-based foods emit about 10–50 times less GHG emissions than animal-based foods (Ritchie & Roser, Reference Ritchie and Roser2020). An integrated assessment of food production and consumption, and the associated impacts on the environment and human health by Malley et al. (Reference Malley, Hicks, Kuylenstierna, Michalopoulou, Molotoks, Slater, Heaps, Ulloa, Veysey and Shindell2021), highlight the intricacies of the interconnected system – food is vital for good health and well-being; however, emissions resulting from food production indirectly impact human health via exposure to harmful agricultural pollutants. This clearly shows that any policy directed at transforming food systems will have follow-on impacts on other Sustainable Development Goals (SDGs).
Multiple studies have been undertaken at regional, national and global scales to assess the environmental and socio-economic impacts associated with food production and consumption (Eberle & Fels, Reference Eberle and Fels2016; Foster et al., Reference Foster, Green and Bleda2007; Kastner et al., Reference Kastner, Rivas, Koch and Nonhebel2012; Mosier et al., Reference Mosier, Syers and Freney2013; Sala et al., Reference Sala, McLaren, Notarnicola, Saouter and Sonesson2017; Tonini et al., Reference Tonini, Albizzati and Astrup2018; Usva et al., Reference Usva, Saarinen and Katajajuuri2009), and specifically in relation to diets (Baroni et al., Reference Baroni, Cenci, Tettamanti and Berati2007; Chai et al., Reference Chai, van der Voort, Grofelnik, Eliasdottir, Klöss and Perez-Cueto2019; Swain et al., Reference Swain, Blomqvist, McNamara and Ripple2018). Crippa et al. (Reference Crippa, Guizzardi, Schaaf, Solazzo, Muntean, Monforti-Ferrario, Olivier and Vignati2021a, Reference Crippa, Solazzo, Guizzardi, Monforti-Ferrario, Tubiello and Leip2021b) developed a comprehensive food emissions database at a global level for assessing the contribution of food systems to anthropogenic GHG emissions, including temporal trends. In addition to emissions, with expansion of agriculture, there has also been a drastic increase in irrigated land area and cropland area (Tilman, Reference Tilman1999). Nearly half of the world's habitable land is used for agriculture (Ritchie & Roser, Reference Ritchie and Roser2020).
1.2 Agri-food systems and the EU context
Quantification of impacts of food production and consumption is typically undertaken using bottom-up methods, such as life-cycle assessment-based techniques, or top-down approaches, such as input–output analysis. Assessments that cover supply chain impacts tend to utilise input–output analysis, as the technique offers the ability to account for hidden hotspots in upstream interconnected economic networks. This technique has particularly been used for assessing environmental and socio-economic impacts embodied in international supply chains (Wiedmann & Lenzen, Reference Wiedmann and Lenzen2018). More recently, Boylan et al. (Reference Boylan, Thow, Tyedmers, Malik, Salem, Alders, Raubenheimer and Lenzen2020) showcased the use of input–output analysis in measuring not just the sustainability of food systems, but also nutrition, diets, resilience and vulnerability. The Global Commons Stewardship (GCS) Index measures countries' domestic and spillover effects on the Global Commons (SDSN, Yale Center for Environmental Law & Policy, & Center for Global Commons at the University of Tokyo, 2021). The Index offers an overview of environmental impacts generated by the EU on the Global Commons, with an in-depth contribution analysis of five impacts: GHG emissions, black carbon emissions, land use biodiversity loss, nitrogen surplus and water stress of crops. However, it does not account for detailed supply chain impacts with a delineation of impacts occurring in upstream production layers in terms of regions and sectors. This research gap is addressed in this study.
In this study, we assess international spillover effects embodied in the European Union's (EU) food supply chains, i.e., impacts that take place in other countries because of the EU's demand for food products, with key insights from publications by the European Commission (2020a, 2020b, 2021a, 2021b, 2021c, 2021d, 2021e, 2021f, 2021g, 2021h, 2021i), global reports and academic works. Trade, including that of food products, is a major source of income and a driver of prosperity in many low- and middle-income countries. The EU is the third largest importer of food products in the world. In 2020, the region imported 122 billion € of agri-food products (European Commission, 2021a). At the same time, negative cross-border resource use and emissions, known as spillovers, can undermine the ability of the global community to achieve the SDGs (Sachs et al., Reference Sachs, Traub-Schmidt, Kroll, Lafortune and Fuller2021b). The current state of spillover effects actually puts poor and middle-income countries systematically at risk while rich countries manage to externalise domestic problems. The purely domestic SDG balance sheets of the latter therefore appear to be more positive when not taking into account the existence of spillover effects. In fact, out of the 20 top performers in the SDG Index, 19 are European countries. However, European countries and high-income countries in general perform poorly on the subset of indicators used to compile the International Spillover Index, which covers impacts embodied into trade. Strengthening policy coherence, as emphasised under SDG17 (Partnerships for the Goals), calls for robust indicator frameworks and ambitious policy measures to clean-up unsustainable supply chains to align them with the SDGs and the Paris Climate Agreement (Sachs et al., Reference Sachs, Traub-Schmidt, Kroll, Lafortune and Fuller2021b).
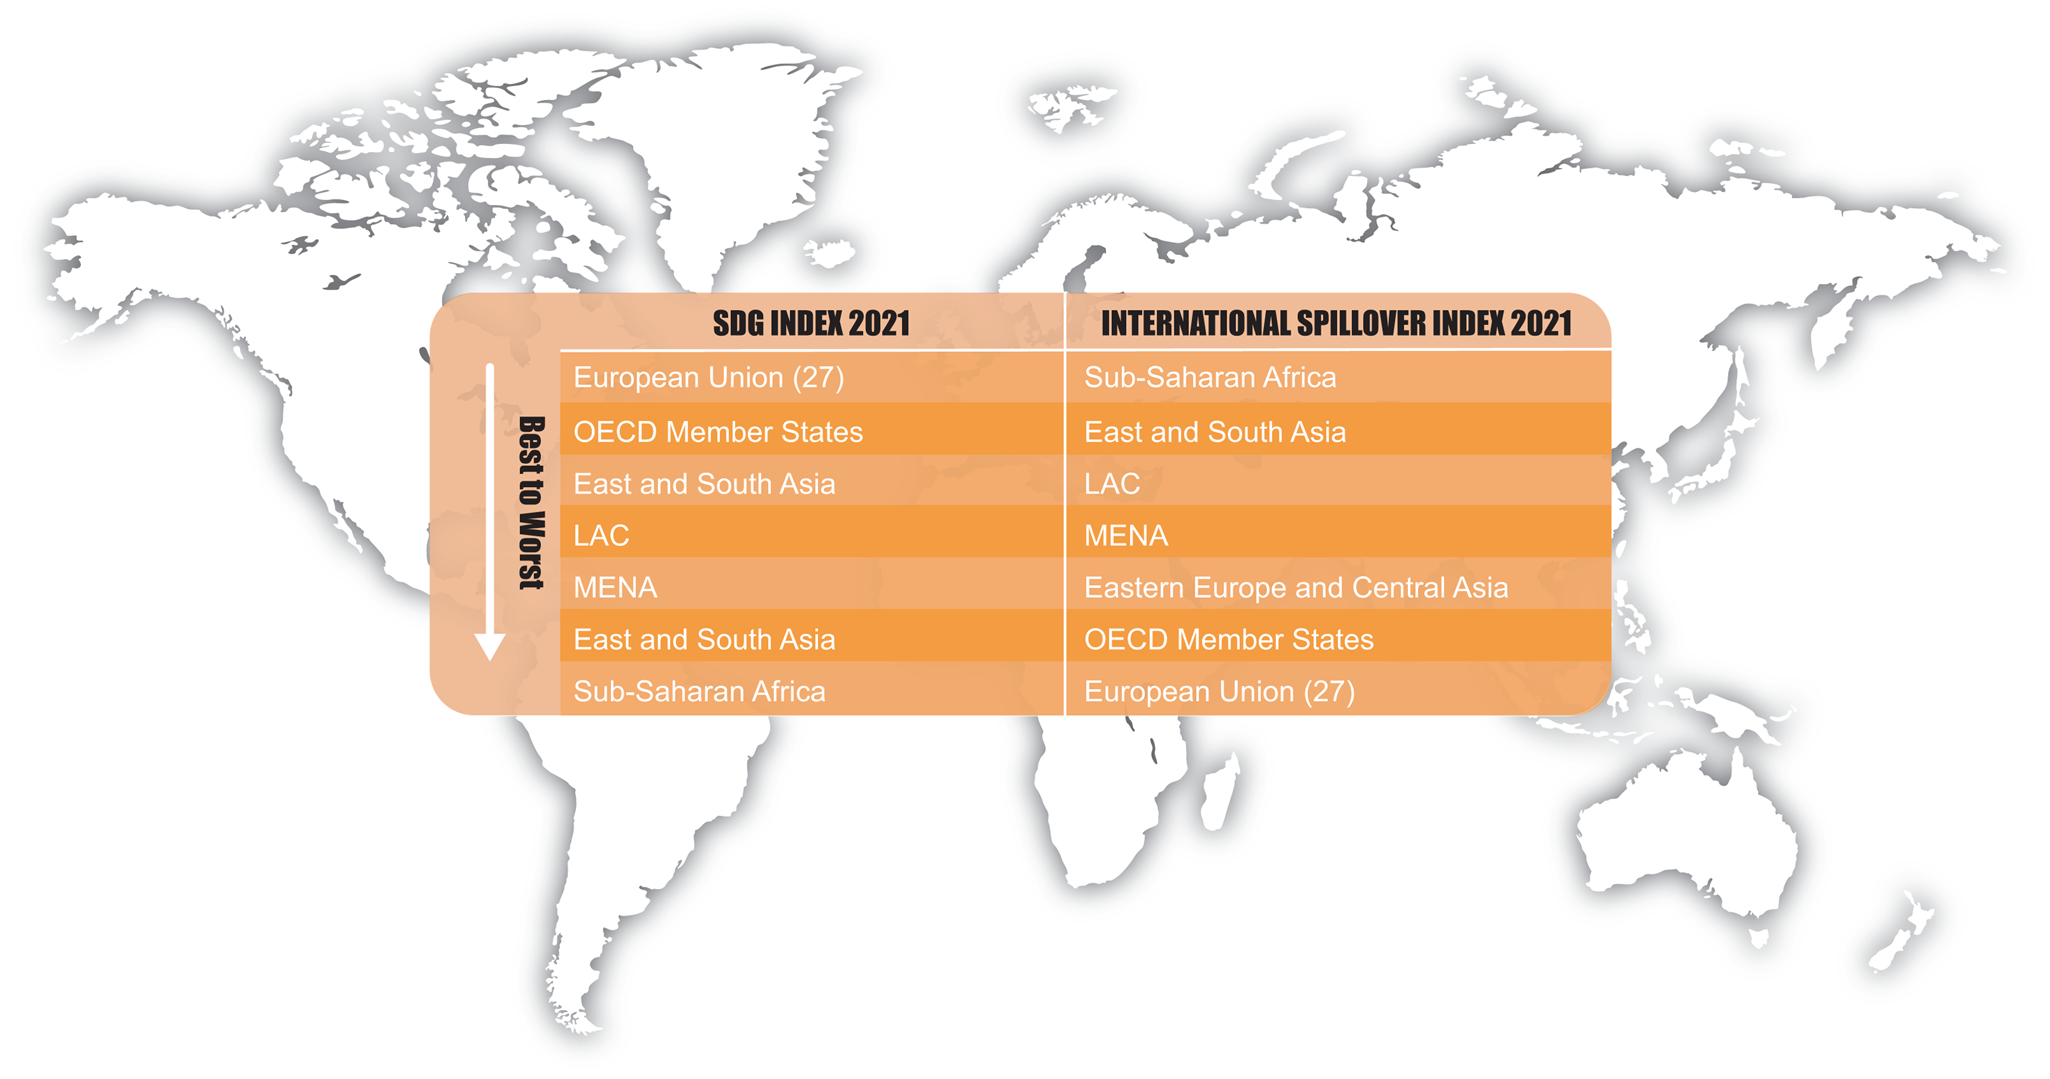
The International Spillover Index measures impacts that are generated by one country, which affect other countries' ability to achieve the SDGs (Figure 1). The Index is based on environmental and social impacts (e.g. CO2 emissions, biodiversity threats, financial secrecy and profit shifting). Detailed results are available online at www.sdgindex.org. The figure is based on data from Sachs et al. (Reference Sachs, Traub-Schmidt, Kroll, Lafortune and Fuller2021b).
EU27 performance on the 2021 sustainable development goals index and international spillover index compared with other world regions (adapted from Sachs et al., Reference Sachs, Agarwal, Espinosa, Mardirossian, Marrero, O'Dwyer, Plekenpol, Rincón, Diana, Sachs and Lisa2021a).
1.3 Objectives
For gaining insights on the sustainability aspects of EU's food demand, we first provide an overview of the magnitude of consumption-based environmental impacts in the EU food supply chain, focusing on carbon dioxide (CO2), sulphur dioxide (SO2), nitrous oxide (NOX), particulate matter (PM) and land use. We also present estimates of income and employment generated globally to satisfy EU's consumption of food products. We then quantify intra-EU spillovers and spillovers generated outside of the EU's border. Finally, by focusing on spillovers generated outside of the EU, we identify the regions and countries most affected and specific commodities that drive these negative impacts. The discussion section highlights some of the challenges and priorities for the EU leadership, governments, businesses and consumers to monitor and address negative food-related spillovers. We also emphasise the need to accelerate the transition towards more sustainable food production, supply chains and diets.
2. Measuring spillovers
Measurement of spillovers involves quantifying impacts embodied in international supply chains. This quantification can be carried out using a technique called input–output analysis, which was first formulated by the Nobel Prize Laureate Wassily Leontief (Leontief, Reference Leontief1936) for the United States. Over the years, there have been numerous innovations in the application of this technique – one of which is the development of multi-regional input–output (MRIO) databases.
As the name suggests, MRIO databases offer coverage of more than one region (a true advancement from the first national table that Wassily Leontief created for the US economy). Global MRIO databases provide detail on imports and exports between different countries, and hence are ideal for assessments related to spillover effects. It is worth noting that the term ‘spillover effects’ refers to any environmental, social or economic impacts that are embodied in supply chains that connect producers with consumers at an international level. With an increase in globalisation and international trade, global imports/exports have been rising, as well as the associated impacts. Such assessments have been undertaken for a number of indicators, such as emissions (Kanemoto et al., Reference Kanemoto, Moran, Lenzen and Geschke2014; Malik & Lan, Reference Malik and Lan2016), water use (Lenzen et al., Reference Lenzen, Moran, Bhaduri, Kanemoto, Bekchanov, Geschke and Foran2013; Soligno et al., Reference Soligno, Malik and Lenzen2019), land use (Moran et al., Reference Moran, Lenzen, Kanemoto and Geschke2013), groundwater overuse in trade (Dalin, Reference Dalin, Mukherjee, Scanlon, Aureli, Langan, Guo and McKenzie2021), nitrogen (Oita et al., Reference Oita, Malik, Kanemoto, Geschke, Nishijima and Lenzen2016), child labour (Gómez-Paredes et al., Reference Gómez-Paredes, Alsamawi, Yamasue, Okumura, Ishihara, Geschke and Lenzen2016), employment (Alsamawi et al., Reference Alsamawi, Murray and Lenzen2014a), inequality (Alsamawi et al., Reference Alsamawi, Murray, Lenzen, Kanemoto and Moran2014b), corruption (Xiao et al., Reference Xiao, Lenzen, Benoît-Norris, Norris, Murray and Malik2018), occupational hazards (Alsamawi et al., Reference Alsamawi, Murray, Lenzen and Reyes2017) and much more (Wiedmann & Lenzen, Reference Wiedmann and Lenzen2018). In the case of the EU, social spillover effects are embodied in textile supply chains (Malik et al., Reference Malik, Lafortune, Carter, Li and Lenzen2020).
MRIO-based quantification of spillover effects for the EU involves unravelling international supply chains to identify which regions and sectors produce commodities that are eventually destined for consumption in the EU – and what impacts (environmental/social/economic) are embodied in the supply chains. This requires an MRIO database with specific detail on each of the 27 EU member states: Austria, Belgium, Bulgaria, Croatia, Cyprus, Czech Republic, Denmark, Estonia, Finland, France, Germany, Greece, Hungary, Ireland, Italy, Latvia, Lithuania, Luxembourg, Malta, Netherlands, Poland, Portugal, Romania, Slovakia, Slovenia, Spain and Sweden (Europa EU, 2020), as well as details on the rest-of-the-world (RoW, i.e. countries outside of the EU). The regional and sectoral composition of the RoW region varies across MRIO databases (Tukker & Dietzenbacher, Reference Tukker and Dietzenbacher2013). In this study, we choose the GLORIA MRIO database that features specific details on 27 EU states and 137 other individual countries, with 97 sectors for each country, as showcased in an assessment for material footprints (Lenzen et al., Reference Lenzen, Geschke, West, Fry, Malik, Giljum, Milà i Canals, Piñero, Lutter, Wiedmann, Li, Sevenster, Potočnik, Teixeira, Van Voore, Nansai and Schandl2022). In this study, data from the GLORIA MRIO database are integrated with environmental, social and economic indicators (details in the next paragraph) for assessing the impacts of EU's demand for food. The mathematical formulation for measuring spillovers is presented in the Supplementary Information.
We analyse seven distinct indicators: carbon dioxide (CO2), sulphur dioxide (SO2), nitrous oxide (NOX), particulate matter (PM), land, employment and income, taken from the Hotspot Analysis Tool for Sustainable Consumption and Production (SCP-HAT, 2021). Since we aim to cover impacts across a range of sectors, we select indicators that can capture impacts taking place in the agricultural sector, electricity and manufacturing sectors, and tertiary sectors (e.g. emissions from fuel burning, land use from crop growing and so on). This study aims to present findings on all three spheres of sustainability – environmental, social and economic. The study was undertaken in collaboration with the United Nations Sustainable Development Solutions Network (UN SDSN), and illustrates the research translation impact of the work. The selection of indicators for the study was based on conversations with collaborators from UN SDSN and recent policy relevance in the EU. The study is an example of spillover impacts generated by the EU for selected indicators, which can be further developed into future work focussing on other environmental pressures such as water use, methane and nitrous oxide.
SCP-HAT features data on air pollutants (SO2, NOX and PM) and CO2 from the EDGAR database (Crippa et al., Reference Crippa, Solazzo, Huang, Guizzardi, Koffi, Muntean, Schieberle, Friedrich and Janssens-Maenhout2020, Reference Crippa, Guizzardi, Schaaf, Solazzo, Muntean, Monforti-Ferrario, Olivier and Vignati2021a, Reference Crippa, Solazzo, Guizzardi, Monforti-Ferrario, Tubiello and Leip2021b). The sector classification in the EDGAR database does not entirely match the sector classification in the MRIO database. Therefore, emissions were allocated to the MRIO sectors by developing row- and column-normalised-mapping-matrices. These are concordance matrices that are normalised into a map such that either the row or column sum equal to 1, depending on the normalisation that is performed. This is explained in detail in Section S4 of the Supplementary Information for Lenzen et al. (Reference Lenzen, Kanemoto, Moran and Geschke2012). These matrices contain 0s or 1s depending on the matching of an EDGAR sector to relevant MRIO sector(s). Such mapping matrices convert sector classification using a suitable proxy variable to map an aggregated sector in EDGAR to several disaggregated sectors (e.g. crop growing, meat and fish products, livestock farming (includes feed), oil and fat products, cocoa, chocolate, dairy products) in SCP-HAT. Data on land use feature six land use classes related to agriculture and forestry only – annual crops, permanent crops, pasture, extensive forestry, intensive forestry and urban. For annual crops and permanent crops, data from the FAOSTAT land use database are used to normalise and allocate land use to sectors. Intensive and extensive forests' land use and evolving forests with extractive use are calculated using data from the Global Forest Resources Assessment (FAO, 2020). Other land use classes (pasture and urban) are established based on the FAOSTAT land use database for land under permanent meadows and urban. Employment data are sourced from the International Labour Organization (ILO, 2018), and linked to the MRIO table using concordance matrices as described above. Income data are derived directly from the value added block of the MRIO table.
3. Findings
3.1 Overview at EU-27 level: wide-ranging spillover effects
The EU's demand for food products leads to significant environmental, social and economic consumption-based impacts both domestically and abroad. Figure 2 presents these combined effects (impacts embodied in imports and due to domestic production) to highlight the relative contribution of EU's final consumption of food to environmental and social impacts. The EU's final demand for food commodities is responsible for 5% of the EU's total CO2 footprint, 9% of the total NOX footprint, 16% of the total PM footprint, 6% of the total SO2 footprint, 46% of the total land-use footprint, 13% of the total employment footprint and 5% of the total income footprintFootnote 1. When calculating these percentages, the ‘total’ footprint refers to the combined impacts of the EU's expenditure for all primary, secondary and tertiary sectors. In other words, these percentages are calculated by quantifying the impacts for each indicator across all sectors (agriculture, food, manufacturing, utilities, tertiary sectors) to find the total EU footprint; and the percentage contribution of the food-related sectors is derived by dividing the footprint for food sectors with the total EU footprint for respective indicators. A time-series analysis of EU's food-related CO2 footprint reveals that the total consumption-based emissions (domestic and imports) have decreased over time, however the import-component of the footprint has remained constant (Supplementary Figure S2). An analysis of the import-component on a per-capita basis, along with a comparison with two key economies (USA and Russia), is presented in Supplementary Table S1.
Environmental, social and economic footprint of the EU's demand for food. The total footprint of EU's expenditure on food-related sectors is broken down into direct (darkest shade), first-order (middle shade), and supply chain impacts (lightest shade) for all seven indicators analysed in the study. For example, the EU's food demand is responsible for about 5% of direct emissions of particulate matter (PM), 5% of PM emissions in the first-order and the remaining (16%) in upstream supply chains. The bar graphs represent the contribution of domestic production (intra-EU trade) or imports to the overall consumption-based footprint for the EU's food demand, for example, 50% of carbon dioxide emissions take place within EU (intra-EU trade) for meeting EU's final demand for food; and the remaining (50%) carbon dioxide emissions take place outside of the EU.
Note: Carbon dioxide (CO2), sulphur dioxide (SO2), nitrous oxide (NOX), particulate matter (PM) in megatonnes (Mt); land in ‘000 hectares (ha); employment in million people; income in billion US$.
Source: Authors' illustration.
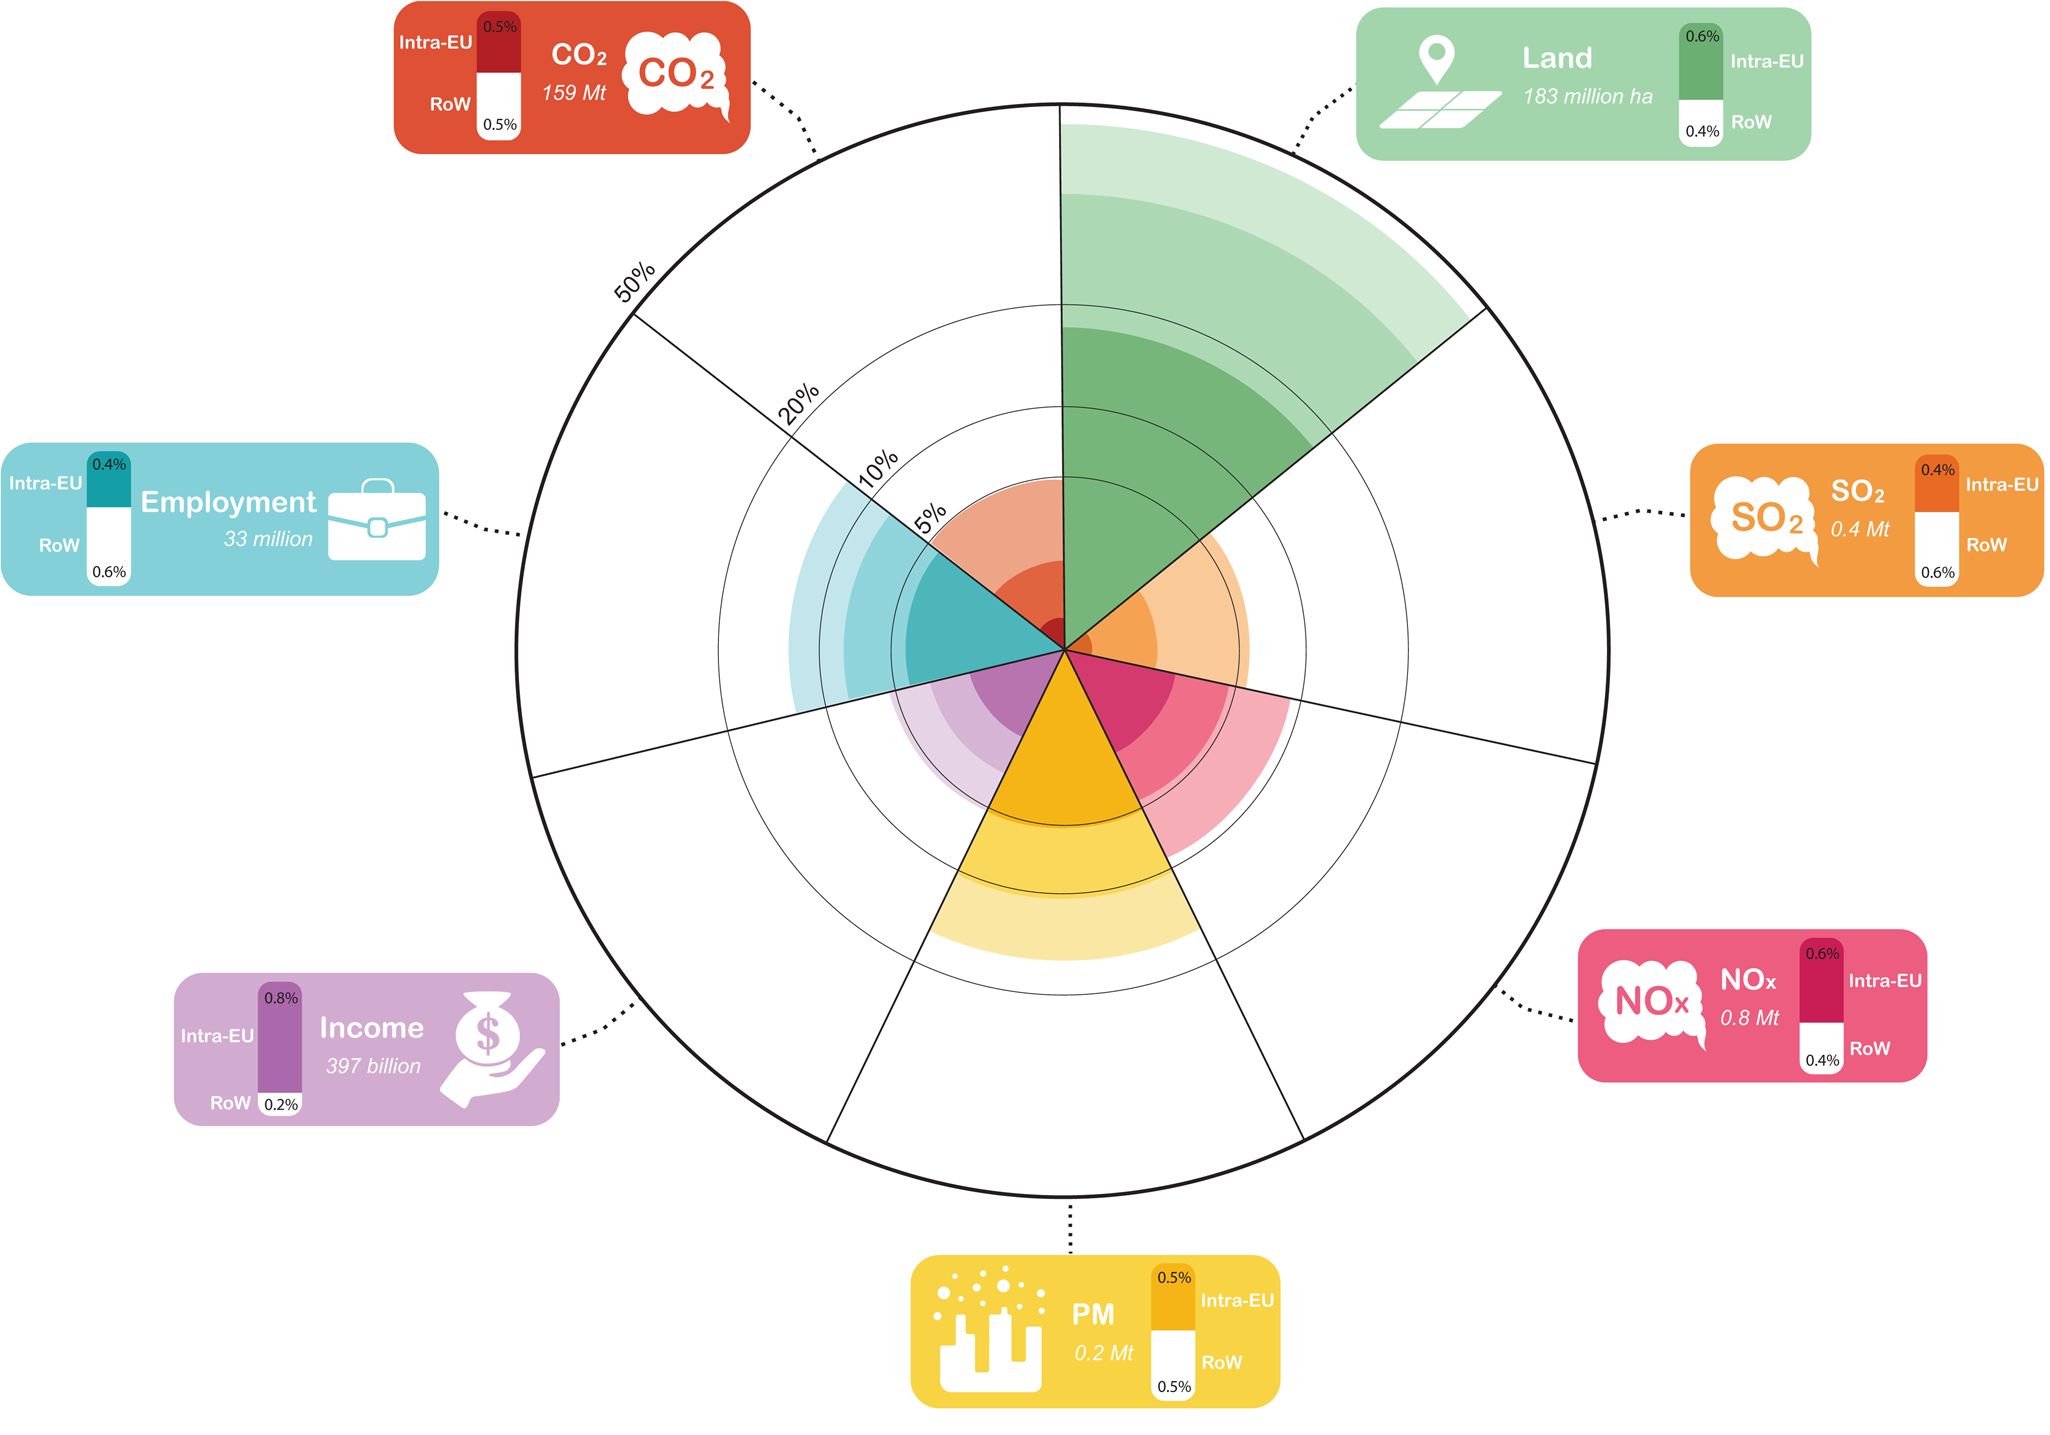
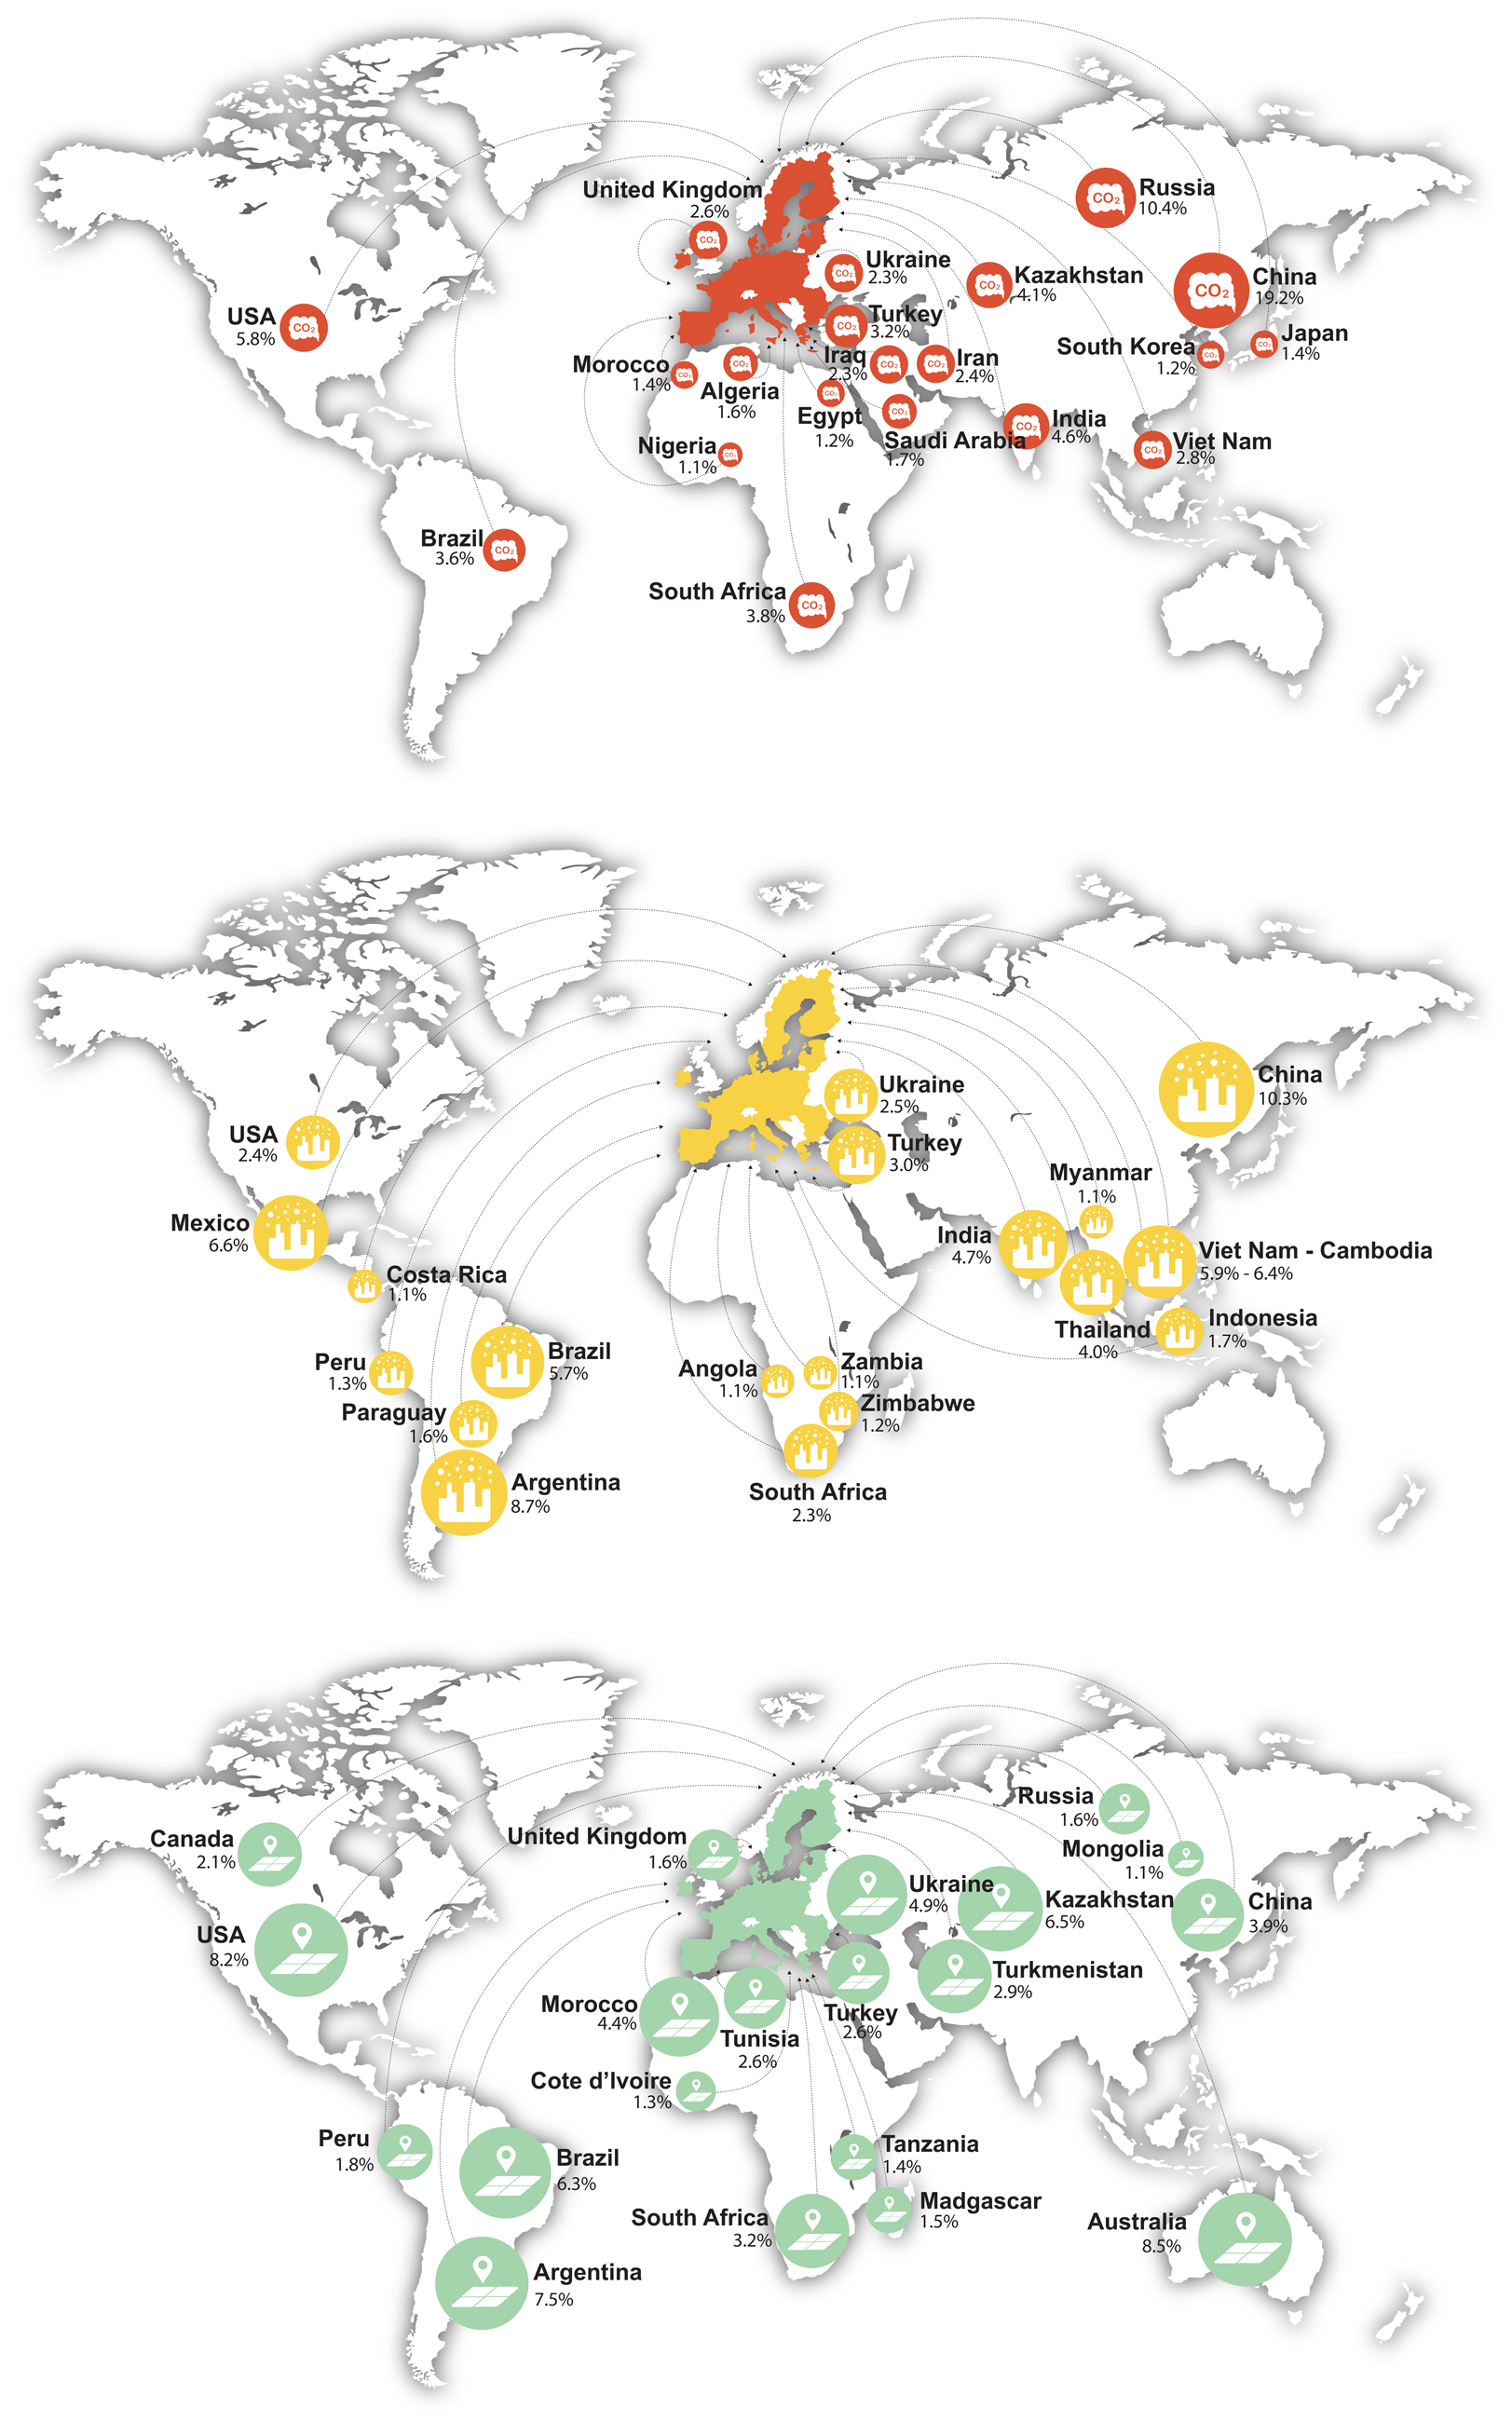
The EU is responsible for negative impacts in the form of CO2, SO2, NOX emissions and PM. These result from activities related to agriculture, burning of fossil fuels, energy use, industrial processes, transport sector and the use of land for agricultural production. EU's food demand also contributes to positive impacts such as job creation and income, as calculated based on employment and income data linked to a MRIO database (Lenzen et al., Reference Lenzen, Geschke, West, Fry, Malik, Giljum, Milà i Canals, Piñero, Lutter, Wiedmann, Li, Sevenster, Potočnik, Teixeira, Van Voore, Nansai and Schandl2022). The calculation of positive spillover effects proceeds in a similar manner as negative spillover effects, based on the methodology presented in the ‘Measuring spillovers’ section. These spillovers take place both within and outside the EU. We breakdown the consumption-based impacts of the EU's food demand into three components: direct impacts, first-order impacts and indirect supply chain impacts. Here, direct impacts refer to those caused directly by sectors that link with suppliers of food commodities to the final consumers in the EU; first-order impacts are caused by food sectors' immediate suppliers. The impacts caused by suppliers of suppliers and all indirect supply chains are captured as the third band for every indicator in Figure 2. A notable finding is that the EU's food supply chains are not regionally concentrated: there are direct and first-order impacts, but most importantly there are significant impacts embodied in the EU's upstream supply chains and these originate in countries worldwide (Figure 3), for example, export of Argentinian beef to the EU.
Tracing spillovers for the European Union by country of origin of imports (indicators, in order: carbon dioxide, particulate matter and land).
Source: Authors' illustration.

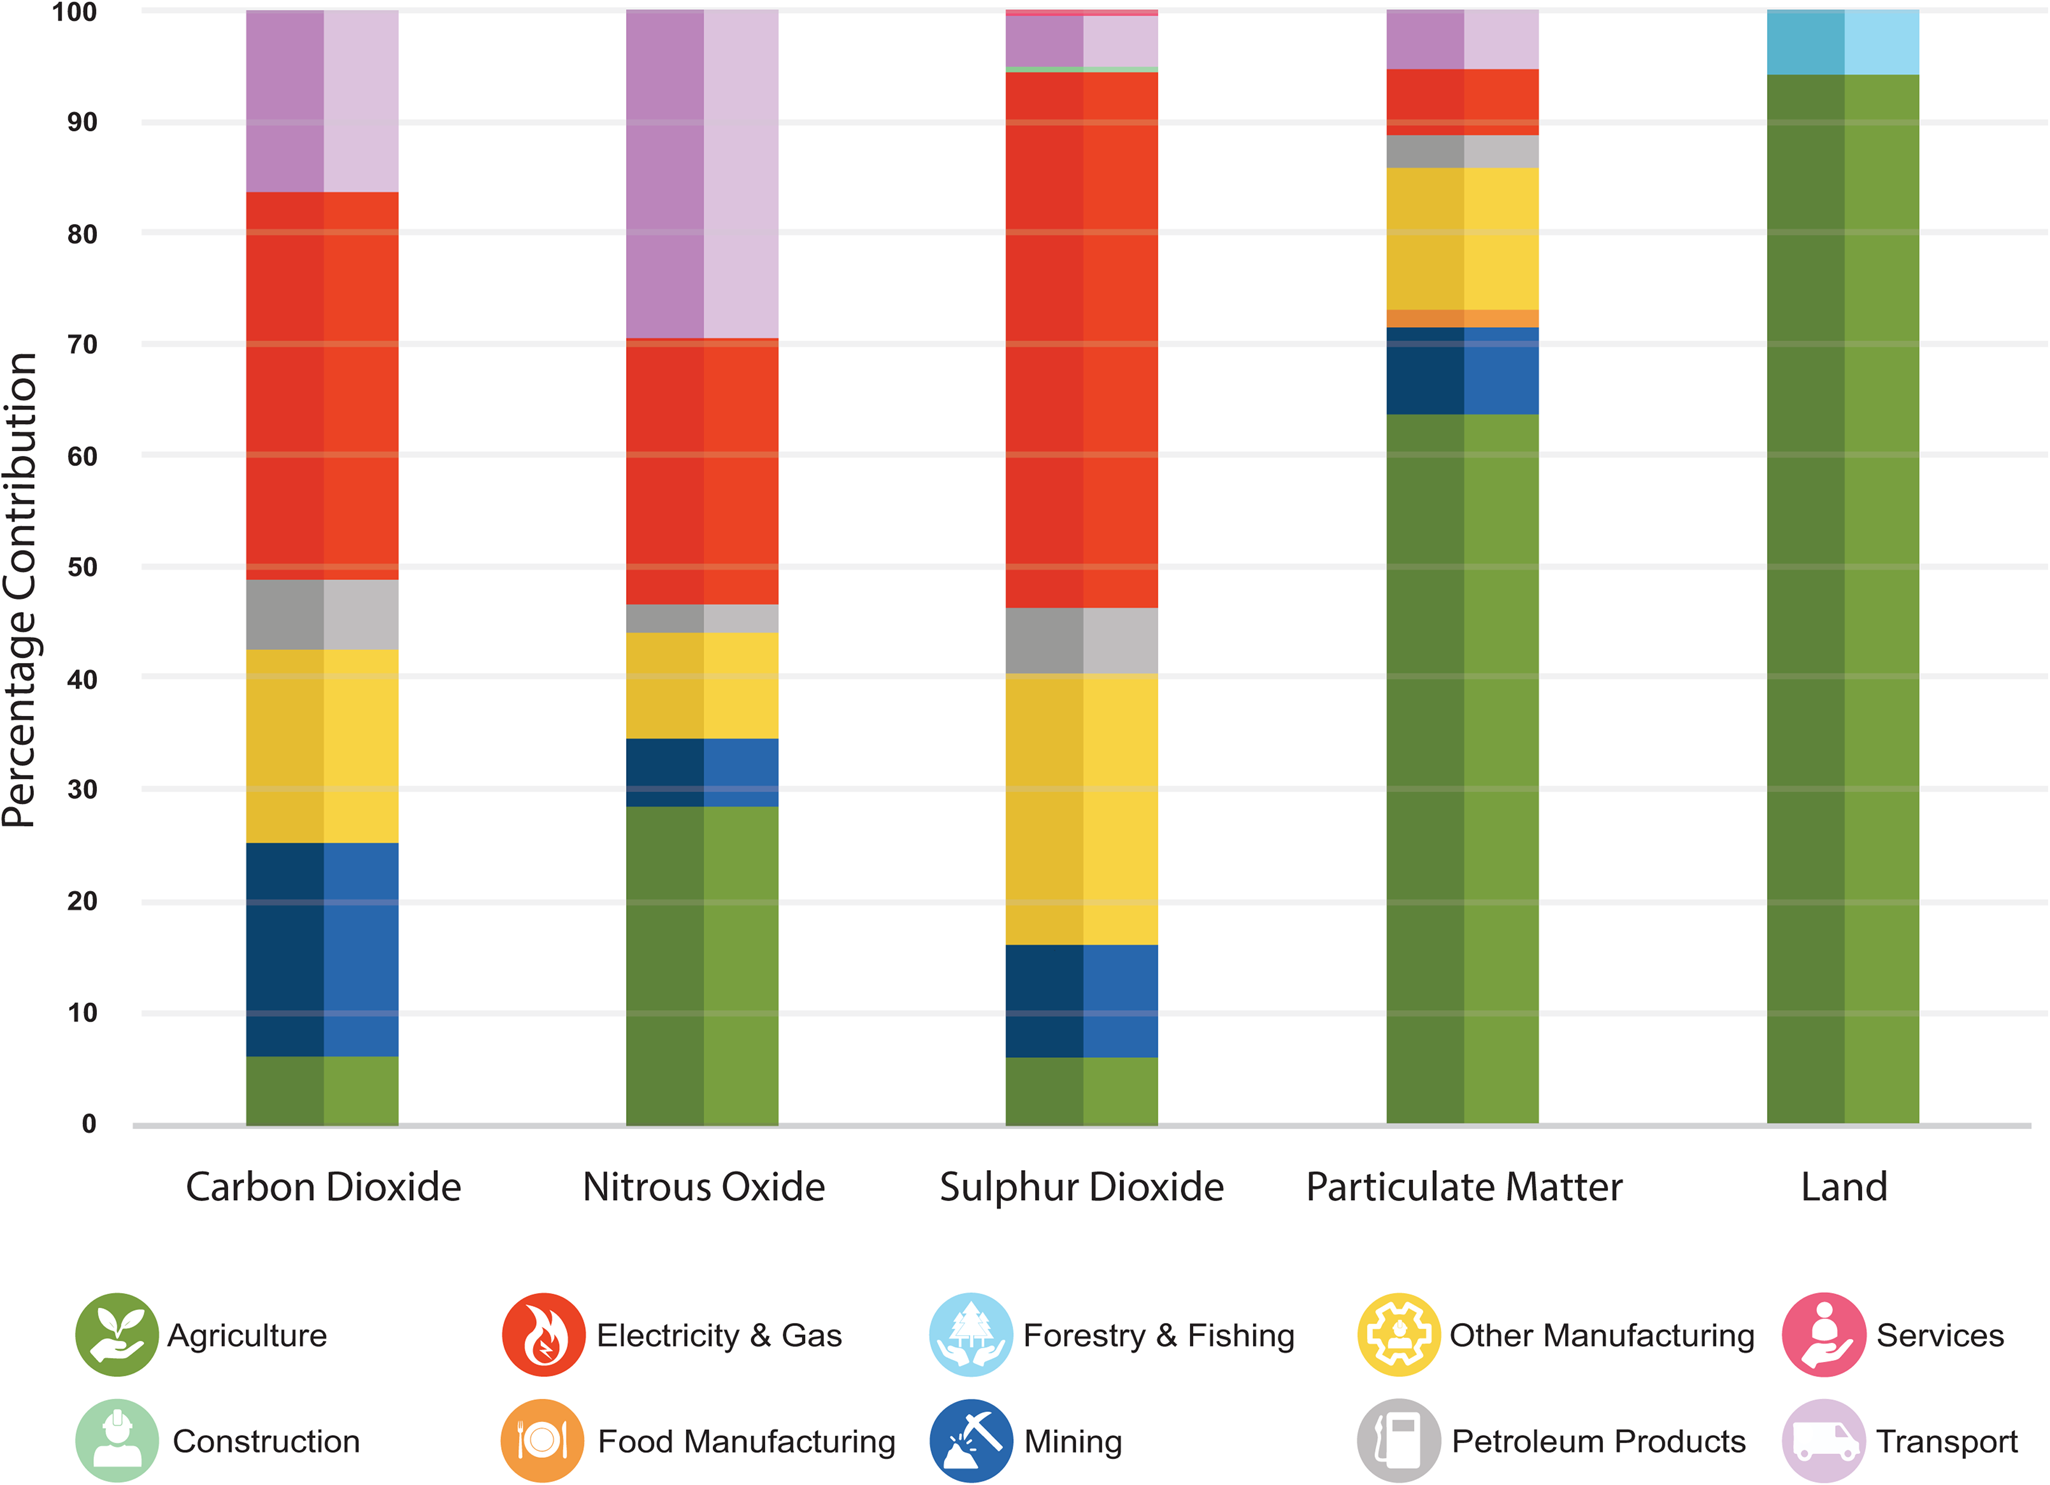
Food systems are directly connected to global and social changes. For example, the use of land for food production supports livelihoods and income to people. However, negative effects include the degradation of land and depletion of resources, which in turn undermines global food production. It is therefore paramount to recognise impacts embodied in supply chains from a regional and sectoral perspective (Figures 4 and 5, Supplementary Figure S1) to understand trade-offs across the indicator suite for implementing appropriate strategies for safeguarding the food systems and the environment whilst ensuring social welfare.
Production layer decomposition showing supply chain impacts for selected indicators: carbon dioxide, particulate matter and land use.
Source: Authors' illustration.
Sector-level spillover effects for environmental indicators, according to producing sectors that feed into EU's food supply chains.
Source: Authors' illustration.
3.2 Overview at EU-27 level: intra-EU impacts
Intra-EU trade is a key feature of the EU's food production and consumption system. About two-thirds of food produced in the EU is consumed within the EU. The impacts are shown as a percentage in Figure 2 (see bar graphs for each indicator, categorised into impacts from domestic production and from imports). Germany, Netherlands, France, Italy, Belgium and Spain are key EU countries that account for most of the intra-EU trade. Out of these economies, Germany constitutes 25% of total food imports from non-EU countries. Germany also imports food from EU nations, notably spending 23 billion US$ on food products from Netherlands in 2019. This includes vegetables, dairy products, bakery products, seeds and other agriculture-related products (ATLAS, 2021). Pigłowski (Reference Pigłowski2021) and Alatriste-Contreras (Reference Alatriste-Contreras2015) provide a detailed assessment of intra-EU trade relationships, including commodity-level detail on traded products, and some examples are provided in Supplementary Table S2. Since the focus of this study is to quantify international impacts embodied in EU's food supply chains, the following sections feature findings on environmental impacts that take place outside of the EU for satisfying the EU's demand for food.
3.3 International spillovers: regional level
We perform a production layer decomposition for quantifying impacts embodied in upstream food supply chains of the EU, with a specific focus on supply chains that originate (e.g. location of agricultural production) in regions outside of the EU (Figure 3). The term ‘production layer’ refers to upstream stages of production, for example, machinery to coal mining to electricity generation to food manufacturing and processing are part of various stages of upstream production layers. To this end, we decompose the total impacts of EU's food consumption into the domestic and imports-component over eight upstream layers of production and plot the imports-component at a regional level. Figure 3 presents cumulative impacts, which means that layer 2 presents results for layer 2 and layer 1; layer 8 shows the total value across all layers. We consider demand for fruits, vegetables, meat and fish products, dairy products, oil and fats and other food products. The methodology for quantification of spillover effects allows for the analysis of direct and total requirements of these sectors. In other words, we appraise the direct and indirect inputs required by the food sectors by applying input–output equations to the environmentally and socially extended MRIO database (i.e. including environmental and social indicators) (see section ‘Measuring spillovers’).
Despite EU's well-established food production industry, considerable negative spillover effects take place in international supply chains when satisfying the food demand of EU residents. Countries in Latin America, Asia-Pacific, Africa, and Eastern Europe and Central Asia experience environmental impacts associated with agri-food systems that produce exports for the EU market. International trade has been shown to be a growing driver of environmental degradation in developing and emerging economies, particularly for fulfilling the demands of the developed world (Wiedmann & Lenzen, Reference Wiedmann and Lenzen2018). The impacts related to the indicators captured in this study have further flow-on effects. For example, land use leads to biodiversity threats due to livestock rearing and production (Marques et al., Reference Marques, Martins, Kastner, Plutzar, Theurl, Eisenmenger, Huijbregts, Wood, Stadler and Bruckner2019) and particulate matter deteriorates air quality leading to health impacts on respiratory and cardiovascular systems, among others (Kim et al., Reference Kim, Kabir and Kabir2015).
3.4 International spillovers: country and sector level
EU's international trade links originate in countries worldwide (Figure 4). China and the EU trade over 1 billion € worth of goods every day, ranging from industrial and consumer goods to machinery and equipment (European Commission, 2021g), alongside some food products. Vietnam exported about 53 million US$ worth of coconuts, brazil nuts and cashew nuts to France in 2019 (ATLAS, 2021). India's exports to the EU include coffee, tea, rice, tobacco and oils (European Commission, 2021b).
In Latin America, Brazil is an exporter of soybeans and related products to the EU member states. This has been linked to illegal deforestation in the Amazon and Cerrado, with evident policy implications for the EU (Rajão et al., Reference Rajão, Soares-Filho, Nunes, Börner, Machado, Assis, Oliveira, Pinto, Ribeiro and Rausch2020). Argentina exports beef to the EU, with Germany the top destination (Federal Foreign Office, 2021). Italy imports Molluscs from Peru and bananas and plantains from Columbia (ATLAS, 2021). The EU is the second largest export market of Mexico, with fruits (e.g. avocados, pineapples, mangoes) making up the key export food commodity (European Commission, 2021c). The EU also trades with Africa: Germany imports about 50 million US$ worth of cocoa butter, 30 million US$ of cocoa beans and about 26 million US$ of cocoa paste from Ghana; France imports vegetables (27 million US$), legumes (21 million US$) and fruits from Kenya; Italy imports 89 million US$ worth of coffee from Uganda; additionally, Germany imports tobacco, tea and vegetables from Zimbabwe. These are some of many international transactions that take place in the world economy for satisfying EU's demand for food, in turn resulting in spillover effects (Figures 3, 4). The agri-food sector is contributing to environmental pressures worldwide, for example, quinoa demand in Peru is driving land use impacts (Bedoya-Perales et al., Reference Bedoya-Perales, Pumi, Mujica, Talamini and Domingos Padula2018), agriculture is contributing to degradation of water quality in Brazil (de Mello et al., Reference de Mello, Taniwaki, de Paula, Valente, Randhir, Macedo, Leal, Rodrigues and Hughes2020), cocoa production in Ghana has implications for soil, air and water quality (Boakye-Yiadom et al., Reference Boakye-Yiadom, Duca, Foppa Pedretti and Ilari2021), environmental impacts from livestock farming in Mexico (Giraldi-Díaz et al., Reference Giraldi-Díaz, Castillo-González, De Medina-Salas, Velásquez-De la Cruz and Huerta-Silva2021), impacts related to biodiversity and ecotoxicity from beef production in Argentina (Fischer & Bilenca, Reference Fischer and Bilenca2020), soil erosion in Kenya due to agricultural expansion (Maeda et al., Reference Maeda, Pellikka, Siljander and Clark2010). These are just selected examples that demonstrate the wide-ranging impacts driven by the agri-food sector, and the need to devise strategies for ensuring that livelihoods can be sustained without putting pressures on Earth's ecosystems.
From a sector-wise perspective, it is worth noting that spillover effects do not just take place in agri-food sectors when satisfying EU's demand for food; instead, these happen across a range of primary, secondary and tertiary sectors in EU's trading partners during agri-food production for the EU. Figure 5 shows the environmental spillover effects for ten broad sectors of non-EU countries for producing agri-food products. Evidently, a considerable percentage of impacts happen in fuel, energy and transport sectors. Electricity and gas are used as inputs in manufacturing and food processing industries for producing cereals, mixed foods, sugar refining, vegetable oils and fats, dairy products, beverages and tobacco products. Production of fuels and electricity in-turn requires input of coal mining, which relies on the construction sector for sourcing large-scale mining equipment, and so forth. Evidently, industry sectors are inter-related – the footprint for German demand for non-EU meat includes impacts at various links of the beef supply chains, from the purchase of electricity for running cattle farms to cattle handling equipment, water storage tanks, production of shipping crates and much more (Foster & Stephenson, Reference Foster and Stephenson1922).
3.5 International spillovers: countries responsible
Breaking down the total footprint for the EU into constituents from respective EU member states reveals that Germany, France and Italy are responsible for the bulk of the environmental spillover effects outside of the EU (Figure 6). This is because of the size of these economies and the high volume of imports into them (ATLAS, 2021). The high volume of imports from non-EU countries is taken as the final demand stressor in the footprint equation for calculating spillovers. Since the Leontief input–output model is a demand-pull model, the higher the demand for fruits, vegetables, beverages, meat and other products from outside the EU, the higher the value of imports and associated land-use impacts and emissions. Identification of EU nations that are responsible for these impacts is essential for targeted action, as outlined in the following section.
Contribution of 27 European Union Member States to international spillover effects. The percentages reflect the role of EU states in driving spillover effects in countries outside of the EU.
Source: Authors' illustration, see Supplementary Figure S3.

4. Discussion
This study highlights that the negative environmental impacts (CO2, PM, land use, SO2 and NOX) embodied into EU's imports of food products are noticeable and related in particular to imports of ‘meat and fish’ and products from ‘livestock farming’ and ‘crop growing’. The identified negative environmental impacts take place primarily in the Asia-Pacific (including China), Eastern Europe and Central Asia, Africa and Latin America (in particular Argentina and Brazil). This section provides an overview of current EU initiatives, and discusses priorities to address the effects on food supply chains that take place abroad to satisfy the EU's consumption. It is beyond the scope of this study to review in detail the level of ambition and implementation of all strategies, directives and policies related to strengthening the productivity and sustainability of the agri-food system in the EU (such as the Farm To Fork strategy or the Common Agricultural Policy). Instead, we pinpoint high-level priorities for strengthening the sustainability of food supply chains for three major constituencies: (1) European Commission and policy, (2) food industry and companies and (3) consumers to reduce negative spillovers embodied into the food supply chain. Focus is placed on imported air pollutants and CO2 emissions and on biodiversity threats (including through land use and deforestation (Marques et al., Reference Marques, Martins, Kastner, Plutzar, Theurl, Eisenmenger, Huijbregts, Wood, Stadler and Bruckner2019)). Note that we do not intend to present embodied land area as a proxy for embodied biodiversity impacts (see Chaudhary & Kastner (Reference Chaudhary and Kastner2016) for a detailed analysis).
4.1 European Commission and policy
Since 2019, the leadership of the EU has repeatedly voiced its ambition to promote open, fair and sustainable trade policies and to promote European values through trade. The World Trade Organisation (WTO) acknowledges that trade reforms are vital for achieving the SDGs (WTO, 2018). Trade policy is an exclusive EU competence. In February 2021, the European Commission published its ‘Trade Policy Review – An Open, Sustainable and Assertive Trade Policy’ (European Commission, 2021f). It notably suggests that ‘for future trade agreements, the Commission will propose a chapter on sustainable food systems’. It identifies as a headline action the need to ‘seek commitments from G20 partners on climate neutrality, strengthen cooperation on other aspects of the green deal such as biodiversity, sustainable food policy, pollution and the circular economy, and propose to make the respect of the Paris agreement an essential element in all future agreements’. The findings from this study can serve to inform the proposed chapter by highlighting the role of the EU in contributing to environmental impacts outside of its borders. Specifically, the chapter should focus on analysing strategies for promoting value chains that are sustainable and responsible. This aligns with SDG12 on responsible consumption and production. Specifically, the findings on country of origin of imports and sector-level impacts provide transparency on EU's international supply chains for future studies on feasibility of policies for mitigating negative impacts.
In July 2021, the European Commission adopted the new EU forest strategy where it reaffirms its full commitment to ensure that products, both from the EU and other countries, sold on the EU market do not contribute to global deforestation (European Commission, 2021i). The consequences of deforestation are wide-ranging, from climate change to desertification to soil erosion to habitat loss leading to wildlife extinction. This study provides a quantification of land use impacts resulting from agri-food products, which can inform future work on linking specific EU food supply chains with biodiversity threats abroad.
The adoption of the ‘European Green Deal’ and ‘Fit for 55 Package’ clarified the climate ambitions of the EU but also propelled the debates around policy coherence for sustainable development and the risks of carbon leakage at the forefront of EU policy decisions. Among the policy measures considered, the proposal from the European Commission, published in July 2021, was to apply a carbon border adjustment mechanism (CBAM) initially to a few selected products (e.g. cement, electricity, fertilisers, iron and steel, and aluminium products) and gradually extend the number of products covered in compliance with the WTO rules (European Commission, 2021e). As of this writing, it remains unclear how emissions from deforestation and land use will be accounted in the final version of the CBAM, but this study starts the conversation by providing quantitative estimates of land use impacts both within EU and outside of the EU. The French Government, which will have the Presidency of the EU Council as of January 2022, has already stated publicly that they will make it a priority to ‘tighten controls on agricultural imports of the EU27 in order to impose European environmental standards’ (agence Europe, 2021).
EU trade reforms and new mechanisms, such as the CBAM, might help with addressing some of the negative environmental impacts embodied into EU's trade and strengthen policy coherence. However, they must go hand in hand with clear communications and measures to support the transformation of energy and production systems in partner countries. This will help prevent accusations of ‘protectionism’. The EU is already the largest provider of Official Development Assistance (ODA) (European Commission, 2020a), although many individual Member States have still not achieved the target of dedicating 0.7% of their Gross National Income (GNI) to ODA. The EU is also the largest provider of aid for trade (European Commission, 2021d). Yet, rich countries, including several EU Member States, fell short in delivering on their commitment to mobilise US$100 billion each year by 2020, to help poorer countries adapt to climate change and mitigate further rises in temperature. France has transferred more than its fair share, but it is mostly in the form of repayable loans and not grants (Timperley, Reference Timperley2021). Channelling parts of the revenues generated by the CBAM (and other border adjustment measures) to the green transition worldwide could potentially be an effective way to avoid the protectionist trap (OXFAM, 2021).
Besides ODA and financial instruments, and as emphasised in the Farm to Fork Strategy (European Commission, 2021h), SDG/Green Deal Diplomacy (SDSN & IEEP, 2020) and strengthening technical cooperation, including via the transfer of green technologies to partner countries can also help partner countries move towards more sustainable production and agri-food systems. Finally, the EU should continue to promote the global transition to sustainable food systems in international standard setting bodies and fora and strengthen regional and bilateral partnerships, especially with China, Africa and Latin America, to support the transition to more sustainable food systems globally.
4.2 Food industry and companies
Agri-food companies engaged at various stages of the food supply chains (production, trade, processing, final sale) have a major role to play to promote a more sustainable food system. A review conducted in 2021 by SDSN and partners of the 100 largest food companies (including many European companies and companies operating in the EU) highlighted major gaps in companies' commitments, measures and contributions to the transition towards more sustainable food systems. In particular, the review revealed significant variations in the scope and coverage of sustainability reporting and ambitions and an absence of relevant key performance indicators (KPIs) and timelines for monitoring and addressing impacts generated by business partners/suppliers across the supply chains. Only 5% of the companies surveyed disclosed targets, years and timelines for ‘sustainable management of the supply chain’ in their sustainability reports. Ten per cent of the companies have KPIs to monitor deforestation and disqualify suppliers for non-compliance with basic sustainability criteria (Sachs et al., Reference Sachs, Agarwal, Espinosa, Mardirossian, Marrero, O'Dwyer, Plekenpol, Rincón, Diana, Sachs and Lisa2021a). Focusing on one specific food commodity – soy products – responsible for a significant share of the EU's imported GHG emissions and deforestation, Climate Focus and SDSN also highlighted the lack of meaningful indicators and targets in companies' sustainability reports to address adverse impacts on climate and biodiversity across the supply chain (Streck et al., Reference Streck, Hermann, Cabezas, Lafortune and Bellfield2019).
The SDSN and partners published its Four Pillar Framework to support the transformation of the food sector and companies' reporting aligned with the SDGs (Box S1). The Framework aims to offer practical steps for companies to align their business activities and operations with the SDGs and can also be used by investors and for informing corporate benchmarks.
The EU Due Diligence regulation may help strengthen the sustainability of EU's trade including environmental impacts embodied into the food supply chains. In March 2021, the European Parliament adopted a resolution setting out recommendations to the European Commission (EC) on corporate due diligence and accountability, including a draft directive. Aligned with the findings of many studies (for instance European Commission, 2020b), the resolution notably underlines the need to go beyond voluntary requirements and move towards mandatory requirements for businesses to prevent, report and address on a comprehensive set of environmental and social impacts. This may help promote the right ‘level-playing field’ at the industry and company level.
Member States are also strengthening their legal instruments to target companies' negative impacts generated abroad, yet implementation and enforcement remain major challenges. Germany adopted its ‘Act on Corporate Due Diligence in Supply Chains’ in June 2021, including binding obligations to report and address environmental and human rights impacts generated throughout supply chains. It covers companies with their registered office or principal place of business in Germany, as well as foreign companies that have a branch office in the country. The supply chain covers actions of a company in its own business sector, actions of a direct supplier and actions of an indirect supplier. The Act will come into force in January 2023. France adopted in 2017 a comprehensive Duty of Vigilance Law (‘Devoir de vigilance’), yet, four years after its adoption some studies underline the lack of compliance by many companies. It is recommended to strengthen enforcement mechanisms (Sherpa, 2021), including possibly through the creation of a dedicated supervisory authority.
Efforts to beef up the legislative arsenal in the EU to combat imported climate and biodiversity impacts (including deforestation) must be accompanied by further efforts by policy leaders, experts and other stakeholders to support companies' efforts to report and take actions, including small and medium size companies, and to scale-up innovative solutions to address such impacts for companies inside and outside the EU. These impacts, as highlighted in this study, can be either ‘positive’ in the form of job and income creation, or ‘negative’ in the form of emissions, land degradation or air pollution. Managing these trade-offs are vital for effective policy making. Countries need to ensure that trade liberalisation does not lead to exhaustion of natural resources, and appropriate pricing mechanisms are put in place for ensuring this. A harmonisation of environmental regulation across the developed and developing world would serve to not only strengthen multilateral relationships but also capacity building and policy coherence for a fairer and sustainable globalised world.
4.3 Consumers and sustainable diets
The transition towards more sustainable diets in the EU is essential for achieving the SDGs domestically and at the global scale. This would not only be beneficial for addressing the obesity ‘epidemic’ in the EU which leads to chronic diseases, increased health care costs and impacts negatively other aspects covered under SDG3 (Good Health and Well-Being), but also to address negative environmental impacts (including CO2, methane emissions and deforestation) domestically and internationally. The Intergovernmental Science-Policy Platform on Biodiversity and Ecosystem Services (IPBES) emphasises the need to shift towards more plant-based and less meat-based diets to achieve the objectives of the Paris Climate Agreement (IPBES, 2019; IPCC, 2019). Soy imports from the EU, notably to feed cattle, are a major driver of deforestation in the Amazon region, and especially in Brazil (Streck et al., Reference Streck, Hermann, Cabezas, Lafortune and Bellfield2019). This study emphasises the impacts generated abroad via EU's imports of ‘meat and fish’, ‘crop growing’ and ‘livestock farming’.
Integrated pathways can highlight system-wide implications of dietary shifts and help countries prepare for this transition. In the EU-27, the average national calorie intake is above 3,000 kcal/cap/day, and the average diet is characterised by a low share of cereals (about one-quarter of total calories), high share of animal sourced foods (almost a third) and high sugar and fat consumption. On average, fruits and vegetables barely make up 6% of daily calorie intake. Using the FABLE modelling framework that connects 20 countries' national food and land use system models (including the Germany, Finland and Sweden and the rest of the EU-27 as one group) and 6 RoW regions through international trade, a recent policy brief highlighted that shifts towards healthier diets could cut global GHG emissions from agriculture, forestry and other land use by half and reduce forest loss by 20% over the period 2030–2050 compared to current trends (FABLE, 2021). The ‘sustainable’ scenario combines efforts to shift towards healthier diets (consumption-side) and further actions towards sustainable production of food products (production-side).
Policy levers to support diet shifts must go hand in hand with careful assessments of the winners and losers from this transition. The Farm to Fork Strategy ‘aims to improve the availability and price of sustainable food and to promote adoption of healthy and sustainable diets by consumers’. The EU also launched various initiatives to promote healthier diets, labelling and education, mobilizing the Horizon Europe programme to identify dietary solutions and innovations. As emphasised by the Food Policy Coalition, a fair transition in food systems and diets will require closer integration with social, labour and economic policies. The coalition identifies ‘seven entry-points for action on food environments’ (food characteristic, labelling, promotion, provision, retail, prices and international agreements) that could be further leveraged to accelerate diet shifts in Europe (Food Policy Coalition, 2021).
5. Conclusion
Discussions and side-events at COP26 in Glasgow underlined the need for systemic approaches in addressing climate change that focus on the convergence of climate, biodiversity and living standards. This study emphasised that the consumption of agri-food commodities in the EU generates significant negative impacts abroad, in terms of carbon emissions, air pollution and land use. It also highlighted that many workers inside and outside the EU depend on food exports and production. By providing granular assessments of where in the world those negative environmental impacts take place and which agri-food sectors are responsible for such impacts (e.g. meat and fish, crop growing, cocoa, livestock farming, etc.) we hope that this study provides a useful contribution to help inform policies that aim to align specific supply chains with the objectives of the SDGs and the Paris Climate Agreement.
Policy reforms and actions by governments, businesses and consumers to transform the agri-food system and reduce their impacts on climate and biodiversity abroad must promote a ‘Just Transition’. The transformation of food and land systems is very complex. Border adjustment mechanisms and mirror clauses might help strengthen policy coherence and reduce carbon leakages and imported deforestation. Yet, they must go hand-in-hand with further efforts to support the transformation of energy, land use and agricultural systems in partner countries. Some recent announcements made at COP26 go in the right direction including the US and EU pledge to slash methane and the €1 billion EU pledge to protect world forests. Besides financial investments, technical cooperation can help in supporting greater sustainability in producing countries. The Just Transition for South Africa announced at COP26 by the UK, United States, France, Germany and the EU may pave the way for new forms of development cooperation and partnerships between developed and developing countries.
Strengthening sustainability in food supply chains also requires robust and timely statistics at the global, national, industry and company level. Particularly with regard to spillover effects, more data and research are needed in order to shed light on the extent to which the ability of poor and middle-income countries to achieve the SDGs is hampered by the rich countries' externalisation of domestic problems.
Recent work led by the European Commission Joint-Research Centre (JRC), Eurostat and the European Environmental Agency (EEA) endorses the development of more robust and timely consumption-based statistics disaggregated by sectors and supply chains and provide a more comprehensive assessment of the true footprint of the EU. The ability to put precise numbers on consumption-based impacts and impacts generated by specific industries and companies abroad is crucial for policy coherence and for aligning international supply chains, including the agri-food system, with the SDGs and objectives of the Paris Climate Agreement.
Supplementary material
The supplementary material for this article can be found at https://doi.org/10.1017/sus.2023.4.
Acknowledgments
We acknowledge advice and inputs provided by Barbara Kirsch and funding from Deutsche Gesellschaft fuer Internationale Zusammenarbeit (GIZ) GmbH.
Author contributions
G. L. and A. M. designed the study. A. M., S. C., M. Le. and M. Li carried out the calculations and prepared figures. A. M., G. L., S. D., Z. A. W., C. K., M. Le. and M. Li wrote the article.
Financial support
This work was supported by Deutsche Gesellschaft fuer Internationale Zusammenarbeit (GIZ) GmbH.
Conflict of interest
None
Research transparency and reproducibility
Results are based on data from https://ielab.info/resources/gloria/about


 Open access