


1 Introduction
When researchers design an experiment, they usually hold important details of the experiment constant. Equivalently, they choose among many different (but similar) experiments that test the same substantive claim. In practice, researchers typically select and run a single experiment (or perhaps a handful of experiments) from the collection of possibilities. Clifford, Leeper, and Rainey (Reference Clifford, Leeper and Rainey2023) refer to this collection of possibilities as “topics,” and Brutger et al. (Reference Brutger, Kertzer, Renshon, Tingley and Weiss2023) offer an excellent discussion of how topics might vary across experiments. For example, scholars interested in foreign policy attitudes might present respondents with a hypothetical scenario involving military intervention in a specific country (e.g., East Timor; Grieco et al. Reference Grieco, Gelpi, Reifler and Feaver2011), even though the general claim applies to hypothetical interventions in many different countries. Or researchers might investigate ideological asymmetries in political tolerance by randomizing between two specific social groups (e.g., Arabs vs. Americans; Lindner and Nosek Reference Lindner and Nosek2009), even though the claim applies to other groups as well. The term “topic” suggests substantive variation in the details of the experiment, including variation in the treatment, variation in the control, and/or variation in the experimental context. However, our ideas and methods generalize to ancillary variation as well (e.g., the level of detail in a vignette experiment).
This is a practical matter of experimental design. Researchers studying the effects of correcting misperceptions on affective polarization must correct some misperceptions, but which misperceptions should they correct? Researchers comparing a treatment to a placebo must use some placebo, but which placebos should they use?Footnote 1 Researchers using names to cue race and gender must use particular names, but which names should they use? We suspect that researchers are most interested in the substantive variation that these examples illustrate—thus our use of the term “topic.” However, researchers must also select ancillary details and may care about variation across these sets of details. If a photograph accompanies a mock news article, which photograph? If a survey experiment uses a vignette, how detailed?
We propose that researchers are usually not only interested in the treatment effect for the chosen topic, but in a more general treatment effect averaged over the topics in a population of interest. But when researchers study a single topic, they must either (1) assume that their findings generalize to the larger collection or (2) admit that their findings may have limited generalizability across topics (see Clifford and Rainey Reference Clifford and Rainey2023). Experimentalists are certainly aware that studies of particular topics might not generalize to other conceptually similar topics. Like many others, Chong and Druckman (Reference Chong and Druckman2013, 14) engage thoughtfully with this limitation:
Our results are potentially circumscribed by our focus on a single issue and a single approach to operationalizing attitude strength. However, we believe our theory should apply to any issue, including hotly debated issues on which most people hold strong prior opinions; attempts to frame public opinion on such issues will be more difficult or may fail outright.
Clifford et al. (Reference Clifford, Leeper and Rainey2023) propose that researchers use topic sampling to generalize empirically, rather than simply speculate about generalizability (see also Porter and Velez Reference Porter and Velez2022; Tappin Reference Tappin2023).Footnote 2 Rather than assigning many respondents to a particular topic, they suggest assigning a slightly larger number of total respondents to many different topics (i.e., about 20% to 50% more respondents and 25 to 50 total topics) and then aggregating those many separate treatment effects into (1) a typical treatment effect across topics and (2) a summary of the heterogeneity across topics. Several recent papers suggest a hierarchical model and illustrate its use for this basic design, but do not motivate their estimator in detail (e.g., Clifford et al. Reference Clifford, Leeper and Rainey2023; Tappin Reference Tappin2023; Tappin, Berinsky, and Rand Reference Tappin, Berinsky and Rand2023; Wittenberg et al. Reference Wittenberg, Tappin, Berinsky and Rand2021). In this paper, we thoroughly describe and defend the estimators.
We describe two estimators for topic-sampling designs. To fix ideas, we imagine a collection of experiments indexed by $j$
. For any particular topic j, researchers can use a randomized experiment to estimate the average treatment effect
$j$
. For any particular topic j, researchers can use a randomized experiment to estimate the average treatment effect ${\delta}_j={\overline{Y}}_j^T-{\overline{Y}}_j^C$
for each particular topic, where
${\delta}_j={\overline{Y}}_j^T-{\overline{Y}}_j^C$
for each particular topic, where ${\overline{Y}}_j^T$
and
${\overline{Y}}_j^T$
and ${\overline{Y}}_j^C$
represent the average potential outcomes across respondents for topic
${\overline{Y}}_j^C$
represent the average potential outcomes across respondents for topic $j$
under treatment and control, respectively.Footnote
3
While researchers would like to generalize beyond the study of a single topic, the experiment requires fixing details, so the treatment effect is only defined for a particular topic
$j$
under treatment and control, respectively.Footnote
3
While researchers would like to generalize beyond the study of a single topic, the experiment requires fixing details, so the treatment effect is only defined for a particular topic $j$
. Much like the average marginal component effect (AMCE) estimand from a conjoint design marginalizes over attributes (Hainmueller, Hopkins, and Yamamoto Reference Hainmueller, Hopkins and Yamamoto2014), we suggest marginalizing across topics. We define a typical treatment effect
$j$
. Much like the average marginal component effect (AMCE) estimand from a conjoint design marginalizes over attributes (Hainmueller, Hopkins, and Yamamoto Reference Hainmueller, Hopkins and Yamamoto2014), we suggest marginalizing across topics. We define a typical treatment effect $\overline{\delta}$
as the average of treatment effects for particular topics
$\overline{\delta}$
as the average of treatment effects for particular topics ${\delta}_j$
(i.e., “typical” across topics). If we conceive of topics as a population of size
${\delta}_j$
(i.e., “typical” across topics). If we conceive of topics as a population of size $\mathcal{J}$
(e.g., that we can randomly sample from), then
$\mathcal{J}$
(e.g., that we can randomly sample from), then $\overline{\delta}=\frac{1}{\mathcal{J}}\sum _{j=1}^{\mathcal{J}}{\delta}_j=\mathrm{avg}\left(\delta \right)$
. Alternatively, we might consider the
$\overline{\delta}=\frac{1}{\mathcal{J}}\sum _{j=1}^{\mathcal{J}}{\delta}_j=\mathrm{avg}\left(\delta \right)$
. Alternatively, we might consider the ${\delta}_j$
as exchangeable random variables and define
${\delta}_j$
as exchangeable random variables and define $\overline{\delta}=E\left(\delta \right)$
.
$\overline{\delta}=E\left(\delta \right)$
.
In addition to the typical treatment effect $\overline{\delta}$
, researchers might want to describe the variation in the treatment effects across topics. At a minimum, we suggest estimating (1) the standard deviation (SD) of the treatment effects across topics and (2) the treatment effects for particular topics. However, the description of the variation across topics becomes especially rich when researchers use topic-level predictors to characterize the variation in treatment effects across topics.
$\overline{\delta}$
, researchers might want to describe the variation in the treatment effects across topics. At a minimum, we suggest estimating (1) the standard deviation (SD) of the treatment effects across topics and (2) the treatment effects for particular topics. However, the description of the variation across topics becomes especially rich when researchers use topic-level predictors to characterize the variation in treatment effects across topics.
Below, we develop two estimators for topic-sampling designs. First, we use the assumption of random sampling of topics to develop a nonparametric estimator for the typical treatment effect. Second, we use the assumption of exchangeability to develop a parametric, hierarchical model to characterize the heterogeneity across topics: the SD around the (conditional) typical effect, estimates of the treatment effects for particular topics, and the typical effect conditional on topic-level predictors. We use the Strengthening Democracy Challenge (SDC) megastudy (Voelkel et al. Reference Voelkel2023) to demonstrate the effectiveness of the hierarchical model in a real data set.
2 A Nonparametric Estimator of the Typical Effect
First, we sketch a nonparametric estimator from the design-based assumptions of (1) a random sample of topics from a population of interest and (2) random assignment to treatment and control within each of these topics. To motivate these estimators, we assume that researchers recruit $N$
participants. Then, researchers randomly assign each participant to
$N$
participants. Then, researchers randomly assign each participant to $M\in \left\{1,2,\dots, J\right\}$
topics. For each of these
$M\in \left\{1,2,\dots, J\right\}$
topics. For each of these $M$
topics, researchers randomly assign each respondent to treatment and control. This assignment can be independent across topics for each respondent (e.g., Tappin Reference Tappin2023) or each respondent might be randomly assigned to treatment for
$M$
topics, researchers randomly assign each respondent to treatment and control. This assignment can be independent across topics for each respondent (e.g., Tappin Reference Tappin2023) or each respondent might be randomly assigned to treatment for $V$
topics, where
$V$
topics, where $1\le V\le M-1$
, and to control for the other
$1\le V\le M-1$
, and to control for the other $M-V$
topics (e.g., Clifford et al. (Reference Clifford, Leeper and Rainey2023) use
$M-V$
topics (e.g., Clifford et al. (Reference Clifford, Leeper and Rainey2023) use $V=1$
, assigning respondents to treatment for one topic and to control for five topics).
$V=1$
, assigning respondents to treatment for one topic and to control for five topics).
2.1 Point Estimates
Researchers can estimate the treatment effect for the particular topic $j$
as the difference in means between the treatment and control groups for topic
$j$
as the difference in means between the treatment and control groups for topic $j$
, so that
$j$
, so that ${\widehat{\delta}}_j={\overline{y}}_j^T-{\overline{y}}_j^C$
, where
${\widehat{\delta}}_j={\overline{y}}_j^T-{\overline{y}}_j^C$
, where ${\overline{y}}_j^T$
and
${\overline{y}}_j^T$
and ${\overline{y}}_j^C$
represent the sample averages of the treatment and control groups for topic
${\overline{y}}_j^C$
represent the sample averages of the treatment and control groups for topic $j$
. Then, researchers can estimate the typical treatment effect using the average of the estimates for particular topics, so that
$j$
. Then, researchers can estimate the typical treatment effect using the average of the estimates for particular topics, so that $\widehat{\overline{\delta}}=\frac{1}{J}\sum _{j=1}^J{\widehat{\delta}}_j=\mathrm{avg}\left(\widehat{\delta}\right)$
for
$\widehat{\overline{\delta}}=\frac{1}{J}\sum _{j=1}^J{\widehat{\delta}}_j=\mathrm{avg}\left(\widehat{\delta}\right)$
for $\widehat{\delta}=\left\{{\widehat{\delta}}_1,\dots, {\widehat{\delta}}_J\right\}$
.
$\widehat{\delta}=\left\{{\widehat{\delta}}_1,\dots, {\widehat{\delta}}_J\right\}$
.
2.2 Variance Estimates and Confidence Intervals (CIs)
We focus on a scenario in which the population of topics is large, so researchers take a simple random sample of $J$
topics to use in their experiment. For example, Clifford et al. (Reference Clifford, Leeper and Rainey2023) take a random sample of 48 policies from a population of 154. In this situation, there is uncertainty due to (1) random assignment of respondents to topics and treatment/control and (2) random sampling of topics. In this case, we have
$J$
topics to use in their experiment. For example, Clifford et al. (Reference Clifford, Leeper and Rainey2023) take a random sample of 48 policies from a population of 154. In this situation, there is uncertainty due to (1) random assignment of respondents to topics and treatment/control and (2) random sampling of topics. In this case, we have $\mathrm{Var}\big(\widehat{\overline{\delta}}\big)=\mathrm{Var}\left(\frac{1}{J}\sum _{j=1}^J{\widehat{\delta}}_j\right)=\frac{1}{J^2}\mathrm{Var}\left(\sum _{j=1}^J{\widehat{\delta}}_j\right)\le \frac{1}{J^2}\sum _{j=1}^J\mathrm{Var}\left({\widehat{\delta}}_j\right)$
. For example, the estimate of the treatment effect for the first topic
$\mathrm{Var}\big(\widehat{\overline{\delta}}\big)=\mathrm{Var}\left(\frac{1}{J}\sum _{j=1}^J{\widehat{\delta}}_j\right)=\frac{1}{J^2}\mathrm{Var}\left(\sum _{j=1}^J{\widehat{\delta}}_j\right)\le \frac{1}{J^2}\sum _{j=1}^J\mathrm{Var}\left({\widehat{\delta}}_j\right)$
. For example, the estimate of the treatment effect for the first topic ${\widehat{\delta}}_1$
varies because (1) the first topic is randomly sampled, (2) respondents are randomly assigned to this first topic, and (3) respondents are randomly assigned to treatment and control within this first topic. Fortunately, the experiment offers
${\widehat{\delta}}_1$
varies because (1) the first topic is randomly sampled, (2) respondents are randomly assigned to this first topic, and (3) respondents are randomly assigned to treatment and control within this first topic. Fortunately, the experiment offers $J$
replicates of
$J$
replicates of ${\widehat{\delta}}_j$
, so we can plug in the sample variance of
${\widehat{\delta}}_j$
, so we can plug in the sample variance of $\widehat{\delta}=\left\{{\widehat{\delta}}_1,\dots, {\widehat{\delta}}_J\right\}$
, which is
$\widehat{\delta}=\left\{{\widehat{\delta}}_1,\dots, {\widehat{\delta}}_J\right\}$
, which is $\operatorname{var}\left(\widehat{\delta}\right)=\frac{1}{J-1}\sum _{j=1}^J\left[{\left({\widehat{\delta}}_j-\widehat{\overline{\delta}}\right)}^2\right]$
. This produces
$\operatorname{var}\left(\widehat{\delta}\right)=\frac{1}{J-1}\sum _{j=1}^J\left[{\left({\widehat{\delta}}_j-\widehat{\overline{\delta}}\right)}^2\right]$
. This produces $\widehat{\mathrm{Var}}\big(\widehat{\overline{\delta}}\big)=\frac{1}{J^2}\sum _{j=1}^J\overset{\begin{array}{c}\scriptsize \mathrm{sample}\kern0.17em \mathrm{variance}\kern0.17em \mathrm{of}\kern0.17em \mathrm{the}\kern0.17em \mathrm{point}\\[-0.5em] \scriptsize {}\mathrm{estimates}\kern0.17em \mathrm{for}\kern0.17em \mathrm{particular}\kern0.17em \mathrm{topics}\end{array}}{\overbrace{\left[\frac{1}{J-1}\sum _{j=1}^J{\left({\widehat{\delta}}_j-\widehat{\overline{\delta}}\right)}^2\right]}}=\frac{1}{J}\operatorname{var}\left(\widehat{\delta}\right)$
. Researchers can treat
$\widehat{\mathrm{Var}}\big(\widehat{\overline{\delta}}\big)=\frac{1}{J^2}\sum _{j=1}^J\overset{\begin{array}{c}\scriptsize \mathrm{sample}\kern0.17em \mathrm{variance}\kern0.17em \mathrm{of}\kern0.17em \mathrm{the}\kern0.17em \mathrm{point}\\[-0.5em] \scriptsize {}\mathrm{estimates}\kern0.17em \mathrm{for}\kern0.17em \mathrm{particular}\kern0.17em \mathrm{topics}\end{array}}{\overbrace{\left[\frac{1}{J-1}\sum _{j=1}^J{\left({\widehat{\delta}}_j-\widehat{\overline{\delta}}\right)}^2\right]}}=\frac{1}{J}\operatorname{var}\left(\widehat{\delta}\right)$
. Researchers can treat $\widehat{\mathrm{Var}}\big(\widehat{\overline{\delta}}\big)$
as following a chi-squared distribution and create
$\widehat{\mathrm{Var}}\big(\widehat{\overline{\delta}}\big)$
as following a chi-squared distribution and create $\left(1-\alpha \right)\times 100\%$
CIs of the form
$\left(1-\alpha \right)\times 100\%$
CIs of the form $\widehat{\overline{\delta}}\pm {t}_{\frac{\alpha }{2}, df}\;\sqrt{\widehat{\mathrm{Var}}\big(\widehat{\overline{\delta}}\big)}$
, where
$\widehat{\overline{\delta}}\pm {t}_{\frac{\alpha }{2}, df}\;\sqrt{\widehat{\mathrm{Var}}\big(\widehat{\overline{\delta}}\big)}$
, where $df=J-1$
(e.g.,
$df=J-1$
(e.g., $\widehat{\overline{\delta}}\pm 1.71\sqrt{\widehat{\mathrm{Var}}\big(\widehat{\overline{\delta}}\big)}$
for a 90% CI when
$\widehat{\overline{\delta}}\pm 1.71\sqrt{\widehat{\mathrm{Var}}\big(\widehat{\overline{\delta}}\big)}$
for a 90% CI when $J=25$
).
$J=25$
).
2.2.1 Assigning Each Respondent to Multiple Topics
In some applications, researchers may want to assign the same respondent to multiple topics. If this is a sensible option for researchers’ application, we strongly suggest it. For example, Clifford et al. (Reference Clifford, Leeper and Rainey2023) assign respondents to six policies at random; the first five are always control, and the sixth is always treatment. Tappin (Reference Tappin2023) randomly assigns respondents to six of 34 policies and assigns respondents independently to treatment and control across policies. Assigning respondents to multiple topics allows researchers to drastically increase their statistical power for a similar cost. Whether researchers assign respondents to one, several, or all topics does not affect the validity of the point estimators or CIs above.
However, assigning respondents to multiple conditions can potentially introduce order effects (for discussion, see Mutz Reference Mutz2011). Whether order effects are a concern will depend on the application, but these types of concerns seem overstated (e.g., Clifford, Sheagley, and Piston Reference Clifford, Sheagley and Piston2021; Mummolo and Peterson Reference Mummolo and Peterson2019). For example, Tappin (Reference Tappin2023) makes the case that these order effects are minimal in his experiment on party cues. Similarly, researchers can use a well-powered pilot test on a narrow set of topics to assess the magnitude of order effects. If researchers are worried about spillover effects, they might follow the practice of Clifford et al. (Reference Clifford, Leeper and Rainey2023) and assign respondents to control conditions for multiple topics and a treatment condition for a single topic after the control conditions. If researchers are not worried about spillover, then assigning respondents to several topics and to the same number of treatment and control conditions produces more precise estimates.
3 Extensions: When the Topic Is a Treatment (or a Control, or Both)
In the discussion above, we imagine that potential outcomes for treatment and control exist within each topic, so that ${\delta}_j={\overline{Y}}_j^T-{\overline{Y}}_j^C$
is defined for each topic. However, some applications might have topics that represent either treatment conditions or control conditions. In this case, the treatment effect is not defined within a topic, so our framework requires adjustment. We consider three extensions.
${\delta}_j={\overline{Y}}_j^T-{\overline{Y}}_j^C$
is defined for each topic. However, some applications might have topics that represent either treatment conditions or control conditions. In this case, the treatment effect is not defined within a topic, so our framework requires adjustment. We consider three extensions.
-
1. Extension 1a: The topics are distinct treatments. In this scenario, researchers compare many treatment groups to a single control group. For example, Voelkel et al. (Reference Voelkel2023) consider 25 interventions that might reduce affective polarization. We might think of these many treatments as “topics” in our framework. However, the control group in their study receives no such treatment, and thus, the topic does not vary in the control group.
-
2. Extension 1b: The topics are distinct controls. In this scenario, researchers compare a single treatment group to many control groups. For example, Porter and Velez (Reference Porter and Velez2022) use a large collection of placebos generated via GPT-2 as a control group. We might think of each placebo as a “topic.” However, these topics only vary in the control group; the treatment group receives a single treatment, and thus, the topic does not vary in the treatment group.
-
3. Extension 2: The topics are either treatments or controls. In this scenario, researchers compare many treatment groups to many control groups. For example, researchers use collections of names associated with racial groups to cue race (e.g., Bertrand and Mullainathan Reference Bertrand and Mullainathan2004; Crabtree et al. Reference Crabtree, Gaddis, Holbein and Larsen2022; Elder and Hayes Reference Elder and Hayes2023). In this case, we might think of the particular name (e.g., Octavia, Misty) as the “topic” and think of the racial category of the name (e.g., Black, white) as the treatment and control conditions (see Elder and Hayes Reference Elder and Hayes2023). In this case, the topic (i.e., the name) varies within both the treatment and control groups, but the treatment and control groups contain distinct topics.
The intuition from the baseline design generalizes easily to the extensions, but the formalization differs somewhat. For the baseline design, each topic has its own treatment and control groups. In that case, it is natural to think about the “typical” treatment effect $\overline{\delta}=\mathrm{avg}\left(\delta \right).$
But when topics do not include both a treatment group and a control group, this motivation no longer works. Instead, we must think about the typical effect as the difference between (1) the average (or “typical”) average potential outcome among treatment topics and (2) the average (or “typical”) average potential outcome among control topics. In this case,
$\overline{\delta}=\mathrm{avg}\left(\delta \right).$
But when topics do not include both a treatment group and a control group, this motivation no longer works. Instead, we must think about the typical effect as the difference between (1) the average (or “typical”) average potential outcome among treatment topics and (2) the average (or “typical”) average potential outcome among control topics. In this case, $\overline{\delta}=\overset{\begin{array}{c}\scriptsize \mathrm{typical}\kern0.17em \mathrm{outcome}\kern0.17em \mathrm{among}\\[-0.5em] \scriptsize {}\mathrm{treatment}\kern0.17em \mathrm{topics}\end{array}}{\overbrace{\left[\frac{1}{{\mathcal{J}}_T}\sum _{j=1}^{{\mathcal{J}}_T}{\overline{Y}}_j^T\right]}}-\overset{\begin{array}{c}\scriptsize \mathrm{typical}\kern0.17em \mathrm{outcome}\kern0.17em \mathrm{among}\\[-0.5em] \scriptsize {}\mathrm{control}\kern0.17em \mathrm{topics}\end{array}}{\overbrace{\left[\frac{1}{{\mathcal{J}}_C}\sum _{j=1}^{{\mathcal{J}}_C}{\overline{Y}}_j^C\right]}}$
, where
$\overline{\delta}=\overset{\begin{array}{c}\scriptsize \mathrm{typical}\kern0.17em \mathrm{outcome}\kern0.17em \mathrm{among}\\[-0.5em] \scriptsize {}\mathrm{treatment}\kern0.17em \mathrm{topics}\end{array}}{\overbrace{\left[\frac{1}{{\mathcal{J}}_T}\sum _{j=1}^{{\mathcal{J}}_T}{\overline{Y}}_j^T\right]}}-\overset{\begin{array}{c}\scriptsize \mathrm{typical}\kern0.17em \mathrm{outcome}\kern0.17em \mathrm{among}\\[-0.5em] \scriptsize {}\mathrm{control}\kern0.17em \mathrm{topics}\end{array}}{\overbrace{\left[\frac{1}{{\mathcal{J}}_C}\sum _{j=1}^{{\mathcal{J}}_C}{\overline{Y}}_j^C\right]}}$
, where ${\mathcal{J}}_T$
and
${\mathcal{J}}_T$
and ${\mathcal{J}}_C$
represent the number of topics in the treatment and control groups and
${\mathcal{J}}_C$
represent the number of topics in the treatment and control groups and ${\overline{Y}}_j^T$
and
${\overline{Y}}_j^T$
and ${\overline{Y}}_j^C$
represent the average potential outcomes in the (distinct)
${\overline{Y}}_j^C$
represent the average potential outcomes in the (distinct) $j$
th topics for the treatment and control groups, respectively. When the control group has “no topic,” then we can set
$j$
th topics for the treatment and control groups, respectively. When the control group has “no topic,” then we can set ${\mathcal{J}}_C=1$
so that
${\mathcal{J}}_C=1$
so that $\frac{1}{{\mathcal{J}}_C}\sum _{j=1}^{{\mathcal{J}}_C}{\overline{Y}}_j^C$
simplifies to
$\frac{1}{{\mathcal{J}}_C}\sum _{j=1}^{{\mathcal{J}}_C}{\overline{Y}}_j^C$
simplifies to ${\overline{Y}}^C$
. When the treatment group has no topic,
${\overline{Y}}^C$
. When the treatment group has no topic, $\left[\frac{1}{{\mathcal{J}}_T}\sum _{j=1}^{{\mathcal{J}}_T}{\overline{Y}}_j^T\right]$
simplifies similarly to
$\left[\frac{1}{{\mathcal{J}}_T}\sum _{j=1}^{{\mathcal{J}}_T}{\overline{Y}}_j^T\right]$
simplifies similarly to ${\overline{Y}}^T$
. To obtain point estimates, we can plug the sample means into
${\overline{Y}}^T$
. To obtain point estimates, we can plug the sample means into $\left[\frac{1}{{\mathcal{J}}_T}\sum _{j=1}^{{\mathcal{J}}_T}{\overline{Y}}_j^T\right]$
and
$\left[\frac{1}{{\mathcal{J}}_T}\sum _{j=1}^{{\mathcal{J}}_T}{\overline{Y}}_j^T\right]$
and ${\overline{Y}}^C$
to obtain
${\overline{Y}}^C$
to obtain $\left[\frac{1}{J_T}\sum _{j=1}^{J_T}{\overline{y}}_j^T\right]$
and
$\left[\frac{1}{J_T}\sum _{j=1}^{J_T}{\overline{y}}_j^T\right]$
and ${\overline{y}}^C$
, for example.
${\overline{y}}^C$
, for example.
Randomization and inference also work slightly differently under the extensions. In the baseline design, researchers assign respondents randomly to topics and then to treatment and control within those topics. Thus, the assignment to treatment and topic are independent of the baseline design. For the extensions, there is no treatment and control within topics, and there are only topics that are considered as “treatments” or “controls.” To maintain the intuition in the extensions, we assume that respondents are first randomly assigned to treatment or control and then randomly assigned a single topic.
Consider the variance estimates for Extension 1a first. We can estimate $\mathrm{Var}\left[\frac{1}{{J}_T}\sum _{j=1}^{{J}_T}{\overline{y}}_j^T\right]$
using
$\mathrm{Var}\left[\frac{1}{{J}_T}\sum _{j=1}^{{J}_T}{\overline{y}}_j^T\right]$
using $\frac{1}{J^T}\operatorname{var}\left({\overline{y}}^T\right)$
, where
$\frac{1}{J^T}\operatorname{var}\left({\overline{y}}^T\right)$
, where ${\overline{y}}^T=\left\{{\overline{y}}_1^T,\dots, {\overline{y}}_{J^T}^T\right\}$
and
${\overline{y}}^T=\left\{{\overline{y}}_1^T,\dots, {\overline{y}}_{J^T}^T\right\}$
and ${J}^T$
represents the number of topics in the treatment group. We can then estimate
${J}^T$
represents the number of topics in the treatment group. We can then estimate $\mathrm{Var}\left({\overline{y}}^C\right)$
using
$\mathrm{Var}\left({\overline{y}}^C\right)$
using $\frac{\operatorname{var}\left({y}^C\right)}{N^C}$
, where
$\frac{\operatorname{var}\left({y}^C\right)}{N^C}$
, where ${N}_C$
is the number of respondents in the single control group, which is the usual variance estimator for randomized experiments. Finally, we can estimate the variance of the point estimate
${N}_C$
is the number of respondents in the single control group, which is the usual variance estimator for randomized experiments. Finally, we can estimate the variance of the point estimate $\widehat{\overline{\delta}}=\left[\frac{1}{{J}_T}\sum _{j=1}^{{J}_T}{\overline{y}}_j^T\right]-{\overline{y}}^C$
using
$\widehat{\overline{\delta}}=\left[\frac{1}{{J}_T}\sum _{j=1}^{{J}_T}{\overline{y}}_j^T\right]-{\overline{y}}^C$
using $\widehat{\mathrm{Var}}\big(\widehat{\overline{\delta}}\big)=\frac{1}{J^T}\operatorname{var}\left({\overline{y}}^T\right)+\frac{\operatorname{var}\left({y}^C\right)}{N^C}$
.
$\widehat{\mathrm{Var}}\big(\widehat{\overline{\delta}}\big)=\frac{1}{J^T}\operatorname{var}\left({\overline{y}}^T\right)+\frac{\operatorname{var}\left({y}^C\right)}{N^C}$
.
The estimates are analogous for $\left[\frac{1}{{\mathcal{J}}_C}\sum _{j=1}^{{\mathcal{J}}_C}{\overline{Y}}^C\right]$
and
$\left[\frac{1}{{\mathcal{J}}_C}\sum _{j=1}^{{\mathcal{J}}_C}{\overline{Y}}^C\right]$
and ${\overline{Y}}^T$
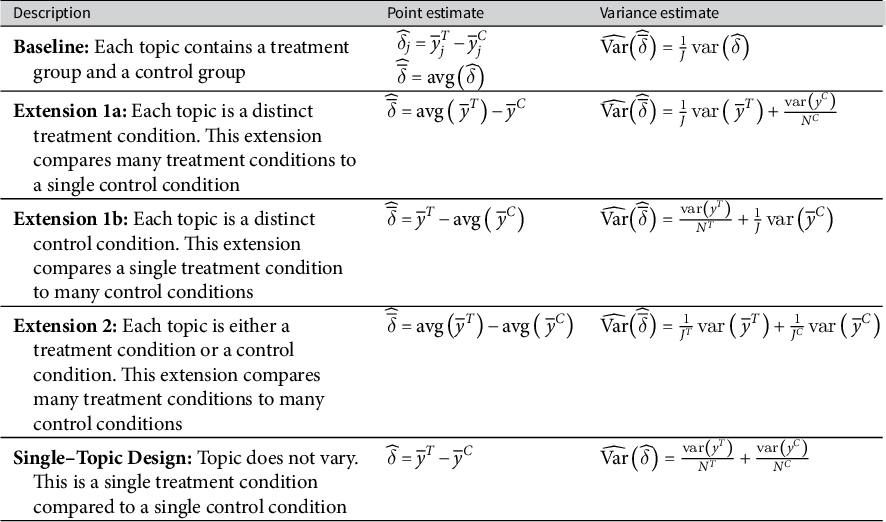
. Table 1 shows the point and variance estimates for the extensions as well as a single-topic design for comparison.
${\overline{Y}}^T$
. Table 1 shows the point and variance estimates for the extensions as well as a single-topic design for comparison.
This table shows the point estimates for the typical effect and the associated variance estimates for the baseline design, the three extensions, and the single-topic design.
Similar to the baseline design, researchers can treat $\widehat{\mathrm{Var}}\big(\widehat{\overline{\delta}}\big)$
as following a chi-squared distribution and create
$\widehat{\mathrm{Var}}\big(\widehat{\overline{\delta}}\big)$
as following a chi-squared distribution and create $\left(1-\alpha \right)\times 100\%$
CIs of the form
$\left(1-\alpha \right)\times 100\%$
CIs of the form $\widehat{\overline{\delta}}\pm {t}_{\frac{\alpha }{2}, df}\;\sqrt{\widehat{\mathrm{Var}}\big(\widehat{\overline{\delta}}\big)}.$
However, the degrees of freedom calculation can be improved slightly. Following the Welch–Satterthwaite approach, the generic expression for the degrees of freedom adjustment in the extensions is
$\widehat{\overline{\delta}}\pm {t}_{\frac{\alpha }{2}, df}\;\sqrt{\widehat{\mathrm{Var}}\big(\widehat{\overline{\delta}}\big)}.$
However, the degrees of freedom calculation can be improved slightly. Following the Welch–Satterthwaite approach, the generic expression for the degrees of freedom adjustment in the extensions is $df=\frac{{\left({\widehat{V}}_1+{\widehat{V}}_2\right)}^2}{\frac{{\widehat{V}}_1^2}{d{f}_1}+\frac{{\widehat{V}}_2^2}{d{f}_2}}$
. For Extension 1a, we have
$df=\frac{{\left({\widehat{V}}_1+{\widehat{V}}_2\right)}^2}{\frac{{\widehat{V}}_1^2}{d{f}_1}+\frac{{\widehat{V}}_2^2}{d{f}_2}}$
. For Extension 1a, we have ${\widehat{V}}_1=\frac{1}{J}\operatorname{var}\left({\overline{y}}^T\right)$
,
${\widehat{V}}_1=\frac{1}{J}\operatorname{var}\left({\overline{y}}^T\right)$
, $d{f}_1=J-1,{\widehat{V}}_2=\frac{\operatorname{var}\left({y}^C\right)}{N^C}$
, and
$d{f}_1=J-1,{\widehat{V}}_2=\frac{\operatorname{var}\left({y}^C\right)}{N^C}$
, and $d{f}_2={N}_c-1.$
For Extension 1b, we have
$d{f}_2={N}_c-1.$
For Extension 1b, we have ${\widehat{V}}_1=\frac{\operatorname{var}\left({y}^T\right)}{N^T}$
,
${\widehat{V}}_1=\frac{\operatorname{var}\left({y}^T\right)}{N^T}$
, $d{f}_1={N}_T-1$
,
$d{f}_1={N}_T-1$
, ${\widehat{V}}_2=\frac{1}{J}\operatorname{var}\left({\overline{y}}^C\right)$
, and
${\widehat{V}}_2=\frac{1}{J}\operatorname{var}\left({\overline{y}}^C\right)$
, and $d{f}_2=J-1.$
For Extension 2, we have
$d{f}_2=J-1.$
For Extension 2, we have ${\widehat{V}}_1=\frac{1}{J_T}\operatorname{var}\left({\overline{y}}^T\right)$
,
${\widehat{V}}_1=\frac{1}{J_T}\operatorname{var}\left({\overline{y}}^T\right)$
, $d{f}_1={J}_T-1$
,
$d{f}_1={J}_T-1$
, $\frac{1}{J_C}\operatorname{var}\left({\overline{y}}^C\right)$
, and
$\frac{1}{J_C}\operatorname{var}\left({\overline{y}}^C\right)$
, and $d{f}_2={J}_C-1$
.
$d{f}_2={J}_C-1$
.
The nonparametric estimators above are relatively straightforward and depend only on design-based assumptions. However, the nonparametric approach above is limited—it only estimates the typical treatment effect. To summarize the heterogeneity across topics, we suggest a hierarchical model.
4 A Hierarchical Model of the Heterogeneity
A premise of topic sampling is that treatment effects vary across topics; indeed, that is the motivation for including multiple topics in the study. This variation implies three or four quantities of interest: (1) the typical treatment effect across topics, (2) the amount of variation across topics (e.g., the SD), (3) the treatment effects for particular topics, and (4) descriptions of how the treatment effects vary with topic-level predictors. The nonparametric approach above works well for the typical treatment effect. However, the hierarchical model adds just a little structure, allowing researchers to estimate a much richer set of quantities of interest.
To motivate the hierarchical model, we assume that the treatment effects for particular topics ${\delta}_j$
are exchangeable.Footnote
4
Formally, this means that the treatment effects
${\delta}_j$
are exchangeable.Footnote
4
Formally, this means that the treatment effects ${\delta}_1,{\delta}_2,\dots, {\delta}_J$
have the same joint distribution as any permutation
${\delta}_1,{\delta}_2,\dots, {\delta}_J$
have the same joint distribution as any permutation ${\delta}_{\left[1\right]},{\delta}_{\left[2\right]},\dots, {\delta}_{\left[J\right]}$
. A simple random sample of topics guarantees that exchangeability holds in the sense that the
${\delta}_{\left[1\right]},{\delta}_{\left[2\right]},\dots, {\delta}_{\left[J\right]}$
. A simple random sample of topics guarantees that exchangeability holds in the sense that the $j$
th topic is selected at random. However, exchangeability has a subtler and useful interpretation. We suggest thinking of exchangeability as a structural prior (Gelman, Simpson, and Betancourt Reference Gelman, Simpson and Betancourt2017). That is, we suggest thinking of the effects as “different but similar” or as draws from a distribution with a parameter that captures the similarity. Substantively, this means the label for the topic contains no information about its treatment effect; Gelman et al. (Reference Gelman, Carlin, Stern and Rubin2004) write that “ignorance implies exchangeability” (121) and that “with no information available to distinguish [the parameters], we have no logical choice but to model [the parameters] exchangeably” (124).
$j$
th topic is selected at random. However, exchangeability has a subtler and useful interpretation. We suggest thinking of exchangeability as a structural prior (Gelman, Simpson, and Betancourt Reference Gelman, Simpson and Betancourt2017). That is, we suggest thinking of the effects as “different but similar” or as draws from a distribution with a parameter that captures the similarity. Substantively, this means the label for the topic contains no information about its treatment effect; Gelman et al. (Reference Gelman, Carlin, Stern and Rubin2004) write that “ignorance implies exchangeability” (121) and that “with no information available to distinguish [the parameters], we have no logical choice but to model [the parameters] exchangeably” (124).
Of course, researchers are not always ignorant of how the treatment effects vary across topics. This does not pose a major problem for the assumption of exchangeability, though. If researchers have knowledge of how the treatment effect ${\delta}_j$
varies across topics, then researchers can use topic-level predictors to explicitly model the topic-level variation and obtain exchangeability (conditional on predictors). In other words, they can model the expected variation across topics and treat the unexpected variation as exchangeable. For example, Clifford et al. (Reference Clifford, Leeper and Rainey2023) model the effect of partisan cues using the public’s awareness of parties’ positions on the policies. Adding topic-level predictors changes the motivation and computation only a little, but it meaningfully changes the interpretation of the model parameters, so we discuss each separately. We first discuss models without topic-level predictors.
${\delta}_j$
varies across topics, then researchers can use topic-level predictors to explicitly model the topic-level variation and obtain exchangeability (conditional on predictors). In other words, they can model the expected variation across topics and treat the unexpected variation as exchangeable. For example, Clifford et al. (Reference Clifford, Leeper and Rainey2023) model the effect of partisan cues using the public’s awareness of parties’ positions on the policies. Adding topic-level predictors changes the motivation and computation only a little, but it meaningfully changes the interpretation of the model parameters, so we discuss each separately. We first discuss models without topic-level predictors.
4.1 Models without Topic-Level Predictors of the Treatment Effect
We begin in the scenario where each respondent is assigned to a single topic and then randomly assigned to treatment or control. We imagine a hierarchical normal–linear model ${y}_i={\alpha}_{j\left[i\right]}+{\delta}_{j\left[i\right]}{T}_i+{\epsilon}_i$
, where
${y}_i={\alpha}_{j\left[i\right]}+{\delta}_{j\left[i\right]}{T}_i+{\epsilon}_i$
, where ${{\epsilon}_i\sim N\left(0,{\sigma}_{\epsilon}^2\right)}$
. In short, we imagine separate regressions for each topic (but assume a constant variance across topics). Critically, we model the intercept and slope as batches of different-but-similar parameters, so that
${{\epsilon}_i\sim N\left(0,{\sigma}_{\epsilon}^2\right)}$
. In short, we imagine separate regressions for each topic (but assume a constant variance across topics). Critically, we model the intercept and slope as batches of different-but-similar parameters, so that
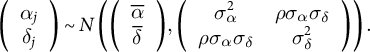 $$\begin{align*}\left(\begin{array}{c}{\alpha}_j\\ {}{\delta}_j\end{array}\right)\sim N\left(\left(\begin{array}{c}\overline{\alpha}\\ {}\overline{\delta}\end{array}\right),\left(\begin{array}{cc}{\sigma}_{\alpha}^2& \rho {\sigma}_{\alpha }{\sigma}_{\delta}\\ {}\rho {\sigma}_{\alpha }{\sigma}_{\delta }& {\sigma}_{\delta}^2\end{array}\right)\right).\end{align*}$$
Using R’s popular mixed-effects syntax (Bates et al. Reference Bates, Mächler, Bolker and Walker2015), we have the model y ~ treatment + (1 + treatment | topic). The multivariate normal distribution implies that ${\delta}_j\sim N\left(\overline{\delta},{\sigma}_{\delta}^2\right).$
This allows a much richer set of quantities of interest, without an overly restrictive parametric model. First, we obtain an estimate of
${\delta}_j\sim N\left(\overline{\delta},{\sigma}_{\delta}^2\right).$
This allows a much richer set of quantities of interest, without an overly restrictive parametric model. First, we obtain an estimate of $\overline{\delta}$
, which is the “typical” treatment effect across topics. Second, we obtain an estimate of
$\overline{\delta}$
, which is the “typical” treatment effect across topics. Second, we obtain an estimate of ${\sigma}_{\delta }$
, which is the SD of the treatment effects across topics. Third, we obtain an estimate of the treatment effect
${\sigma}_{\delta }$
, which is the SD of the treatment effects across topics. Third, we obtain an estimate of the treatment effect ${\delta}_j$
for each topic included in the study.
${\delta}_j$
for each topic included in the study.
The model without topic-level predictors gives us a summary of the following form: “The treatment effects are about [ $\overline{\delta}$
] give or take [
$\overline{\delta}$
] give or take [ ${\sigma}_{\delta }$
] or so” along with estimates for particular topics. This is conceptually equivalent to summarizing a small data set with an average and an SD.Footnote
5
But researchers should report the estimates of the treatment effects for particular topics to allow readers to assess the variation across topics in detail. Tappin (Reference Tappin2023) provides an example of this approach (see Tappin’s Figure 2 on p. 876).
${\sigma}_{\delta }$
] or so” along with estimates for particular topics. This is conceptually equivalent to summarizing a small data set with an average and an SD.Footnote
5
But researchers should report the estimates of the treatment effects for particular topics to allow readers to assess the variation across topics in detail. Tappin (Reference Tappin2023) provides an example of this approach (see Tappin’s Figure 2 on p. 876).
4.2 Models with Topic-Level Predictors of the Treatment Effect
We now consider a model including topic-level predictors. Researchers should think carefully about topic-level predictors to measure and use in their model. These topic-level predictors improve their ability to (1) describe the variation in the effects and (2) precisely estimate the treatment effects for particular topics.Footnote 6
To include topic-level predictors, we adopt the same setup as before, imagining the set of models ${y}_i={\alpha}_{j\left[i\right]}+{\delta}_{j\left[i\right]}{T}_i+{\epsilon}_i$
, where
${y}_i={\alpha}_{j\left[i\right]}+{\delta}_{j\left[i\right]}{T}_i+{\epsilon}_i$
, where ${\epsilon}_i\sim N\left(0,{\sigma}_{\epsilon}^2\right)$
. We make one small change to the model for
${\epsilon}_i\sim N\left(0,{\sigma}_{\epsilon}^2\right)$
. We make one small change to the model for ${\alpha}_j$
and
${\alpha}_j$
and ${\delta}_j.$
We add subscripts
${\delta}_j.$
We add subscripts $j$
to their means
$j$
to their means ${\overline{\alpha}}_j$
and
${\overline{\alpha}}_j$
and ${\overline{\delta}}_j$
to signify that they vary systematically across topics, so that
${\overline{\delta}}_j$
to signify that they vary systematically across topics, so that
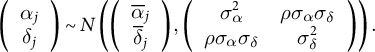 $$\begin{align*}\left(\begin{array}{c}{\alpha}_j\\ {}{\delta}_j\end{array}\right)\sim N\left(\left(\begin{array}{c}{\overline{\alpha}}_j\\ {}{\overline{\delta}}_j\end{array}\right),\left(\begin{array}{cc}{\sigma}_{\alpha}^2& \rho {\sigma}_{\alpha }{\sigma}_{\delta}\\ {}\rho {\sigma}_{\alpha }{\sigma}_{\delta }& {\sigma}_{\delta}^2\end{array}\right)\right).\end{align*}$$
Then, we model the means using the covariates in the usual linear way, so that
 $$\begin{align*}{\overline{\alpha}}_j={\gamma}_0^{\left[\overline{\alpha}\right]}+{\gamma}_1^{\left[\overline{\alpha}\right]}{z}_{j1}+{\gamma}_2^{\left[\overline{\alpha}\right]}{z}_{j2}+\dots ++{\gamma}_k^{\left[\overline{\alpha}\right]}{z}_{jk}=Z{\gamma}^{\left[\overline{\alpha}\right]}\end{align*}$$
and
 $$\begin{align*}{\overline{\delta}}_j={\gamma}_0^{\left[\overline{\delta}\right]}+{\gamma}_1^{\left[\overline{\delta}\right]}{z}_{j1}+{\gamma}_2^{\left[\overline{\delta}\right]}{z}_{j2}+\dots +{\gamma}_k^{\left[\overline{\delta}\right]}{z}_{jk}=Z{\gamma}^{\left[\overline{\delta}\right]}.\end{align*}$$
Adding topic-level predictors changes the model only a little but changes the interpretation substantially. The interpretation changes in two important ways:
-
1. First, the parameter ${\overline{\delta}}_j$
is no longer a single-number summary, but a conditional typical treatment effect that depends on the topic-level predictors. For a single topic-level predictor
${z}_{j1}$
, we would have
${\overline{\delta}}_j={\gamma}_0^{\left[\overline{\delta}\right]}+{\gamma}_1^{\left[\overline{\delta}\right]}{z}_{j1}$
, for example.
${\overline{\delta}}_j$
is no longer a single-number summary, but a conditional typical treatment effect that depends on the topic-level predictors. For a single topic-level predictor
${z}_{j1}$
, we would have
${\overline{\delta}}_j={\gamma}_0^{\left[\overline{\delta}\right]}+{\gamma}_1^{\left[\overline{\delta}\right]}{z}_{j1}$
, for example. -
2. Second, the parameter
${\sigma}_{\delta }$
is no longer the SD of the treatment effect, but the SD of the treatment effects around the expected treatment effect
${\overline{\delta}}_j$
.


To emphasize this important shift in interpretation, we describe these new quantities as the “conditional typical treatment effect” and the “conditional SD of the treatment effects.” The “conditional” here refers to “conditional on the topic-level predictors” and emphasizes the change in interpretation. Clifford et al. (Reference Clifford, Leeper and Rainey2023) provide an example of this approach (see Clifford et al.’s Figure 2).
4.3 Extensions
As we discussed above, our baseline design assumes that each topic contains a treatment group and a control group. However, researchers can also use the hierarchical model for Extensions 1a, 1b, and 2 discussed earlier, in which each topic is considered as treatment or control. In this case, we define the typical treatment effect as $\overline{\delta}=\overset{\begin{array}{c}\scriptsize \mathrm{typical}\kern0.17em \mathrm{outcome}\kern0.17em \mathrm{among}\\[-0.5em] \scriptsize {}\mathrm{treatment}\kern0.17em \mathrm{topics}\end{array}}{\overbrace{\left[\frac{1}{{\mathcal{J}}_T}\sum _{j=1}^{{\mathcal{J}}_T}{\overline{Y}}_j^T\right]}}-\overset{\begin{array}{c}\scriptsize \mathrm{typical}\kern0.17em \mathrm{outcome}\kern0.17em \mathrm{among}\\[-0.5em] \scriptsize {}\mathrm{control}\kern0.17em \mathrm{topics}\end{array}}{\overbrace{\left[\frac{1}{{\mathcal{J}}_C}\sum _{j=1}^{{\mathcal{J}}_C}{\overline{Y}}_j^C\right]}}.$
We can construct hierarchical models directly from this definition. When the treatment group contains many topics and the control group contains many other topics (Extension 2), we have the model
$\overline{\delta}=\overset{\begin{array}{c}\scriptsize \mathrm{typical}\kern0.17em \mathrm{outcome}\kern0.17em \mathrm{among}\\[-0.5em] \scriptsize {}\mathrm{treatment}\kern0.17em \mathrm{topics}\end{array}}{\overbrace{\left[\frac{1}{{\mathcal{J}}_T}\sum _{j=1}^{{\mathcal{J}}_T}{\overline{Y}}_j^T\right]}}-\overset{\begin{array}{c}\scriptsize \mathrm{typical}\kern0.17em \mathrm{outcome}\kern0.17em \mathrm{among}\\[-0.5em] \scriptsize {}\mathrm{control}\kern0.17em \mathrm{topics}\end{array}}{\overbrace{\left[\frac{1}{{\mathcal{J}}_C}\sum _{j=1}^{{\mathcal{J}}_C}{\overline{Y}}_j^C\right]}}.$
We can construct hierarchical models directly from this definition. When the treatment group contains many topics and the control group contains many other topics (Extension 2), we have the model ${y}_i={\mu}_{j\left[i\right]}^C\left(1-{T}_i\right)+{\mu}_{j\left[i\right]}^T{T}_i+{\epsilon}_i$
, where
${y}_i={\mu}_{j\left[i\right]}^C\left(1-{T}_i\right)+{\mu}_{j\left[i\right]}^T{T}_i+{\epsilon}_i$
, where ${\mu}_j^C\sim N\left({\overline{\mu}}^C,{\sigma}_{\mu^C}^2\right)$
and
${\mu}_j^C\sim N\left({\overline{\mu}}^C,{\sigma}_{\mu^C}^2\right)$
and ${\mu}_j^T\sim N\left({\overline{\mu}}^T,{\sigma}_{\mu^T}^2\right)$
. Then,
${\mu}_j^T\sim N\left({\overline{\mu}}^T,{\sigma}_{\mu^T}^2\right)$
. Then, $\overline{\delta}={\overline{\mu}}^T-{\overline{\mu}}^C$
. When the topic varies only within the treatment group (Extension 1a), we have
$\overline{\delta}={\overline{\mu}}^T-{\overline{\mu}}^C$
. When the topic varies only within the treatment group (Extension 1a), we have ${y}_i={\mu}^C\left(1-{T}_i\right)+{\mu}_{j\left[i\right]}^T{T}_i+{\epsilon}_i$
, where
${y}_i={\mu}^C\left(1-{T}_i\right)+{\mu}_{j\left[i\right]}^T{T}_i+{\epsilon}_i$
, where ${\mu}^C$
is fixed and
${\mu}^C$
is fixed and ${\mu}_j^T\sim N\left({\overline{\mu}}^T,{\sigma}_{\mu^T}^2\right)$
, so that
${\mu}_j^T\sim N\left({\overline{\mu}}^T,{\sigma}_{\mu^T}^2\right)$
, so that $\overline{\delta}={\overline{\mu}}^T-{\mu}^C$
. When the topic varies only within the control group (Extension 1b), we have
$\overline{\delta}={\overline{\mu}}^T-{\mu}^C$
. When the topic varies only within the control group (Extension 1b), we have ${y}_i={\mu}_{j\left[i\right]}^C\left(1-{T}_i\right)+{\mu}^T{T}_i+{\epsilon}_i$
, where
${y}_i={\mu}_{j\left[i\right]}^C\left(1-{T}_i\right)+{\mu}^T{T}_i+{\epsilon}_i$
, where ${\mu}_j^C\sim N\left({\overline{\mu}}^C,{\sigma}_{\mu^C}^2\right)$
and
${\mu}_j^C\sim N\left({\overline{\mu}}^C,{\sigma}_{\mu^C}^2\right)$
and ${\mu}^T$
is fixed, so that
${\mu}^T$
is fixed, so that $\overline{\delta}={\mu}^T-{\overline{\mu}}^C$
.
$\overline{\delta}={\mu}^T-{\overline{\mu}}^C$
.
If researchers assign each respondent to multiple topics, they can model respondent-level variation with another set of varying parameters. In most applications, a varying intercept for each respondent might work well. However, researchers can use a varying intercept and a varying treatment effect for each respondent if they assign respondents to several treatment topics and several control topics.
Additionally, researchers can extend the parametric hierarchical model in the usual ways if they wish. For example, researchers can use binary logistic regression, multinomial logistic regression, or ordinal logistic regression to model categorical outcomes. As another example, researchers can use spline-based smooths or Gaussian processes to estimate nonlinear relationships between topic-level moderators and treatment effects.
4.4 Estimation Methods
There are two commonly used tools to estimate hierarchical models: reduced-information maximum likelihood (REML) and full posterior simulation. REML can produce estimates quickly (less than a second, in many cases), but it cannot effectively propagate uncertainty in the variance parameters $\left(\begin{array}{cc}{\sigma}_{\alpha}^2& \rho {\sigma}_{\alpha }{\sigma}_{\delta}\\ {}\rho {\sigma}_{\alpha }{\sigma}_{\delta }& {\sigma}_{\delta}^2\end{array}\right)$
into the estimates for particular topics. However, REML is sufficiently popular and useful (because of its speed) that we evaluate this estimator below. Full posterior simulation is somewhat slower, but we ultimately suggest that researchers use full posterior simulation to estimate these models. REML occasionally produces unrealistic estimates of the variance parameters, and full posterior simulation better propagates uncertainty into the estimates for particular topics.
$\left(\begin{array}{cc}{\sigma}_{\alpha}^2& \rho {\sigma}_{\alpha }{\sigma}_{\delta}\\ {}\rho {\sigma}_{\alpha }{\sigma}_{\delta }& {\sigma}_{\delta}^2\end{array}\right)$
into the estimates for particular topics. However, REML is sufficiently popular and useful (because of its speed) that we evaluate this estimator below. Full posterior simulation is somewhat slower, but we ultimately suggest that researchers use full posterior simulation to estimate these models. REML occasionally produces unrealistic estimates of the variance parameters, and full posterior simulation better propagates uncertainty into the estimates for particular topics.
4.5 Evaluating the Hierarchical Model Using the SDC Data
We offer two estimators: (1) a nonparametric estimator using design-based assumptions and (2) a parametric, hierarchical model. The hierarchical model allows researchers to characterize the heterogeneity across topics, rather than simply marginalize across topics. However, researchers might worry about the robustness of the hierarchical model to violations of the parametric assumptions. What happens when the errors are not drawn precisely from a normal distribution? What happens when the treatment effects for particular topics are not drawn precisely from a normal distribution? To alleviate these concerns and illustrate the advantages of the hierarchical model, we use samples from an enormous survey experiment in which the true values of the quantities of interest are approximately known.
As a real-world test of the hierarchical model’s ability to characterize the heterogeneity across topics, we use the SDC megastudy (Voelkel et al. Reference Voelkel2023).Footnote
7
This study randomly assigns 32,059 individuals to 25 different interventions intended to lower partisan animosity (and other outcomes). The large SDC study is designed to estimate and compare the effects of several “promising interventions” on a common set of outcomes; this is distinct from our motivation of estimating the typical effect across a collection of theoretically connected topics.Footnote
8
However, this large data set allows us to compare estimates from samples to the approximately known values using the full data set. We conceptualize each of the 25 interventions in the SDC study as a diverse collection of topics—a set of interventions that might reduce partisan animosity. We are interested in how well the hierarchical model estimates (1) the SD of treatment effects across topics and (2) the treatment effects for each particular topic. We show that there is some bias in the estimates of the SD, but the 90% CI works well. We also show that there is some bias in the estimates of the treatment effects ${\delta}_j$
for particular topics, but the hierarchical model produces a smaller RMSE than the unbiased difference in means. The 90% CI works well for all quantities of interest.
${\delta}_j$
for particular topics, but the hierarchical model produces a smaller RMSE than the unbiased difference in means. The 90% CI works well for all quantities of interest.
4.5.1 The Model Specification
In this study, the topic (i.e., the particular intervention) only varies within the treatment (Extension 1a). We use a normal model for partisan animosity given the treatment
 $$\begin{align*}{PA}_{i\left[j\right]}=\alpha +{\delta}_j{T}_{i\left[j\right]}+{\epsilon}_i,\ \mathrm{where}\ {\epsilon}_i\sim N\left(0,{\sigma}_{\epsilon}^2\right).\end{align*}$$
Then, we model the treatment effect as a linear function of two topic-level predictors: (1) the degree to which the treatment references partisan animosity and (2) the degree to which the treatment corrects misperceptions of out-partisans (as a whole).Footnote 9
 $$\begin{align*}{\overline{\delta}}_j={\gamma}_0^{\left[\overline{\delta}\right]}+{\gamma}_1^{\left[\overline{\delta}\right]}\mathrm{References}\;{\mathrm{PA}}_j+{\gamma}_2^{\left[\overline{\delta}\right]}{\mathrm{Corrects}\kern0.17em \mathrm{Misperceptions}}_j.\end{align*}$$
In the original study, two coders score both measures on a scale from 1 to 5. We average these two scores and standardize the scores across interventions to have an average of zero and an SD of 0.5.
4.5.2 The Monte Carlo Simulation
To establish the “truth” in our simulation study, we fit the model to the full SDC data set and compute point estimates for (1) the average of the treatment effects for the 25 interventions, (2) the SD of the treatment effects across the 25 interventions, and (3) the 25 treatment effects for the particular interventions. To create each sample for our Monte Carlo simulation, we randomly sample 10 of the 25 topics, and then, we randomly sample 100 respondents from each of those 10 topics. We randomly sample 700 respondents from the control group to mimic the roughly 7:1 ratio in the full study. We then fit the model to the sample of 1,700 respondents and compare the estimates using the sample to the estimates using the full SDC data set.
4.5.3 The Typical Effect
For the typical effect, both the point estimates and CIs work well in the simulation. The point estimates are approximately unbiased, as expected. More importantly, the simulations show that the CIs work well: The nonparametric 90% CI captures the true typical effect in 95% of the simulations, the REML 90% CI captures the true effect in 92% of simulations, and the full posterior simulation 90% CI captures the true effect in 94% of simulations.
4.5.4 The SD of the Treatment Effects
Figure 1 shows the sampling distribution for the (conditional) SD of the treatment effects for the REML and full posterior simulation estimates compared to the true SD of 1.99. Both estimates perform reasonably well. Notice that the REML estimate is approximately unbiased. However, REML occasionally returns a (problematic) estimate of zero; Chung et al. (Reference Chung, Rabe-Hesketh, Dorie, Gelman and Liu2013) discuss this problem in detail. Thus, we recommend researchers use full posterior simulation rather than REML. For this simulation study, the full posterior simulation estimate is biased upward by about 30%. This bias occurs because the small number of topics (10, in this case) does not allow the likelihood to rule out large values of the SD. However, this bias shrinks as the number of topics grows.
This figure shows the sampling distribution of the estimates of the SD of the treatment effects across topics. We compute this distribution by repeatedly taking small samples of 1,700 respondents and 10 topics from the SDC megastudy of 30,000+ respondents across 25 topics. Notice that the REML approach produces estimates of zero in some cases, while the full posterior simulation approach cannot rule out large SDs (e.g., greater than five) from only ten topics.
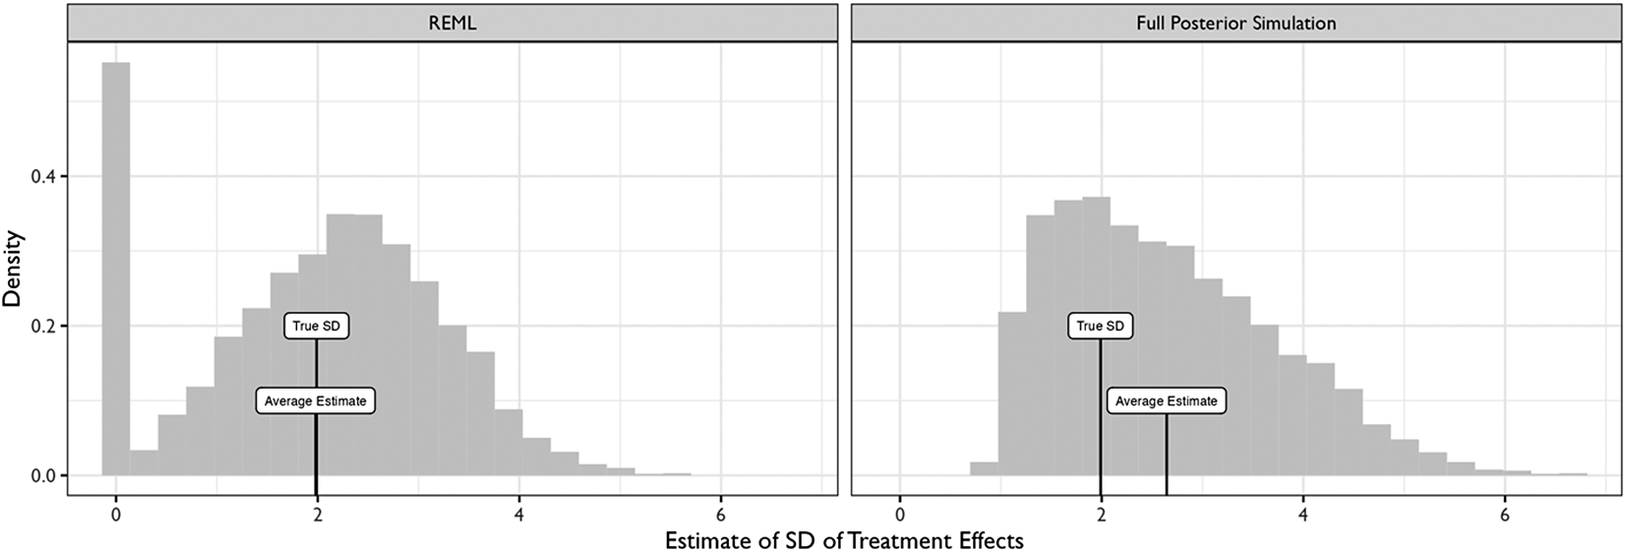
The REML 90% CI captures the SD from the full sample about 85% of the time. The full posterior simulation 90% CI captures the SD from the full data set about 93% of the time—a slightly conservative interval. Thus, these data suggest that the hierarchical model offers a useful point estimate and CI for the (conditional) SD of the treatment effects.
4.5.5 The Treatment Effects for Particular Topics
We now turn to an evaluation of the point estimates of the treatment effects for particular topics. To evaluate the point estimates, we must keep in mind both bias and variance. An unbiased estimator is readily available; we could just use the difference in means from the control group and the particular treatment group. However, the hierarchical model produces estimates with a smaller root-mean-squared error (RMSE). The hierarchical model does introduce some bias, but the reduction in variance more than offsets this bias. Thus, we are interested in two summaries of the sampling distribution of the point estimates. First, what is the bias? Second, how does the RMSE of the hierarchical model compare to the RMSE for the difference in means?
The left panel of Figure 2 shows the bias for the point estimates of the treatment effects for particular topics. The hollow circles show the treatment effects from the full data set (which we treat as the truth in our simulations), and the arrowheads point to the expected value of the estimates. Thus, the length of the arrow shows the magnitude of the bias. The average absolute bias is only about 0.6 points on the 100-point partisan animosity scale. However, a 0.5-point bias is about 25% of the SD of the treatment effects across topics, so we consider it meaningful. The estimates for the interventions with unexpectedly large or small treatment effects (conditional on topic-level predictors) are the most biased. To show this, the color shows how unexpected the treatment effect is, or how far the treatment effect falls from the (conditional) typical effect. Red indicates that the intervention reduces partisan animosity more than typical, and blue indicates that the intervention reduces partisan animosity less than typical. For example, the Economic Interests intervention is much less effective at reducing partisan animosity than expected. Given the predictors—it does not correct a misperception, but it does clearly reference partisan animosity—the intervention should reduce partisan animosity by about 6.2 points on the 100-point scale. However, the reduction is actually about 1.3 points or about 2.5 SDs smaller than the (conditional) typical effect. This highlights the importance of topic-level predictors: If researchers have information that allows them to predict the bias—that is, those topics with larger or smaller treatment effects—then they should include those predictors in the model.
However, there is a tradeoff here between bias and variance. The hierarchical model not only introduces bias but also shrinks the variance of the estimates. This reduction in the variance usually more than offsets the errors due to bias. The middle panel of Figure 2 shows the RMSE. The x shows the RMSE of the difference in means, and the arrowhead shows the RMSE of the hierarchical model. Thus, the length of the arrow shows the reduction in RMSE when using the hierarchical model rather than the unbiased difference in means. For most topics, the RMSE is much improved. It shrinks by about 20 percent, on average, across the topics. For some topics, the RMSE does get worse. In these data, the RMSE gets substantially worse for one topic (Economic Interests). Again, this is the topic that differs substantially from the (conditional) typical effect (highlighting the importance of topic-level predictors).
This figure shows the bias and RMSE of the point estimates and the coverage of the 90% CI from the hierarchical model. The topics are ordered by their deviation from expectation given topic-level predictors (top, treatment effect closer to zero than expected; bottom, treatment effect further from zero than expected). We compute the bias, RMSE, and coverage by repeatedly taking small samples of 1,700 respondents and 10 topics from the SDC megastudy of 30,000+ respondents across 25 topics. While the hierarchical model introduces some bias by pooling information across topics, it meaningfully reduces the RMSE and the 90% CIs work well. The left panel shows the bias for the point estimates of the treatment effects for particular topics. The hollow circles show the treatment effects from the full data set, and the arrowheads point to the expected value of the estimates. Thus, the length of the arrow shows the magnitude of the bias. The middle panel shows the RMSE. The x shows the RMSE of the difference in means, and the arrowhead shows the RMSE of the hierarchical model. Thus, the length of the arrow shows the reduction in RMSE when using the hierarchical model rather than the unbiased difference in means. The right panel shows the coverage of the 90% CI.
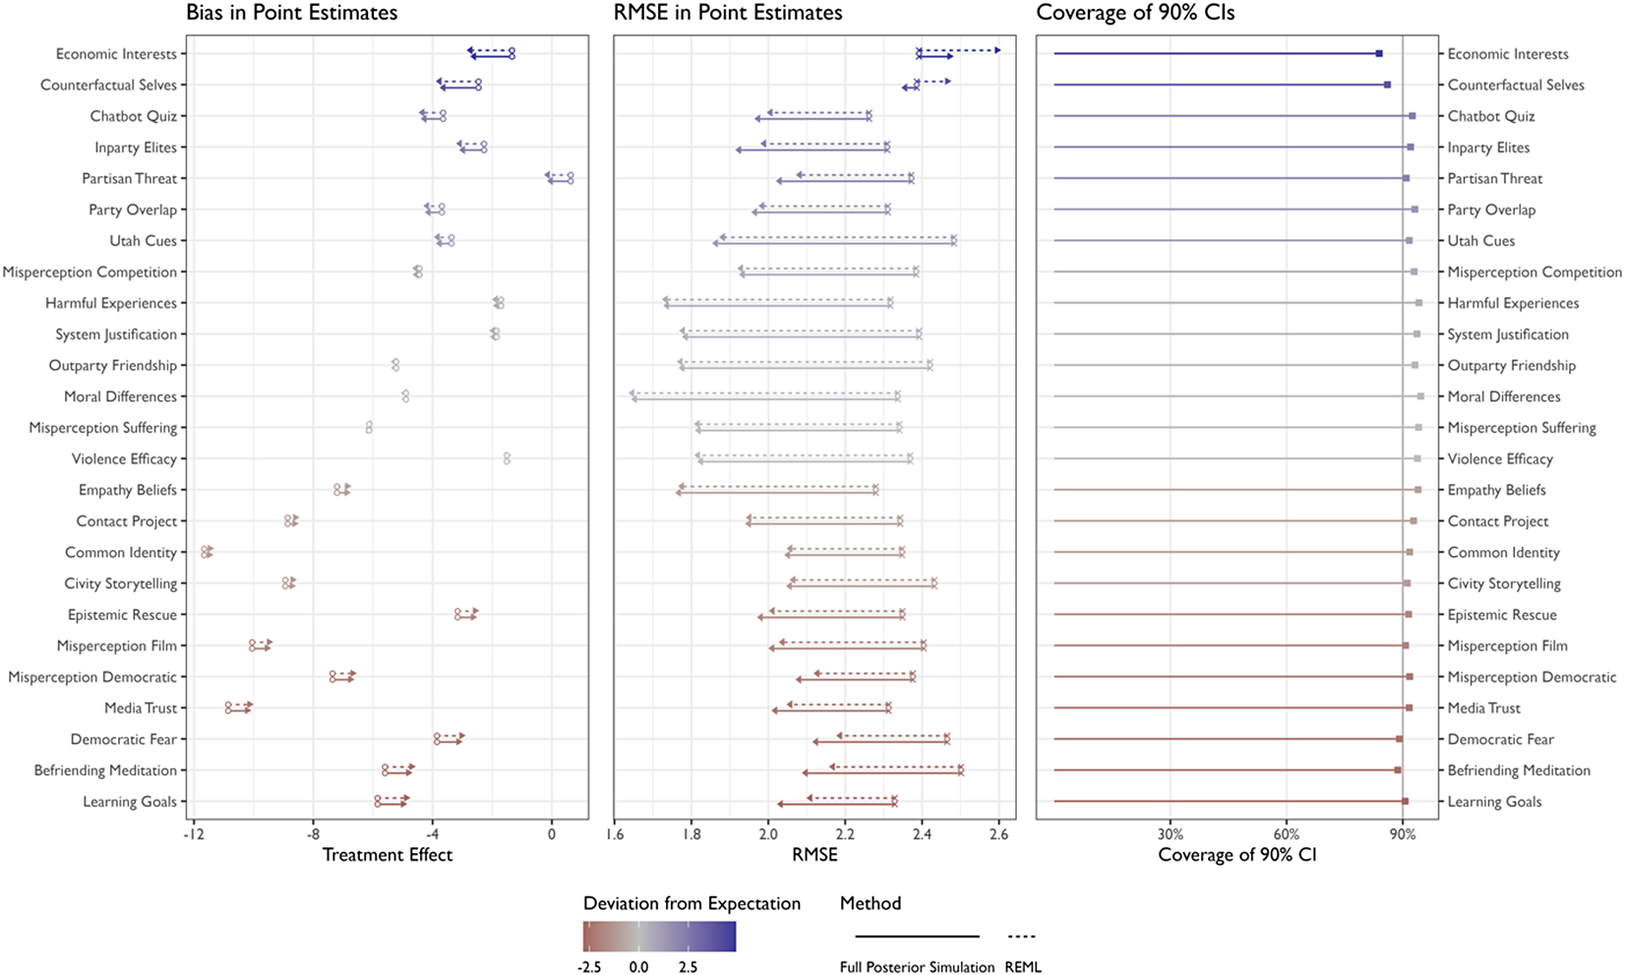
The right panel of Figure 2 shows the coverage of the 90% CIs for each topic. We report these CIs only for the full posterior simulation estimates because REML cannot easily propagate uncertainty to the estimates for particular topics. The coverage is about 90% on average across the topics. For topics with effects that are unusually far from the (conditional) typical effect, the coverage can drift downward from 90%. For topics with effects that are unusually close to the (conditional) typical effect, the coverage can drift upward. For these data, the coverage ranges from 84% (Economic Interests) to 95% (moral differences).
5 Conclusion
Many experimental research programs offer general hypotheses that speak to a wide range of particular topics. In practice, many implemented experiments must use a particular topic—a particular test of the experimenter’s claim—even if researchers’ theory operates at a much more general level. As a research program advances, it should address the generalizability of the core hypotheses to a broad range of topics.
We do not suggest removing single-topic studies from our social science toolkit. On the contrary, they are essential tools. In the early stages of a research program, single-topic studies allow researchers to establish the plausibility of the core hypothesis. If researchers carefully select a topic with a large treatment effect, they can do this early work with a much smaller sample size (e.g., Clifford and Rainey Reference Clifford and Rainey2023; Kuklinski et al. Reference Kuklinski, Quirk, Jerit, Schwieder and Rich2000). While findings from a single-topic study do not necessarily generalize to a broader collection of topics (Clifford and Rainey Reference Clifford and Rainey2023), we are optimistic that researchers and readers can intelligently communicate and understand these limitations. For example, Bartels and Mutz (Reference Bartels and Mutz2009) limit their conclusions and highlight the usefulness of focusing on single topics (two, in their case):
[Our study] is limited to only two controversial issues, two substantive arguments, and two institutions, which cannot claim to represent all potential persuasive contexts in which institutions render decisions. Moreover, these particular issues are much better known and understood by the public than many highly technical pieces of legislation decided by Congress or decisions made by the Court…
(258)However, researchers can use topic sampling to advance research programs past a handful of ad hoc particular topics to a large collection of topics of interest. Ideally, researchers can enumerate the population of topics and select a random sample. However, if the population cannot be enumerated, then a “diverse collection” of topics works well under stronger modeling assumptions. Clifford et al. (Reference Clifford, Leeper and Rainey2023) suggest using about 25 to 50 topics and about 20% to 50% more respondents to obtain a precision comparable to a single-topic study. If the literature tends to use 1,000 respondents in single-topic studies, then researchers can perhaps use 1,200 or 1,500 respondents to make much more general—but similarly precise—claims about treatment effects in a broad population of topics.
We describe two complementary strategies to analyze the data from a topic-sampling experiment. We describe a nonparametric, unbiased estimator that allows researchers to estimate the typical treatment effect across topics. This is analogous to a nonparametric difference-in-means test for a simple experiment with two conditions—it is unbiased under the assumptions of the design (random sampling of topics and randomization into treatment and control). We also describe a parametric, hierarchical model that allows researchers to effectively summarize the heterogeneity across topics. First, the hierarchical model has a scale parameter that researchers can estimate and interpret as the SD of the treatment effects across topics. This serves as a useful single-number summary of the heterogeneity—a give-or-take number around the typical effect. Second, the hierarchical model allows researchers to estimate the treatment effect for all the topics included in the study with surprising precision. Third, the hierarchical model allows researchers to describe the variation in the treatment effects for particular topics using topic-level predictors.
Concerns about the generalizability of experiments are not new—McDermott (Reference McDermott2002) notes that concern about the generalizability of convenience samples has been a “near obsession” in political science (334). For example, recent work examines the generalizability of experiments using online convenience samples to nationally representative samples (Berinsky, Huber, and Lenz Reference Berinsky, Huber and Lenz2012; Coppock, Leeper, and Mullinix Reference Coppock, Leeper and Mullinix2018) and of laboratory experiments to field experiments (Barabas and Jerit Reference Barabas and Jerit2010; Coppock and Green Reference Coppock and Green2015; Jerit, Barabas, and Clifford Reference Jerit, Barabas and Clifford2013). A growing literature focuses on the generalizability across topics. For example, research on incivility (Skytte Reference Skytte2022), fake news (Clemm von Hohenberg Reference Clemm von Hohenberg2023), media (Wittenberg et al. Reference Wittenberg, Tappin, Berinsky and Rand2021), partisan cues (Clifford et al. Reference Clifford, Leeper and Rainey2023; Tappin Reference Tappin2023), discrimination (Crabtree et al. Reference Crabtree, Gaddis, Holbein and Larsen2022; Elder and Hayes Reference Elder and Hayes2023), and even placebos (Porter and Velez Reference Porter and Velez2022) shows that substantive effects can meaningfully depend on the stimulus researchers choose. We applaud these substantive and methodological efforts. In this paper, we advance this work by offering a careful discussion of estimation. We suggest an unbiased estimator of the typical treatment effect and a hierarchical model to summarize the heterogeneity. Using the topic-sampling design suggested by Clifford et al. (Reference Clifford, Leeper and Rainey2023) and the estimators described here, researchers can generalize beyond the treatment effect for a particular topic and estimate more general quantities of theoretical interest.
Data Availability Statement
All data and code to reproduce our results are available on Dataverse at https://doi.org/10.7910/DVN/YBV9Z8 (Rainey Reference Rainey2024).


 Open access