1. Introduction
In the era of precision cosmology, determining and comparing the Hubble constant (H0) down to 1% level both locally and at high redshifts can provide leverages on the nature of dark energy, physics of neutrinos, and the curvature of Universe. On the local side, using the distance ladder, the SH0ES team has dramatically reduced the H0 error budget to 2.3% (Riess et al. Reference Riess2018) and showed tension (at 3.4σ level) with the Planck CMB results at higher redshift. Though tempting to claim such tension may lead to signs of new physics, it is important to investigate both systematics in the Planck measurement and to have independent local H0 measurement than SH0ES.
An ideal alternative is gravitational lensing time-delays. The working principle is that for a background source that is strongly lensed and split into multiply images from observer’s perspective, the photons from each image will undergo different light path before reaching the observer. Since the difference of light travel time (or time-delay) only depends on the space–time curvature, we can therefore infer H0 accordingly. In this regard, quadruply lensed quasars are especially useful than doubly lensed ones, because they can provide a factor of two more time-delay information. The state-of-the-art H0 estimate from gravitational lensing time-delay comes from the H0LiCOW team (Suyu et al. Reference Suyu2017). So far H0LiCOW used three quadruply lensed quasars (each has H0 estimate to 7–8%) and determined H0 to 3.8% level (Bonvin et al. Reference Bonvin2017). While there was a recent claim by Tie & Kochanek (Reference Tie and Kochanek2018) that microlensing effects might bring additional significant effects on the uncertainty of time-delay measurements (hence impacts the H0 estimate), it has been shown from Chen et al. (Reference Chen2018) that microlensing only affects short time-delays (<20 d) and has insignificant effect on longer time-delays (with tens of days).
While tens of quadruply lensed quasars are known to exist, with Hubble Space Telescope (HST) data,Footnote a only few of them are suitable to estimate H0, with known quasar and lens redshifts and measurable variability. In order to use gravitational lensing time-delay for cosmography, we need detailed modelling of the lensing system, which relies upon accurate spectroscopic redshifts of the background quasar. In this paper, we aim to refine the redshift measurements of a newly discovered quadruply lensed quasar candidate WGD2038-4008 from Dark Energy Survey (DES), and independently from Gaia DR2 (GRAL2038-4008) by Krone-Martins et al. (Reference Krone-Martins2018). The bright quasar images have the advantages of enabling high S/N photometry even with small-to-medium-class telescopes, which will allow us to determine the time-delay in a short (several months) monitoring fashion (Courbin et al. 2017).
This paper is organised as follows. In Section 2, we present independent spectroscopic observations and the redshift estimates from these newly acquired spectra, featuring a strong emission feature that was in the data gap of Agnello et al. (Reference Agnello2018). In Section 3, we discuss possible origins of this feature, including an interloper from the foreground lensing galaxy, or a higher redshift of the background quasar. We also provide other means that can verify our redshift estimate, via either high-resolution spectrum of the lens or time-series photometry of the quasar. Our findings are summarised in Section 4.
2. Long-slit spectrograph observation
As the four images of the background quasar are rather bright (i ∼ 19 mag), medium telescopes are sufficient to reach reasonable spectral S/N in a modest amount of time. To derive the spectroscopic redshifts of the background quasar in a timely manner, we obtain optical spectra of WGD2038-4008 taking advantages of the fast-track service programme of the Andalucia Faint Object Spectrograph and Camera (ALFOSC) mounted on the 2.56-m Nordic Optical Telescope (NOT) at La Palma Observatory on the Canary Island. The observations were carried out on 2018 June 9 with median seeing of 1.2 arcsec. We observed WGD2038-4008 using Grism No. 4 with a 2×2 binning through a 1.0-arcsec width slit. We employed two positional angles of 33° and −50°, going through image pair C&D and A&B, respectively. For each slit position, we dither the long-slit in an A–B–B–A pattern, with a dithering step of 1 arcsec to allow us to remove bad pixels and cosmic rays. The individual exposure time at each dithering position is 450 s. In the end we acquired a total on-source time of 30 min at each slit orientation. In addition, we also took images of bias and flat fields, as well as spectra of Th–Ar lamp for wavelength calibration.
Data reduction was carried out in a standard manner using the Image Reduction and Analysis Facility (IRAF)Footnote b. Each 2D spectrum was bias subtracted, flat fielded, wavelength calibrated against the Th–Ar lamp spectra, and then sky subtracted. We then median-combined the 2D spectra to better remove cosmic rays and bad pixels. We then extracted the 1D spectra and normalised them by fitting the continuum with 10th-order polynomials. The 2D spectra, as well as the extracted, normalised 1D spectra, are shown in Figure 1.
Follow-up spectra of WGD2038-4008 from ALFOSC. Upper panel: 2D spectra of image A+B. Although the spectra were taken under mediocre seeing condition, we can still see the trace of image A (upper part) and image B (lower part) in the spectra. There are two apparent emission features at observed wavelength of ∼4 935 and ∼6 080 Å, respectively. In the 2D spectra we can also see residuals of sky lines from sky subtraction at ∼5 600 and 5 800 Å. Lower panel: 1D spectra of image A+B (green) and image C+D (purple). We normalised the spectra according to the flux of the continuum. In addition, we also show SDSS composite quasar spectrum from vanden Berk et al. (Reference Vanden Berk2001) redshifted to z = 2.187 for comparison (in grey), as well as the sky spectrum (in blue colour, flux not to scale) to aid identifying false emission features in the 1D extracted spectra.
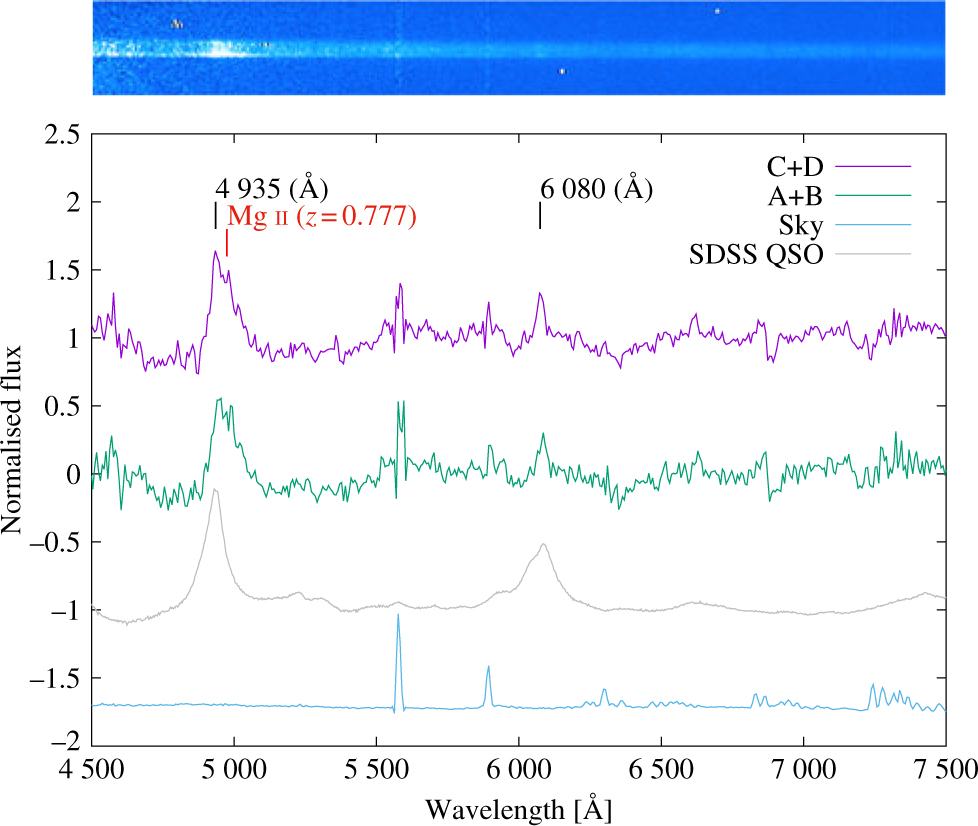
We note that, however, due to the mediocre seeing condition and the large pixel scale from 2 × 2 binning, we cannot clearly separate and extract spectrum from each quasar image. Nevertheless we were able to extract the spectrum of image pairs, that is, quasar image A+B, and image C+D, into 1D spectra. From the 2D spectra, we can clearly see two emission lines at ∼4 935 and ∼6 080 Å, where the later one is in the data gap of Agnello et al. (Reference Agnello2018). In the following section, we discuss two scenarios that can corroborate the presence of both emission features at ∼4 935 and ∼6 080 Å, that is, (1) the 6 080 Å is an interloper emission line from the foreground lensing galaxy and (2) both the 4 935 and 6 080 Å features belong to the background source, hinting at a higher redshift of the background quasar.
3. Discussion
Given the lens redshift of z l = 0.23 (Agnello et al. Reference Agnello2018), the ∼6 080 Å emission line feature is at about the right redshift of [O iii] 5007. In fact, if we use the Hγ absorption line, we will obtain a slightly lower redshift of z l∼ 0.22, which is within the error to have [O iii] 5007 at ∼6 080 Å. However, we should note that [O iii] emission line is a signature of star-forming galaxies, but the high-resolution HST images and lens modelling (Shajib et al. Reference Shajib2018) both indicate that the foreground lensing galaxy is an elliptical galaxy, hard to reconcile with strong [O iii] 5007 emission.
On the other hand, both the ∼4 935 and ∼6 080 Å emission line features can also originate from the background source. To explore this possibility, we first use the broad-band photometry to have a initial guess of the photometric redshift.
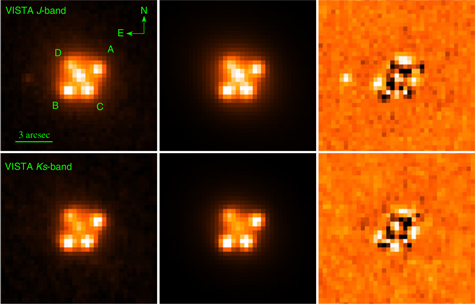
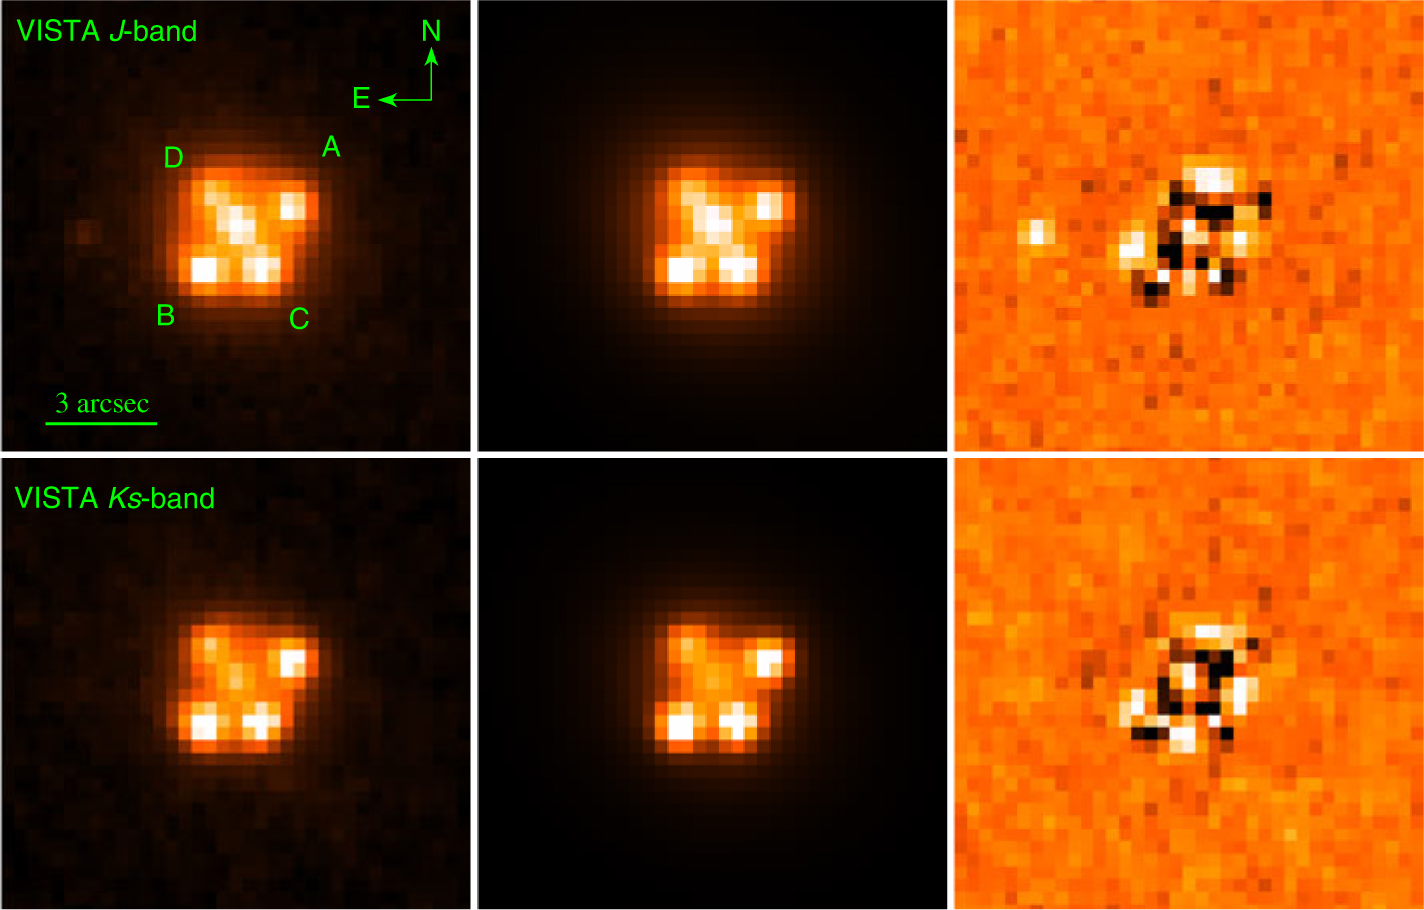
The optical photometry of WGD2038-4008 has been measured by Agnello et al. (Reference Agnello2018). In addition, we also analyse the near-infrared images obtained by the VISTA Hemisphere Survey (VHS)Footnote c using the 4-m VISTA telescope in Chile. The images were taken under seeing condition of ∼0.7 in both J and Ks bands. We download the photometric calibrated and astrometrically aligned infrared images from the VISTA science archive (VSA) at the Royal Observatory, Edinburgh,Footnote d for further analysis. Our analysis is based on the data release 5 version of the VHS. As the four quasar images and the foreground lens are blended in the VHS images, we use the GALFIT package (Peng et al. Reference Peng, Ho, Impey and Rix2002, Reference Peng, Ho, Impey and Rix2010) to extract the photometry of each component. The four quasar images are modelled with a point-spread function (PSF) constructed from ∼20 bright stars within 5 × 5 arcmin. We also model the foreground lens using a Sersic profile. This results in an effective radius of R e ∼ 2.3 arcsec in J and 1.7 arcsec in Ks, and a Sersic index of 3.4 in J and 2.0 in Ks, respectively. The best-fit GALFIT models are shown in Figure 2; the photometry of each quasar image is shown in Table 1.
Left column: VISTA images of WGD2038-4008. Middle column: Best-fit models of the four quasar images (using PSF) and the foreground lens (using Sersic profile) from GALFIT. Right column: Residuals of the observed images minus that of the best-fit model. We note that the residuals exhibit a ring-like shape, suggesting features from the extended quasar host galaxy as seen from Shajib et al. (Reference Shajib2018). The upper and lower rows are J and Ks bands, respectively.
Optical and infrared photometry of WGD2038-4008. The listed values are AB magnitudes.
With the optical and infrared photometry in hand, we then proceed to estimate the photometric redshift. We correct for the line-of-sight extinction using the values from Schlafly & Finkbeiner (Reference Schlafly and Finkbeiner2011). We assume R v = 3.1 and use the extinction law of Cardelli, Clayton, & Mathis (Reference Cardelli, Clayton and Mathis1989) to calculate the un-extincted magnitudes in each pass-bands. We then compared the de-reddened photometry to a quasar spectrum, convolved with the filter responses to the Dark energy survey camera filtersFootnote e and the VISTA near-infrared filtersFootnote f, using the Photometric Analysis for Redshift Estimate packageFootnote g (LePhare, Arnouts et al. Reference Arnouts1999; Ilbert et al. Reference Ilbert2006). LePhare estimates photometric redshifts between 2.4 and 2.8 for all four quasar images. This suggests that the quasar has a redshift higher than 2. Assuming a higher z s, we found that the ∼4 935 and ∼6 080 Å emission line features correspond to a redshift of z ∼ 2.2 for C iv line at 1 549 Å and C iii line at 1 909 Å, respectively. From the 1D spectra in Section 2, we fit a Gaussian function to the redshifted C iv and C iii emission lines to determine their centroid and infer the redshift to be z = 2.187 ± 0.004.
This scenario suggests that the background quasar is at a higher redshift of 2.187, significantly differs from the spectroscopic redshift in the literature. We note that it is difficult to understand the true causes that lead to the large difference between the spectroscopic redshift of z = 2.187 derived from our analysis and the value of z = 0.777 reported by Agnello et al. (Reference Agnello2018). This is especially the case as Agnello et al. (Reference Agnello2018) do not provide details of their spectroscopic observations, reduction and analysis (e.g., which emission lines are used to derive the redshift). On top of that, we do not have access to the raw data of Agnello et al. (Reference Agnello2018). Hence we can only speculate that the most likely cause is the spectra of Agnello et al. (Reference Agnello2018) are contaminated by the sky lines at the red end of the spectrum, and these sky lines at the red end of the spectrum are confused with quasar emission lines when determining the redshifts. This is the case when checking their Figure 4 for the 1D spectra of WGD2038-4008; the most prominent emission lines are at observed wavelength of ∼8 600, 8 800, and 8 900 Å that can be regarded as Hβ and the [O iii] doublet at a putative redshift of z = 0.777. However, there are numerous sky lines in this wavelength range and might be confused as quasar emission lines if the sky subtraction is not perfect. In addition, in their Figure 4 there is an emission feature at observed wavelength of 4 900 Å, which will be stronger than the emission features at 8 600–8 900 Å if we normalised the 1D spectrum, and this emission feature cannot be reconciled with the putative z = 0.777. This is especially the case because the putative Mg ii at z = 0.777 is off the peak of the broad emission feature at 4 900 Å, as can be seen in Figure 4 of Agnello et al. (Reference Agnello2018) and in Figure 1 of this work. Besides, the emission features at 8 600–8 900 Å are also present in the 1D spectrum of another lens WGD2021-4115 (albeit weak), hence hinting at imperfect sky subtraction. In addition, there is an emission line at ∼6 600 Å, presumably the [O ii] 3727 assuming z = 0.777 from Agnello et al. (Reference Agnello2018). However, this feature only appears in the spectrum of B+C, but not in G+D. It is the same for another emission line feature at ∼5 900 Å. Both the 5 900 and 6 600 Å emission lines are sharp and narrow and only present in the spectrum of B+C but not in G+D, hinting to possible imperfect cosmic-ray removal.
Besides these speculation, we can also verify/test whether z = 2.187 is the correct spectroscopic redshift with other approaches. First of all, given the Einstein ring radius θ E (which can be robustly determined from lens modelling of the image) and the redshifts of the lens and the background source, we can calculate the lens velocity dispersion σ v as follows (see, e.g., Narayan & Bartelmann Reference Narayan and Bartelmann1996):
 $$\begin{equation}
\sigma_v \sim 10^3\, \frac{\rm km}{\rm s} \sqrt{\frac{\theta_E}{28^{\prime\prime}} \frac{D_s}{D_{ds}}},
\end{equation}$$
$$\begin{equation}
\sigma_v \sim 10^3\, \frac{\rm km}{\rm s} \sqrt{\frac{\theta_E}{28^{\prime\prime}} \frac{D_s}{D_{ds}}},
\end{equation}$$
where D s is the distance to the background source and D ds is the distance between the source and the lens (deflector).
A putative z = 0.777 will result in a σ v of 303 km/s, while z = 2.187 will lead to a σ v of 289 km/s assuming a Λ cosmology with h0 of 0.7 and ΩM = 0.3. In this regard, high-resolution spectra of the lens will help measure σ v and thus verify the redshift of the background quasar.
Another possibility is to use time-delays from different quasar images to verify the redshift of the background quasar. The time-delay can be expressed as (Narayan & Bartelmann Reference Narayan and Bartelmann1996)
 $$\begin{equation}
t\big(\skew4\overrightarrow{\theta}\big) = \frac{1+z_d}{c}\frac{D_d D_s}{D_{ds}} \bigg[ \frac{1}{2}\big(\skew4\overrightarrow{\theta}-\skew4\overrightarrow{\beta}\big)^2 - \Psi\big(\skew4\overrightarrow{\theta}\big) \bigg],
\end{equation}$$
$$\begin{equation}
t\big(\skew4\overrightarrow{\theta}\big) = \frac{1+z_d}{c}\frac{D_d D_s}{D_{ds}} \bigg[ \frac{1}{2}\big(\skew4\overrightarrow{\theta}-\skew4\overrightarrow{\beta}\big)^2 - \Psi\big(\skew4\overrightarrow{\theta}\big) \bigg],
\end{equation}$$
where  $\Psi\big(\skew4\overrightarrow{\theta}\big)$ is the lensing potential, $\skew4\overrightarrow{\theta}$ and $\skew4\overrightarrow{\beta}$ are the angular separations of the lensed image and the background source from the optical axis as viewed by the observer, respectively. Using z s = 0.777, Shajib et al. (Reference Shajib2018) predict Δt AB = −6 d, Δt AC = −11 d, and Δt AD = −27 d, respectively. If the background quasar were at z = 2.187 instead, the time-delays will be −5.5, −10.0, and −24.6 d, respectively. We note that the time-delays are only ∼10% difference between z = 0.777 and z = 2.187, which would require a very accurate time-delay measurements. On the other hand, this implies that the quasar would not be useful for measuring H0 through time-delays if the redshift was not established.
4. Summary
We present independent optical spectroscopic follow-up of WGD2038-4008, covering the data gap of Agnello et al. (Reference Agnello2018). In addition, we also carry out infrared modelling and photometry of WGD2038-4008 from archival VHS images. The infrared photometry, along with the optical photometry from the literature, predicts a photometric redshift of z > 2. Our spectral analysis also suggests that the background quasar is at redshift of z = 2.187 from the C iv and C iii emission lines. The difference between our redshift estimate and that from the literature might stem from imperfect sky line removal. We outline possible tests that can verify the higher redshift scenario using lens velocity dispersion or time-delays. Further high-resolution spectra of the lens, or high-cadence photometric monitoring of the quasar images are highly encouraged.
Author ORCIDs
Chien-Hsiu Lee https://orcid.org/0000-0003-1700-5740
Acknowledgements
We are indebted to the anonymous referee, whose comments greatly improved this manuscript. This article is based on observations made in the Observatorios de Canarias del IAC with the NOT operated on the island of La Palma by the Nordic Optical Telescope Scientific Association. The data presented here were obtained with ALFOSC, which is provided by the Instituto de Astrofisica de Andalucia (IAA) under a joint agreement with the University of Copenhagen and NOTSA.