


Introduction
Political support (Easton, Reference Easton1965; Reference Easton1975) is considered key for the evolution of democracies. Originally, Easton distinguished between a) specific support: essentially, support based on short-term utility and rather immediate performance; and b) diffuse support: a more stable, long-term attachment to the democratic regime (Thomassen and Van Ham, Reference Thomassen, van Ham, van Ham, Thomassen, Aars and Andeweg2017). Drawing on this conceptualization, other scholars developed more refined models of political support, for example, Norris’ fivefold model (Norris, Reference Norris and Norris2011).
Many empirical studies of political support concentrated on a specific survey indicator: the Satisfaction With Democracy (SWD) indicator, which asks respondents how satisfied they are with the way democracy works in their country. This indicator is the focus of this paper.
There is a huge literature about the determinants of this indicator (for an overview, see, e.g., Dassonneville and McAllister, Reference Dassonneville and McAllister2020). Moreover, many scholars used this indicator as a measure of the third level in Norris’ fivefold model of political support (Norris, Reference Norris and Norris2011, p. 28; van Ham and Thomassen, Reference van Ham, Thomassen, van Ham, Thomassen, Aars and Andeweg2017, p. 3). Nevertheless, Ferrín (Reference Ferrin, Ferrín and Kriesi2016) and Quaranta (Reference Quaranta2018) pointed out that the SWD indicator has been reported to measure at least 13 different concepts. Besides, the extent to which the SWD indicator really measures these concepts (i.e., its content validity; Bollen, Reference Bollen1989, p. 185-186) has been (and still is) an important source of discussion (Linde & Ekman, Reference Linde and Ekman2003; Canache, Mondak & Selignson, Reference Canache, Mondak and Seligson2001; Norris, Reference Norris and Norris2011; Ferrín, Reference Ferrin, Ferrín and Kriesi2016). While a high content validity seems guaranteed for the simple concept ‘satisfaction with the way democracy works’, more theoretical arguments and empirical evidence are needed for the other concepts.
The SWD indicator has been regularly included in major academic surveys, such as Afrobarometer, Asian Barometer, Americas Barometer, Comparative Study of Electoral Systems (CSES), Eurobarometer, European Social Survey (ESS), European Values Study (EVS), or Latinobarometer. However, these surveys measure the SWD indicator in different ways: in particular, they use different answer scales. Almost all surveys use 4-point scales, but these scales vary on other characteristics: for instance, the Eurobarometer uses a unipolar fully labelled scale (‘very satisfied’, ‘fairly satisfied’, ‘not very satisfied’, and ‘not at all satisfied’), whereas the Americas Barometer uses a bipolar fully labelled scale (‘very satisfied’, ‘satisfied’, ‘dissatisfied’, ‘very dissatisfied’). Additionally, the ESS main questionnaire uses a 11-point bipolar scale with verbal labels only for the endpoints (‘0 – Extremely dissatisfied’ to ‘10 – Extremely satisfied’). Based on previous research (e.g., Saris and Gallhofer, Reference Saris and Gallhofer2007; Saris and Revilla, Reference Saris and Revilla2016; but also research that considered directly the measurement quality of the SWD indicator, see Table 1), we expect that: 1) none of these scales will lead to a perfect measurement; 2) some of these scales will be better than others (since each response scale has its own level of measurement errors) and 3) not accounting for these measurement errors could affect the results.
Previous studies providing estimates of measurement quality for the SWD indicator
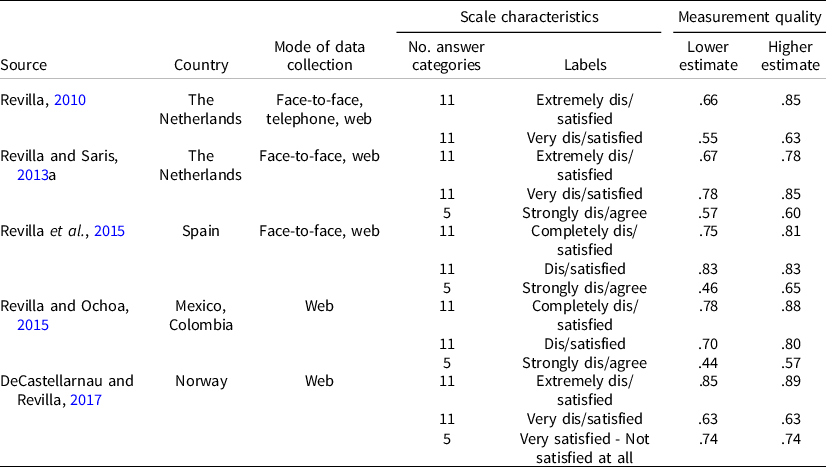
Note: Measurement quality ranges from 0 (only measurement errors) to 1 (no measurement errors; for more information, see Section 4.1). The table shows higher and lower estimates across modes (Revilla, Reference Revilla2010; Revilla and Saris, Reference Revilla and Saris2013a; Revilla et. al, Reference Revilla, Saris, Loewe and Ochoa2015), different timing (DeCastellarnau and Revilla, Reference DeCastellarnau and Revilla2017), or countries (Revilla and Ochoa, Reference Revilla and Ochoa2015).
This has some implications for the research using the SWD indicator, which has, however, received little attention in the literature. First, some of the substantive findings regarding the SWD indicator may be a byproduct of imperfect measurement instruments not accounted for. Second, mixed results may be linked to different levels of measurement errors across measurement instruments, countries, and languages. For instance, Christmann (Reference Christmann2018) summarizes the mixed evidence presented by cross-sectional studies regarding the effects of economics variables on the SWD indicator. Among many others, a potential reason for these differences may be that some of these studies use different scales (e.g., van der Meer and Hakhverdian, Reference van der Meer and Hakhverdian2017, use a 4-point scale with labels ‘very satisfied’, ‘rather satisfied’, ‘not very satisfied’, ‘not at all satisfied’, whereas Schäfer, Reference Schäfer2012 uses the ESS 11-point scale). Lastly, the questions’ formulations and/or the scales currently used might not be the ones with the smaller size of measurement errors. Thus, it is important to estimate the size of measurement errors for different scales, and under different conditions (e.g., across time, countries or languages).
Researchers commonly estimate the size of measurement errors by estimating its complementFootnote 1 , measurement quality. Measurement quality (see also Section 4.1) is a statistical measure ranging from 0 to 1, defined as the strength of the relationship between the latent concept of interest (here the simple concept ‘satisfaction with the way democracy works’, which is what we really want to assess) and the observed survey answers (here, the answers to the SWD indicator, asked using a given scale). The higher the measurement quality, the better the SWD indicator measures the concept ‘satisfaction with the way democracy works’. Information about measurement quality can be used both to improve questionnaire design, by selecting the formulations and scales with a lower size of measurement errors (Revilla, Zavala-Rojas and Saris, Reference Revilla, Zavala-Rojas, Saris, Wolf, D., Smith and Yang-chih Fu2016), and to correct for the remaining measurement errors after the data are collected (Saris and Revilla, Reference Saris and Revilla2016).
The main goal of this paper is to provide estimates of the measurement quality of the SWD indicator using ESS data for 7 different response scales and across 38 country-language groupsFootnote 2 . By making this information easily accessible, our objectives are to make researchers aware of the presence of measurement errors and to provide specific insights about the best scales to use and their comparability across countries and languages. Besides, we also discuss the potential bias that measurement errors introduce and suggest considering correction for measurement errors.
Background
Evidence from previous literature
Previous research provides some estimates of the measurement quality of the SWD indicator under different conditions. Table 1 summarizes the existing knowledge.
Overall, the measurement quality ranges from .44 (in Colombia, 5-point ‘Strongly dis/agree’ scale) to .89 (in Norway, 11-point extremely ‘Dis/satisfied’ scale). This means that between 44% and 89% of the variance of the observed survey responses is due to variations in the latent trait ‘satisfaction with the way democracy works’, whereas between 11% and 56% come from measurement errors (for details, see Section 4.1 and 4.2). In general, the 11-point-item-specific scales yield a higher quality than the 5-point ‘Strongly dis/agree’ scales, although differences exist across studies.
Overall, this previous research confirms that: 1) the measurement quality of the SWD indicator is far from being perfect. Said differently, the SWD indicator does not measure perfectly the simple concept ‘satisfaction with the way democracy works’ and 2) the measurement quality of the SWD indicator varies across scales, modes of data collection and countries. Thus, measurement quality needs to be estimated under different conditions, to provide information allowing to select the best scales possible, assess comparability across studies or groups, and/or correct for measurement errors.
Determinants of measurement quality
In order to understand the reasons behind the variations in measurement quality observed in previous research about the measurement quality of the SWD indicator, we use the list of characteristics expected to affect measurement quality proposed by Saris and Gallhofer (Reference Saris and Gallhofer2007). This list includes formal, topic-based, linguistic, layout and mode of data collection characteristics. In this paper, we focus on differences in measurement quality for the SWD indicator across response scales, countries and languages with the mode of data collection (face to face using showcards) being fixed.
On the one hand, previous research has found that scales’ characteristics affect measurement quality (for an overview, see DeCastellarnau, Reference DeCastellarnau2018). In particular, item-specific scales have been found of higher quality than dis/agree scales (Saris et al, Reference Saris, Revilla, Krosnick and Shaeffer2010). Possible explanations include that dis/agree scales are prone to acquiescence bias and that the response process is more complex for such scales (one extra cognitive step, see Saris et al., Reference Saris, Revilla, Krosnick and Shaeffer2010). Furthermore, scales with at least two fixed reference points have been found to be of higher quality (Revilla and Ochoa, Reference Revilla and Ochoa2015). A fixed reference point is a response option that all respondents understand without doubt in the same way, such as ‘completely satisfied’ (DeCastellarnau, Reference DeCastellarnau2018). They arguably increase quality by making the understanding of the scale clearer and unequivocal. Additionally, scales with a higher number of answer categories (up to a certain level) are argued to have higher quality, although the evidence is mixed (DeCastellarnau, Reference DeCastellarnau2018). However, many scales’ characteristics and their possible interactions are currently understudied.
On the other hand, previous research has found differences in measurement quality across countries (e.g., Saris et al., Reference Saris, Revilla, Krosnick and Shaeffer2010, Revilla and Ochoa, Reference Revilla and Ochoa2015). There are mainly three types of characteristics proposed by Saris and Gallhofer (Reference Saris and Gallhofer2007) that are expected to vary across countries and thus might lead to cross-national variations in measurement quality (Bosch and Revilla, Reference Bosch and Revilla2021): 1) social desirability: if a topic is considered as more sensitive in a given country, the tendency of respondents to select answers that are more socially accepted could be higher, leading to a lower measurement quality; 2) centrality (or saliency) of the topic in respondents’ minds: if a topic is less central in a given country, respondents are likely to have less formed or consistent opinions, leading to a lower measurement quality; and 3) linguistic characteristics, because languages have different inherent structures (Zavala-Rojas, Reference Zavala-Rojas2016). For instance, a given question may be longer or more complex to understand in one language compared to another, even when following the highest translation standards, leading to a lower measurement quality. Languages can lead to different qualities across and within countries.
Implications
The variations in measurement quality observed in previous research about the measurement quality of the SWD indicator have some practical implications. In particular, they can lead to different results. To illustrate this point, we use data from the ESS Round 4 (UK), where the same respondents (n = 725) answered the SWD indicator twice: once at the beginning and once at the end of the survey. The wording of the question was the same in both cases: ‘And on the whole, how satisfied are you with the way democracy works in the UK?’ In both cases, an 11-point scale was used. However, the labels of the endpoints changed: ‘Extremely dis/satisfied’ (fixed reference points) versus ‘Dis/satisfied’ (not fixed reference points).
The cross-distribution of the answers (see Table 2) shows that only 33% of the respondents selected the same numerical option in both scales. Moreover, with the first scale, 44% of respondents are classified as ‘dissatisfied’ (answers 0 to 4), 18% as ‘neither dissatisfied nor satisfied’ (answer 5), and 38% as ‘satisfied’ (answers 6 to 10), whereas with the second scale these proportions are, respectively, 35%, 22%, and 43%. Hence, the first scale gives a more negative view of the satisfaction with the way democracy works of the same sample. Additionally, 8% of the respondents are classified as ‘satisfied’ with one scale, but ‘dissatisfied’ with the other and 23% are classified as ‘neither satisfied nor dissatisfied’ with one scale, but ‘dis/satisfied’ with the other. Similarly, correlations with other questions vary depending on the scale used (see Online Appendix 1). Thus, results for multivariate statistical analyses are also expected to change.
Contingency table of responses with both scales (UK, Round 4, same respondents answer with both scales). Question: And on the whole, how satisfied are you with the way democracy works in the UK?
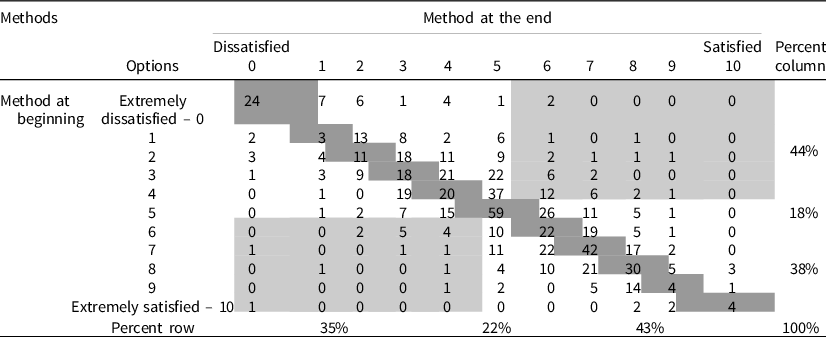
Note: Light grey cells: Combinations of answers in which respondents are classified as ‘dissatisfied’ (options 0–4) with one scale, but ‘satisfied’ (options 6–10) with the other. This represents 8% of respondents.
Dark grey cells: Combinations in which respondents select the same numerical option with both scales. This represents 33% of respondents.
Percent row and percent column: Percentages shown correspond to the grouping of satisfied (0–4), dissatisfied (6–10), and neutral (5) options with the method asked at the end (percent row) and at the beginning (percent column). Differences across dissatisfied and neutral are statistically significant (P < .05), non-significant for ‘satisfied’ (P = 0.06). A Smirnov–Kolmorogov test also confirms that the distributions’ differences are statistically significant (P < 0.01).
This illustrates that using different scales can produce different results. Population inferences based on the exact same sample may change depending on which scale was used. This is linked to the sizes of measurement errors and could provoke differences across studies. However, the true distributions or correlations are unknown and cannot be inferred only with this information. In order to determine which method is better, we need to estimate the measurement quality for each scale.
Contribution
Even though there is some research about its content validity, substantive literature has not addressed the size of measurement errors of the SWD indicator. However, several methodological papers provide estimates of the measurement quality of the SWD indicator (Section 2.1). Their results suggest that measurement errors can be large and vary across response scales, countries/languages and modes of data collection. However, this previous research suffers from several limitations. First, estimates are only available for a few scales and countries. Second, the estimates are provided in a way that does not lead to specific insights for substantive researchers. Third, the estimates differ across studies, but the reasons behind these variations are unclear. For example, the same scale (11-point very ‘Dis/satisfied’) yields the highest quality (around .82) in the study of Revilla and Saris (Reference Revilla and Saris2013a) but generally the lowest one (around .58Footnote 3 ) in an earlier study of Revilla (Reference Revilla2010), even if both studies took place in the same country. This difference may be related to differences in the survey modes or in the model specification, although the reasons are not clear.
Thus, the main goal of this paper is to provide estimates of the size of measurement errors for different scales, countries, and languages. In particular, we contribute to the scarce literature in the following ways.
First, compared to previous studies looking at the measurement errors of the SWD indicator, we use a much larger and richer amount of data (more countries and methods). Particularly, we analyze three multitrait-multimethod (MTMM) experiments implemented in the ESS, providing estimates for 7 response scales and 38 country-language groups.
Second, we use a unique estimation method for all the MTMM analyses, whereas previous research has used different ones. This makes our estimates more easily comparable.
Third, the MTMM analyses are performed following the recently developed Estimation Using Pooled Data (EUPD) approach (Saris and Satorra, Reference Saris and Satorra2018) that reduces the estimation problems observed in the past (see Section 4.2) and hence is expected to provide more accurate results.
Fourth, previous estimates of the measurement quality of the SWD indicator are presented in papers in which its use was incidental and with a clear methodological focus (e.g., comparing modes of data collection). Thus, these estimates were not connected to the substantive literature and are difficult to find for applied researchers. In contrast, this paper makes estimates of the measurement quality of the SWD indicator easily available to applied researchers, with the aim of raising awareness regarding the presence of measurement errors in surveys and their implications for substantive research.
Finally, these estimates are useful for several reasons: 1) they allow selecting the best instruments for future surveys, since they indicate how well different instruments measure the same concept; 2) they inform about the comparability of the indicator across groups (e.g., countries and languages). Indeed, standardized relationships can only be directly compared across groups if the measurement quality is the same in these groups; 3) they can help to disentangle which differences in results between studies/countries/languages may come from measurement errors; and 4) they are needed to correct for remaining measurement errors in applied research.
Method and data
Measurement quality
Measurement quality $({\rm{q}}_{{\rm{ij}}}^2)$
is defined as the strength of the relationship between the latent concept one wants to measure and the observed responses to a specific survey question asked to measure this latent concept (Saris and Andrews, Reference Saris, Andrews, Biemer, Groves, Lyber, Mathiowetz and Sudman1991). It represents the proportion of the variance in the observed responses explained by the variance in the underlying latent concept of interest. It ranges from 0 (no relationship between the indicator and the latent concept) to 1 (perfect measurement). Measurement errors are defined as 1-
$({\rm{q}}_{{\rm{ij}}}^2)$
is defined as the strength of the relationship between the latent concept one wants to measure and the observed responses to a specific survey question asked to measure this latent concept (Saris and Andrews, Reference Saris, Andrews, Biemer, Groves, Lyber, Mathiowetz and Sudman1991). It represents the proportion of the variance in the observed responses explained by the variance in the underlying latent concept of interest. It ranges from 0 (no relationship between the indicator and the latent concept) to 1 (perfect measurement). Measurement errors are defined as 1- ${\rm{q}}_{{\rm{ij}}}^2$
. Following DeCastellarnau and Revilla (Reference DeCastellarnau and Revilla2017), we consider that the quality is ‘excellent’ if
${\rm{q}}_{{\rm{ij}}}^2$
. Following DeCastellarnau and Revilla (Reference DeCastellarnau and Revilla2017), we consider that the quality is ‘excellent’ if ${q^2} \ge .9$
; ‘good’ if
${q^2} \ge .9$
; ‘good’ if $\;.9 \gt {q^2} \ge .8$
; ‘acceptable’ if
$\;.9 \gt {q^2} \ge .8$
; ‘acceptable’ if $.8 \gt {q^2} \ge .7$
; ‘questionable’ if
$.8 \gt {q^2} \ge .7$
; ‘questionable’ if $.7 \gt {q^2} \ge .6$
; ‘poor’ if
$.7 \gt {q^2} \ge .6$
; ‘poor’ if $.6 \gt {q^2} \ge .5$
; and ‘unacceptable’ if
$.6 \gt {q^2} \ge .5$
; and ‘unacceptable’ if ${q^2} \lt .5.$
In order to estimate measurement quality, we use the True Score model (Saris and Andrews, Reference Saris, Andrews, Biemer, Groves, Lyber, Mathiowetz and Sudman1991). In Online Appendix 2, Figure 1 represents this model for the concept ‘satisfaction with the way democracy works’.
Alternatively, the model can be summarized by the following system of equations:
 $${{\rm{T}}_{{\rm{ij}}}} = {{\rm{v}}_{{\rm{ij}}}}{{\rm{F}}_{\rm{i}}} + {{\rm{m}}_{{\rm{ij}}}}{{\rm{M}}_{\rm{j}}}$$
 $${{\rm{Y}}_{{\rm{ij}}}} = {{\rm{r}}_{{\rm{ij}}}}{{\rm{T}}_{{\rm{ij}}}} + {{\rm{e}}_{{\rm{ij}}}}$$
where Fi is the ith trait (e.g., the concept ‘satisfaction with the way democracy works’), Mj is the jth method (each of the response scales), Tij is the True Score (i.e., the hypothetical response of a person in a given scale corrected for random errors), and Yij is the observed response (i.e., the answer actually selected). When standardized, vij, mij, and rij are respectively the validity, method and reliability coefficients. The validity (square of the validity coefficient; vij
2) measures the strength of the relationship between the trait and the True Score. The method effects represent respondents’ systematic reaction to a given method and are the complement of the validity (mij
2 = 1-vij
2). The reliability (square of the reliability coefficient; rij
2) measures the strength of the relationship between the True Score and the observed responses. Finally, eij represents the random errors (e.g., selecting the wrong option by accident or interviewers’ errors in recording the answer). Measurement quality can be computed as the product of reliability and validity: ${\rm{q}}_{{\rm{ij}}}^2 = {\rm{r}}_{{\rm{ij}}}^2*\;{\rm{v}}_{{\rm{ij}}}^2$
This model (from now on ‘Base Model’) assumes that: a) random errors are uncorrelated with each other or with the trait and method factors; b) the traits are correlated; c) the method factors are uncorrelated between them or with the traits; and d) the impact of the method factor on the traits measured with a common scale is the same.
In order to estimate this model, structural equation modelling (SEM) is used (concretely, confirmatory factor analysis). Specifically, in order to identify the model in a SEM framework, it is necessary to consider several traits, each one measured using several methods. It is also possible to test the fit of the model, and some of the assumptions of the Base Model can be relaxed in order to improve this fit, leading to a Final Model from which the estimates are collected.
MTMM approach
The idea of repeating several traits, each measured with several methods, comes from Campbell and Fiske (Reference Campbell and Fiske1959), who were the first to introduce the MTMM approach. In this approach, researchers look at the correlations between the observed answers of questions asking for several (usually at least three) correlated traits using several (usually also at least three) methods. Andrews (Reference Andrews1984) proposed to analyze such matrices of correlations (sometimes called MTMM matrices) through SEM. Saris and Andrews (Reference Saris, Andrews, Biemer, Groves, Lyber, Mathiowetz and Sudman1991) proposed to do this more specifically using the True Score model to reproduce the matrix of correlations.
However, asking at least three times the same questions to the same respondents using different methods increases respondent burden and could generate memory effects (Van Meurs and Saris, Reference Van Meurs, Saris, Van Meurs and Saris1990). To reduce such problems, Saris, Satorra and Coenders (Reference Saris, Satorra and Coenders2004) proposed to randomly divide the respondents into different groups, each group answering a different combination of only two methods. Nevertheless, this Split-Ballot MTMM (SB-MTMM) approach frequently led to estimation problems (Revilla and Saris, Reference Revilla and Saris2013b). Thus, Saris and Satorra (Reference Saris and Satorra2018) proposed, when similar datasets are available, to estimate a Pooled Data Model (PDM) with all the datasets, store its estimates, and use them to get an identified model in each dataset (here the country(-language) groups are the unit of interest). The rationale of this EUPD approach is that higher sample sizes lead to lower identification issues. The approach works under the assumption that especially trait effects, but also method effects, are expected to be quite similar across each group. We followed this approach since previous research suggests that it performs better than other alternatives, such as Bayesian SEM (Saris and Satorra, Reference Saris and Satorra2019) or estimation on a country-by-country basis (Revilla et al, Reference Revilla, Poses, Serra, Asensio, Schwarz and Weber2020).
Data
We used data from three SB-MTMM experiments about Political Satisfaction implemented in the ESS rounds 1 (ESS Round 1: European Social Survey Round 1 Data, 2002; ESS Round 1: Test variables from Supplementary questionnaire, 2002), 2 (ESS Round 2: European Social Survey Round 2 Data, 2004; ESS Round 2: Test variables from Supplementary questionnaire, 2004), and 4 (ESS Round 4: European Social Survey Round 4 Data, 2008; ESS Round 4: Test variables from Supplementary questionnaire, 2008). The ESS is a biannual cross-national survey aimed at tracking the attitudes, opinions, and behaviours of citizens in most European countries.
A slightly different set of countries participated in each round. Thus, the number of countries analyzed are, respectively, 18 (R1), 22 (R2), and 27 (R4). Moreover, from R2 onwards, information about the language in which the survey was fielded is available. Therefore, whereas in R1 the analyses were done by country (sometimes with mixed languages, e.g., Switzerland), in R2 and R4 they were done by country-language group (e.g., Switzerland-French and Switzerland-German). However, languages with less than 70 observations in a given SB group were excluded. Thus, we analyzed 28 country-language groups in R2 and 33 in R4. For more information about the country(-language) groups and their sample sizes, we refer to Online Appendix 3.
In each round, the survey is implemented face to face and lasts around 1 hour. The main questionnaire consists in core modules repeated in each round and rotating modules addressing different topics. In the first seven rounds, it is followed by a supplementary questionnaire including a short version of the Schwartz Human Values scale and some repeated questions (usually varying the scale), part of several MTMM experiments.
In each round, the Political Satisfaction experiment asks about the same three traits: satisfaction with the present state of the economy, the way the government is doing its job, and the way democracy works. The requests for an answer for these traits are:
-
Trait 1: On the whole how satisfied are you with the present state of the economy in [country]?
-
Trait 2: Now thinking about the [country] government, how satisfied are you with the way it is doing its job?
-
Trait 3: And on the whole, how satisfied are you with the way democracy works in [country]?
Moreover, three methods (i.e., response scales) are used in each round. One method (M1) is asked in the main questionnaire and is the same in the three rounds. It is a bipolar, item-specific, 11-point scale, with three fixed reference points, two verbal labels at the extremes (extremely dis/satisfied), horizontal layout and medium correspondence between verbal and numerical labels. The other two methods are asked in the supplementary questionnaire and differ across rounds. Table 3 presents the main characteristics of M1 and summarizes the main differences of the other methods with respect to M1. Showcards of all methods are available in Online Appendix 4.
Main characteristics of M1 and main differences of M2–M7 with respect to M1
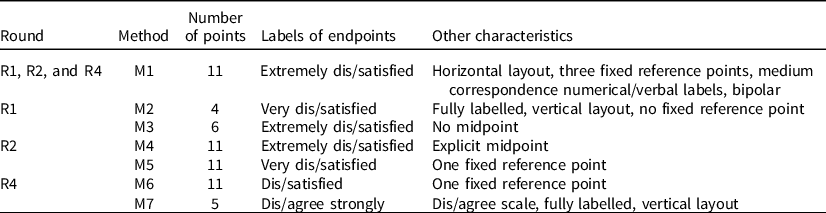
Due to the SB design, respondents in each round get the method from the main questionnaire (M1) and then are randomly assigned to one of the two methods from the supplementary questionnaire.
Analyses and testing
The analyses are done for each round separately. First, for each SB group within a country(-language) group, the correlation matrices, standard deviations, and means were created with R 3.6.1 (R Core Team, 2019) using pairwise deletion. We excluded the individuals who did not answer the supplementary questionnaire during the same day because this has an impact on answers’ quality (Oberski, Saris and Hagenaars, Reference Oberski, Saris, Hagenaars, Loosveldt, Swyngedouw and Cambre2007), as well as a few individuals who did not follow the experimental procedure. Then, we used these matrices to create the pooled data matrices/standard deviations/means, which correspond to the weighted average of the matrices/standard deviations/means of all country(-language) groups analyzed from the same round. The weights are the sample size of each SB group within each country(-language) group divided by the total sample size across all country(-language) groups for that SB group.
Second, the True Score PDM (Base Model described in Section 4.1) was estimated using Lisrel 8.72 (Jöreskog and Sörbom, Reference Jöreskog and Sörbom2005) multiple-group maximum likelihood estimation (examples of inputs in Online Appendix 5).
Third, we tested the fit of the Base Model for each round using the JRule software (van der Veld, Saris and Satorra, Reference Van der Veld, Saris and Satorra2008), based on the procedure developed by Saris, Satorra and van der Veld (Reference Saris, Satorra and van der Veld2009). This procedure has the advantages of 1) testing at the parameter level and not at the global level and 2) considering the statistical power. Besides the indications of JRule, deviations from the Base Model were decided based on theoretical grounds. Our expectation was that the reaction of respondents to a given scale (method effect) might differ for either SWD (because the government and the economy are more specific and connected between them than with the democracy) or satisfaction with the way the government is doing its job (since citizens have more control on government than on the economy or democracy; see Online Appendix 6 for final PDMs).
For the country(-language) group analyses, we started again by estimating the Base Model using multiple-group maximum likelihood. However, in this case, the value of the parameters of the trait and method effects were previously fixed to the PDM values for the same round. This model was corrected using JRule in each group until reaching a Final Model (see Online Appendix 7). The priority was freeing the parameters fixed to the PDM (different value of the parameters, but same model specification), but other changes were often required (mainly freeing other method effects that were fixed to 1 in the PDM).
Results
Measurement quality of the SWD indicator across response scales
Table 4 shows the average measurement quality and standard deviation of the SWD indicator for seven response scales across all the country-(language) groups included in a given roundFootnote 4 .
Measurement quality (q2) of the SWD indicator for seven response scales: average and standard deviation across country(-language) groups
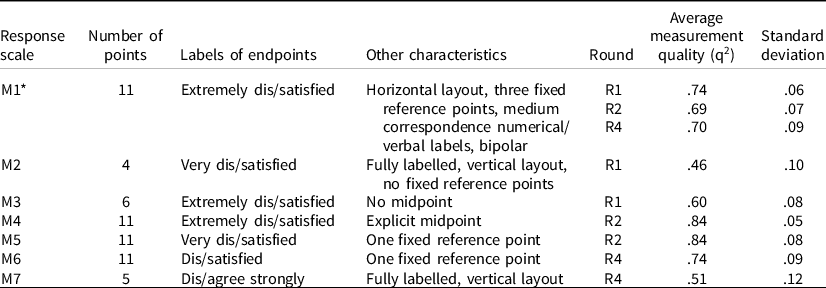
*The same estimates for M1 are also presented in Poses et al. (Reference Poses, Revilla, Asensio, Schwarz and Weber2021).
First, the measurement quality of M1 (main questionnaire’s 11-point scale with labels ‘Extremely dis/satisfied’) is on average similar across the three rounds, even if different individuals and countries participated in each round. This quality can be qualified as ‘acceptable’: around 70% of the variance in the observed survey responses can be attributed to variations in the underlying concept of interest and around 30% to measurement errors.
Second, the average measurement quality clearly varies across response scales. The lowest quality is found for the 4-point scale with labels ‘Very dis/satisfied’ (M2), with q2 = .46, meaning that on average only 46% of the variance in observed responses is due to variations in the underlying concept of interest, while 54% is due to measurement errors. This scale is the only one with ‘unacceptable’ quality (<.5). This is an important finding since most regular surveys (all the ones mentioned in Section 1, except the ESS) currently use 4-point scales for the SWD indicator, although generally different among them (e.g., different labels). This suggests that 4-point scales are not a good option. In contrast, the highest quality (q2 = .84 for both, classified as ‘good’) is found for the 11-point scales with an explicit midpoint (M4) and with labels ‘Very dis/satisfied’ (M5).
Moreover, the measurement quality for the 4-point scale with labels ‘Very dis/satisfied’ (M2; q2 = .46) is lower than for the 6-point scale with labels ‘Extremely dis/satisfied’ (M3; q2 = .60), which is lower than for the 11-point scale with labels ‘Extremely dis/satisfied’ (M1; q2 ≈ .70) and for the rest of the 11-point scales (M4, M5, and M6; respectively .84, .84 and .74). This suggests that using more answer categories (up to 11) reduces measurement errors. Also, the 5-point ‘dis/agree strongly’ scale (M7) displays the second worst quality (.51, classified as ‘poor’), consistent with previous research on the low quality of dis/agree scales (Saris et al., Reference Saris, Revilla, Krosnick and Shaeffer2010). Lastly, previous research suggests that using at least two fixed reference points is preferable, but our results do not support this: for instance, the 11-point scale with labels ‘Very dis/satisfied’ (M5; one fixed reference point) has a higher measurement quality than the one with three fixed reference points (M1).
Measurement quality across country(-language) groups
Besides variations across methods, our data indicate that, for a given method, there are variations in the estimated quality across country(-language) groups. This could be due to systematic or random fluctuations in the estimation. To further study them, Table 5 shows, for each country(-language) group, the average measurement quality and its standard deviation across methods. The country(-language) groups are divided according to the rounds in which they participated. They should only be compared with other groups participating in the same rounds (i.e., groups that received the same methodsFootnote 5 ).
Measurement quality (q2) across country(-language) groups: average and standard deviation across methods
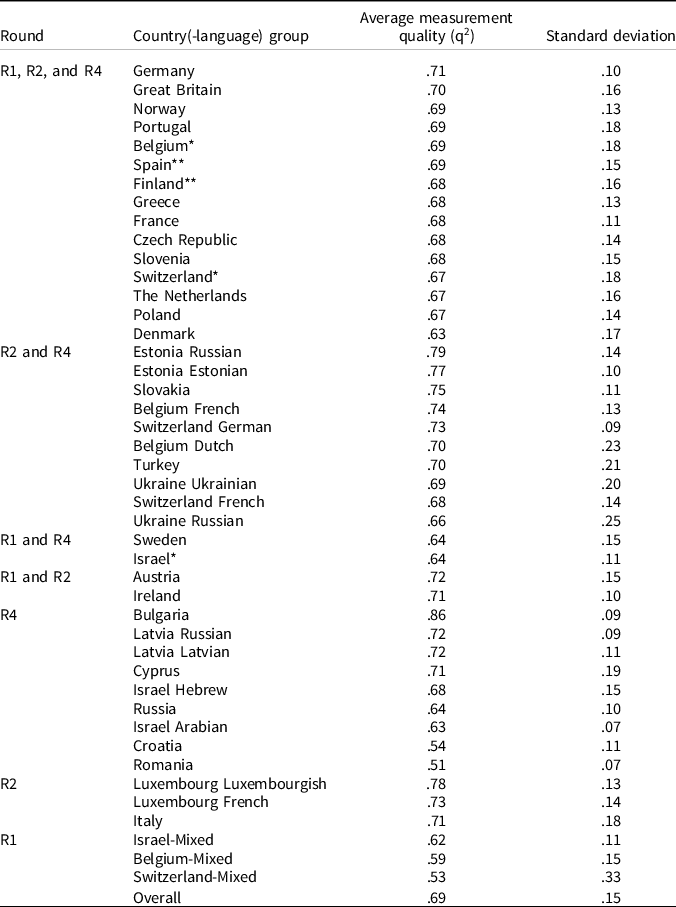
*Belgium, Switzerland, and Israel participated in R1 but could only be split by language for R2 and/or R4. Hence, we included them twice: considering their average across languages/rounds in which they participated, and by separate languages.
**Spain included Catalan and Spanish in R1; Finland included Finnish and Swedish in R1.
Overall, one country-language group has an average measurement quality that can be classified as ‘good’ (Bulgaria, R4), 17 as ‘acceptable’, 22 as ‘questionable’, and 4 as ‘poor’. Differences across groups are influenced by the rounds in which they participated (which determine the methods received). Average quality is .60 for R1, .79 for R2, and .65 for R4. Despite that, Table 5 suggests that some differences across countries do exist. This is further supported by the fact that in the analyses, in the Base Model, some parameters that were initially constrained to equality in all country(-language) groups had to be freed to obtain an acceptable fit. Additionally, the overall standard deviation of the methods ranges from .05 to .12, suggesting that systematic differences across country(-language) groups may be more pronounced for some methods.
Nevertheless, comparing the countries which participated in all three rounds, the average measurement quality of the SWD indicator varies from .63 in Denmark to .71 in Germany. In 14 out of 15 countries, average qualities fall within the interval .67–.71. Comparing countries that participated only in R2 and R4, differences tend to be larger (.13 difference between the higher and lower estimates). Comparing countries that participated only in R4, differences are even larger (.25 difference between the higher and lower estimates). Higher differences may be related to the fact that less methods (and different combinations) are included in the average.
In many cases, we cannot separate country from language effects. However, there are seven countries where different language groups were analyzed. In these cases, differences range from 0 within Latvia languages to .05 within Israel, Switzerland, and Luxembourg languages. Additionally, two country-language groups with the same language (Ukraine-Russian and Estonia-Russian) have, respectively, the maximum (.79) and minimum (.66) qualities for the groups of countries which participated in R2 and R4, suggesting that country-specific characteristics are more important than the use of different languages in explaining quality differences across groups. Finally, each country-language group presents standard deviation across methods oscillating around the average standard deviation of .15. These results suggest that variations in quality due to the method occur in all countries, while variations in quality for a given method due to country(-language) characteristics are less noticeable.
Overview of all estimates and how to use them
Table 6 presents the full list of estimates of measurement quality for the SWD indicator. These estimates can be used for different purposes. First, they can be used to select the best methods to measure ‘satisfaction with the way democracy works’ in future surveys. Particularly, the results (see also Table 4) indicate that in the majority of countries, an 11-point scale with explicit midpoint (M4) and/or an 11-point scale with labels ‘Very dis/satisfied’ (M5) are the best options. Nevertheless, since the scale with higher quality may depend on the country-(language) group(s) of interest (and the methods analyzed for each country), researchers can tailor this general recommendation to the specific countries of their interest using Table 6. For instance, the best option seems to be an 11-point scale with an explicit midpoint (M4) in Finland, but an 11-point scale with labels ‘Dis/satisfied’ (M6) in France. For cross-national surveys, the scale that is the best in most countries of interest can be selected.
Measurement quality estimates (q2) for each country(-language) group and method
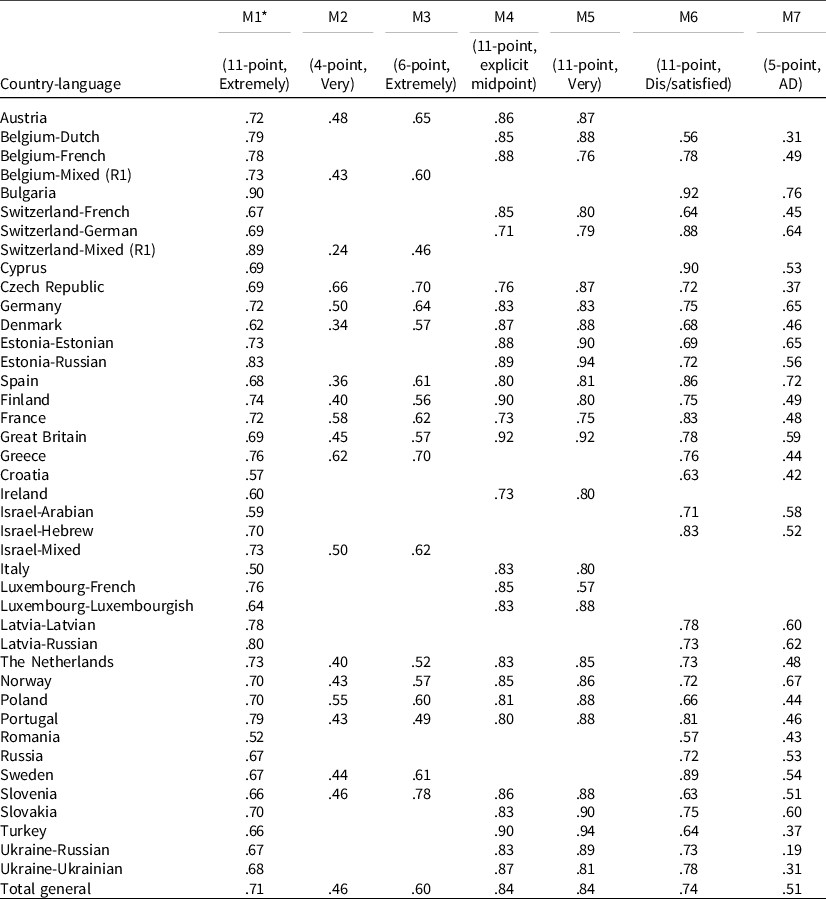
*For M1, the table shows the average for all rounds in which a country participated (M1 appeared in R1, R2, and R4). These estimates for M1 can also be computed from the Online Appendix of Poses et al. (Reference Poses, Revilla, Asensio, Schwarz and Weber2021).
Second, a necessary condition for comparing standardized relationships between satisfaction with the way democracy works and other variables across groups is to have a similar measurement quality in each group. Readers can compare the measurement quality of the groups they are interested in to assess if this condition is met for different methods. For instance, since the quality for M1 (11-point, labels ‘Extremely dis/satisfied’) is .52 in Romania but .90 in Bulgaria, our results suggest that, without correction, one cannot compare standardized relationships (e.g., correlations and standardized regression coefficients) between the SWD indicator (M1) and another variable across Romania and Bulgaria.
Third, these estimates can help to disentangle which differences in results between studies/countries/languages may come from measurement errors. In general, the lower the estimate of measurement quality estimate, the lower the observed correlation compared to the real one, unless there is common method variance (Saris and Revilla, Reference Saris and Revilla2016). To illustrate this point, let assume that in the Netherlands the observed correlation between the SWD indicator and another variable (measured without errors) was .60 in a study that used M1 (11-point scale with labels ‘Extremely dis/satisfied’) for the SWD indicator, but .44 in another study that used M2 (4-point scale with labels ‘Very dis/satisfied’). While the results of both studies may seem inconsistent, once we take into account the difference in qualities, the corrected correlation would be the same (.7) in both cases (see Online Appendix 8 for details). Generally, when there are large differences in measurement quality, we can expect that observed correlations will differ across studies even if the true correlations were in fact the same.
Finally, these estimates can also be used to perform correction for measurement errors. To illustrate this point, we replicated part of the regression analyses of a study by Vlachová (Reference Vlachová2019) about the determinants of the SWD indicator (Table 2, p. 233). We selected this example because it is based on ESS data, so the estimates of measurement quality presented in Table 6 can be used to do the correction in the case of the SWD indicator. However, such estimates are only available for R2. Thus, we simplified the example by focusing only on R2 dataFootnote 6 . Moreover, to keep the example concise, we focus on two countries: Czech Republic (n = 3,026) and Slovakia (n = 1,512). We use the COSME package (Cimentada & Weber, Reference Cimentada and Weber2020) in R 4.0.4 (R Core Team, 2021) to automaticallyFootnote 7 correct for measurement errors the correlation matrix on which the regression analyses are based (for more details, see: https://sociometricresearch.github.io/cosme/index.html and Online appendix 9) and the lavaan package (Rosseel, Reference Rosseel2012) for estimation. For a more general explanation of how to correct for measurement errors in different models, we refer to Saris and Gallhofer (Reference Saris and Gallhofer2007) and DeCastellarnau and Saris (Reference DeCastellarnau and Saris2014). Table 7 presents the standardized regression coefficients with and without correction for measurement errors.
Standardized coefficients of regressions (dependent variable: the SWD indicator), with 95 % confidence intervals in brackets
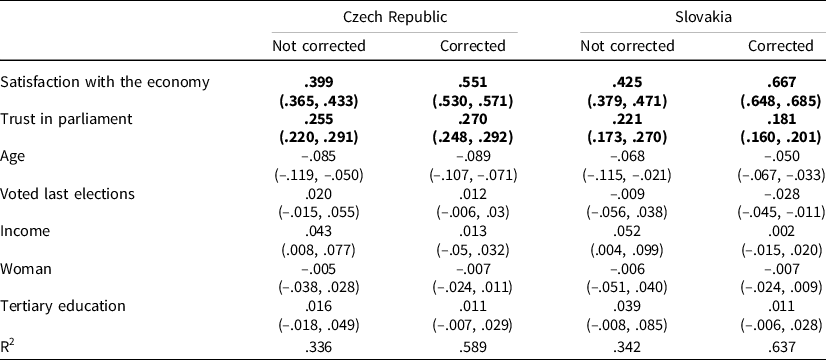
Note: in bold, variables where we corrected for measurement errors. More information about the variables included in the regressions in Online appendix 10.
All estimates change once correction for measurement error is implemented. The change is, as expected, especially pronounced for the variables for which we correct for measurement errors directly. For instance, the standardized coefficient of the effect of satisfaction with the economy on the SWD indicator increases by around 30% in the Czech Republic and 50% in Slovakia. Besides, one of the conclusions of Vlachová (Reference Vlachová2019) is that ‘satisfaction with the present state of the economy is a stronger predictor of SWD than trust in parliament’ (p. 232). We can see that this conclusion still holds after correction for measurement errors. However, the difference is now much stronger. Furthermore, while the effect of satisfaction with the present state of the economy is quite similar in both countries before correction, once applying the correction, this effect is larger in Slovakia. Besides, some coefficients are statistically different from 0 with correction, but not without correction (e.g., income in Czech Republic). This illustrates that comparisons across countries might be affected as well. Finally, the R2 sharply increases.
Discussion/conclusions
Main results
While there has been some debate about which concepts – beyond ‘satisfaction with the way democracy works’ – the SWD indicator measures, the size of the measurement errors of this indicator has been ignored in substantive literature. In this paper, we started to fill this gap by providing estimates of the measurement quality of the SWD indicator for 7 scales and 38 country(-language) groups using data from 3 MTMM experiments implemented in the ESS. Our results provide useful information for the choice of better scales in future surveys, help to check if the necessary condition for comparing standardized relationships (equal quality) across groups is met, help to disentangle differences in results due to measurement errors, and can be used to both assess the effect of measurement errors in a single study and correct for them.
Additionally, we found that the average measurement qualities vary systematically across response scales. On average, two 11-point scales (M4, with an explicit midpoint, and M5, with labels ‘Very dis/satisfied’) present the highest quality (.84) and the 4-point scale (M2, labels ‘Very dis/satisfied’) the worst (.46). The response scale from the ESS main questionnaire (M1) displayed an acceptable quality (around .70). All 11-point scales (M1, M4, M5, and M6) present a higher quality than the 4-point scale (M2, .46), the 6-point scale (M3, .60), and the 5-point dis/agree scale (M7, .51). The reason for the differences between the 11-point scales (M1, M4, M5, and M6), which differed only in their labels, is unclear. Further research is needed to disentangle this.
Moreover, we found that systematic differences across country-language groups are often (very) small. However, they are bigger in some cases (especially when less methods are included in the average). Most differences between languages are also small.
Limitations
First, not all methods were asked at the same time. Hence, differences in quality between methods in the main (M1) versus supplementary questionnaires (M2–M7) could be explained both by the timing and the variations in response scales, while differences between the methods of the supplementary questionnaires are not affected by the timing. Also, M2–M7 are asked as a repetition of the same question that would not occur in normal surveys and may affect respondents’ answers (e.g., memory effects).
Second, confidence intervals of the quality estimates are not easily retrievable. Thus, it is difficult to know which differences between estimates are a product of estimation uncertainty (Oberski and Satorra, Reference Oberski and Satorra2013). However, the results’ consistency across groups and rounds and the large sample sizes may partially account for these problems, especially regarding average estimates across methods.
Third, there were still some problems of improper solutions and to a lesser extent non-convergence. Fourth, the testing procedure involves some non-avoidable subjectivity. The last two issues might affect the values of the estimates. Future research in the broader field of SEM shedding light on these problems would be desirable.
Finally, the results are obtained for a face-to-face survey using showcards. Further research that explores whether these results hold for different modes of data collection (e.g., telephone, web surveys), as well as including more scales/countries, is needed.
Practical implications
Based on our results, we derive some general guidelines/recommendations for the SWD indicator.
First, in general, we recommend using 11-point scales, particularly with an explicit midpoint (as M4), at least for face-to-face surveys. Currently, most regular surveys use different variations of 4-point scales for the SWD indicator. In our study, M2 is the best approximation for the quality of these scales because it also has four points. Based on our results, 4-point scales do not seem to be a good option: measurement errors explain more than half of the variance of the observed responses.
Second, comparing studies that use different methods, it is likely that differences in results can be due to differences in the size of measurement errors if these methods have different qualities. Particularly, differences in results between studies that use 4-point versus 11-point scales can be expected if no correction is implemented.
Third, differences in quality across country-language groups for the SWD indicator are on average small for many country-language groups. Thus, when comparing countries that use the same method, differences in results across countries are not very likely to be due to different sizes of measurement errors. However, this cannot be ruled out for all groups, especially for those countries/languages not analyzed here. Besides, this does not imply that these estimates are unbiased: that all are equally affected by the size of measurement errors allows comparing them but does not reduce the size of the bias.
Lastly, these findings suggest, in line with previous research, that standardized relationships between different concepts based on survey measures may not be well estimated because of the presence of measurement errors, potentially affecting substantive results. They may be infra-estimated because of random errors or over-estimated because of the presence of common method variance. Researchers should correctly tackle this issue. Particularly, this situation could be improved by performing correction for measurement errors (Saris and Revilla, Reference Saris and Revilla2016).
Supplementary material
To view supplementary material for this article, please visit https://doi.org/10.1017/S1755773921000266.
Acknowledgements
We are thankful to Wiebke Weber for her comments and support for this paper, to Jorge Cimentada for his help with the data preparation and analysis, to Hannah Schwarz for her help with the data preparation, and to Andrea Noferini for his support to the initial project. We also thank the ESS CST for their continuous support of this line of research.
Competing interests
The author(s) declare none.


 Open access

