


Introduction
In 2017, the city of Toronto introduced an ambitious plan to leverage AI and data-driven tools to create a ‘smart city’ in part of its jurisdiction. The initiative, a collaboration with a subsidiary of Google’s parent company, Alphabet Inc, promised to improve public services and promote urban development. By analyzing reams of data recorded from a network of sensors it sought to deploy, the aim was to use AI to optimize decisions on policy challenges ranging from efficient energy use to parking and waste disposal. As implementation neared, however, the project encountered sustained opposition from activists, academics, journalists, and residents, who raised concerns about privacy, surveillance, and social justice. Following three years of contentious debate, the project was ultimately abandoned (Lorinc Reference Lorinc2022).Footnote 1
Toronto’s experience is one of several high-profile cases in which public backlash has disrupted the deployment of AI-based systems in public policy. In the UK, for example, the Department of Education scrapped its use of an algorithm to predict and replace students’ qualifying exam grades during the pandemic, following widespread criticism (Walsh Reference Walsh2020). For similar reasons, the New Orleans Police Department gave up the use of algorithms to predict crime hot spots and guide its allocation of policing units (Winston Reference Winston2018). Such controversies can also carry major political consequences. In the Netherlands, a biased algorithm used to detect fraud in the child benefits payments system wrongly accused thousands of families of wrongdoing, triggering a public outcry that culminated in the government’s resignation in 2021 (Erdbrink Reference Erdbrink2021). Nor is the sensitivity confined to the public sector: Amazon, Microsoft, and IBM have each withdrawn from multi-billion dollar contracts supplying facial recognition technology to police departments amid widespread public concern (Heilweil Reference Heilweil2020).
These cases raise broader concerns that the rapid deployment of AI systems may erode public trust and hinder the future adoption of potentially beneficial technologies (Evgeniou et al. Reference Evgeniou, Hardoon and Ovchinnikov2020). These concerns may yet prove warranted. It may be that as people learn more about AI and are increasingly exposed to its outputs (for example, ChatGPT), their acceptance of the technology grows. Yet notably, little is known about this question. How do people view the use of AI-based algorithms in determining high-stakes decisions in public policy? How do these views evolve in response to personal experience with AI and to growing information about the technology’s implications?
These questions are particularly pertinent given the expanding role of AI across policy domains. Decisions about food-stamp allocation, parole eligibility, tax-audit selection, and police deployment – traditionally the purview of human officials – are increasingly delegated to AI-based systems (for example, Toros and Flaming Reference Toros and Flaming2018; Yeung Reference Yeung2020). As this trend accelerates, government and industry leaders have emphasized the need for greater public input in the development and introduction of AI-based systems to ensure their alignment with societal values (U.S. Office of Management and Budget 2020). The Biden Administration’s ‘Blueprint for an AI Bill of Rights’, for example, stresses public engagement throughout the development of automated systems. Likewise, the European Commission has incorporated public consultation into its AI regulatory strategy, inviting citizens to provide input on the application of the EU’s proposed AI Act.
Despite these calls, it remains unclear what public input on AI would represent in practice. One concern is that people have dispositions about technologies in general, and that their input on the usage of AI would have little relation to its specific upsides and risks. Furthermore, in other politically salient issue domains involving scientific expertise – such as climate change or Covid vaccinations – expert opinion and relevant information was often discounted and, instead, partisan cues strongly shape opinion. It is therefore uncertain whether people can or will form informed views about the use of AI in policy decision making. In this paper, we develop a theoretical and empirical account of how attitudes towards algorithmic governance evolve, focusing on the way different levels of engagement with AI affect people’s views, especially the influence of personal experience with AI and exposure to information about the technology’s potential impacts.
A central challenge is that engagement with AI is not random: individuals who encounter or avoid such systems may differ systematically in their underlying policy preferences. To address this, we designed a field experiment that randomizes exposure to AI-based decision making. We recruited more than 1,500 American workers to perform paid tasks on an online labor platform and tracked their attitudes on AI-based decision making in various domains across a three-wave panel survey.
The experiment consisted of a factorial design of three treatments. The first varied the decision maker who hired and assigned workers to tasks: a computer algorithm or a human employer; the second treatment varied the nature of the experience (that is, whether it was in line with or against the worker’s preferences); the third factor varied the content of the tasks that the workers performed, exposing them to either positive, negative, or placebo information about AI and its implications.
Our findings show no evidence that personal exposure to an algorithmic decision-making ‘boss’ affects support for AI in public policy – a noteworthy result given that such exposure did influence workers’ behavior on the job (performance quality, time investment, willingness to work). However, our results indicate that AI-related attitudes are not solely determined by prior dispositions or beliefs. Rather, we find that workers significantly updated their attitudes after being exposed to information about AI and its societal implications, even when the information contradicted their predispositions. Notably, this effect held days after exposure to the information.
Overall, the findings provide insight into what public input in AI regulation would entail. Contra to concerns, these attitudes are not fixed nor determined by idiosyncratic personal experiences. Instead, individuals appear open to learning about this emerging policy challenge and to revising their views about the appropriate use of AI in government. This openness underscores the promise of meaningful democratic oversight.
Our findings contribute to the growing literature on the determinants of public opinion towards algorithmic decision-making (ADM) in public policy (Bansak and Paulson Reference Bansak and Paulson2024). Prior studies have identified several factors shaping initial attitudes on this issue, including trust in technology, personality traits, and social norms (for example, Schiff et al. Reference Schiff, Schiff and Pierson2022; Zhang Reference Zhang2021). More recent work shows that these attitudes also depend on features of the technology itself (Kennedy et al. Reference Kennedy, Waggoner and Ward2022) and on the specific context in which it is implemented (Horowitz Reference Horowitz2016; Raviv Reference Raviv2025; Wenzelburger and Achtziger Reference Wenzelburger and Achtziger2023). Notably, however, earlier research has relied largely on cross-sectional assessments taken when individuals have limited knowledge of or experience with AI. Our study advances this literature by systematically examining how attitudes evolve as people acquire information about AI or interact with the technology firsthand.
Finally, our results speak to the broader literature on the political ramifications of recent advances in AI and digitization, particularly work on how the current wave of labor-market automation shapes voters’ preferences and behavior (for example, Gallego et al. Reference Gallego, Kuo, Manzano and Fernández-Albertos2022; Schöll and Kurer Reference Schöll and Kurer2024). Whereas this research focuses on the risks of worker displacement by AI, we examine the political implications of working under machine-guided decisions, an increasingly common but largely understudied experience.
Drivers of Public Opinion on the Use of AI in Policy
How do views evolve as a result of more engagement with the technology and its implications? Answers to these questions are not obvious ex ante. The literature on the public adoption of emerging technology debates the extent to which people change their assessments of new technologies.
One strand of research emphasizes a cognitive process of learning and holds that people’s attitudes often evolve and change as they acquire more knowledge about a new technology (for example, Yeomans et al. Reference Yeomans, Shah, Mullainathan and Kleinberg2019). For example, studies suggest technological literacy is key to the way people weigh the costs, risks, and benefits of biotech and energy-production technologies (Cobb and Macoubrie Reference Cobb and Macoubrie2004; Stoutenborough and Vedlitz Reference Stoutenborough and Vedlitz2016). This conjecture of information-induced updating seems particularly relevant at this early stage of the public debate over AI regulation, when most people still know little about AI and there are no widely accepted positions among the elites that can cue public opinion on the matter. Evidence from other emerging policy domains, such as energy policy, shows that in the early stages of debate, before elites adopt clear positions, people tend to weigh information based on its substance rather than follow partisan endorsements (Druckman et al. Reference Druckman, Peterson and Slothuus2013).
Therefore, as various actors have a growing interest in informing the public about certain benefits or potential risks of AI, more people are likely to encounter new information about the technology and revise their views accordingly. One such example is ProPublica’s report on the risk assessment algorithm COMPAS used to assess the risk of recidivism for defendants in some US states. The report, which showed that the algorithm exhibited racial bias in predicting recidivism rates, sparked a heated public debate about the implications of AI usage in the criminal justice domain (Angwin et al. Reference Angwin, Larson, Mattu and Kirchner2016).
Another strand of research underscores the affective dimension and contends that information alone is rarely sufficient to lead to attitude change. Instead, people also need motivation to process the information (Boudet Reference Boudet2019; Scheufele and Lewenstein Reference Scheufele and Lewenstein2005). Specifically, if people cannot grasp how AI could affect their well-being, they may have little motivation to learn about the technology. Moreover, the complexity of the technology may make it difficult to understand and further limit the impact of information on attitudes.
However, the fact that people are less informed about technological issues does not necessarily mean that they have only weak opinions on the matter (Lee et al. Reference Lee, Scheufele and Lewenstein2005). Studies have shown that people form opinions about new technologies based on predispositions, such as their general trust in technology (Araujo et al. Reference Araujo, Helberger, Kruikemeier and de Vreese2020; Mays et al. Reference Mays, Lei, Giovanetti and Katz2021) or in human decision makers (Miller and Keiser Reference Miller and Keiser2021). These predispositions are often difficult to overcome and likely influence the extent to which people update their views in response to new information (for example, Taber and Lodge Reference Taber and Lodge2006). In other words, individuals are often motivated reasoners, and their response to new information largely depends on whether it is congruent with their prior beliefs (Druckman and Bolsen Reference Druckman and Bolsen2011). If this is the case in the context of AI, biased processing of new evidence will likely cause preferences to change only slightly when the information contradicts prior views.
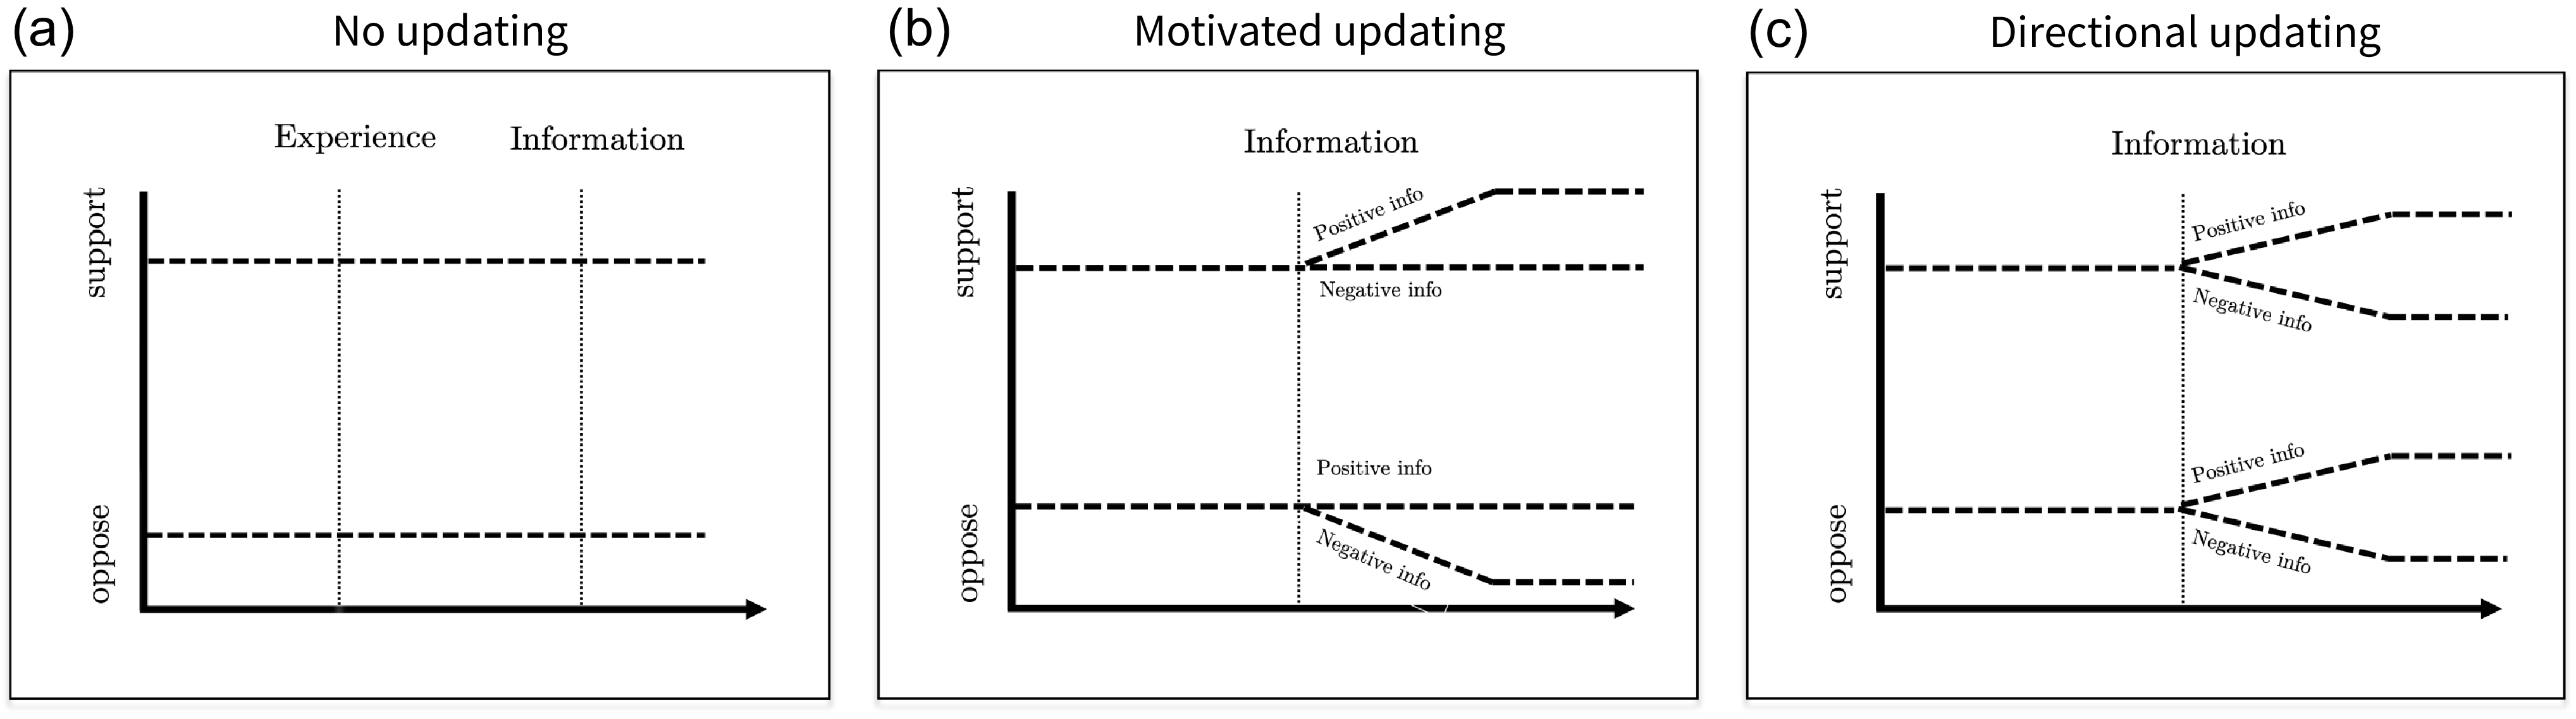
To illustrate the differences between these theoretical approaches, suppose two people watch a news segment of experts discussing the ProPublica report that revealed racial bias in COMPAS, the risk assessment algorithm discussed earlier. One person is initially more favorable towards AI, while the other is more skeptical. How does exposure to this new information affect their opinions? Figure 1 depicts three possible trajectories of attitude change that individuals may follow. Figure 1(a) shows the attitudes of both individuals remain stable, irrespective of the information they encounter. In contrast, panel (b) shows support for the use of AI changing only in the direction of the individuals’ prior beliefs; they are paying attention only to the evidence that confirms their priors while ignoring the rest of the information. Finally, panel (c) shows support for AI change in the direction implied by the new information, irrespective of people’s initial stance. For instance, learning about the biased outcomes of the COMPAS algorithm would make them both more skeptical about using AI for key decisions in policy implementation.Footnote 2
Exposure to new information – trajectories of preferences.
Note: Three possible patterns of attitudinal change that may result from exposure to new information about AI and its implications. The vertical axis indicates the probability of favoring AI algorithms in the policy implementation.

Having little motivation or ability to process information in an unbiased manner, a key shortcut individuals may rely on is their prior experience with the technology. In recent years, people are increasingly exposed to AI in their daily lives, from automated hiring decisions and loan approvals to insurance pricing and credit determinations.Footnote 3 These interactions may affect how they think about AI. Specifically, direct experience with ADM may foster a sense of familiarity with and trust in AI algorithms, leading to greater acceptance of their use in public policy implementation. This notion is often expressed by technology experts who argue that effective and accurate technologies will eventually overcome initial resistance and gain legitimacy among the public simply by people getting used to them (Ullman and Malle Reference Ullman and Malle2017). For example, widespread exposure to large language models (LLMs) may enhance people’s familiarity with AI, subsequently increasing their support for the use of AI in other domains.
Alternatively, the nature of the experience plays a more prominent role in shaping opinions. Repeatedly receiving inaccurate information from LLMs or being denied a loan request by a bank’s ADM creates a vivid heuristic that is more accessible than other sources of information. If this is the case, people’s attitudes towards incorporating AI in policy could be a function of their satisfaction with the ADM they confront in their daily lives.
This expectation is consistent with research on economic voting, which suggests that less informed voters rely on their own economic experiences as heuristics to assess broader questions, such as the effectiveness of the government’s economic policy and its competence (see Healy and Malhotra Reference Healy and Malhotra2013 for an extensive discussion). Furthermore, previous studies have shown that individuals’ policy preferences are influenced by their personal experiences in an array of domains, be it in financial markets (Margalit and Shayo Reference Margalit and Shayo2021), the experience of extreme weather (Egan and Mullin Reference Egan and Mullin2012), or in receiving government assistance (Anzia et al. Reference Anzia, Jares and Malhotra2022). The implication of this argument is that the attitudinal impact of personal experience with AI should depend on the nature of the interaction with the algorithm: positive experiences will increase support for using AI in public policy, whereas negative experiences will have the opposite effect. Indeed, research on human–computer interaction shows that users of algorithmic systems tend to update their level of trust in algorithmic advice based on their prior interactions with these systems (for example, Dietvorst et al. Reference Dietvorst, Simmons and Massey2015).
While theoretically intuitive, we know little about the way personal experience with AI influences preferences towards the broader question of the desirability of employing AI in public policy. It is far from obvious that citizens generalize from their own encounters with algorithms to the broader question of using them in policy implementation contexts. Indeed, studies have suggested that personal experiences often remain ‘morselized’ – disconnected from broader political contexts – unless explicitly linked through media coverage or elite discourse (Mutz Reference Mutz1994). This is particularly relevant at this early stage of public debate over AI governance, where questions related to the governance and regulation of AI are not yet politicized. Without partisan cues, even consequential encounters with ADM may have limited impact on attitudes towards AI in governance.
Returning to the example of the two individuals who have different initial opinions on the use of AI in public policy. How would a personal experience with ADM affect their views? Figure 2 illustrates possible paths of attitude change. The left panel suggests that the two individuals’ views remain unchanged – they view the encounter as irrelevant to the broader policy question. The middle panel indicates that their views change in a more positive direction irrespective of the encounter: simply by engaging with the technology, they develop more confidence and trust in its use in a policy setting. Finally, the right panel of the figure implies that the two individuals’ views change in accordance with the nature of the encounter. For example, if they apply for a job and an algorithm is responsible for determining their eligibility, being found suitable for the job (that is, having a positive experience) would increase their support for AI use in policy, while being rejected (that is, a negative experience) would decrease their level of support.
Experiencing ADM – trajectories of preferences.
Note: Three possible patterns of opinion change that could result from interacting directly with AI. The vertical axis indicates the probability of favoring AI in policy decisions.

Taken together, the literature is quite ambiguous about the likely attitudinal impact that personal experience with AI and information about the technology are likely to have on our question of interest. One can find arguments why these forces would have a significant impact or none at all. In what follows, we describe an experimental approach designed to provide empirical insight regarding the impact of these different potential sources of influence.
Experimental Design
We conduct an experiment in a labor-market setting, as this represents one of the main domains in which algorithmic decision making is deployed (for example, employee recruitment, task allocation, or quality assessment), making it a firsthand experience that a growing share of the population encounters. We therefore chose as our experimental setting Amazon’s Mechanical Turk (MTurk) platform – the world’s largest online labor market. MTurk provides employers with access to a large base of potential employees to perform a range of discrete on-demand tasks. Notably, prior research has validated MTurk as a useful and reliable setting for assessing key labor market outcomes (for example, Burbano Reference Burbano2016; McConnell et al. Reference McConnell, Margalit, Malhotra and Levendusky2018). Furthermore, evidence suggests that findings from MTurk are comparable to those from more traditional (offline) employment settings (Horton et al. Reference Horton, Rand and Zeckhauser2011).
We invited 2,375 American workers to perform paid tasks, and tracked their views on the use of AI in various policy domains using a three-wave panel survey, one of which was administered before the workers completed the task, and the other two waves were fielded after the task’s completion. To evaluate the impact of personal experience with ADM on support for AI in public policy, the main intervention varied the decision maker who hires and assigns workers to tasks: a computer algorithm or a member of the HR team. To assess the importance of a positive versus a negative experience with ADM, the second intervention varied whether workers were selected (by the decision maker) to their preferred task or not. Finally, to assess the impact of exposure to new information on the updating of attitudes, the third intervention varied the content of the tasks that the workers performed. Specifically, we varied whether the task entailed exposure to information about positive implications of AI, negative implications of AI, or to placebo information about the fashion industry.
Sequence of the Experiment
The sequence of the experiment is presented in Figure 3 and consists of three core steps. First, we administered a pre-treatment survey to record baseline attitudes towards AI in public policy and respondents’ task preferences. Participants then received a hiring decision assigning them either to a preferred high-status task or to a less-preferred low-status task, explicitly made by either an algorithm or a human. The actual task involved classifying expert comments, which varied randomly in content and valence (positive or negative predictions about AI or a placebo topic). Several days later, participants completed a follow-up survey administered by an ostensibly different requester, measuring post-treatment attitudes towards AI in public policy.
Experimental design.

Pre-treatment survey
In February 2023, we asked MTurk workers to complete a survey on social issues for a payment of $0.80. The survey included several pre-treatment outcomes that asked respondents how much they support or oppose using a predictive algorithm instead of a human to make determinations in various policy contexts. To minimize the possibility of demand effects, we added a host of unrelated items with the aim of blurring the focus of the study. We also collected information on pre-treatment covariates, such as age, race, ideology, education, technological literacy, and trust in institutions. For the survey questionnaire, see SI-3.
At the end of the survey, participants received an invitation to continue work with the same employer on an additional project involving one of two possible eight-minute tasks: (1) cataloging short texts according to their content for $1.00; or (2) rating comments by their tone for $3.00, a task that we described as ‘particularly suitable for people who are competent and good at seeing the bigger picture’. We intentionally designed the descriptions of the tasks and the proposed wages so as to provide both material and psychological incentives for participants to have a clear preference for the latter task over the former.Footnote 4 And since only some participants were assigned the more lucrative task, we were able to clearly distinguish between participants in terms of whether they had a positive or a negative experience with the employer’s decision regarding the allocation of work.Footnote 5
Figure 4 shows a screen capture of the invitation. We designed a distinct interface with the Analytics logo for both Waves 1 and 2. Our intention was to enhance the sense of an employer–worker setting and to help differentiate the first two waves from the third wave, which used a different user interface and requester. This was done to reduce the likelihood that participants will connect between the surveys and be strategic in the answers they provide.
Screen capture of the reply message: a negative experience with ADM.

Experience with ADM
Three days after the initial survey, participants received an invitation in their personal MTurk inbox containing a link to the task to which they were randomly assigned. Importantly, all participants received the exact same generic invitation, informing them that they would either be cataloging short texts or rating comments and that those who were found most suitable for the rating task would receive a bonus of $2 beyond the $1 base-rate. This means that only participants who clicked on the link to participate in the second wave actually received the treatment: information about their assigned task (either the desired rating task or the undesired cataloging task) and the decision maker who assigned them to the task (a computer algorithm or a member of the HR team). By tracking the clicks on the invitation link, we could monitor potentially non-random attrition; we elaborate on this point below.
After participants chose to proceed, they were told that not all workers are equally suitable for the higher-paid rating task, as it requires being good at ‘seeing the bigger picture’, and were then informed about their assignment and compensation. Workers randomly assigned to the negative experience treatment were told that the decision maker evaluated their performance in the previous task and deemed them less suitable for the rating task, and they would therefore receive only the $1 base payment.Footnote 6 In the positive experience condition, participants were informed that the decision maker evaluated their performance in the previous task and had found them suitable for the rating task, as they had requested.Footnote 7
However, and this is key, irrespective of the tasks’ label and unbeknownst to the participants, the eventual task they were assigned to carry out was exactly the same one. We wrote the description of the two tasks in a way that described well the actual work the participants were asked to perform in both cases. This, in turn, allows us to cleanly measure the impact of the decision maker and the type of experience (positive or negative) on workers’ performance on the (same) job.
To assess the effects of working under a human or an algorithm, the message to the workers explicitly mentioned the identity of the decision maker (DM). In the human DM treatment, respondents were informed in multiple instances that the task assignment was decided by a member of the team.Footnote 8 Additionally, we included in the pre-treatment survey questions regarding a Rorschach image, to provide additional material on which the DM’s evaluation of the participant’s suitability for a task that requires ‘big picture thinking’ could ostensibly be based.Footnote 9
To drive home the type of experience – positive versus negative – we asked participants to rate their satisfaction with the task to which they were assigned. This also served as a manipulation check, confirming that participants with the negative experience (that is, assigned to their less-preferred task) were indeed less satisfied with the decision, while those with positive experiences were more content.
Finally, participants had the opportunity to provide feedback on the decision made by either the human or the ADM, allowing the participants to express dissatisfaction with the decision, and 36 per cent of the participants opted to share their feelings. Unsurprisingly, most of them (76 per cent) had a negative experience and expressed disappointment or frustration at being denied the higher-paying option.Footnote 10
The workers’ comments reveal that they were aware of who assigned them to the task, reassuringly confirming that the decision-maker treatment was noticeable. For instance, 44 per cent of workers assigned to a task by an algorithm specifically mentioned the algorithm when making their appeal. They wrote, for example, ‘An algorithm doesn’t know me personally and can’t determine how I will perform’. Others wrote: ‘Algorithms have bugs sometimes. It’s not my fault’, and ‘I don’t believe the algorithm. I am very good at seeing the big picture’. Similarly, workers in the human condition explicitly mentioned the name of the team member who assigned them to the task: ‘How did Danielle reach that decision?’ ‘Danielle has no idea who I am or what I can do’. Similarly, ‘What did Daniel base his decision on?’ or ‘Daniel is clueless about me’.
The randomized assignment of the participants into treatments was used to generate groups that have similar characteristics on average. To further increase comparability across treatments, we used block randomization and grouped the sample according to their perceptions of suitability for performing the rating task based on their answers to the question in the pre-treatment survey. All these sampling decisions followed the pre-registered design.
Exposure to information about AI
Next, to assess the impact of new information on attitudes, we randomly manipulated the content of the tasks that participants performed. Specifically, they were asked to read eight expert comments and place them on a scale ranging from very negative to very positive. The treatment group received comments about the potential impact of AI, while the control group received comments about future fashion trends.
By integrating the information within the task itself, our aim was to increase participant engagement with the substance of the information. To further enhance this engagement, participants were also asked at the end of the task to indicate which comment was most persuasive and to explain in their own words why.
To examine whether people update their views in response to new information or instead rely on information that aligns with their prior dispositions, we also randomly manipulated the valence of the comments into either positive or negative tones. The comments were based on a Pew Research survey that asked over 900 experts in 2018 about AI and its consequences for human society (Anderson et al. Reference Anderson, Rainie and Luchsinger2018). A negative comment about AI, for example, noted: ‘AI may purposely exclude all references to race and ethnicity, but these systems still consider factors that correlate with race, such as low-income neighborhoods or employment history. As a result, their outputs can be racially discriminatory’. In contrast, treatment with a positive tone included comments such as ‘AI might lead to more consistent judgments than those made by humans, who may be influenced by emotional considerations or by fatigue’. See the SI for detailed instructions of the task, the wording of the comments, and a screen capture of the user interface.
Of the eight comments each participant was asked to rate, seven had a positive (or negative) tone, depending on the treatment assignment, while one additional comment had the opposite tone. The inclusion of this contrasting comment was done to allow us to assess participants’ engagement with the task by identifying potential errors in the classification of the comments.
In the final stage of the study, we conducted a follow-up survey that took place 4–7 days after carrying out the task (and 7–10 days after the original survey). To minimize potential Hawthorne effects, participants were invited by a different employer (requester) to complete a seemingly unrelated survey. This third wave did not include any details or information that indicated that the survey was connected to the cataloging/rating task that the workers had performed.
To summarize, the experiment consisted of three stages: (1) a pre-treatment survey measuring baseline views on AI governance and recording workers’ task preferences; (2) a paid task performed by all workers, embedding the experimental interventions: the identity of the decision maker, the description of the assigned task, and the content of the task; and (3) a post-treatment survey administered by a different requester measuring attitudes towards the use of AI in public policy.
Data and Measures
Sample
Among the participants who were invited to perform further tasks, 1,502 completed the post-treatment survey. We did not invite to the study any of the workers classified among the most active workers on MTurk (accounting for about a fifth of the daily tasks on the platform). Our concern was that this group may possess an overly familiar understanding of AI technology, potentially skewing the study’s conclusions. In addition, we stratified our sample based on two related criteria: (1) their experience on the platform, that is, the number of prior tasks (HITs) completed and approved by the requester, and (2) the level of recent activity on the platform.Footnote 11
Table SI-2 presents descriptive statistics on pre-treatment demographic and attitudinal variables, including all outcome variables used in subsequent analyses. As the table shows, the level of technological literacy varies substantially across the sample. Only 21 per cent of the participants had a high degree of technological literacy, as measured using a principle component of four questions asking about familiarity with technology-related items. Notably, because it was just released, only 15 per cent of participants were familiar with ChatGPT. Moreover, as we will show below, participants’ initial views about using AI in public policy decisions closely mirror those found in nationally representative surveys using similar questions, increasing our confidence that our findings capture broader patterns rather than sensitive peculiarities of online workers.
Attrition
Outcome variables
Our primary dependent variable, measured in Wave 3 of the survey, examines individuals’ attitudes towards reliance on ADM in the implementation of public policy. Specifically, we asked respondents to indicate their support or opposition to using predictive algorithms instead of human decision makers in a set of policy areas. The decisions covered a range of issues, including: determination regarding the location of police patrols; the granting of parole to defendants; allocation of food stamps; designating where to place street lighting; approval of immigrant visa applications; increasing enforcement of illegal construction; and locating the construction of homeless shelters. Decisions were chosen based on two relevant theoretical dimensions: the objective of the decision (assistance or sanctioning) and the population directly affected by the decision (individuals or collectives). In focusing on a set of policy domains, our aim was to ensure that the results are not sensitive to a specific decision context and that the attitudes we capture are generalizable across different types of decisions.
Using the questions about decisions in those different domains, we constructed an index based on a factor analysis score comprising eight items asked in Wave 3.Footnote 12 By utilizing multiple items, we minimize measurement error. This approach addresses the issue of single-item measures potentially exhibiting low correlations between survey waves, even when the underlying attitude remains stable (Ansolabehere et al. Reference Ansolabehere, Rodden and Snyder2008; Broockman et al. Reference Broockman, Kalla and Sekhon2017).Footnote 13
Results
Attitudes Toward AI Public in Policy
We begin by analyzing baseline preferences for using AI in public policy decision making. Figure 5 presents the preference distribution for each policy decision. The results indicate that people are generally opposed to relying on AI algorithms in making decisions. Consistent with prior research, we find that workers are particularly apprehensive about such use of the technology in decisions that involve sanctioning. In cases where AI is used to assist, and particularly when required to make inferences regarding collectives (and not individuals), the public appears more open to the use of the technology, albeit still with a small proportion expressing strong support.
Attitudes towards AI in public policy, pre-treatment. We measured the responses on a seven-point scale and then classified them into five categories: strongly oppose (1), oppose (2–3), indifferent (4), support (5–6), and strongly support (7). The distribution calculation takes into account the indifferent category. Figure SI-1 shows the full distribution.

Effects of Experience on Attitudes
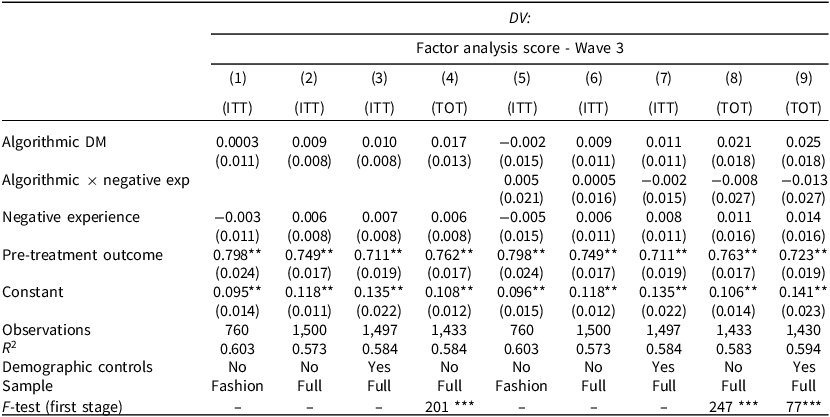
We begin with the causal effect of personal experience on attitudes and estimate the average treatment effect of exposure to ADM on attitudes, as measured by the post-treatment survey conducted several days after the assignment. Table 1 presents the results of linear regression models, all of which control for the pre-treatment outcome. To increase precision, some of the models also include a set of pre-registered covariates (demographic and attitudinal), as measured in the pre-treatment survey.
Effects of experience on attitudes

Note: linear regression models with standard errors in parentheses. The DV is the factor analysis score of eight items in Wave 3. The independent variables are indicators for the treatments: ADM, negative experience, and their interaction (in columns 5–8). Columns 1–3 and 5–7 show ITT estimates. Columns 4 and 8–9 show TOT estimates, using treatment assignment as an instrument for compliance: those who indicated in the manipulation checks that: (1) they completed the high-status task; and (2) the decision maker who assigned them to the task was the requester’s algorithm. Columns 1 and 5 limit the sample to placebo information, while others control for information treatments. All models control for the pre-treatment outcome. Pre-treatment covariates include gender, age, race, education, ideology, trust in technology, MTurk HIT record, attentiveness, self-reported suitability for the cataloging task, and indifference between tasks. Table SI-5 reports the full results. *p < 0.05; **p < 0.01.
In columns 1–3, we estimate the attitudinal impact of the employer’s identity while controlling for the nature of the interaction with the employer, that is, whether positive or negative. As pre-registered, and to ensure a clean comparison between treatment groups, column 1 includes in the sample only workers who received the placebo information, meaning that they were not exposed in the task to information about the merits or demerits of AI technology. To enhance statistical power, columns 2–3 report results for the full sample, controlling for respondents’ informational treatment.
The table clearly shows that personal exposure to ADM did not affect workers’ attitudes towards the use of AI in public policy. Across all specifications, the coefficient of ADM is consistently very small and below statistical significance, ranging from 0.001 (t = 0.065) to 0.010 (t = 1.351).
In light of these findings, a possible conjecture could be that changing attitudes is not a function of exposure to algorithms per se, but rather of the nature of exposure (that is, positive or negative). We test this conjecture by adding to the models estimated in columns 5–7 an interaction term between the decision-maker treatment and the type of experience (positive or negative). The interactions yield a null effect among participants who had a negative experience with algorithms, namely where the algorithmic employer deemed them unfit to perform the high-status task.
Controlling for demographic characteristics, such as age, gender, education, and race, and other pre-treatment covariates, such as technological literacy and trust, does not alter these results. Furthermore, the null result holds when we examine the post-treatment outcomes collected in Wave 2, right after completing the task. In sum, then, neither a positive nor a negative experience with the ADM altered subjects’ attitudes, not even in the immediate term (see SI-C.1 for additional results).
One might question whether these null results reflect the impact of real-life experiences with AI systems or whether, instead, the experimental treatment was not sufficiently strong and hence not noticed by the participants. To address this concern, we measure compliance with the treatments using two manipulation checks asked at the end of the post-treatment survey. The manipulation checks successfully distinguish between workers by their assigned decision maker (DM), as over 73 per cent of the workers in the algorithmic DM condition reported that it was the specific algorithm used by the requester that assigned them to the task, compared to only 10 per cent in the human DM condition (p < 0.001), and 79 per cent of the workers assigned to the human DM condition correctly identified the team member as the decision maker, compared to only 5 per cent in the algorithmic DM condition (p < 0.001).
One possibility is that this group of participants who complied with the treatment and correctly identified the decision maker was a self-selected group (for example, more attentive to the study or with less experience performing MTurk tasks). These characteristics may also have influenced their answers to the outcome questions. Hence, we cannot simply compare the treatment groups as they were randomly assigned. To address this issue, we estimate treatment-on-the-treated (TOT) effects with an instrumental variable (IV) regression, using the random assignment as an instrument for compliance. The results of the second stage and F statistics from the first stage are reported in columns 4 and 7–8.
Again, the results indicate that workers who interacted with an AI algorithm as their employer did not significantly differ from other workers in their support for employing AI in public policy. The estimated effect on the treated is, as expected, larger compared to the effect on all participants assigned to the treatment, but it is well below statistical significance.
Yet, before accepting this interpretation, one must question whether the treatment, even if it was noticed by the participants, was simply too weak or inconsequential to have any meaningful impact. We assess this possibility by examining the effect of the treatment on various behavioral outcomes that are perhaps less prone to change than attitudes, such as level of performance and work commitment. If those behavioral outcomes had changed, this would indicate that the treatment was in fact effective, but not in changing subjects’ views on the desired role of AI in policy implementation decisions.
We focus on several indicators that measure performance and effort: accuracy in classifying comments with the opposite tone; time spent on the main task and the follow-up task; and thoroughness in carrying out the task, measured by the number of clicks. In addition, we asked workers to suggest a wage for completing an additional task of similar scope and length. If a worker suggests a wage lower than the amount received for the current task, we use this as an indication of high willingness to continue working with the employer. Finally, we measure job satisfaction using an item that asks workers to rate their satisfaction with their task assignment. See SI-C3 for a detailed description of the measures.
We re-estimate the main analysis but use these behavioral measures instead of attitudinal outcomes. Results are reported in Table SI-7. Figure 6 shows the predicted values using this regression model.Footnote 14
Effects of experience on behaviors. The figure shows the predicted score of each behavioral outcome based on intention-to-treat (ITT) analyses that regress them on a binary indicator for ADM, an indicator for the type of experience with the decision maker, and their interaction. Models also control for informational treatments. The thin (90 per cent) and thick (95 per cent) error bars represent the confidence interval around the estimate, respectively. The estimate and SE are reported as well. The full results are reported in Table SI-7.

Our analysis reveals that workers’ personal experiences with ADM in the workplace had a significant impact on a range of behavioral outcomes. For instance, workers who were assigned the task by an algorithm rather than a human were less satisfied with their assignment (p < 0.001), put less effort into performing the task (p < 0.05), and were significantly less likely to correctly classify the comments (p < 0.1).Footnote 15
Taken together, the results indicate that the null effects of personal experience with ADM on attitudes are not due to a weakness of the treatment. Rather, the treatment assignment appears to have been strong enough to affect behavior but not attitudes on our policy question of interest.
What do these results imply for the potential trajectory of preferences towards AI? One possibility is that preferences for using AI in public policy are based on strong pre-dispositions about technology in general, in which case people are unlikely to change their views. Alternatively, it could be that attitudes are less sensitive to personal experiences with the technology because individuals do not link these types of daily interactions with AI and the broader question of the appropriate use of this technology in public policy decisions. In the next section, we further explore this question by focusing on the attitudinal impact of exposure to information about AI.
Effects of Information on Attitudes
Next, we examine to what extent people update their views about the use of AI in public policy decisions in response to learning more about the technology. Our experimental design allows us to explore this question by randomly exposing workers to different types of relevant information.
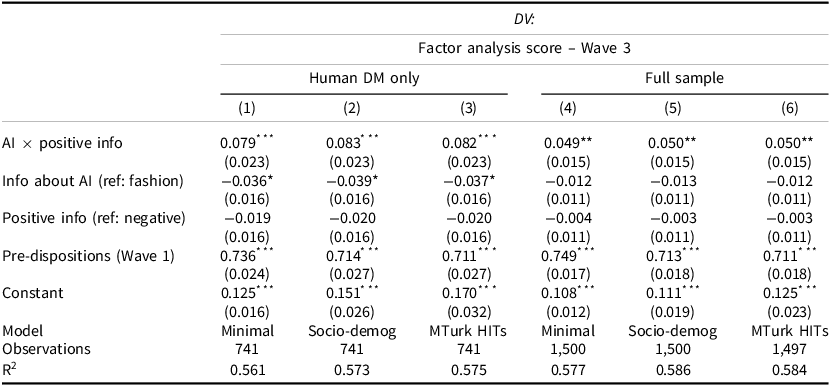
In Table 2, we report results of estimating the effects of exposure to the different types of information (AI versus fashion, positive versus negative) as measured several days after encountering it. As pre-registered, columns 1–3 show the results on a subset of the sample, which includes only participants who were assigned to the human decision maker.Footnote 16 Columns 4–6 include the full sample, controlling for the decision maker.
Effects of information on attitudes

Note: the DV is the factor analysis score of eight items asked in Wave 3. The independent variables are indicators for the treatments: information on AI (fashion as reference), positive tone (negative tone as reference), and their interaction. The models are estimated for the human decision-maker condition (columns 1–3) and the full sample (columns 4–6). Models control for the decision-maker treatment (human as reference) and for experience (positive experience as reference). Pre-treatment covariates include gender, age, race, education, ideology, trust in technology, MTurk HIT record, attentiveness, self-reported suitability for the cataloging task, and indifference between tasks. Standard errors are in parentheses. See Table SI-8 for the full results † p > 0.1 *p < 0.05; **p < 0.01; ***p < 0.001.
The results show that exposure to positive information about the implications of AI has a significant effect on workers’ attitudes towards the use of this technology (p < 0.01). Specifically, when asked about their views in an unrelated survey several days after exposure to the information, workers who were randomly exposed to positive information about AI, as opposed to information about fashion, moved 0.043 to 0.045 points along the standardized scale towards supporting the use of the technology in public policy decision making.
To put this effect size in context, Figure 7 plots the estimated effect of the information treatments, adjusting for key socio-demographic factors identified in the literature as determinants of attitudes towards AI.Footnote 17 Notably, the figure shows that the treatment effect of negative information on AI, for example, is larger than the differences observed between workers with higher and lower levels of education. The full results are reported in Table SI-9.
Effects of exposure to information treatments. The figure shows the results of OLS regressions. The IV are indicators for positive information on AI, negative information on AI, or placebo information about fashion. The left panel shows the estimated treatment effects relative to the effects associated with key covariates, excluding the pre-treatment outcome. The right panel shows the treatment effects estimated separately for each policy domain. Models include controls for pre-treatment covariates and pre-treatment outcomes, as well as indicators for the experience and valence of information. We limited the sample to workers who were assigned to the human treatments to ensure that the comparison was clean. See Table SI-9 for the results. Thin bars represent 95 per cent CI, and thick bars represent 90 per cent CI.

One concern might be that the valence of the informational content itself, regardless of the topic of AI, is affecting workers’ attitudes. For instance, by making people feel more optimistic towards the future and thus more open to supporting innovations in public policy. Our experimental design allows us to test this possibility by dividing the placebo condition into positive and negative predictions about fashion trends. The results show that the coefficients for the tone of the information are not significant at any level. In contrast, the interaction term between positive information and AI is consistently positive and statistically significant at the 1 per cent level across all models. This indicates that participants who were exposed to positive information, specifically about the consequences of AI, grew more supportive of using algorithms for decision making in public policy.
Table SI-8 presents the results of the effect of exposure to information about AI on support for unrelated policy proposals, such as using background checks for gun purchases and deploying minimal quotas for women on company boards. As the table makes clear, no effect whatsoever was registered. Taken together, we can conclude that the shift to more supportive views is not the result of exposure to positive comments and frames in general but rather is directly tied to pertinent information about AI leading people to update their views on relevant policy questions. This may partly be due to the limited role partisanship plays in the current debate over the regulation of AI. As our pre-treatment survey shows, there is no significant difference in attitudes towards AI policy between Democrat and Republican workers.
To address selective attrition, we also conducted a bounding exercise. We assigned workers who did not complete the post-treatment survey either their pre-treatment outcome from Wave 1 (lower bound) or their FA scores from responses given right after exposure to the treatment (upper bound). These measures thus assume either no change or complete change in attitudes, respectively. Table SI-10 shows that our main findings are robust to these different assumptions. This finding reinforces our conclusion that dropout between Waves 2 and 3 does not pose a serious threat to estimating the treatment effects.
Next, we examine in which policy areas participants were more responsive to new information. The right panel of Figure 7 displays the marginal effects estimated separately for each policy decision. The results indicate that the pattern is not driven by one specific policy domain or context, yet attitudes did shift more in some areas than others. Specifically, individuals were more receptive to revising their policy views following exposure to new information related to decisions about the allocation of resources, such as foodstamps (p < 0.01); homeless shelters (p < 0.05); or increased personnel for enforcement of illegal construction (p < 0.01). By dichotomizing the individual items, Table SI-9 shows that in these policy domains, the information led to a substantial change. For example, participants who encountered comments about the potential benefits of AI were 12 percentage points more likely to support the use of AI for deciding where to increase enforcement (p < 0.01), while those who learned about AI’s potential risks were 8 percentage points less likely to support the use of the technology for making these decisions, compared to respondents who had received no information about AI (p < 0.05).Footnote 18
Conversely, this information had little effect on attitudes towards the use of AI in policies related to punishment, especially of individuals, such as granting parole or issuing restraining orders. Notably, in these domains, AI received the lowest levels of support in the pre-treatment survey. Indeed, previous research suggests that citizens are highly sensitive to human involvement in decisions that can have irreversible consequences on individuals’ lives (Raviv Reference Raviv2025). Our analysis indicates that in such domains, people are less likely to change their stance in response to new information.
Pre-dispositions and Information Processing
Our findings indicate that exposure to information about AI affects support for the use of the technology in policy areas where the public does not have a clear preference for a particular decision maker. This raises the question of whether the information only reinforces the opinions of those who already agree with it or if it persuades those with opposing viewpoints.
To address this question, we divide our sample based on workers’ pre-dispositions, measured relative to the median score of the pre-treatment outcome. We then estimate the impact of information about AI for each group of workers separately, as well as the interaction between treatments and the pre-disposition. Table SI-11 reports the results. Recall that we included in the treatment a comment that was intentionally in the opposite direction of the prevailing tone of the other comments, so that participants would have the option of ‘picking and choosing’ evidence that is consistent with their pre-disposition.
We find that exposure to positive information about AI significantly increased support for its use in public policy implementation among both groups of workers, irrespective of their pre-dispositions. The interaction between positive information on AI and negative pre-disposition is not statistically significant.
Figure 8 graphically illustrates the results, showing the predicted outcome by treatments and pre-dispositions. Contrary to what motivated reasoning theory would suggest, the figure shows that workers who were initially skeptical of AI actually updated their views in response to reading information about the potential upsides of the technology and grew more favorable of its use for policy implementation decisions. In contrast, exposure to the potential downsides or risks of AI appears to have had little impact on the views of participants with a prior skeptical stance.
Treatment effects by pre-dispositions. The figure shows the predicted FA score of responses to the eight items in Wave 3, based on the interaction between the information treatment and pre-dispositions. Error bars show 95 per cent confidence interval. The model controls for decision maker and experience treatments, the pre-treatment outcome (as a continuous measure), and demographic covariates. Column 5 in Table SI-11 shows the full results. Data points correspond to individual raw observations.

We find evidence of similar directional updating among workers who were favorably disposed to AI: they grew less so when exposed to information about negative aspects of the technology. Interestingly, there is an asymmetry: positive information about AI appears to have had a stronger attitudinal impact than information about the negative aspects of the technology.
We test for ceiling and floor effects by excluding the respondents identified in the baseline survey as either most opposed or most supportive of AI use in policy decisions (that is, those in the upper and lowest deciles of the scale). We also re-ran the analysis while excluding respondents around the midpoint of the scale, as one might worry that they are simply indifferent. The findings remain consistent under these exclusions. Overall, then, our analysis indicates that rather than rejecting or ignoring information that challenges their prior views, participants updated their views in the direction of the information they received. This finding is consistent with research showing that people from different groups respond to persuasive information in the same direction (Coppock Reference Coppock2023). One possible explanation for this finding is that attitudes towards AI in public policy are not deeply held, at least at this stage when the issue is not yet politicized, and thus are more likely to change when they encounter relevant information. We return to this issue in the concluding section below.
What Type of Information About AI Affects Attitudes?
To better understand the effect of information, we analyze which specific comments participants found most persuasive. This analysis is based on their responses, after they had completed the task, to a question asking what comment they found most convincing and why. We then constructed a dictionary for each comment, listing its key phrases and words, and use the responses to the open-ended questions to identify the comments each treatment group found most persuasive.
Figure 9 presents the results. Among workers exposed to positive information, the most persuasive comments were those that emphasized AI’s high degree of accuracy (26 per cent) and its potential to enhance workplace safety (21 per cent). Notably, these comments were considered far more persuasive than those highlighting the limitations of human decision makers. For instance, only 7 per cent of the workers cited the comment, ‘AI might lead to more consistent judgments than those made by humans, who may be influenced by emotional considerations or by fatigue’. Similarly, only 6 per cent mentioned the comment emphasizing AI’s reliability as compared to humans who can be influenced ‘by irrelevant factors, such as their mood’. Among workers who received negative information, the figure shows that comments that addressed concerns about racial discrimination and unfairness (25.5 per cent) or potential issues with utilizing aggregate data for individual decision making (23 per cent) were more frequently mentioned.
Most persuasive comments among workers exposed to information about AI. The figure shows the percentage of individuals in the positive and negative treatment groups (left and right panels, respectively) who cited each comment as the most persuasive. The comments were identified based on key phrases extracted from participants’ open-ended responses.

The findings suggest that workers’ attitudes towards AI are responsive to specific pieces of information about its potential implications, but it is not the case that they changed their views in response to any positive assessment of the technology’s merits.
In sum, the results show that participants did update their views on the use of ADM in policy implementation in response to the information they received about AI technology. Moreover, they were responsive to specific pieces of information about its potential implications. However, one should not lose sight of the fact that the shifts in participants’ views were limited and mostly concentrated in certain policy domains; in others, exposure to information had no impact. This suggests that while people are open to considering new information and to updating their stance, it is not the case that their attitudes on this topic are easily swayed and manipulable.
Discussion
The growing use of AI-based algorithms in policy implementation is changing a fundamental component of democratic governance, namely the way important decisions that affect citizens’ lives are made. It is therefore of great import that the development and deployment of such AI-based systems will properly reflect the values and sensitivities of the public. Recognizing this need, both governments and leading tech companies are advancing initiatives aimed at fostering public input in setting the norms and rules for the governance of AI. Yet such initiatives raise weighty questions about the determinants of the public’s views on the use of ADM, as well as about people’s ability to develop informed positions about reliance on this evolving technology in key implementation decisions. This study provides the first systematic examination of these questions.
Our analysis indicates that people not only update their views on the use of AI in policy settings when presented with relevant new information, but do so even when the information does not conform with their prior views or inclinations. This type of openness to influence is far from obvious and may partly reflect the fact that the debate over AI regulation is not yet politicized. Indeed, as our baseline survey reveals, there is no significant difference in the attitudes of Republicans and Democrats on this issue, and a recent survey of policy makers also finds very little partisan differences on issues related to the regulation of AI (Mitts and Raviv Reference Mitts and Raviv2025). These findings point to an opportunity – perhaps only a temporary one – to create a broad coalition that spans across the political spectrum and promotes AI governance that is centered on safeguarding the public interest rather than the interests of partisan special interest groups.
Related to the point above, the findings also highlight the importance of adequately educating the public early on about AI’s potential benefits and risks, since the period of openness to information and to meaningful updating of views may be fleeting. Instead, people’s attitudes might soon be shaped by partisanship, as happened with other policy issues that require expert knowledge but that underwent profound politicization (for example, climate change, vaccinations). The debate over AI regulation may soon undergo a similar dynamic.
Specifically, it is easy to imagine that businesses and large corporations are likely to have a strong interest in emphasizing AI’s benefits and lobbying for weaker regulation, while civil society groups might put greater emphasis on the technology’s potential harmful implications (for example, on privacy, social justice) and push for deeper government involvement. The extent to which such messages will shape public opinion on the use of AI is an empirical question with major potential implications.
In contrast to the finding regarding the impact of exposure to information, our study shows that personal experience with AI decision making had little impact on participants’ views about reliance on AI in guiding policy implementation. This is not necessarily a bad thing, as one might worry about public input shaping AI regulation if this input was easily swayed by any tangentially relevant personal experiences. How one thinks about the connection between personal experience and policy views is thus dependent on the reason underlying our null result. One possibility is that people simply struggle to connect their personal experience with AI and the broader questions about the use of AI in guiding policy decisions. Our findings highlight one promising direction: investing in educating citizens on how to use their personal experiences to learn about AI’s capabilities, limitations, and risks.
Another possibility is that people do make the connection but think about the policy question in the context of the societal impact of AI. Put differently, they go beyond their own experiences when forming their views about reliance on ADM in various policy domains. Indeed, this possibility is consistent with evidence of individuals’ negative reactions towards algorithmic systems that risk public values such as fairness and transparency, even if they themselves are not likely to be directly affected by these decisions (Schiff et al Reference Schiff, Schiff and Pierson2022).
A third possibility is that the link between personal experience and policy attitudes is more task- or application-specific. For example, a negative experience with an AI system evaluating one’s suitability for a job might shape attitudes towards the use by government of similar systems in making personnel or hiring decisions, but have little bearing on views about using AI systems in determining other types of decisions (for example, about allocation of funds to schools or prioritization of areas for enhanced policing).
One way to explore this explanation is to investigate how experience with AI-based decisions in more proximate public policy settings, such as being approved (or denied) a visa, a permit or a social benefit, influences preferences for replacing human decision makers with AI in making policy implementation decisions. Such a study would speak to the generalizability of our findings regarding the disconnect between participants’ personal experience and their views on the broader policy questions.
Another promising direction for research would be to examine how exposure to AI algorithms in the labor market influences public opinion on other policy issues that are more directly related to this experience. For example, towards policy interventions aimed at mitigating some of the negative effects of automation in the labor market (for example, government assistance and re-skilling programs). Specifically, experience with AI-as-boss could give workers a more concrete sense of what automation means for non-routine occupations. This in turn could affect their perceptions of the risks that automation poses, as well as shape their preferences regarding policy interventions designed to deal with these potential risks.
Finally, the study’s findings give rise to substantial normative questions: How should people’s opposition to ADM in certain policy domains – for example, policing, schooling – be treated if evidence shows that the algorithms produce superior outcomes (for example, lower crime or better exam performance)? Should public input still be welcomed even if it reflects lack of expertise or high levels of ignorance? While answering these questions is beyond the scope of our study, our findings can inform the debates over these evolving and increasingly important quandaries.
Supplementary material
The supplementary material for this article can be found at https://doi.org/10.1017/S0007123425101282.
Data availability statement
Replication data for this article can be found in Harvard Dataverse at: https://doi.org/10.7910/DVN/E54HQW.
Acknowledgments
We thank Alexander Kuo, Ro’ee Levi, Neil Malhotra, and Moshe Shayo for helpful comments on the experimental design. We are also grateful to seminar and conference participants at Oxford University, UPenn’s Comparative Politics and PDRI DevLab Seminar, Hamburg University, Copenhagen University, CSDP at Princeton University, MBZAI of Abu Dhabi, King’s College London, Microsoft Research New York, ISPS at Yale University, the Political Methodology Colloquium at Columbia University, the Rebecca B. Morton Conference on Experimental Political Science at NYU, the Workshop on the Political Consequences of Technological Change at the University of Zurich, The AI and Society workshop at the University of Missouri, the Annual Meetings of EPSA and APSA, and The Political and Economic Implications of AI Conference at Caltech.
Financial support
This work was supported by the Edmond and Lily Safra Center for Ethics. Yotam Margalit is also grateful for support from the ISF (grant 1888/22).
Competing interests
None to disclose.
Ethical standards
The study was approved by an Institutional Review Board prior to data collection (#0004893-1). All participants provided informed consent, participation was voluntary, and responses were recorded without identifying information. After completion, participants received a debriefing explaining the experimental procedures. The research adhered to the APSA Principles and Guidance for Human Subjects Research.


 Open access