


1. Introduction
Pollination uses either biotic factors (such as insects, birds, or bats) or abiotic factors (primarily wind or water) to move pollen from the male structures (anthers) of flowers to the female structure (stigma) of the same plant species. Biotic pollination is an example of an ecosystem service, a benefit provided to people by ecosystems, generally free of charge (Brown, Bergstrom, and Loomis, Reference Brown, Bergstrom and Loomis2007; Millennium Ecosystem Assessment, 2005). Biotic pollination is also a factor of production—for example, bee colonies can be purchased or rented in exchange of their pollination services. In the face of both managed and wild pollinator decline, farmers, policy makers, researchers, and the public at large need to be aware of the importance of biotic pollination to agriculture and of the potential economic losses of its decline. In this paper, we present estimates of the contribution of pollinators to the agricultural industry in the state of Georgia.
Globally, biotic pollination contributes to 87 major food crops that account for over 35% of the world food supply. These crops provide vital nutrients as well as diversity to the human diet (van der Sluijs and Vaage, Reference van der Sluijs and Vaage2016). Animal pollinators can also improve the quality and commercial value of crops and encourage genetic diversity among plant species (Klatt et al., Reference Klatt, Holzschuh, Westphal, Clough, Smit, Pawelzik and Tscharntke2014). Nearly three quarters of crops benefit in some way from biotic pollination while the remaining 25% are pollinated effectively through abiotic factors such as wind or water, they are self-pollinated, or do not require pollination. While the majority of crops do benefit from animal pollinators, most use a combination of pollination services from both abiotic and biotic factors, and only 10% rely fully on biotic pollinators to produce fruits and seeds (Aizen et al., Reference Aizen, Garibaldi, Cunningham and Klein2009).
Georgia’s agricultural sector is a key component to its economy, contributing US$73.7 billion in output to its US$1 trillion economy and more than 392,400 jobs in 2017 alone (Kane, Reference Kane2019). The total farm gate value (TFGV) in the state, or the market value of all food and fiber production when it leaves the farm (net of marketing costs), grew from US$13.04 billion in 2009 to US$13.75 billion in 2017 (in 2017 US$). Within the state’s food and fiber production, there are 22 crops used directly for human consumption that are reliant on biotic pollinators. In 2009, these crops accounted for 18% of Georgia’s total agricultural value and this figure grew to 21% in 2017 (Boatright and McKissick, Reference Boatright and McKissick2010a; Wolfe and Stubbs, Reference Wolfe and Stubbs2018).
In the Southeast, honey bees (Apis mellifera), bumble bees (Bombus spp.), southeastern blueberry bees (Habropoda labrosia), Mason bees (Osmia spp), and squash bees (Peponapis pruinosa, Xenoglossa spp.) are among the largest contributors to biotic pollination (Delaplane, Thomas, and McLaurin, Reference Delaplane, Thomas and McLaurin2010). Bees are efficient pollinators as they can visit multiple flowers on one trip, they are able to collect pollen grains easily due to their body hair, and pollen and nectar serve as their only food source. The social species of bees, which include honey bees and bumble bees, are often easier to manage and are the primary pollinators of many fruits grown in Georgia (Delaplane, Thomas, and McLaurin, Reference Delaplane, Thomas and McLaurin2010).
The bumble bee and honey bee species have been the two most researched in recent years as there has been a documented decline in their populations. In 2006, a historically large decrease in honey bee populations was reported in North America with some beekeepers reporting the loss of 90% of their colonies. The symptoms of these losses were called colony collapse disorder (CCD) by the apicultural community. Between 2007 and 2014, winter colony loss rates in the U.S. averaged 30%, double the average rates prior to CCD (Rucker, Thurman, and Burgett, Reference Rucker, Thurman and Burgett2019).
The current consensus regarding the cause of CCD is that it is multifactorial and cannot be explained by one single cause (Rucker, Thurman, and Burgett, Reference Rucker, Thurman and Burgett2019). While the losses caused specifically by CCD have decreased since 2010, the beekeeping industry has continued to report high loss percentages each year due to pathogens, parasites, pests, exposure to pesticides, and poor nutrition. Loss rates fell to 24% from 2015 to 2017 (Rucker, Thurman, and Burgett, Reference Rucker, Thurman and Burgett2019; U.S. Department of Agriculture [USDA], 2019), but preliminary results by the University of Maryland found that managed honey bee colonies faced a 40% decline from 2018 to 2019, with winter losses being the highest since 2006 (Bruckner et al., Reference Bruckner, Steinhauer, Rennich, Aurell, Caron, Ellis and Fauvel2019). The state of Georgia began tracking pollinator counts in 2019 with the Great Georgia Pollinator Census (Griffin, Reference Griffin2019), but it is too early to determine any temporal trends in the data.
CCD reduces the ability of ecosystems to provide the ecosystem service of biotic pollination. This loss in biotic pollination is of particular environmental and economic concern in the agricultural sector because of the increasing pollinator-dependent crop production and thus increasing demand for biotic pollination ecosystem services (Ellis, Evans, and Pettis, Reference Ellis, Evans and Pettis2010; Thomson, Reference Thomson2016). For example, in California, the estimated annual cost increase for almond production due to CCD was estimated at US$83 million, and this is just a portion of the economic impact of CCD, given that several other crops use pollination services as well (Carman, Reference Carman2011). CCD, however, is not the sole contributor to honey bee decline and honey bees are not the only pollinator to U.S. crops. When provided with sufficient nesting and foraging habitat, wild bees are capable of efficiently meeting the full pollination demand for several native crops (Spivak et al., Reference Spivak, Mader, Vaughan and Euliss2011). While CCD has received a great deal of attention from the agricultural sector, the stability of other pollinators must be considered as well when evaluating the ability of pollinators to meet the agricultural sector’s pollination demand in the future. Along with managed bees, wild bee populations have faced similar declines and health risks, with some species going extinct in recent years (Cameron et al., Reference Cameron, Lozier, Strange, Koch, Cordes, Solter and Griswold2011). For wild species, it is particularly important to consider habitat conservation (Forbes and Northfield, Reference Forbes and Northfield2017; Hoshide et al., Reference Hoshide, Drummond, Stevens, Venturini, Hanes and Sylvia2018).
Porto et al. (Reference Porto, de Almeida and Cruz-Neto2020) offer a comprehensive review of economic values of animal-mediated pollination ecosystem services. They document an increasing trend in these values (which globally range from US$ 195 billion to US$ 287 billion annually in 2020), with much regional variation. In this paper, we estimate the value of biotic pollination to agricultural production in the state of Georgia. In addition to the importance of its agricultural sector, Georgia presents an interesting case study as it is one of the states in the U.S. with the highest rates of land cover change, driven by high rates of urban growth and forest loss (Nowak and Greenfield, Reference Nowak and Greenfield2018; Georgia Forestry Commission, 2019; Warnell et al., Reference Warnell, Russell, Rhodes, Bagstad, Olander and Nowak2020).
We first identify the crops dependent on biotic pollination and the production value of those crops. We then update and expand the economic values reported in Barfield et al. (Reference Barfield, Bergstrom, Ferreira, Covich and Delaplane2015) by applying a similar bioeconomic approach to estimate the economic value of pollination and pollination’s contribution to TFGV for the state of Georgia and each of its counties from 2009 to 2017. Using the county year as the unit of analysis, we are able to apply Geographic Information System mapping to conduct a spatial–temporal analysis, which reveals patterns of economic value both across the state geographically and over time. In addition, we calculate and track the evolution of two indicators of the degree of dependency of the agricultural sector on pollination services. Finally, we use new pollinator density data sorted at the county level to analyze the relationship between pollinator locations and where they have the highest economic contribution to agriculture.
2. Data
Our primary data sources are the annual Georgia Farm Gate Value Reports from 2009 to 2017 (Boatright and McKissick, Reference Boatright and McKissick2010a , Reference Boatright and McKissick2010b, and Reference Boatright and McKissick2010c; Wolfe and Shepherd, Reference Wolfe and Shepherd2011, Reference Wolfe and Shepherd2012; Wolfe and Stubbs Reference Wolfe and Stubbs2013, Reference Wolfe and Stubbs2014, Reference Wolfe and Stubbs2015, Reference Wolfe and Stubbs2016, Reference Wolfe and Stubbs2017, Reference Wolfe and Stubbs2018). The Georgia Farm Gate Value Report provides annual production information collected by University of Georgia Cooperative Extension personnel. County extension agents use a survey tool that is pre-populated with the crops grown in each county, the acreage for those crops, and state extension specialist-suggested prices. These suggested prices can be adjusted by the agent based on the conditions of the specific county. The published reports, however, display information on the average yearly crop values only, that is, prices and quantities for the crops are not recorded separately. The reports are supplemented by information gathered through direct communication with their authors, who provided county-level values for crops that may have been aggregated in the original report. We examine 51 row and forage, fruit and vegetable crops for all the 159 counties, and for the state of Georgia overall. The resulting data set is much more extensive than the data available from the USDA, which covers about 34 commodities (Dowdy and Wolfe, Reference Dowdy and Wolfe2019).
We also used pollinator density data from the Great Georgia Pollinator Census. In an effort to assess the status of pollinators and advance pollinator counts throughout Georgia, the University of Georgia (UGA) Extension’s Center for Urban Agriculture hosted the first ever statewide pollinator census on the August 23 and 24, 2019. Georgia citizens were asked to count pollinators on a specific plant that was blooming. The number and type of insects that landed on that plant in a 15-minute period were then recorded and these counts were uploaded to a universal database. The data are in the form of insects per individual count, and include observations on honey bees, bumble bees, carpenter bees, and several other pollinating insects. The survey generated data in 85% of Georgia counties with an average of 35 counts per county (Griffin, Reference Griffin2019). As information was collected at the county level, we are able to map the pollinator counts alongside our calculated economic values to analyze the relationship between pollinators’ densities and the economic value of the ecosystem services they provide.
3. Methods: Applying the Bioeconomic Approach to Georgia
Pollination can directly affect the quantity and quality of crops and the production of seeds for future generations, or it may indirectly affect commodities that, like cattle, rely on a crop that is directly pollinated by biotic pollinators (National Research Council, 2007). Currently, economic markets fail to capture all the benefits derived from pollination (Potts et al., Reference Potts, Imperatriz-Fonseca, Ngo, Aizen, Biesmeijer and Breeze2016). This failure is primarily due to the fact that economic markets and prices do not exist for the pollination ecosystem services provided by wild pollinators. Because wild pollinator ecosystem services are unpriced by the market, we must turn to an approach other than direct market price valuation to estimate the economic value of pollination (EVP) ecosystem services.
In some cases, such as almond orchards and production in California, economic markets exist for managed pollinators that can be directly purchased or rented. The economic value of managed pollinators can be determined by changes in supply and demand of these colonies based on colony rental data. However, using rental fees as a replacement cost for the ecosystem service provided by biotic pollinators has a number of shortcomings. First, the value of honey production is not separated from the rental fees. Second, the method implicitly assumes that there is adequate time to invest in native pollinator replacement via managed honey beehives. Third, it may underestimate the value of native pollination if the alternative (i.e., managed honey bees) is not an adequate substitute for native bees. Fourth, while honey bee rental market and fee data are robust in the western U.S., only limited surveys are available for the eastern U.S. (Park et al., Reference Park, Raguso, Losey and Danforth2016) and data for Georgia are unavailable altogether.
Thus, in this paper, we apply a bioeconomic modeling approach, as in Barfield et al. (Reference Barfield, Bergstrom, Ferreira, Covich and Delaplane2015). Specifically, we employ the production function approach in Hein (Reference Hein2009) because our focus is on estimating the contribution of pollinators to Georgia’s agriculture and pollination is an input to agricultural production.
Denote by y the amount produced of the agricultural output, which depends on both biotic pollination, e, and other production factors (land, labor, capital, etc.). Output sells for a market price p, that we assume farmers take as given—which, according to economic theory, is the case in a reasonably competitive market. Accordingly, the change in social welfare (W) from the competitive equilibrium production
 $$\left( {{y^*}} \right),$$
resulting from a marginal change in supply of pollination services (e), holding other inputs constant, is given by
$$\left( {{y^*}} \right),$$
resulting from a marginal change in supply of pollination services (e), holding other inputs constant, is given by
 $${{\partial W} \over {\partial e}} = p\left( {{y^*}} \right)\; \times \;{{\partial y} \over {\partial e}},$$
The assumption of constant prices has been criticized for global-level analysis such as Gallai et al.’s (Reference Gallai, Salles, Settele and Vaissiere2009) (see, e.g., Bauer and Wing, Reference Bauer and Wing2010; Hein, Reference Hein2009), but ours is a local study of crop production in Georgia’s counties. Local declines in pollination services should not cause a change in overall factor or crop prices when the crop is produced for the national or global markets. Hein (Reference Hein2009) argues that this approach can be used in local studies in high-income countries, such as those in the Organization for Economic Cooperation and Development (OECD), where farmers normally produce for the national or international markets. In our case, Georgia counties are not isolated, nor are we analyzing local varieties or crops for auto-consumption. Thus, it can be assumed that a change in pollination has an impact on social welfare, which is equal to the change in the producer surplus only, as there is no price effect, and the consumer surplus can be assumed to be zero (Hein, Reference Hein2009).
Footnote 1
Following equation (1), the value generated by the pollination service can be calculated as:
 $$W= \Delta q \times (TR - TVC)$$
, where
$$W= \Delta q \times (TR - TVC)$$
, where
 $${\Delta q}$$
is the change in output as a consequence of pollination,
$${\Delta q}$$
is the change in output as a consequence of pollination,
 $${TR}$$
is total revenue, and
$${TR}$$
is total revenue, and
 $${TVC}$$
is total variable cost.
$${TVC}$$
is total variable cost.
The term
 $${{\partial y} \over {\partial e}}$$
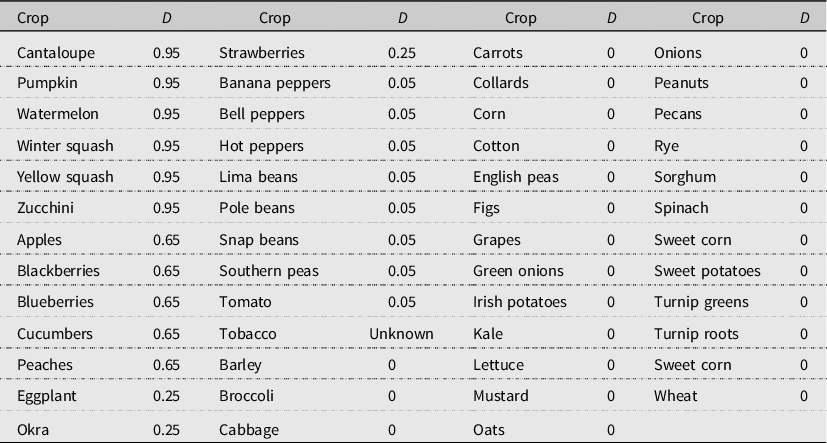
in equation (1) represents the pollination dependency ratio, D, or the loss in agricultural production induced by a reduction in the number of pollinators. For example, wheat production dependency on biotic pollination is zero (D = 0) since it is wind pollinated, but watermelon production dependency on biotic pollination is high (D = 0.95). The difference between these two dependency ratios shows the vulnerability of watermelon to the absence of pollinators versus the lack of vulnerability of wheat to the same absence.
$${{\partial y} \over {\partial e}}$$
in equation (1) represents the pollination dependency ratio, D, or the loss in agricultural production induced by a reduction in the number of pollinators. For example, wheat production dependency on biotic pollination is zero (D = 0) since it is wind pollinated, but watermelon production dependency on biotic pollination is high (D = 0.95). The difference between these two dependency ratios shows the vulnerability of watermelon to the absence of pollinators versus the lack of vulnerability of wheat to the same absence.
We investigate 51 crops grown in Georgia used directly for human consumption of which 22 are biotically pollinated. Table 1 lists these crops and their pollinators, whereas Table 2 lists their pollination dependency ratios. We follow Barfield et al. (Reference Barfield, Bergstrom, Ferreira, Covich and Delaplane2015) who, in accordance with Gallai et al. (Reference Gallai, Salles, Settele and Vaissiere2009), use the mid-range value of Klein et al. (Reference Klein, Vaissiere, Cane, Steffan-Dewenter, Cunningham, Kremen and Tscharntke2007)’s ranges of potential production loss.Footnote 2 To this date, Klein et al.’s (Reference Klein, Vaissiere, Cane, Steffan-Dewenter, Cunningham, Kremen and Tscharntke2007) remain the most recent pollination dependency ratios to have been published.
Georgia crops studied and their pollinators
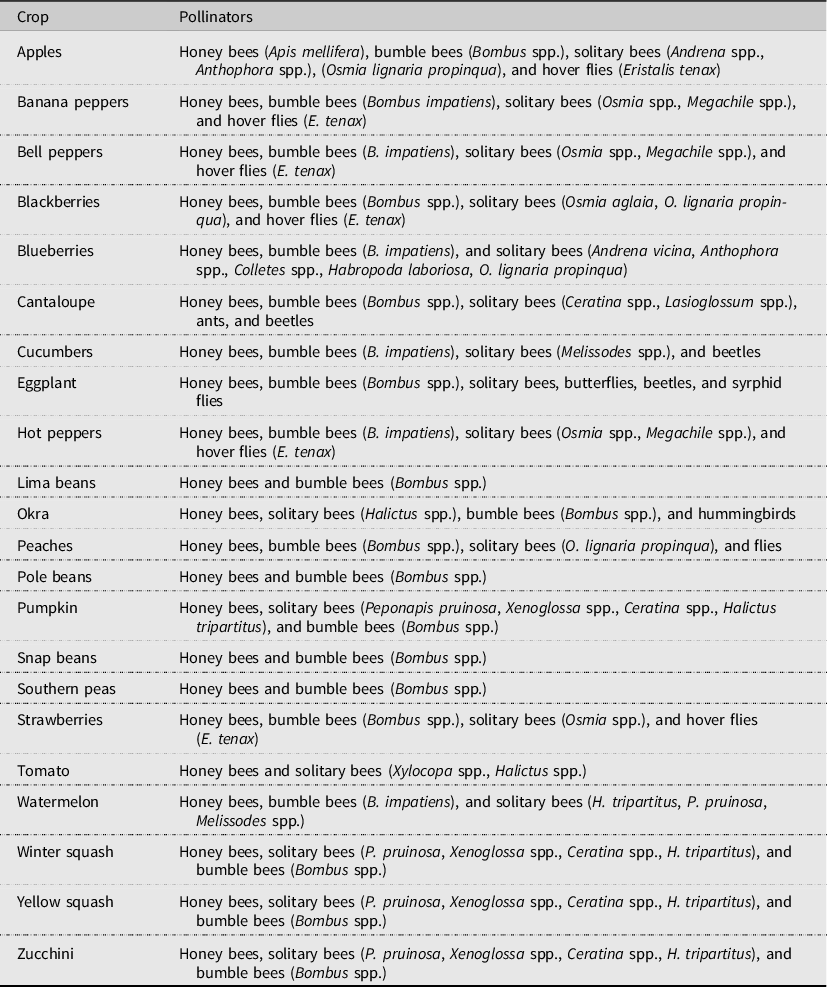
Notes: Excluded from the list of crops are cherries, nectarines, pears, and plums. While these crops were included in the study by Barfield et al. (Reference Barfield, Bergstrom, Ferreira, Covich and Delaplane2015), the farm gate fruit and nut no longer reports them separately in the years following 2009. These fruits reported as “other” in the reports beginning in 2010, so they were removed from our calculations to ensure consistency throughout the 9 years being studied.
Sources: Adamson et al. (Reference Adamson, Roulston, Fell and Mullins2012); Boatright and McKissick (Reference Boatright and McKissick2010a, 2010b, 2010c); BugGuide. Net (2014); Crane and Walker (Reference Crane and Walker1984); Delaplane et al. (Reference Delaplane, Mayer and Mayer2000); Hein (Reference Hein2009); Klein et al. (Reference Klein, Vaissiere, Cane, Steffan-Dewenter, Cunningham, Kremen and Tscharntke2007).
Georgia crops studied ranked by their pollination dependency ratios (D)
Sources: Barfield et al. (Reference Barfield, Bergstrom, Ferreira, Covich and Delaplane2015); Boatright and McKissick (Reference Boatright and McKissick2010a, 2010b, 2010c); Klein et al. (Reference Klein, Vaissiere, Cane, Steffan-Dewenter, Cunningham, Kremen and Tscharntke2007).
For each county and for the state of Georgia as a whole, we calculate the EVP as a summation of the EVP over all crops investigated, following Gallai et al. (Reference Gallai, Salles, Settele and Vaissiere2009) and Barfield et al. (Reference Barfield, Bergstrom, Ferreira, Covich and Delaplane2015):
 $${\rm{EVP}} = \;\sum\nolimits_{i = 1}^I {({P_i} \times {Q_i} \times {D_i})} = \sum\nolimits_{i = 1}^I {\left( {{\rm{FG}}{{\rm{V}}_i} \times {D_i}} \right)} .$$
For each crop i,
 $${P_i}$$
is the price per unit,
$${P_i}$$
is the price per unit,
 $${Q_i}$$
is the quantity produced,
$${Q_i}$$
is the quantity produced,
 $${D_i}$$
is the pollination dependency ratio, and
$${D_i}$$
is the pollination dependency ratio, and
 $${\rm{FG}}{{\rm{V}}_i}$$
is the farm gate value reported (computed as
$${\rm{FG}}{{\rm{V}}_i}$$
is the farm gate value reported (computed as
 $${P_i}\; \times \;{Q_i}).{\rm{\;}}$$
We update and expand Barfield et al. (Reference Barfield, Bergstrom, Ferreira, Covich and Delaplane2015)’s estimates for 2009 to cover the years 2009 to 2017. All values are adjusted for inflation and put into 2017 dollars using the All Farm Price Received Index provided by the National Agricultural Statistics Service. This allows us to look for temporal (in addition to county-level spatial) trends in the value of pollination.
$${P_i}\; \times \;{Q_i}).{\rm{\;}}$$
We update and expand Barfield et al. (Reference Barfield, Bergstrom, Ferreira, Covich and Delaplane2015)’s estimates for 2009 to cover the years 2009 to 2017. All values are adjusted for inflation and put into 2017 dollars using the All Farm Price Received Index provided by the National Agricultural Statistics Service. This allows us to look for temporal (in addition to county-level spatial) trends in the value of pollination.
We also calculate two indicators of the dependency of the agricultural sector in Georgia on pollination services. The first one is the crop vulnerability ratio (CVR), or the potential production value loss in the absence of pollinators, which is calculated as the ratio of EVP to economic production value (EV; Gallai et al., Reference Gallai, Salles, Settele and Vaissiere2009),
 $${\rm{CVR}} = \;{{{\rm{EVP}}} \over {{\rm{EV}}}} = {{\sum\nolimits_{i = 1}^I {\left( {{P_i}\; \times \;{Q_{i\;}} \times \;{D_i}} \right)} } \over {\sum\nolimits_{i = 1}^I {\left( {{P_i}\; \times \;{Q_i}} \right)} }} = {{\sum\nolimits_{i = 1}^I {\left( {{\rm{FG}}{{\rm{V}}_i}\; \times \;{D_i}} \right)} } \over {\sum\nolimits_{i = 1}^I {\left( {{\rm{FG}}{{\rm{V}}_i}} \right)} }}\left( \% \right).$$
The second one is pollination’s contribution to TFGV. This is the ratio of the EVP to TFGV, which aggregates all values of commodities in the agricultural sector including animal products each year. Pollination’s contribution to TFGV (PCV) measures potential agricultural sector production value loss in the absence of pollinators (Barfield et al., Reference Barfield, Bergstrom, Ferreira, Covich and Delaplane2015). We expect this value to be lower than the CVR each year,
 $${\rm{PCV}} = \;{{{\rm{EVP}}} \over {{\rm{TFGV}}}} = {{\sum\nolimits_{i = 1}^I {\left( {{\rm{FG}}{{\rm{V}}_i}\; \times \;{D_i}} \right)} } \over {{\rm{TFGV}}}}\left( \% \right).$$
As in Gallai et al. (Reference Gallai, Salles, Settele and Vaissiere2009) and Barfield et al. (Reference Barfield, Bergstrom, Ferreira, Covich and Delaplane2015), we omit the indirect value of pollination added through dairy and cattle industries, as well as seed production for both vegetative components of other crops and of plants not intended for consumption. We also omit cotton and soybeans due to a debatable pollination dependency ratio. These omissions tend to underestimate the true economic value of biotic pollination, an underestimation that may be significant given that cotton had a Georgia FGV of US$901.5 million in 2017. Moreover, one caveat of the production function approach is that it only accounts for the direct, use value of wild pollinators in terms of marketable agricultural production. That is, the values calculated in this study do not account for the non-use value of pollinators derived from their existence. On the other hand, as it is apparent from equation (2), the production value approach omits production costs, which would lead to overestimating the value of pollination.
Unfortunately, there is no publicly available information on costs of production for all 51 crops considered in the analysis to compute EVP estimates net of variable production costs, but we can approximate the magnitude of the correction for the two crops with the largest EVP in Georgia. For watermelon and blueberries, we obtain the estimated TVCs from the Georgia Enterprise budgets prepared by UGA faculty and extension (Fonsah et al., Reference Fonsah, Coolong, Tucker and Shealey2016, Reference Fonsah, Coolong, Tucker and Shealey2017, Reference Fonsah, Allen, Jacobs, Slushe, r, Lovett and Curry2018).
4. Results
We calculated the EVP (equation (2)), CVR (equation (3)), and PCV (equation (4)) for each county in Georgia and for the state as a whole for each year from 2009 to 2017. Table 3 shows the average EVP, CVR, and PCV for all 159 counties for 2009 and 2017. For Georgia, we estimate the total economic value of biotic pollination has grown from about US$425 million to 2009 to about US$488 million in 2017. Annual EVP values showed a steady increase reaching a peak of US$532 million in 2016 (Figure 1). Footnote 3
Measure of pollination’s economic significance to Georgia 2009 and 2017

Sources: Authors’ calculations. Estimates for years 2010 to 2016 are available upon request.
Economic value of pollination (EVP) and crop vulnerability ratio (CVR) in the State of Georgia (2009–2017).

In the absence of biotic pollinators, the CVR indicates a potential production value loss for the crops studied of roughly 18.2% in 2009. The CVR in 2017 showed a slightly lower potential loss of roughly 16.7%. Biotic pollination’s contribution to Georgia’s TFGV grew from 3.3% in 2009 to 3.6% in 2017. The average crop EVP also grew from nearly US$8.3 million in 2009 to nearly $9.6 million in 2017. To put these numbers into perspective, the EVP of pumpkins grown in the state in 2009 was 8.8 million (Table 4), and the EVP for eggplants in 2017 was 7.4 million (Table 5). The 2017 county-level average CVR indicates that, on average, Georgia counties could anticipate potential production losses for the crops studied of 17% in the absence of biotic pollinators. The 2017 average county PCV shows that, on average, biotic pollination contributes 3.6% of each county’s TFGV (Table 3).Footnote 4
Georgia Statewide 2009 EVP for biotically pollinated crops

Source: Authors’ calculations.
Georgia Statewide 2017 EVP for biotically pollinated crops

Source: Authors’ calculations.
Regarding specific crops, throughout the period studied, blueberries and watermelon were the top two Georgia crops in terms of EVP values. These crops made up over half (US$230 million in 2009 and US$275 million in 2017) of the state’s total EVP due to the combined effects of their high pollination dependency ratios and high TFGVs each year (Tables 4 and 5). The EVP of blueberries increased by 91% during this period and their price increased by 75% (from $1.28/pound to $2.24/pound). In contrast, the EVP for watermelons dropped by 16% despite a price increase of 26% (from $0.1158/pound to $0.1457/pound). Without information on pollination densities during this period, we cannot say if a decrease in pollination services played a role in the production decline. From the Enterprise budgets, beehive rental prices are consistently reported at $50 an acre, suggesting that if there was a decline in pollination services, it did not lead to an increase in the cost of beehive rentals, at least between 2016 and 2017 (Fonsah et al., Reference Fonsah, Coolong, Tucker and Shealey2016, Reference Fonsah, Coolong, Tucker and Shealey2017). At the other end, the EVP for banana peppers in 2017 was only around US$33,000, down from US$270,000 in 2009.
As already noted, the production function approach does not account for variable production costs (TVC), but using TVC estimates, also from the Georgia Enterprise budgets (Fonsah et al., Reference Fonsah, Coolong, Tucker and Shealey2016, Reference Fonsah, Coolong, Tucker and Shealey2017, Reference Fonsah, Allen, Jacobs, Slushe, r, Lovett and Curry2018), for blueberries, we find the EVP estimates to be 46% smaller in 2009 and 38% in 2017 if TVCs are subtracted from TR. For watermelon, the corrections are 59% and 53% in 2009 and 2017, respectively. We note, however, that we are not able to determine if the final estimates of the aggregate value of pollination in this study are, in fact, overestimated by that amount since, as previously stated, not accounting for non-use values of biotic pollinators and omitting cotton and soybeans in the aggregate calculations work in the opposite direction.
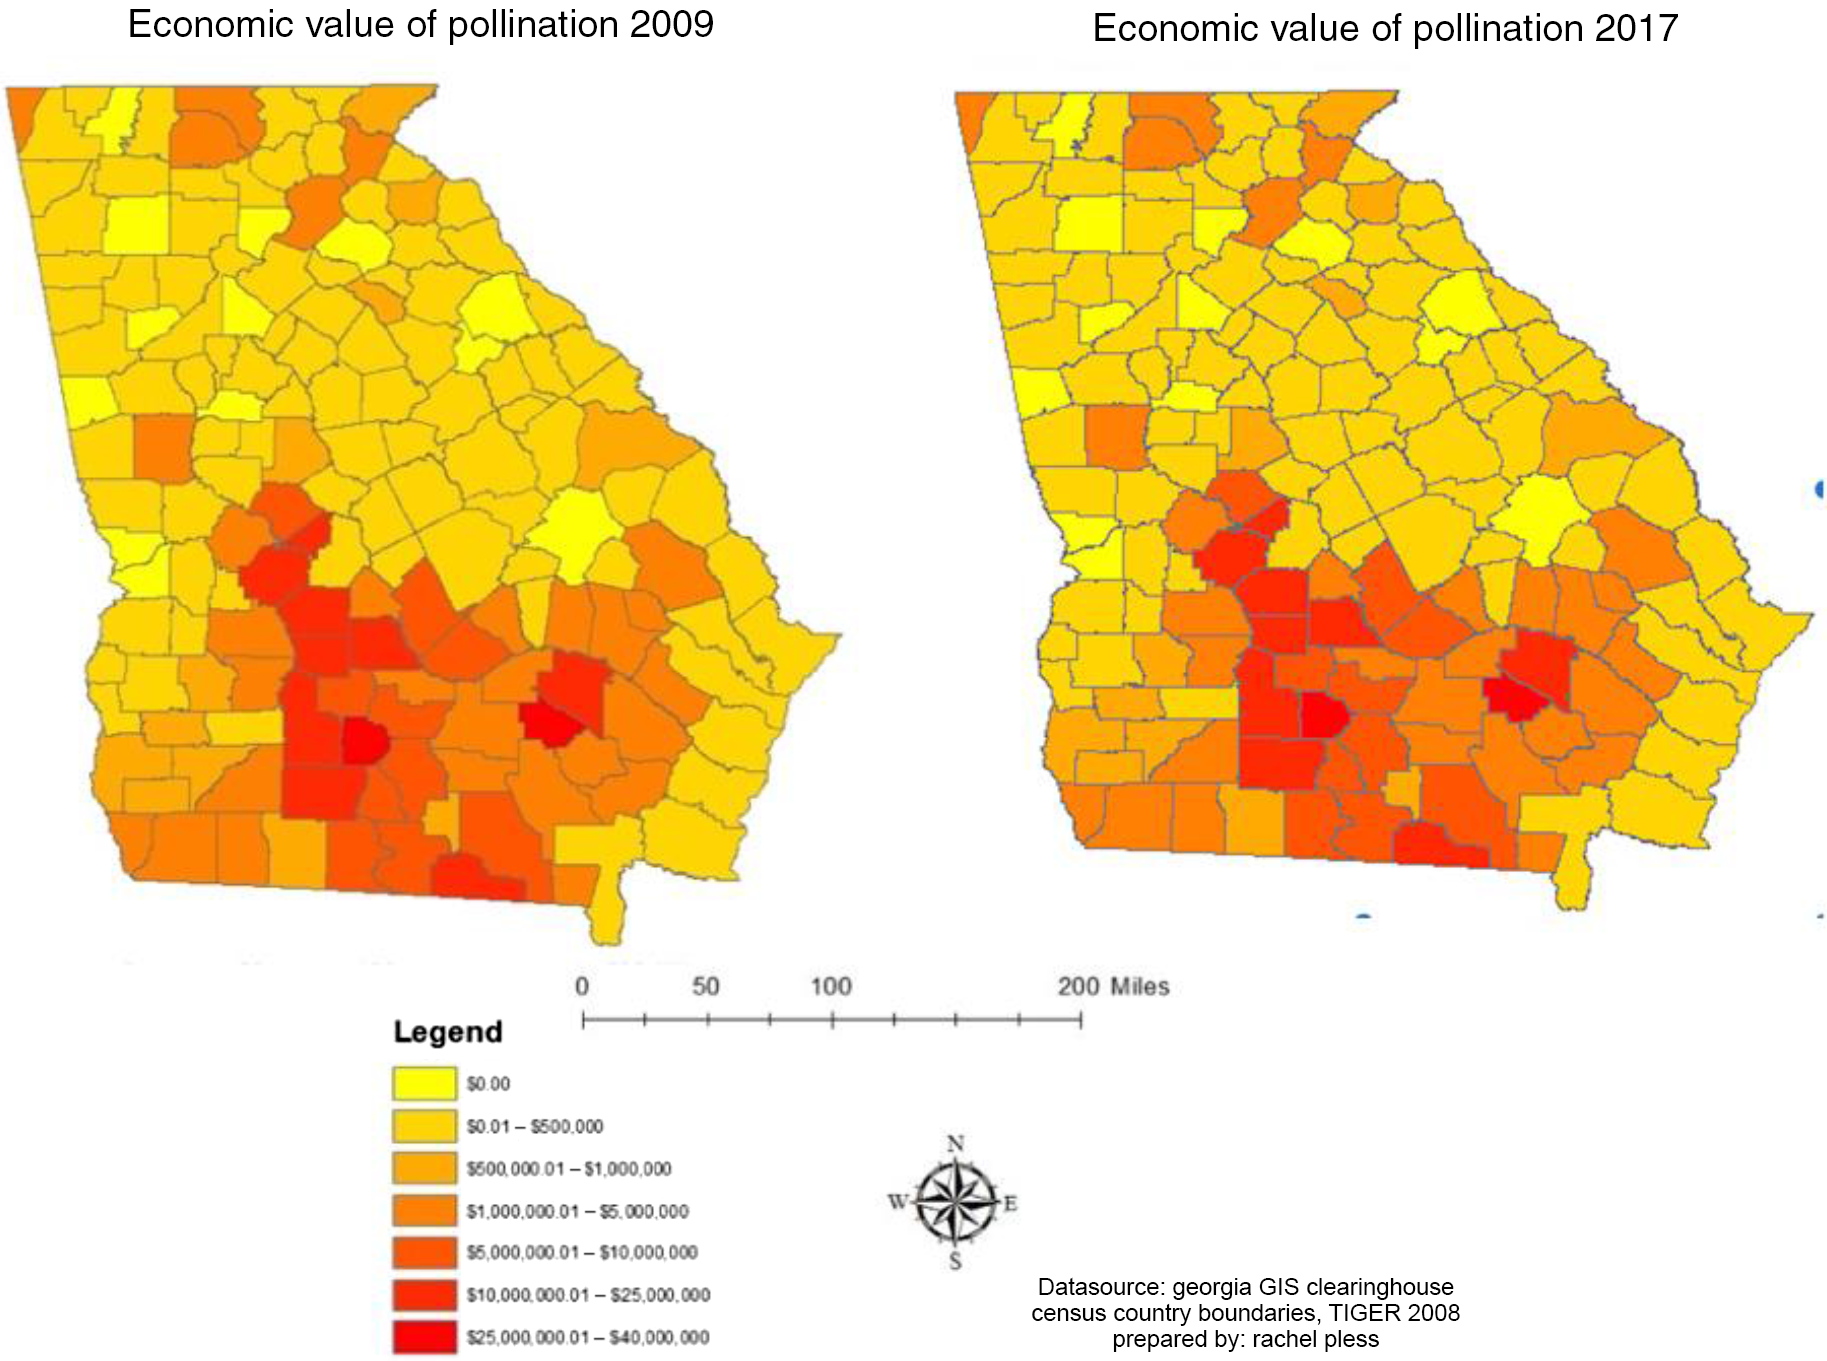
Statewide averages mask the large spatial variation in the values of EVP, CVR, and PCV across counties. Figures 2–4 depict the calculations for each of the counties for years 2009 and 2017.Footnote 5 Both the EVP and PCV maps (Figures 2 and 3, respectively) provide visualizations of clear patterns of spatial variation, whereas the maps displaying CVR values (Figure 4) show less distinct patterns. With the exception of a few scattered counties in the northern part of the state, the counties with the highest EVP and PCV values remained clustered in the south-central portion of Georgia from 2009 to 2017. This region is known to be the largest contributor to Georgia’s agricultural sector, so these results were not surprising. CVR values showed little clustering in each year, with high CVR values being dispersed fairly evenly throughout the state. The counties with high CVR values in the northern and southeastern portions of the state are particularly interesting. These areas showed low to average PCV and EVP values, but they are growing crops that are certainly vulnerable to pollinator decline such as watermelon and blueberries. This suggests that pollination has continued to affect the entire state over the past decade, regardless of the magnitude of agricultural production in each region.
Economic value of pollination in the State of Georgia (2009 and 2017).
Pollination’s contribution to total farm gate value (PCV) in the State of Georgia (2009 and 2017).

Crop vulnerability ratio (CVR) in the State of Georgia (2009 and 2017).

In contrast to the large spatial variation, there is not much temporal variation in the county-level EVP, PCV, and CVR for Georgia. The spatial visualizations of EVP, PCV, and CVR values have been consistent from 2009 to 2017. South Georgia stands to lose the most in total economic value in the face of pollinator decline, whereas the northern and coastal regions would also be greatly affected by this decline.
Using data provided by the Great Georgia Pollinator Census (Griffin, Reference Griffin2019), we were able to map pollinator densities per county. These data are in the form of number of insects found per count and includes honey bees, bumble bees, butterflies, and several other pollinating insects. The simultaneous visualization of CVR values and pollinator densities, in Figure 5, shows no distinct correlation among areas most vulnerable to pollinator decline and where they are currently located. The map of EVP values and pollinator densities also shows no clear relation between the two, with higher pollinator densities being dispersed throughout the state (Figure 6).
Crop vulnerability ratio (2017) and insect densities (2019) in the State of Georgia.

Economic Value of Pollination (2017) and insect densities (2019) in the State of Georgia.

These maps should be a warning to certain counties where pollination economic values and vulnerability ratios are high, but pollinator densities are low. While pollinator survey data were collected in 2019 and our calculated economic figures are from 2017, the maps suggest that pollinators are not primarily located among counties with the highest agricultural demand for them, but are distributed independently of the size of the regional agricultural sector. The data in these two figures could have important implications for future policies regarding pollinator protection at both the county and state levels.
Figure 7 provides an alternative depiction of the correlation between pollinator densities and EVP values using scatter plots. We found a negative correlation (ρ = −0.0558) between insect densities and EVP values (Figure 7a). Although slightly smaller in absolute value, this negative relationship is robust to the exclusion of outliers and influential observations (ρ = −0.0382, Figure 7b).
Insects per count vs. 2017 economic value of pollination in the State of Georgia: (a) all observations and (b) excluding outliers.
Notes: Unit of observation is the county. Data on insects per count come from the Georgia pollination census (Griffin, Reference Griffin2019); EVP in 2017 are calculated by the authors as indicated in equation (2).

The relationship between insect densities and CVR values at the county level is also negative (ρ = −0.0993, Figure 8a). Excluding outliers caused the correlation to decrease in absolute value to −0.0453, though it did remain negative (Figure 8b). This again suggests that counties more vulnerable to a decline in pollinators have relatively lower pollinator counts, and indicates a potential problem in the future for pollinator populations to meet the demand for their ecosystem services in the agricultural sector.
(a) Insects per count vs. 2017 crop vulnerability ratio in the State of Georgia: (a) all observations and (b) excluding outliers.
Notes: Unit of observation is the county. Data on insects per count come from the Georgia pollination census (Griffin, Reference Griffin2019); CVR in 2017 is calculated by the authors as indicated in equation (3).

5. Discussion and Conclusions
We use the production function approach, which is a type of bioeconomic approach, to estimate the EVP in Georgia from 2009 (US$425 million) to 2017 (US$488 million). We also calculate the CVR in 2009 (18%) and 2017 (16%) as well as PCV which grew from 3.3% in 2009 to 3.6% in 2017. These values were calculated using 51 crops in Georgia grown directly for human consumption throughout the entire period being studied.
Both EVP and PCV values in Georgia have increased while CVR has fallen over time. This may be positive news for the state, as agricultural production becomes less vulnerable to a decline in pollinators despite their increasing value. The pollination dependency ratios we use in this study are constant, so this decrease in CVR may be driven by a change in the composition of the crops being grown. In 2009, the crop with the highest EVP was watermelon at US$152 million and a dependency ratio of 0.95. By 2017, the crop with the highest EVP had become blueberries which have a significantly lower pollination dependency ratio of 0.65. On the other hand, the increase in state EVP can be partly explained by the increase in aggregate FGV. While changes in production levels of certain highly pollination-dependent crops such as yellow squash with EVP growth of over US$6 million between 2009 and 2017 certainly contribute to this increase, the TFGV grew over US$567 million over this period.
PCV was a figure unique to the Barfield et al. (Reference Barfield, Bergstrom, Ferreira, Covich and Delaplane2015) study and allows for the evaluation of the importance of pollination in the entire agricultural sector, not just the crops studied. We updated and expanded the Barfield et al. (Reference Barfield, Bergstrom, Ferreira, Covich and Delaplane2015) numbers showing significant growth in the economic value of pollinators between 2009 and 2017, indicating that pollination has only gained importance as a contributor to the agricultural industry and economy in Georgia.
While these figures paint a positive picture of the evolution of the EVP services in Georgia, it is only a partial picture. Our study is unique in that it includes a visualization of pollinator densities at the county level along with the calculated economic values. These maps allow for a closer look at pollinator abundance, which would be especially relevant for counties heavily reliant on biotically pollinated crops. For example, Gilmer County in North Georgia shows a high EVP value of US$5 million and a CVR value of 57.3% in 2017 due to their high production of apples, which are heavily reliant on pollinators. Despite Gilmer County’s heavy reliance on pollinators, they have relatively low insect densities with an average of 10–20 pollinators per count in the recent UGA Extension Service pollinator survey. Another example of a county with high CVR values and relatively low pollinator densities is Liberty County on the southeast coast of the state with a CVR of 55.4% and a pollinator density of 14.6 insects per count in the UGA pollinator survey.
Moreover, the comparison between insect densities and economic values showed negative relationships between pollinator counts in the UGA pollinator survey and both EVP and CVR values. This negative correlation could indicate potential problems in the future if insect populations do not increase with the potential economic value added by their services. Wild pollinator populations typically drop drastically in areas of intensive farming. The wild bees suffer with monoculture plantings where foraging habitats are outnumbered by unpollinated plants and then struggle to find food after the season has ended (Winfree, Reference Winfree2008). The negative relationship between pollination value and pollinator counts may be evidence of this, as areas with heavy pesticide use and monoculture plantings are not suitable in the long run for wild pollinator populations. The low pollinator counts in intensely farmed counties could lead to decreased yields. A study conducted across 131 major crop-producing areas of the U.S. found that five out of seven crops studied showed evidence of production limitations due to a lack of pollinators (Reilly et al., Reference Reilly, Artz, Biddinger, Bobiwash, Boyle and Brittain2020).
Our results have policy implications regarding pollinator protection at both the state and local levels. Estimated EVP values provides useful information for a cost-benefit analysis of possible responses to the continued documented pollinator decline across the entire state and at the county level. Moreover, knowing the value of pollinators along with the current densities per county based on the 2019 pollinator survey allows local governments and invested residents to prioritize resources when identifying methods to manage pollinator decline. These pollinator density figures should be tracked over time to gain a well-rounded understanding of pollinator population growth and locations.
The crops in this study are recipients of both managed and unmanaged pollination services. Visits by wild insect pollinators have been shown to increase yields in crops even when managed pollinator (honey bee) visitation is high (Garibaldi et al., Reference Garibaldi, Steffan-Dewenter, Winfree, Aizen, Bommarco, Cunningham and Kremen2013). At regional to national scales, however, the data and models to estimate the amount of wild pollination occurring are insufficient (Warnell et al., Reference Warnell, Russell, Rhodes, Bagstad, Olander and Nowak2020). Thus, as in Barfield et al. (Reference Barfield, Bergstrom, Ferreira, Covich and Delaplane2015), a limitation to this paper is the inability to distinguish between wild and managed pollinators’ contributions to the EVP in Georgia.
Data on colony rentals would be necessary to determine what amount of pollination was “free.” The closest available figure comes from the annual FGV reports, which include honey bees as a commodity and report an aggregated value for rentals, sales, honey production, and “other honey bees.” In 2017, the value of honey bees was reported to be US$46.7 million by the FGV report. Honey production in Georgia was reported to be US$6.7 million in 2017 by the National Agricultural Statistics Service (USDA, 2017). Though the individual values for “honey bees” and “honey” are reported by different agencies, the difference between these figures would imply an estimated value of honey bee rentals to be around US$40 million in 2017. This is one order of magnitude lower than the contribution we estimate in this paper. This might be because farmers manage their own honey bees, do not fully record all honey bee rentals, or rely on wild pollinators.
Protecting wild pollinator diversity would help meet the demand for biotic pollination as an “insurance policy” in the case of managed pollinator shortages. Wild pollinators are fully capable of meeting this demand under environmental conditions that encourage diverse pollinator communities (Chaplin-Kramer, Tuxen-Bettman, and Kremen, Reference Chaplin-Kramer, Tuxen-Bettman and Kremen2011). In addition to global monitoring and conservation efforts, policy changes at the local level such as limited pesticide use or the implementation of pollinator gardens represent the acknowledgement of the importance of pollinators. Conserving and establishing wild pollinator habitat near pollination-dependent crops increases the ecological fitness of pollinator populations. Moreover, such strategies also provide co-benefits to the farms and surrounding landscapes in terms of enhanced overall biodiversity, improved soil and water quality by mitigating runoff and preventing soil erosion, and increased aesthetic value (Wratten et al., Reference Wratten, Gillespie, Decourtye, Mader and Desneux2012). These are important steps toward protection and policy innovations that have potential to expand to state- and national-level policy instruments, especially when these secondary benefits are incorporated into decision-making processes (Hall and Steiner, Reference Hall and Steiner2019; Wratten et al., Reference Wratten, Gillespie, Decourtye, Mader and Desneux2012).
While this study provided an assessment of the EVP over time, further research potential exists in relating these values to actual pollinator counts and land use over time. It may be beneficial to compare the acreage devoted to agricultural production and indicators of landscape diversity in Georgia with the growing value of biotic pollination over these nine years. Such comparison would help determine where pollination adds value as an ecosystem service in relation to land use and prioritize policy interventions.
The production function approach to valuation of pollination services assumes that crop prices do not change due to a change in pollination services. As argued by Hein (Reference Hein2009), this is an appropriate assumption for local studies. Our analysis focuses on county-level production in Georgia rather than on national or global crop production, but for watermelons and blueberries specifically, that assumption requires further examination. On average, during the period 2009–2017, Georgia contributed 16% of the total watermelon production in the U.S. In 2019, blueberry production in the state was 14% of the U.S. in total. Georgia also contributed 9% of the total U.S cucumber production and 7% of the total U.S cantaloupe production in 2019 (USDA, 2020). A detailed analysis that considers the effects of a pollination decline in Georgia on U.S. prices is beyond the scope of this paper, but in a national-level analysis, assuming a watermelon crop supply elasticity of 0.6 and own price demand elasticity of −1 (Price and Mittelhammer, Reference Price and Mittelhammer1979; Suits, Reference Suits1955; You et al., Reference You, Epperson and Huang1996), 37.5% of the drop in total surplus from a decline in pollination would fall on consumers, with the other 62.5% corresponding to the producer share on the change in total surplus.Footnote 6
The price of watermelons would increase in proportion to (i) the consumer share of the change in total surplus (which depends on the demand and supply elasticities) and (ii) the shift in watermelon supply, relative to the initial price (Alston, Reference Alston1991).Footnote 7 The shift in supply, in turn, depends on the severity of pollination decline, the pollination dependency ratio (which is 0.95 in the case of watermelons) and, in the medium-to-long term, on the actions taken by farmers in response to a decrease in “free” pollination services. Naturally, farmers might react to increases in pollination costs in many ways such as searching for new cultivars with lower dependency ratios, mechanical pollination, or changing crops. Another potential area of future research would be to conduct farm-level surveys to analyze which strategies are favored by farmers and their costs.
Acknowledgments
The authors thank Becky Griffin for access to the Georgia Census Pollinator data and participants at the 52nd Southern Agricultural Economics Association meeting in Louisville, KY, for useful comments. All errors are our own.
Financial Support
This research received no specific grant from any funding agency, commercial, or not-for-profit sectors.
Conflict of Interest
None.
Data Availability
Data availability is not applicable to this article as no new data were created or analyzed in this study.


 Open access

