


1. Introduction
Since the first application of detrital garnet chemistry to discriminate sediment source regions (Morton, Reference Morton1985), garnet major-element composition has become a valuable information resource in provenance studies (Mange & Morton, Reference Mange and Morton2007; Krippner et al. Reference Krippner, Meinhold, Morton and von Eynatten2014; Hardman et al. Reference Hardman, Pearson, Stachel and Sweeney2018; Tolosana-Delgado et al. Reference Tolosana-Delgado, von Eynatten, Krippner and Meinhold2018) and first approaches of considering trace elements seem to be promising for future investigations (Čopjaková et al. Reference Čopjaková, Sulovský and Paterson2005; Hong et al. Reference Hong, Jian, Fu and Zhang2020). Beyond garnet chemistry, the identification of mineral inclusions in detrital garnet by Raman spectroscopy allows for the determination of mineral assemblages, a piece of information that is otherwise not available because detrital mineral grains mostly lose their paragenetic context (Schönig et al. Reference Schönig, Meinhold, von Eynatten and Lünsdorf2018 a). This becomes particularly important for sediments being derived from high-pressure (HP) to ultra-high-pressure (UHP) source rocks, as state-of-the-art discrimination schemes based on garnet composition do not enable their distinction. In contrast, detrital UHP garnet grains often contain inclusions of coesite and diamond, which enables the systematic screening of entire catchments for the presence of UHP rocks as demonstrated in the Western Gneiss Region of Norway (Schönig et al. Reference Schönig, Meinhold, von Eynatten and Lünsdorf2018 b), the central Saxonian Erzgebirge of Germany (Schönig et al. Reference Schönig, von Eynatten, Meinhold and Lünsdorf2019, Reference Schönig, von Eynatten, Meinhold, Lünsdorf, Willner and Schulz2020) and the D’Entrecasteaux Islands of Papua New Guinea (Baldwin et al. Reference Baldwin, Schönig, Gonzalez, Davies and von Eynatten2021).
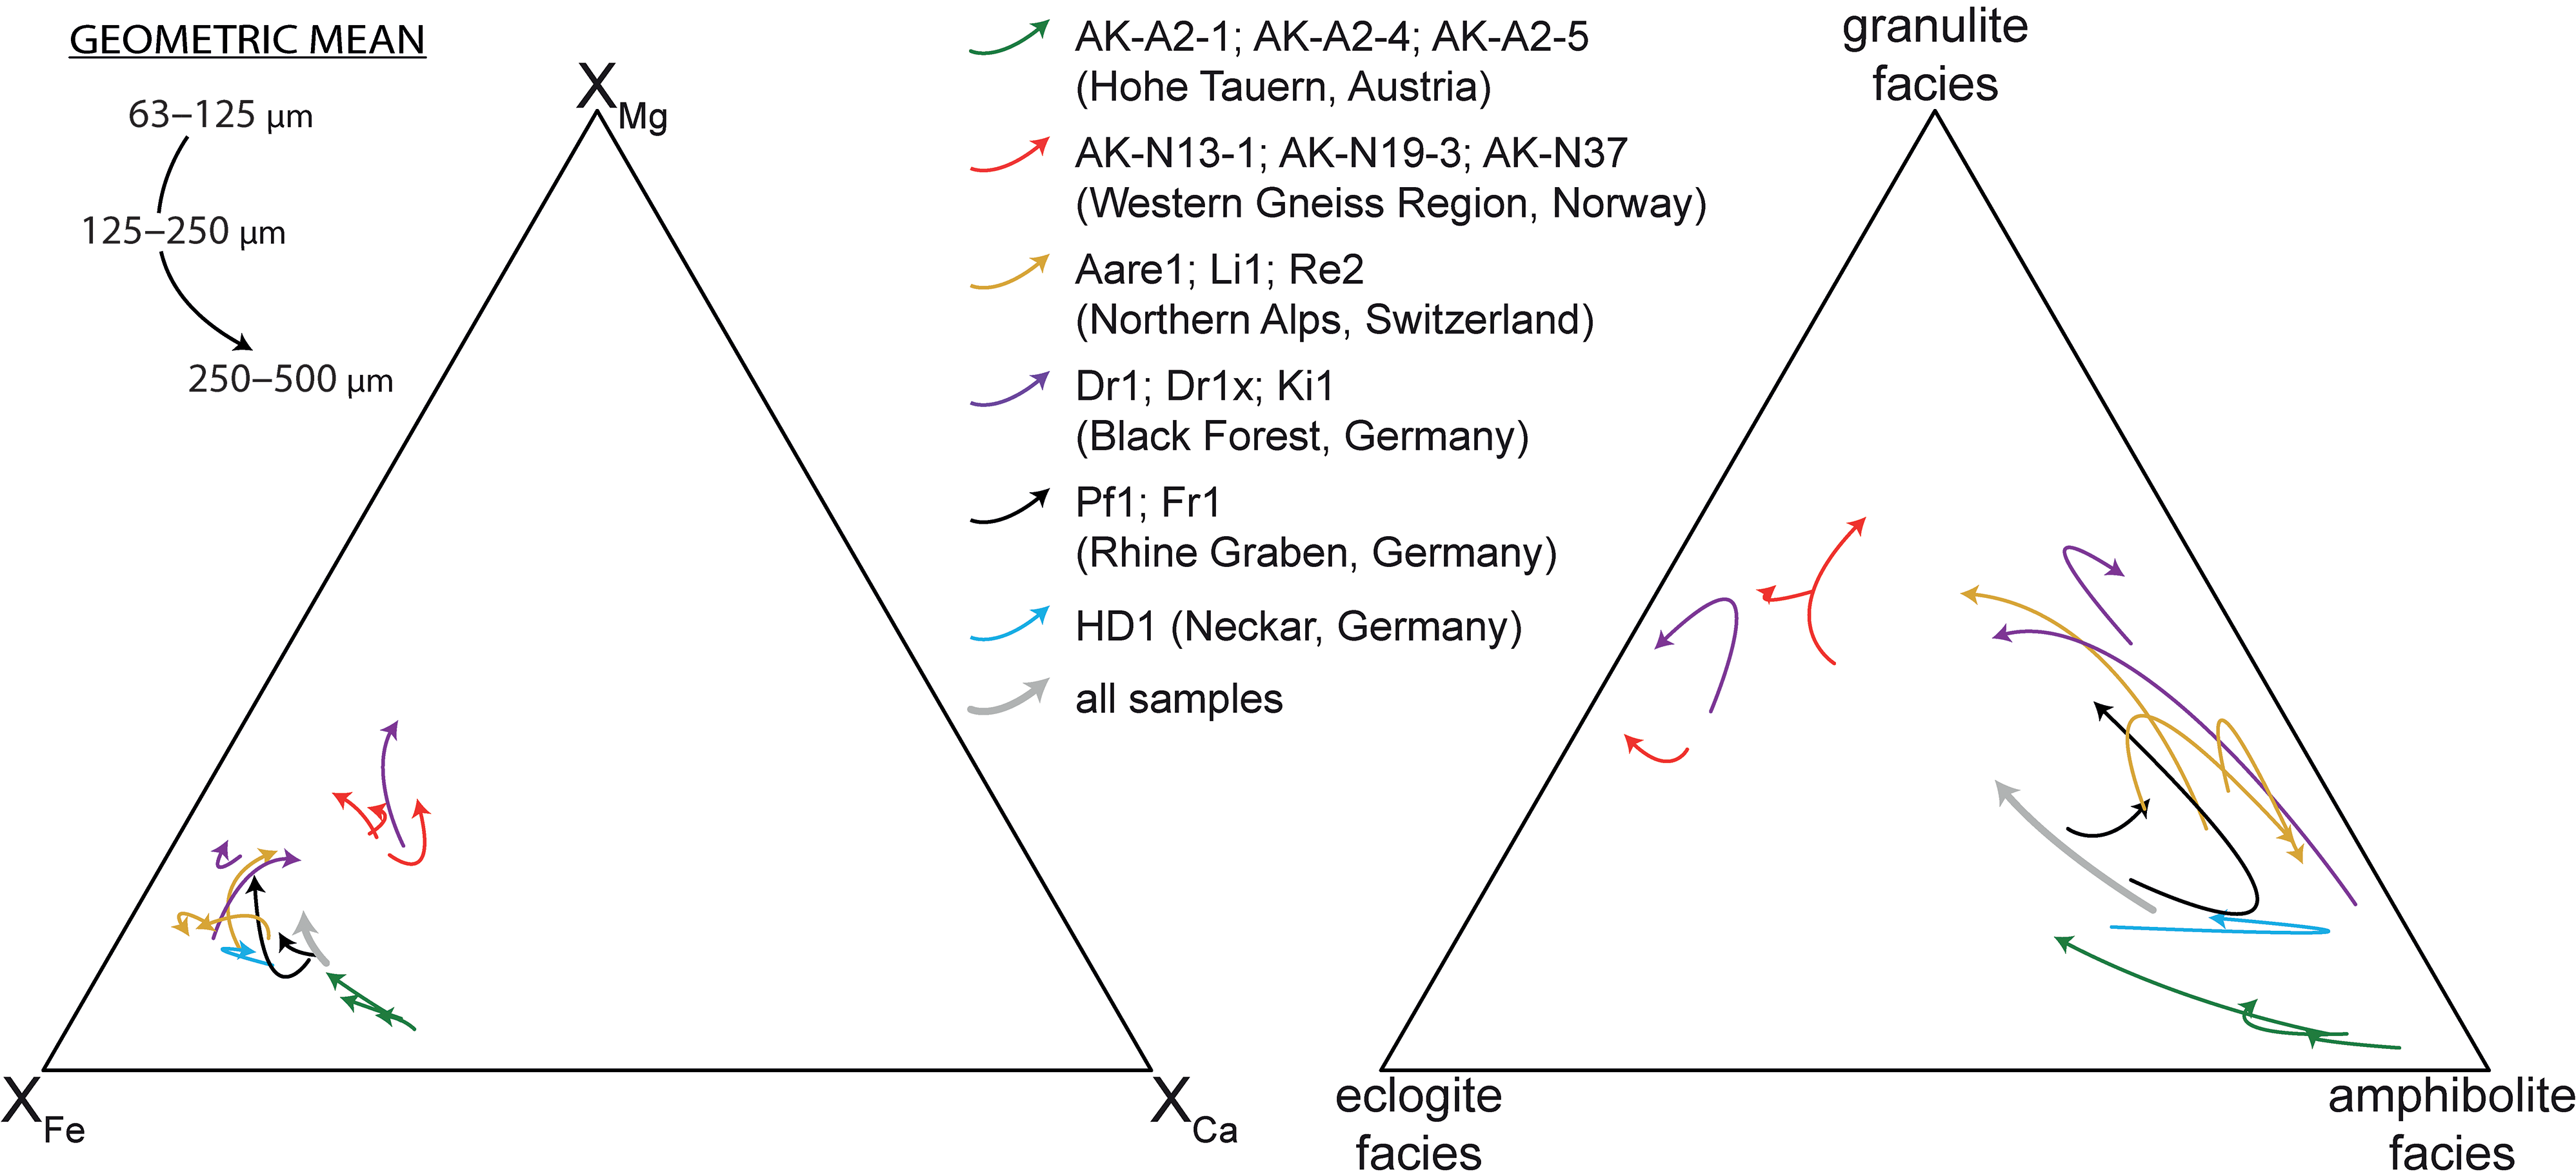
By considering a single mineral species in provenance studies, one of the major advantages is the minimization of hydrodynamic fractionation processes (Morton, Reference Morton, Morton, Todd and Haughton1991). However, strong grain-size control on U–Pb ages of zircon (e.g. Lawrence et al. Reference Lawrence, Cox, Mapes and Coleman2011; Ibañez-Mejia et al. Reference Ibañez-Mejia, Pullen, Pepper, Urbani, Ghoshal and Ibañez-Mejia2018), tourmaline chemistry (DB Viator, MSc thesis, Louisiana State University, 2003, available at https://digitalcommons.lsu.edu/gradschool_theses/1520/) and garnet chemistry (e.g. Krippner et al. Reference Krippner, Meinhold, Morton, Russell and von Eynatten2015, Reference Krippner, Meinhold, Morton, Schönig and von Eynatten2016) has been demonstrated, and should also be considered for other mineral phases (von Eynatten & Dunkl, Reference von Eynatten and Dunkl2012). For garnet, grain-size effects do not solely result from density contrasts due to compositional variation (Schuiling et al. Reference Schuiling, Scholten, de Meijer and Riezebos1985), but are also related to inherited grain size from source to sink (Krippner et al. Reference Krippner, Meinhold, Morton, Russell and von Eynatten2015, Reference Krippner, Meinhold, Morton, Schönig and von Eynatten2016). From the western Hohe Tauern of Austria, Krippner et al. (Reference Krippner, Meinhold, Morton, Russell and von Eynatten2015) observed an increase in the magnesium content with increasing garnet grain size, pointing to enrichment of garnet grains derived from HP metamorphic rocks with increasing grain size (Fig. 1; green arrows), in accordance with the typical large garnet crystal size in these rock types. This trend of increasing metamorphic grade with increasing grain size can be also observed from the detrital garnet major-element chemistry of Krippner et al. (Reference Krippner, Meinhold, Morton, Schönig and von Eynatten2016) and Schönig et al. (Reference Schönig, Meinhold, von Eynatten and Lünsdorf2018a) from the Western Gneiss Region of Norway (Fig. 1; red arrows). In addition, detrital garnet data of several samples from the Northern Alps, Black Forest, Rhine Graben and Neckar River investigated by Hülscher et al. (Reference Hülscher, Bahlburg and Pfänder2018) imply a similar pattern, although some do not show a clear trend (Fig. 1; yellow, purple, black, and blue arrows, respectively). Notably, Hülscher et al. (Reference Hülscher, Bahlburg and Pfänder2018) solely studied garnet rims, an approach that may bias the composition versus grain-size distribution.
Trends of geometric means of detrital garnet composition from the 63–125 µm fraction (origin of arrow) via the 125–250 µm fraction to the 250–500 µm fraction (head of arrow). Compositions are shown in the XFe–XMg–XCa ternary plot (molar proportions) (left side) and in a ternary plot giving probabilities for metamorphic garnet of belonging to eclogite facies, granulite facies and amphibolite facies host rocks using multivariate discrimination (Tolosana-Delgado et al. Reference Tolosana-Delgado, von Eynatten, Krippner and Meinhold2018, prior probability ‘equal-M’) (right side). Compositional garnet data from Krippner et al. (Reference Krippner, Meinhold, Morton, Russell and von Eynatten2015): AK-A2-1 (n = 287), AK-A2-4 (n = 293), AK-A2-5 (n = 294); Krippner et al. (Reference Krippner, Meinhold, Morton, Schönig and von Eynatten2016): AK-N19-3 (n = 294); Schönig et al. (Reference Schönig, Meinhold, von Eynatten and Lünsdorf2018a): AK-N13-1 (n = 148), AK-N37 (n = 148); and Hülscher et al. (Reference Hülscher, Bahlburg and Pfänder2018): Aare1 (n = 91), Li1 (n = 98), Re2 (n = 90), Dr1 (n = 74), Dr1x (n = 76), Ki1 (n = 93), Pf1 (n = 66), Fr1 (n = 77), HD1 (n = 87).
Based on the general trend of increasing metamorphic grade with increasing detrital garnet grain size (Fig. 1, grey arrows), in particular in samples from HP regions such as the Hohe Tauern and Western Gneiss Region, it would be expected that the proportion of detrital garnet grains sourced from UHP rocks progressively increases with grain size. However, the few studies carried out so far convey a contrasting and non-uniform picture. Coesite-bearing garnet grains of a modern sand sample from the Western Gneiss Region of Norway only occur in the 63–250 µm fraction and are absent from the 250–500 µm fraction (Schönig et al. Reference Schönig, Meinhold, von Eynatten and Lünsdorf2018 b). In contrast, in a beach placer of the D’Entrecasteaux Islands of Papua New Guinea, coesite-bearing garnet has solely been found in the > 200 µm fraction (Baldwin et al. Reference Baldwin, Schönig, Gonzalez, Davies and von Eynatten2021). In modern sands from the central Saxonian Erzgebirge of Germany, coesite-bearing garnet grains show an even more complex distribution (Schönig et al. Reference Schönig, von Eynatten, Meinhold and Lünsdorf2019, Reference Schönig, von Eynatten, Meinhold, Lünsdorf, Willner and Schulz2020). In some samples they are enriched in the 250–500 µm fraction and in others in the 63–125 µm fraction, while some do not show a clear trend.
In order to understand the grain-size distribution of detrital coesite-bearing garnet, the previously investigated modern sand samples from tributaries draining the UHP nappe in the central Saxonian Erzgebirge represent an ideal study object. Compared with the Western Gneiss Region and the D’Entrecasteaux Islands, detrital UHP garnet grains of the Erzgebirge show higher variability in terms of grain size, the sampled catchment areas are better constrained, the chemical garnet database of local UHP lithologies is more substantiated and the geological framework is less complex.
In addition to mineral inclusion and chemical data of the coesite- and diamond-bearing detrital garnet of the central Saxonian Erzgebirge presented by Schönig et al. (Reference Schönig, von Eynatten, Meinhold and Lünsdorf2019, Reference Schönig, von Eynatten, Meinhold, Lünsdorf, Willner and Schulz2020), we here present and comprehensively evaluate the entire dataset of 2100 inclusion-bearing garnet grains with the aim of unravelling the distribution systematics of detrital coesite-bearing garnet regarding grain size and source-rock composition. In addition, the substantial quantity of 93 coesite-bearing grains, which contain a total of 193 coesite inclusions, enables the evaluation of the role of inclusion size, inclusion frequency and fluid availability for coesite preservation. We show that the disintegration of the initially large coesite-bearing garnet crystals during exhumation and processes of the sedimentary cycle is strongly controlled by inclusion size and frequency, leading to a heterogeneous detrital grain-size distribution.
2. Geological framework and sampling locations
The Saxonian Erzgebirge in the northwestern Bohemian Massif represents a dome-structure crystalline complex formed during the Variscan Orogeny resulting from the collision of Gondwana and Laurussia (e.g. Kroner & Romer, Reference Kroner and Romer2013). The study area is located in the central part of the complex within the previously defined Gneiss–Eclogite Unit (Kröner et al. Reference Kröner, Willner, Hegner, Frischbutter, Hofmann and Bergner1995), a heterogeneous nappe in the intermediate position of the nappe stack, which records the highest peak metamorphic conditions in the Erzgebirge (e.g. Willner et al. Reference Willner, Krohe and Maresch2000; Fig. 2a).
Maps showing the location and outline of the study area, modified after Schönig et al. (Reference Schönig, von Eynatten, Meinhold and Lünsdorf2019, Reference Schönig, von Eynatten, Meinhold, Lünsdorf, Willner and Schulz2020). (a) Tectonometamorphic units subdividing the Saxonian Erzgebirge after Willner et al. (Reference Willner, Krohe and Maresch2000) with an inset showing the location in Germany marked by red asterisk. Red box defines the map section of the geological map in (b). (b) Geological map of the area around the Saidenbach reservoir in the central Saxonian Erzgebirge with modern sand sampling locations marked by yellow asterisks. Compared with the map of Schönig et al. (Reference Schönig, von Eynatten, Meinhold and Lünsdorf2019, Reference Schönig, von Eynatten, Meinhold, Lünsdorf, Willner and Schulz2020), an eclogite lens was added in the catchment of sample JS-Erz-8s according to Kossmat & Reinisch (Reference Kossmat and Rheinisch1931).
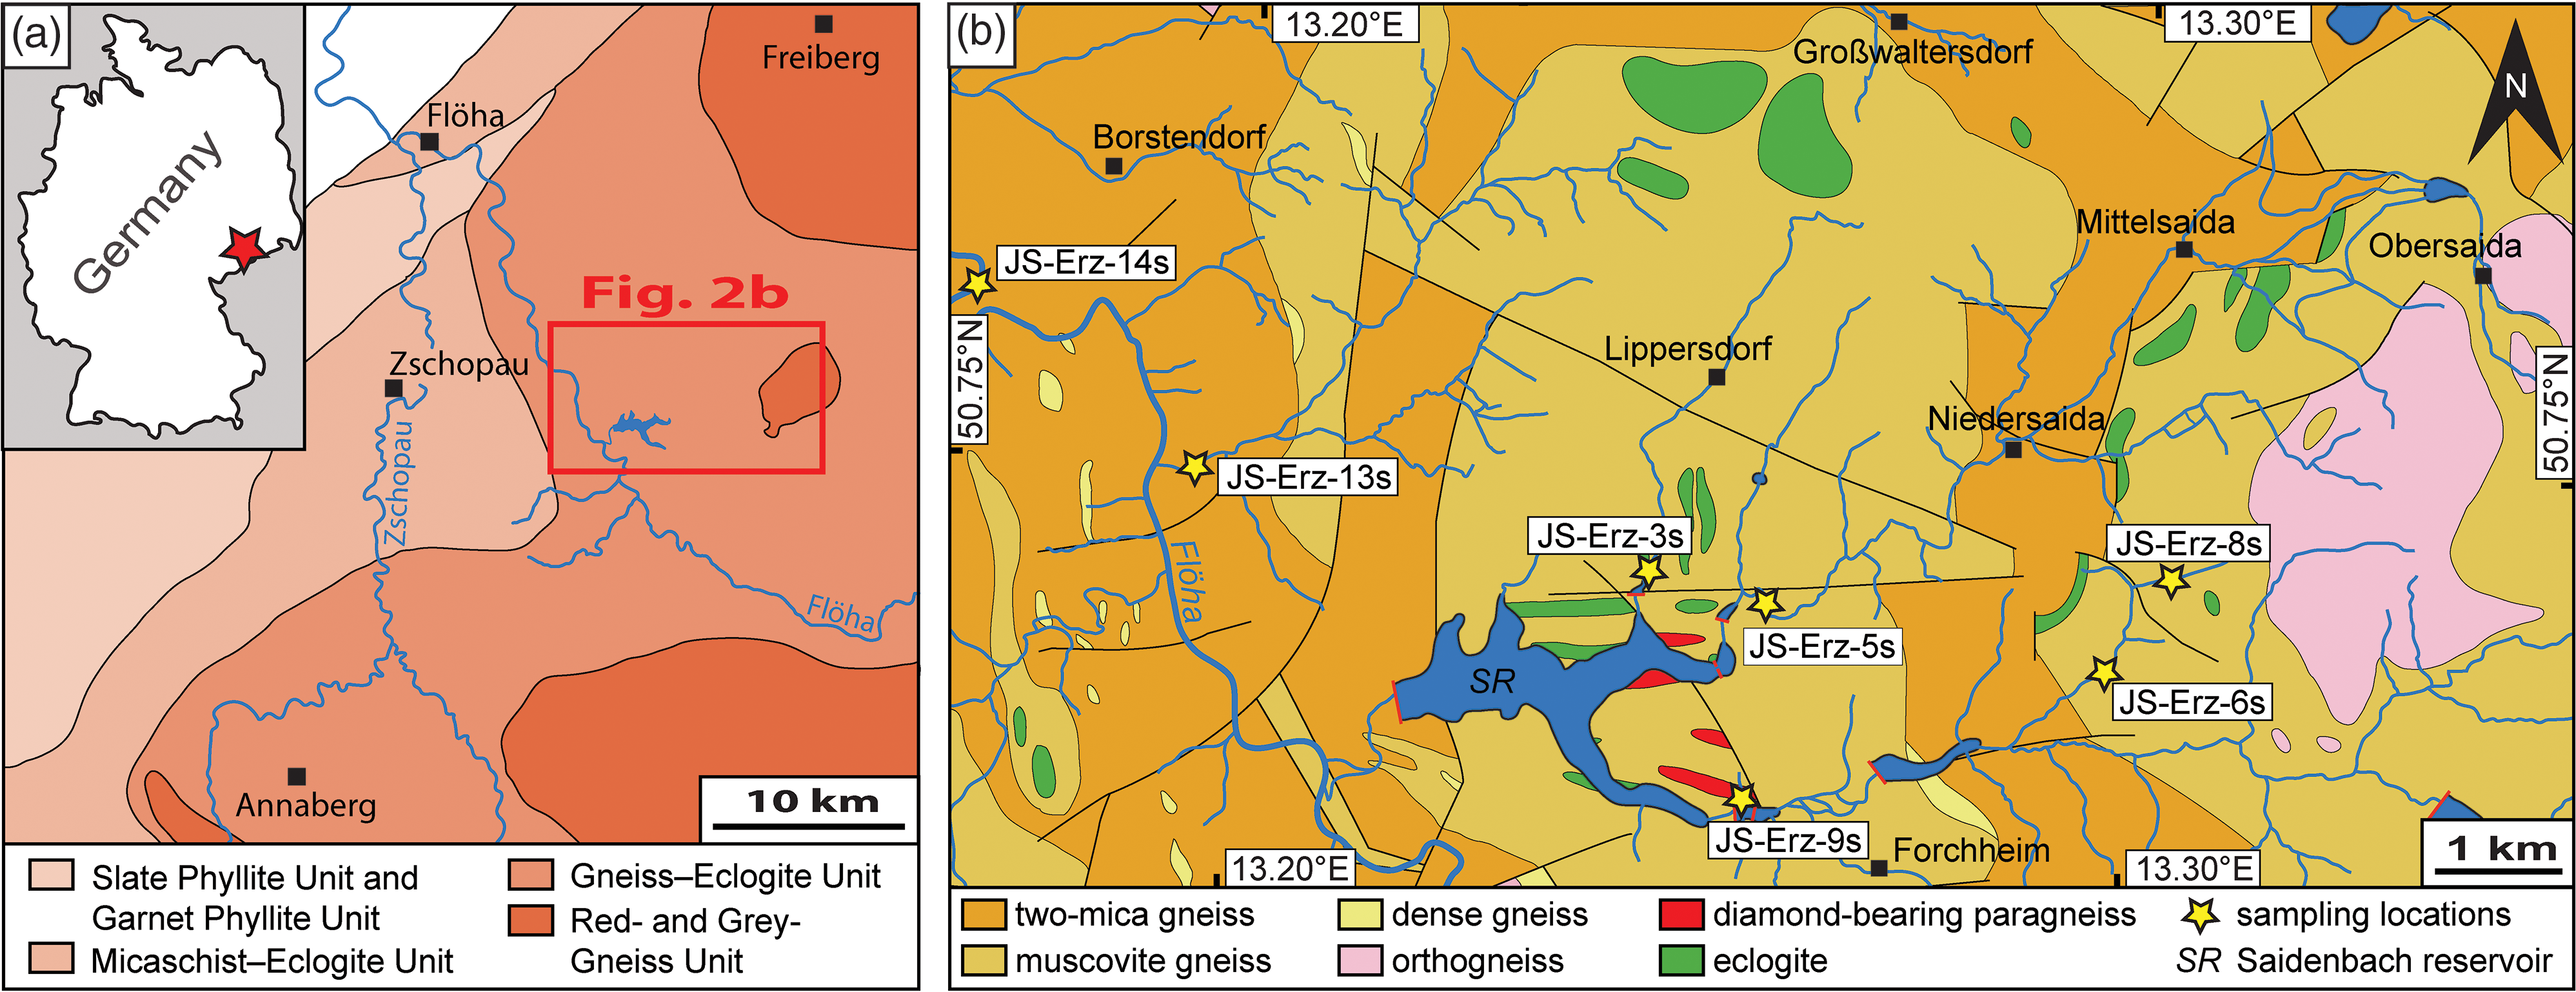
Six modern sand samples are from catchments of tributaries draining the area around the Saidenbach reservoir (JS-Erz-3s, -5s, -6s, -8s, -9s, -13s). These catchments mainly consist of foliated felsic HP country-rock gneiss (Willner et al. Reference Willner, Rötzler and Maresch1997) hosting lenses of eclogite and non-foliated diamond-bearing paragneiss (Fig. 2b; for sampling coordinates see Schönig et al. Reference Schönig, von Eynatten, Meinhold and Lünsdorf2019). As well as diamond inclusions in the paragneiss lenses at the eastern shore of the Saidenbach reservoir (e.g. Nasdala & Massonne, Reference Nasdala and Massonne2000), a UHP stage is also confirmed for some locally occurring eclogite lenses by the presence of coesite or pseudomorphs after coesite (Schmädicke et al. Reference Schmädicke, Okrusch and Schmidt1992; Massonne, Reference Massonne2001; O’Brien & Ziemann, Reference O’Brien and Ziemann2008; Gose & Schmädicke, Reference Gose and Schmädicke2018). However, previous investigations of mineral inclusions in detrital garnet of the sampled catchments revealed that coesite-bearing UHP rocks occur in all studied catchments; they are not solely confined to eclogite and paragneiss lenses, but also include country-rock gneiss which re-equilibrated during high-temperature (HT) exhumation at HP conditions (Schönig et al. Reference Schönig, von Eynatten, Meinhold and Lünsdorf2019, Reference Schönig, von Eynatten, Meinhold, Lünsdorf, Willner and Schulz2020). All lithologies occurring in the six catchments therefore represent a potential source for coesite-bearing garnet grains and can be roughly subdivided into mafic sources, that is, eclogite and felsic sources (i.e. preserved paragneiss lenses), re-equilibrated country-rock gneiss and their partially re-equilibrated intermediate representatives.
The proportion of mafic and felsic sources differs between the investigated catchments. In the small catchment of sample JS-Erz-9s, almost exclusively felsic rocks occur including high proportions of diamond-bearing paragneiss lenses (Fig. 2b). The catchments of samples JS-Erz-8s and JS-Erz-13s also mainly consist of felsic rocks with few eclogite lenses. Eclogites are more prominent in the catchments of samples JS-Erz-3s, JS-Erz-5s and JS-Erz-6s. In contrast to the six samples described above, the seventh modern sand sample JS-Erz-14s was taken from the Flöha main river and comprises a much larger catchment draining an area of > 500 km2. Within the catchment, larger parts of the Gneiss–Eclogite Unit and the surrounding nappes of lower metamorphic grade are drained, that is, the Micaschist–Eclogite Unit and Red- and Grey-Gneiss Unit (Fig. 2a).
3. Methods
The seven modern sand samples were wet sieved to separate grain-size fractions. Heavy minerals from the 63–125, 125–250 and 250–500 µm fractions were separated by centrifugation in sodium-polytungstate with a density of c. 2.85 g cm–3. Heavy mineral concentrates were split by coning and quartering, embedded in one-inch epoxy ring mounts, then grounded and polished over several steps using SiC abrasive paper and Al2O3 abrasive in water suspension, with a final particle size of 0.05 µm.
All analytical methods were performed at the Geoscience Centre of the University of Göttingen. Mineral inclusions ≥ 2 µm in garnet of the embedded heavy mineral concentrates were identified by Raman spectroscopy using a Horiba Jobin Yvon XPloRa Plus spectrometer equipped with an Olympus BX41 microscope at the University of Göttingen. Analytical conditions include a 532 nm excitation laser, a 1800 lines mm–1 grating, a 100× long working distance objective with a numerical aperture of 0.8, a confocal hole diameter of 100 µm and a slit of 100 µm. The aim was to obtain 100 inclusion-bearing garnet grains for each grain-size fraction for each sample, resulting in a range of 108 to 419 screened garnet grains per grain-size fraction of each sample. For a detailed description of the inclusion identification procedure the reader is referred to Schönig et al. (Reference Schönig, Meinhold, von Eynatten and Lünsdorf2018 a).
Two-dimensional Raman images of monomineralic coesite and bimineralic coesite/quartz inclusions were collected with a WITec alpha300R ultra-high-throughput Raman spectrometer. The spectral images were acquired with a 532 nm excitation laser, an automatically controlled laser power of 20 mW, a 300 lines mm–1 grating, and a 100× long working distance objective with a numerical aperture of 0.75. Spectra were collected at a step size of 100–200 nm by an acquisition time of 250 ms. Automated cosmic ray correction, background subtraction, spectral averaging/smoothing and supervised component analysis were performed using the WITec Project software.
Raman spectra of carbonaceous material detected in coesite/quartz inclusions were used to estimate peak temperatures of fluid infiltration. Spectral parameters were determined by applying the automated iterative curve-fitting approach of Lünsdorf & Lünsdorf (Reference Lünsdorf and Lünsdorf2016), whereby the script was slightly modified following the instructions. Based on the determined parameters, peak temperatures were estimated using the reference data series for the 532 nm laser and the geothermometer of Lünsdorf et al. (Reference Lünsdorf, Dunkl, Schmidt, Rantitsch and von Eynatten2017).
The chemical composition of all inclusion-bearing garnet grains was determined with a JEOL JXA 8900 RL electron microprobe equipped with five wavelength-dispersive spectrometers. Samples were coated with carbon to ensure conductivity. Measurement conditions include an accelerating voltage of 15 kV and a beam current of 20 nA. Counting times were 15 s for Si, Mg, Ca, Fe and Al, and 30 s for Ti, Cr and Mn. Measurement spots were preferentially set to the garnet centres but shifted towards the rim when inclusions or fractures were located in the centre. For the coesite- and diamond-bearing garnet grains, nine spots per garnet were set: one at the center, four at the mantle and four at the rim. As coesite- and diamond-bearing garnet grains do not show strong zonation, their compositions were averaged by the arithmetic mean. In addition to compositional evaluation directly based on measured and calculated major-element contents, the multivariate discrimination scheme of Tolosana-Delgado et al. (Reference Tolosana-Delgado, von Eynatten, Krippner and Meinhold2018) was used. Due to the metamorphic character of the study area, the prior probability ‘equal-M’ was applied throughout.
4. Results and discussion
4.a. Garnet chemistry compared with grain size
Compositions of the detrital inclusion-bearing garnet grains are dominated by the iron component with a geometric mean of the molar proportion (XFe) of c. 60%. This is followed by the magnesium component with XMg c. 21% and the calcium component with XCa c. 17%. The proportion of the manganese component is significantly lower with XMn c. 1% and titanium, as well as the chromium component, is subordinate.
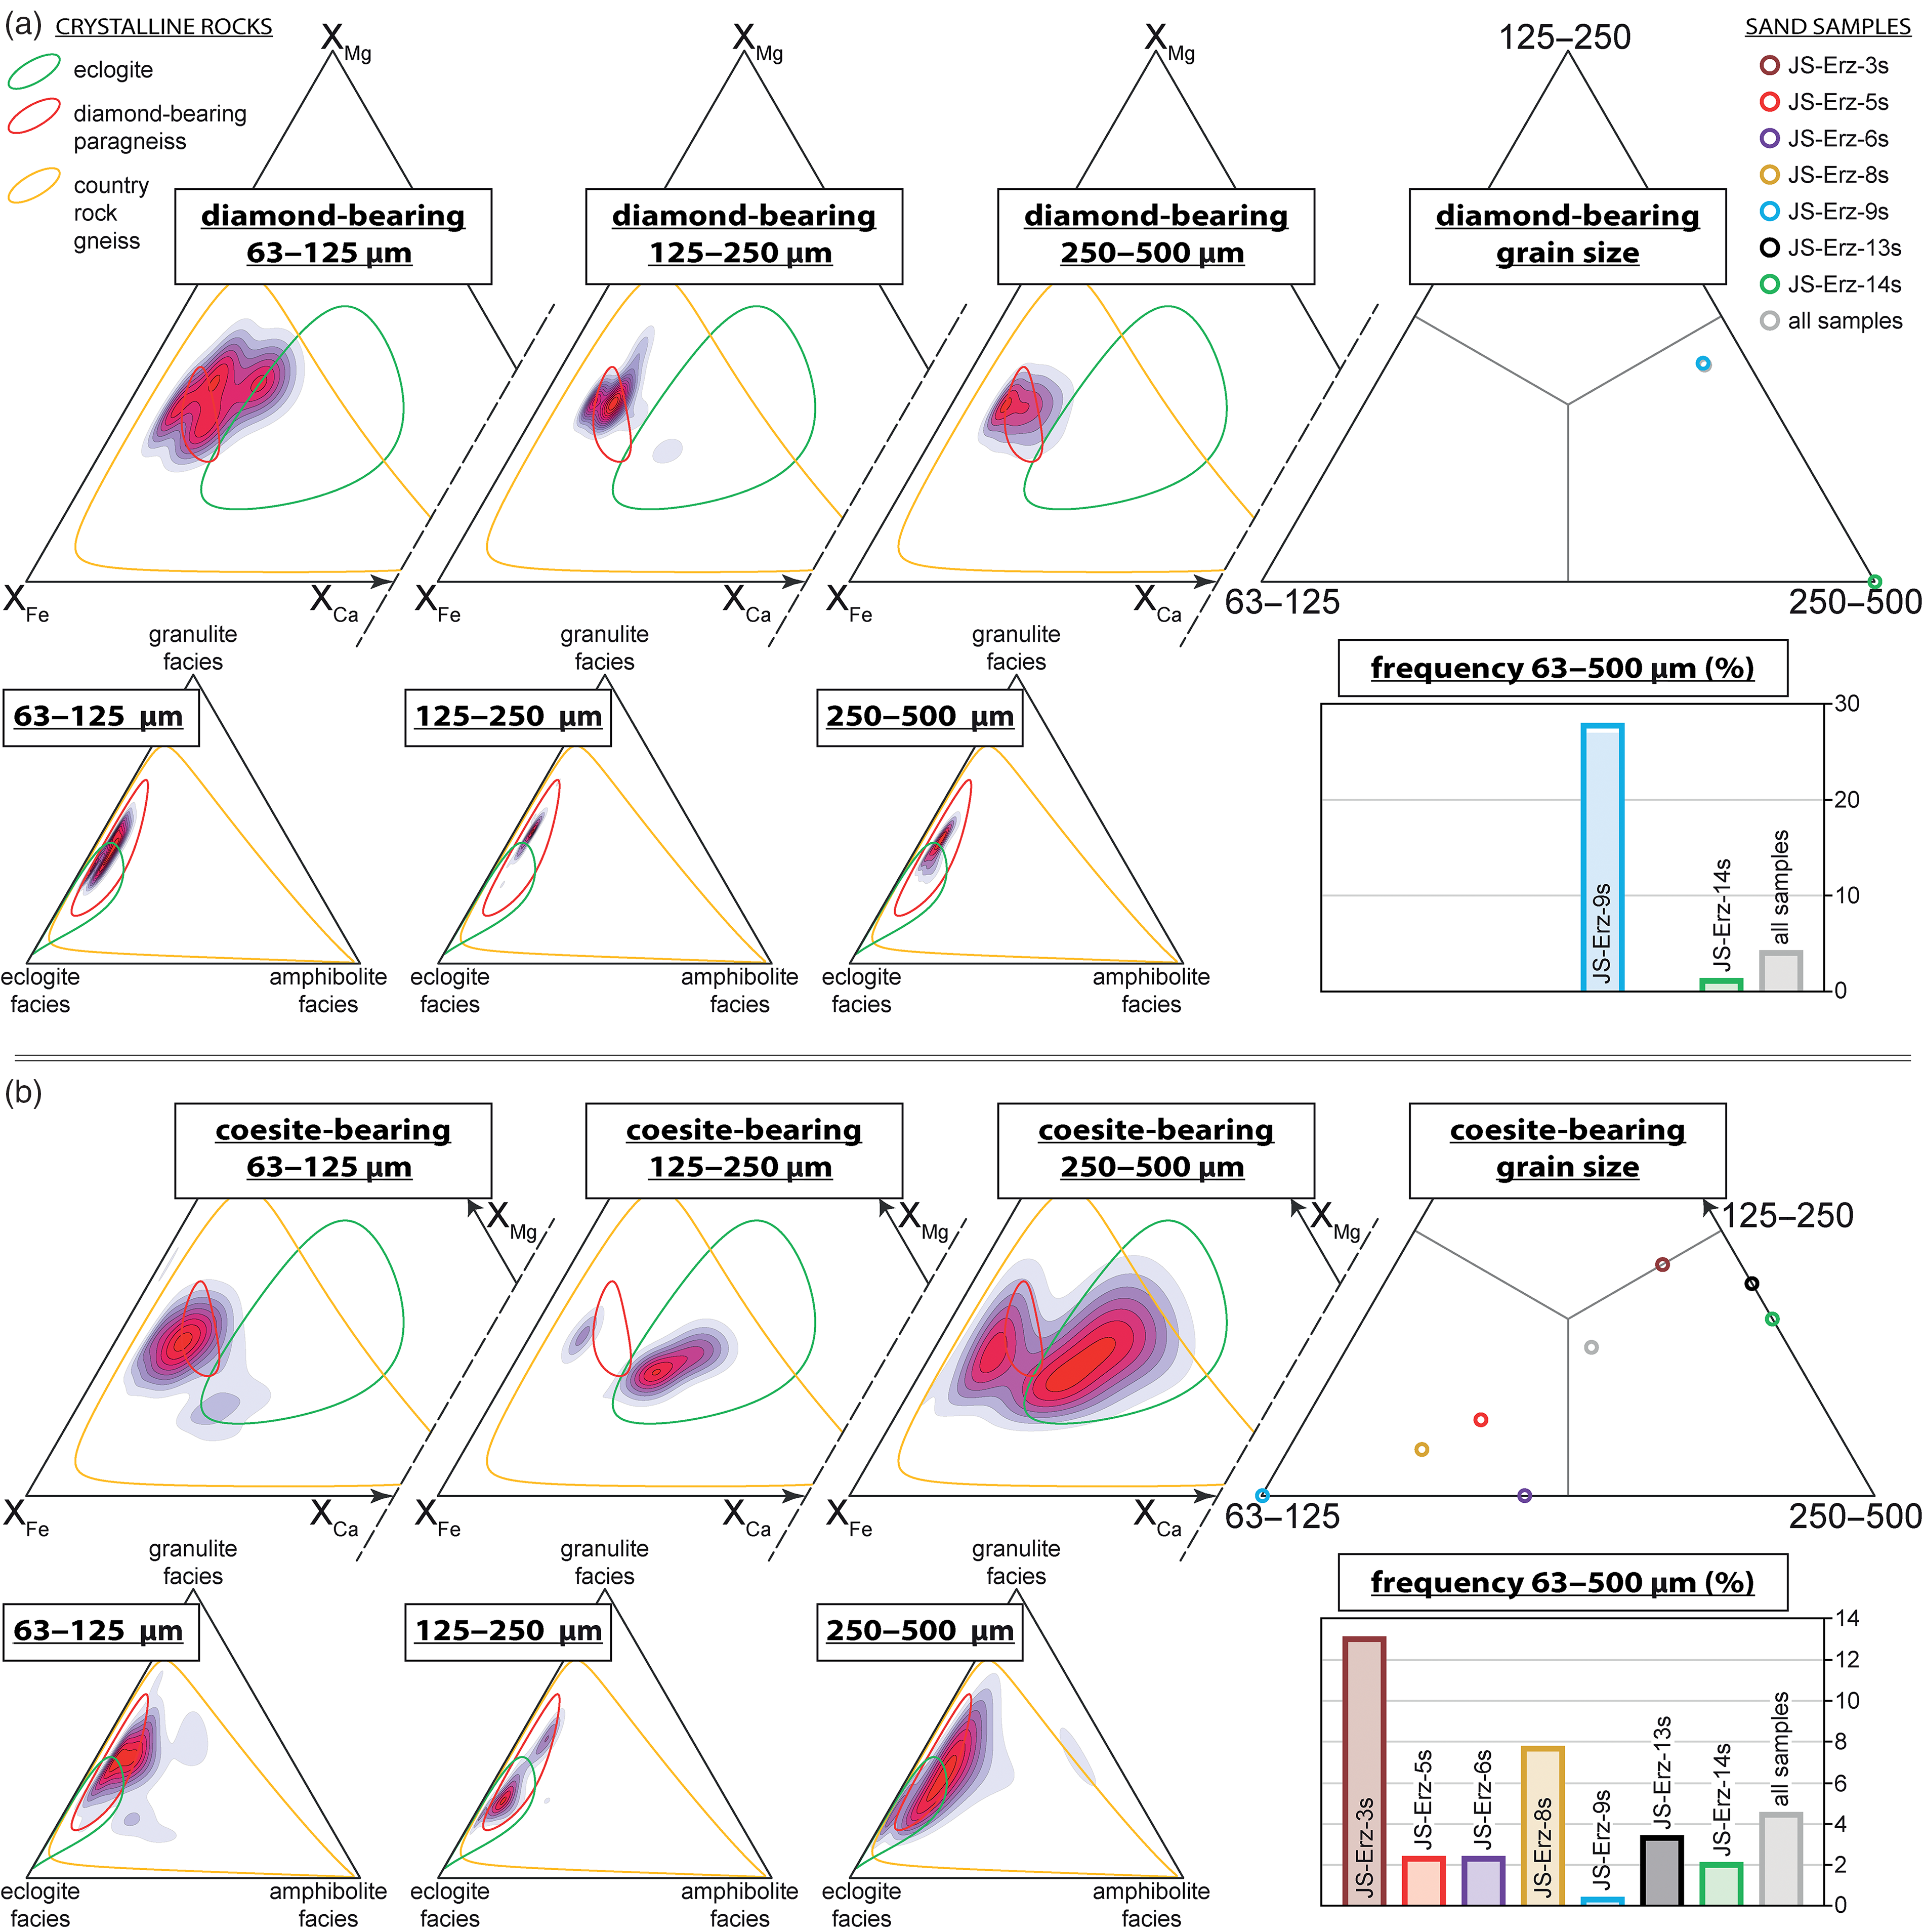
As shown in the ternary kernel density plots of the main components XFe–XMg–XCa and after multivariate discrimination, the majority of detrital inclusion-bearing garnet grains are similar in composition to high-grade metamorphic sources of the area, that is, eclogite and diamond-bearing paragneiss (Fig. 3). By considering the individual grain-size fractions, high-grade metamorphic sources are prominent in all fractions but less pronounced in the 63–125 µm fraction, in particular in terms of an eclogitic affinity.
Composition of inclusion-bearing detrital garnet. Distributions are shown for the three grain-size fractions as kernel density estimate heatmaps in the XFe–XMg–XCa ternary plot and in the probability ternary plot of metamorphic garnet after multivariate discrimination (Tolosana-Delgado et al. Reference Tolosana-Delgado, von Eynatten, Krippner and Meinhold2018). See Supplementary Material SM1 for the dataset (available online at https://doi.org/10.1017/S0016756821000017). In addition, the trends of the geometric means for the individual samples are shown from the 63–125 µm fraction (origin of arrow) via the 125–250 µm fraction to the 250–500 µm fraction (head of arrow). For comparison, garnet composition of local crystalline rocks, compiled by Schönig et al. (Reference Schönig, von Eynatten, Meinhold, Lünsdorf, Willner and Schulz2020), is shown as 95% confidence ellipsoids.

The increasing proportion of garnet grains from high-grade sources with increasing grain size is further reflected by the geometric mean compositions (Fig. 3, grey arrow) with slightly decreasing XFe component and increasing XMg component. This is supported by the multivariate discrimination showing a progressive increase of probabilities for granulite and eclogite facies sources and a pronounced decrease for amphibolite facies sources (Fig. 3). Counter-intuitively, although eclogitic garnet is high in calcium, the geometric mean of the XCa component slightly decreases with increasing grain size. This is caused by two effects. First, from the 63–125 µm fraction to the 125–250 µm fraction, the amount of garnet grains with an eclogitic affinity increases at the expense of grains from the lower-grade (e.g. amphibolite facies) country-rock gneiss. The grains of both eclogitic and country-rock gneiss affinity are rich in XCa, leading to an almost constant geometric mean of XCa from the 63–125 µm to the 125–250 µm fraction. Second, although the amount of garnet grains sourced from the high-grade metamorphic rocks further increases from the 125–250 µm to the 250–500 µm fraction, the amount of garnet sourced from felsic rocks similar to the diamond-bearing paragneiss, which is lower in XCa, exceeds the amount of eclogitic garnet grains, resulting in a slight decrease of the geometric mean of XCa.
In addition to the observations from the entire dataset, the trends of the geometric means for the individual samples with increasing garnet grain size reveal significant contrasts between the samples (Fig. 3, coloured arrows). Most obviously, sample JS-Erz-14s shows an inverse trend to the six other samples with an increase of XFe, and a decrease of XMg and XCa with increasing grain size, characteristic of an increasing amount of garnet grains from lower-grade metamorphic sources. This is well reflected by the multivariate discrimination showing a strong increase in the probability of amphibolite facies sources with increasing grain size. These observations cannot be explained by hydraulic sorting as almandine is the densest garnet end-member (e.g. Babuška et al. Reference Babuška, Fiala, Kumazawa, Ohno and Sumino1978); consequently, it has to be an effect of inherited grain size from source to sink. In contrast to the other samples, the much larger catchment of sample JS-Erz-14s comprises not only rocks from the Gneiss–Eclogite Unit but also from the surrounding lower-grade units (see Section 2). These include micaschist from the Micaschist–Eclogite Unit, which contains abundant iron-rich and magnesium-poor garnet with crystal sizes larger than the analysed grain-size window (Rötzler et al. Reference Rötzler, Schumacher, Maresch and Willner1998; Schumacher et al. Reference Schumacher, Rötzler and Maresch1999). It is therefore likely that the inherited garnet grain size from micaschist sources lead to the enrichment of garnet grains from lower-grade metamorphic sources with increasing grain size in sample JS-Erz-14s. This is in contrast to most of the previous studies and shows that grain-size inheritance effects are variable and strongly control garnet grain-size distributions.
Compared with sample JS-Erz-14s, the garnet composition of sample JS-Erz-13s starts from a similar geometric mean in the 63–125 µm fraction, although slightly higher in XMg and the probability of high-grade sources (i.e. granulite and eclogite facies, Fig. 3), but evolves to higher XMg and higher probabilities of high-grade sources with increasing grain size, agreeing with the absence of micaschists in this catchment (Fig. 2b) and previous studies from HP regions (Fig. 1). Eclogite lenses within the catchment area are minor and, although the number of garnet grains with an eclogitic affinity increases from the 63–125 µm to the 125–250 and 250–500 µm fraction, their low amount compared with garnet grains from high-grade felsic sources leads to a decrease in XCa. The almost complete absence of eclogitic sources and the dominance of high-grade felsic sources is emphasized in sample JS-Erz-9s. Here, garnet mean compositions are exclusively within the 95% confidence ellipsoid of the diamond-bearing paragneiss lenses, and only a very minor increase in XMg and decrease in XCa with increasing grain size is observed (Fig. 3). As well as JS-Erz-9s, JS-Erz-8s also shows compositional geometric means similar to the diamond-bearing paragneiss. However, due to the increase of eclogitic garnet grains from the 63–125 µm to the 125–250 µm grain-size fraction, the geometric mean first increases in XMg and XCa along with the probability of an eclogite facies source; subsequently, XCa and the probability of an eclogite facies source decrease from the 125–250 µm to the 250–500 µm fraction due to the dominance of garnet from high-grade felsic sources. A similar trend can be observed for sample JS-Erz-3s, but XCa and the probability of an eclogite facies source are significantly higher because of the more abundant occurrence of eclogites in the catchment of this sample. As for JS-Erz-3s, samples JS-Erz-5s and JS-Erz-6s show a high XCa component and a high probability of an eclogite facies source that are lower in the 63–125 µm fraction because of garnet from the country-rock gneiss, but continually increase with increasing grain size together with XMg caused by the dominance of eclogitic source rocks.
In summary, the compositions of garnet grains from all catchments solely draining the UHP area reflect an increasing amount of high-grade metamorphic garnet grains with increasing grain size. These garnet grains are dominantly sourced from eclogitic sources in samples JS-Erz-3s, JS-Erz-5s and JS-Erz-6s. In contrast, eclogitic grains are less frequent in JS-Erz-8s and JS-Erz-13s, and even absent from JS-Erz-9s. Garnet compositions of sample JS-Erz-14s show an inverse trend to all other samples, most likely related to the involvement of lower-grade metamorphic source rocks such as micaschist, which shed large garnet crystals. These main observations are in agreement with the geological framework of the area (see Section 2).
4.b. Frequent mineral inclusion types compared with garnet chemistry and grain size
As well as many different inclusion types occurring in minor proportions of the detrital garnet grains (see Supplementary Material SM1, available online at https://doi.org/10.1017/S0016756821000017), the most frequent inclusion types are rutile (in c. 62% of the garnet grains, n = 1.292), zircon (c. 37%, n = 778), apatite (c. 29%, n = 615), quartz (c. 23%, n = 489) and graphite (c. 18%, n = 372). In addition, substantial amounts of garnet grains contain kyanite (c. 11%, n = 230) and omphacite (c. 7%, n = 156). As zircon and apatite inclusions yield very limited information (Schönig et al. Reference Schönig, Meinhold, von Eynatten and Lünsdorf2018 a), we focus here on the main features of rutile-, omphacite-, graphite-, quartz- and kyanite-bearing garnet grains with regard to grain size. A detailed description for each inclusion type is given in Supplementary Material SM2 (available online at https://doi.org/10.1017/S0016756821000017).
The proportion of inclusion-bearing garnet increases with grain size: on average c. 33% in the 63–125 µm fraction, c. 57% in the 125–250 µm fraction and c. 83% in the 250–500 µm fraction. Similarly, rutile-bearing garnet, which resamples the entire compositional range and the distribution of which is independent of source-rock composition, shows enrichment in the coarser grain-size fractions (Fig. 4, Supplementary Fig. SM2a, available online at https://doi.org/10.1017/S0016756821000017). It can therefore be concluded that the amount of garnet containing a specific inclusion type generally increases with increasing grain size, in accordance with the higher analysed garnet volume per grain, making it more likely that the garnet fragment contains a specific inclusion assuming a similar inclusion frequency per volume.
Composition and grain-size distribution detrital garnet containing specific mineral inclusion types. Composition is shown for the entire grain-size range from 63–500 µm as kernel density estimate heatmaps in the XFe–XMg–XCa ternary plots. See Supplementary Material SM1 for the dataset and Supplementary Material SM2 for inclusion frequency and individual plots for each grain-size fraction (available online at https://doi.org/10.1017/S0016756821000017). For comparison, garnet composition of local crystalline rocks compiled by Schönig et al. (Reference Schönig, von Eynatten, Meinhold, Lünsdorf, Willner and Schulz2020) are shown as 95% confidence ellipsoids. Grain-size distributions for the individual samples are illustrated in a ternary plot showing relative proportions for the number grains in each analysed grain-size fraction.

Omphacite co-existing with garnet is the diagnostic mineral assemblage of eclogite-facies metamorphism. Potentially, omphacite-bearing garnet could derive from felsic eclogite-facies rocks but, in the investigated area, omphacite inclusions in garnet as well as symplectites after omphacite in felsic rocks only occur occasionally (Willner et al. Reference Willner, Rötzler and Maresch1997). Omphacite-bearing garnet is therefore an appropriate indicator for the mafic high-grade source rocks (i.e. eclogites), which is supported by their composition almost exclusively matching the 95% confidence ellipsoid for garnet from local eclogite (Fig. 4). In the grain-size distribution plot, it is clearly indicated that garnet-containing omphacite is enriched in the coarse fraction independently of the proportion of eclogite occurring in the catchment. This agrees with previous observations of an increasing metamorphic grade with increasing garnet grain size (Fig. 1), and the typical large garnet crystal size in eclogite leading to a grain-size inheritance effect.
Contrary to omphacite-bearing garnet, garnet containing inclusions of graphite compositionally cover the entire range of local felsic rocks and only marginally overlap with that of eclogite, reflecting the general compositional overlap of felsic and eclogitic rocks (Fig. 4). Graphite inclusions are therefore a characteristic feature of felsic para-metamorphic source rocks. Compared with the grain-size distributions of rutile- and omphacite-bearing garnet, which internally have a similar pattern for almost all samples, graphite-bearing garnet in the individual samples show strong variations regarding grain size. Samples JS-Erz-9s, JS-Erz-13s and JS-Erz-14s show an increase of graphite-bearing garnet with increasing grain size. In contrast, sample JS-Erz-6s in particular but also JS-Erz-3s, JS-Erz-5s and JS-Erz-8s show enrichment of graphite-bearing garnet in the 63–125 µm fraction. Samples containing minor amounts of omphacite-bearing garnet due to the low proportion of eclogitic sources (i.e. JS-Erz-9s, JS-Erz-13s and JS-Erz-14s) show an increase of graphite-bearing garnet with increasing grain size as a result of the larger garnet volume analysed. In contrast, samples containing higher amounts of omphacite-bearing garnet (e.g. JS-Erz-5s and JS-Erz-6s, but also JS-Erz-3s and JS-Erz-8s) show enrichment of graphite-bearing garnet in the 63–125 µm fraction. This dilution effect can be best observed by following the development of omphacite- and graphite-bearing garnet from sample JS-Erz-8s (upstream) to sample JS-Erz-6s (downstream, Fig. 2b). Compared with the other samples, JS-Erz-8s shows an intermediate amount of omphacite-bearing garnet enriched in the coarse fractions and an intermediate amount of graphite-bearing garnet slightly enriched in the fine fraction (Fig. 4). Further downstream the catchment of the sampled creek drains a large eclogite body at its western site, leading to a significant increase of omphacite-bearing garnet in JS-Erz-6s that is strongly enriched in the coarse fraction, and a decrease of graphite-bearing garnet that is highly enriched in the fine fraction.
As graphite-bearing garnet represents the entire range of exclusively felsic sources and its grain-size distribution is highly affected by the proportion of eclogitic source rocks (see above), graphite-bearing garnet is not suitable for evaluating the grain-size distribution of garnet from lower-grade felsic sources, that is, country-rock gneiss, compared with high-grade felsic sources similar to the diamond-bearing paragneiss. For that, the distribution of garnet containing inclusions of quartz and kyanite are more suitable. Both inclusion types are mainly a feature of the felsic sources (e.g. Willner et al. Reference Willner, Rötzler and Maresch1997; Nasdala & Massonne, Reference Nasdala and Massonne2000), which is supported by garnet chemistry from all grain-size fractions (Fig. 4). However, both types also occur subordinately in eclogite (e.g. Schmädicke et al. Reference Schmädicke, Okrusch and Schmidt1992; Gose & Schmädicke, Reference Gose and Schmädicke2018), as supported by smaller populations matching the composition of garnet from local eclogite (Fig. 4). Quartz- and kyanite-bearing garnet therefore mainly represent felsic sources and their grain-size distribution is less affected by varying proportions of eclogitic sources. In addition, detrital garnet composition reveals that the amount of quartz-bearing garnet is more pronounced for lower-grade felsic sources (i.e. country-rock gneisses), whereas the amount of kyanite-bearing garnet is more pronounced for high-grade felsic sources.
The grain-size distribution plots show enrichment of quartz-bearing garnet in the 63–125 µm fraction overcoming the effect of the increasing garnet volume analysed with increasing grain size, except for garnet of sample JS-Erz-9s, which is exclusively shed from homogeneous felsic rocks (Fig. 4). In contrast, kyanite-bearing garnet is clearly enriched in the coarsest fraction. It can therefore be concluded that high-grade metamorphic rocks of both mafic and felsic composition primarily supply large garnet crystals to the sedimentary system, leading to enrichment in the coarser detrital garnet fractions as a result of the inherited grain size from source to sink.
The conclusions drawn so far for the grain-size distribution can be summarized by considering ratios of garnet grains containing the above-discussed inclusion types. First, sample JS-Erz-14s shows the highest value of graphite-/omphacite-bearing garnet in the 125–250 and 250–500 µm fractions, indicating minor amounts of eclogitic garnet and high amounts of felsic garnet (Fig. 5). This ratio is slightly shifted to the finer fractions for JS-Erz-13s as a result of slightly higher amounts of eclogitic garnet (strongly enriched in the 250–500 µm, Fig. 4). The increasing amount of eclogitic sources is indicated by the increasing proportion of the 63–125 µm fraction from sample JS-Erz-3s via JS-Erz-8s and -5s to JS-Erz-6s (Fig. 5). Second, the increasing amount of high-grade felsic sources with increasing garnet grain size, independent of the geological framework of the catchment, is shown by a higher ratio of kyanite-/omphacite-bearing garnet in the coarser fractions compared with quartz-/omphacite-bearing garnet (Fig. 5). This holds for all samples except JS-Erz-8s, which contains less omphacite-bearing garnet than JS-Erz-5s, and the value of kyanite-/omphacite-bearing garnet compared with quartz-/omphacite-bearing garnet does not significantly change with grain size. This implies that JS-Erz-8s is enriched in high-grade felsic garnet in the 63–125 µm fraction.
Ratios of garnet grains containing specific mineral inclusion types in ternary diagrams, reflecting the three grain-size fractions. (a) Ratio of graphite- versus omphacite-bearing garnet. (b) Ratio of quartz- versus omphacite-bearing garnet (origin of arrow) compared with kyanite- versus omphacite-bearing garnet (head of arrow).

4.c. UHP mineral inclusions compared with garnet chemistry and grain size
Apart from the frequent mineral inclusion types, the distribution of garnet grains containing diamond and coesite is of major interest because of their direct relation to the erosion of UHP rocks in the sampled catchments. Garnet containing diamond inclusions is concentrated in sample JS-Erz-9s, while sample JS-Erz-14s contains a single diamond-bearing garnet grain; all other samples lack evidence of the erosion of diamond-bearing lithologies. The composition and mineral inclusion assemblage of inclusion-bearing garnet grains in JS-Erz-9s clearly point to a dominantly felsic origin (see Sections 4.a and 4.b). This agrees with the compositional kernel density distribution of diamond-bearing garnet in all grain-size fractions (Fig. 6a). Although minor amounts of diamond-bearing garnet grains are shed from felsic country rocks and a single diamond-bearing garnet may be derived from an eclogite (Schönig et al. Reference Schönig, von Eynatten, Meinhold, Lünsdorf, Willner and Schulz2020), most of the diamond-bearing garnet grains are derived from the high-grade felsic rocks, that is, diamond-bearing paragneiss lenses. The strong increase in diamond-bearing garnet grains with increasing grain size (Fig. 6a, grain-size plot) can be explained by the increase of high-grade felsic garnet with increasing grain size, being related to inherited grain size, and the larger garnet volume analysed (see Section 4.b).
Composition, grain-size distribution and frequency of (a) diamond- and (b) coesite-bearing detrital garnet. Compositional distributions are shown for the three grain-size fractions as kernel density estimate heatmaps in the XFe–XMg–XCa ternary plots and in the probability ternary plots of metamorphic garnet after multivariate discrimination (Tolosana-Delgado et al. Reference Tolosana-Delgado, von Eynatten, Krippner and Meinhold2018). See Supplementary Material SM1 for the dataset (available online at https://doi.org/10.1017/S0016756821000017). For comparison, garnet composition of local crystalline rocks compiled by Schönig et al. (Reference Schönig, von Eynatten, Meinhold, Lünsdorf, Willner and Schulz2020) is shown as 95% confidence ellipsoids. Grain-size distributions of diamond- and coesite-bearing garnet for the individual samples are illustrated in ternary plots showing relative proportions for the number grains in each analysed grain-size fraction. The frequencies of diamond- and coesite-bearing garnet for the individual samples of the analysed grain-size window of 63–500 µm are shown in bar plots.
For coesite-bearing garnet, the pattern is more complex. Coesite inclusions occur in garnet grains of all analysed samples but the garnet grains show high variation regarding chemistry and grain-size distribution (Fig. 6b). Coesite-bearing garnet composition mostly matches that of felsic sources in the 63–125 µm fraction, while they mostly match that of mafic (i.e. eclogitic) sources in the 125–250 µm fraction. In the 250–500 µm fraction, the composition of coesite-bearing garnet grains shows dense populations for both felsic and mafic sources. In addition, the frequency and especially the grain-size distribution of coesite-bearing garnet is very heterogeneous (Fig. 6b, bar plot and grain-size plot). Conspicuously, some of the samples show enrichment of coesite-bearing garnet in the 63–125 µm fraction (JS-Erz-5s, JS-Erz-6s and JS-Erz-8s), contrast to the small analysed garnet volume and the typical increase of high-grade metamorphic garnet grains with increasing grain size (see Sections 4.a and 4.b). These observations imply a strong control of source-rock composition and initial garnet crystal size. To understand the grain-size distribution of coesite-bearing garnet, a separate evaluation of felsic and mafic grains is therefore necessary.
To assign the individual coesite-bearing garnet grains to their most likely source, that is, felsic or mafic, a step-wise classification is performed by comparing their chemistry and mineral inclusion assemblage with that of garnet from crystalline rocks in the catchment areas (for details, see Supplementary Material SM3, available online at https://doi.org/10.1017/S0016756821000017). In the first four steps, the molar proportions of XCa, XFe and XMg are considered (Fig. 7). For step I, it is reasonable to assume that garnet grains matching the 50% confidence ellipsoid of diamond-bearing paragneiss are of felsic origin, whereas those matching the 50% confidence ellipsoid of eclogite are derived from mafic rocks. For steps II to IV, the box-plots indicate that garnet from local eclogites contains XCa ≥ 0.186, XFe ≤ 0.585 and XMg ≥ 0.180. In contrast, garnet of felsic rocks partially show lower values for XCa and XMg, and are restricted to XFe ≥ 0.449, but partially exceed the upper limit of eclogitic garnet. Based on these limits, 72 out of the 93 coesite-bearing garnet grains (c. 77%) are assigned to their most likely source.
Steps I–IV of the step-wise assignment of coesite-bearing garnet to their most likely source based on garnet composition in molar proportions. Compositions of coesite-bearing grains are shown in the XFe–XMg–XCa ternary plot. For comparison, garnet composition of local crystalline rocks compiled by Schönig et al. (Reference Schönig, von Eynatten, Meinhold, Lünsdorf, Willner and Schulz2020) is shown as 50% (dashed line) and 95% (solid line) confidence ellipsoids. Box-plots show molar proportions of the element considered in the corresponding step.

The 21 remaining coesite-bearing garnet grains after step IV are more difficult to assign as they show a strong overlap with compositions of garnet from both country-rock gneiss and eclogite. To tackle this issue, a principal component analysis was first performed on the unassigned grains. All measured oxide weight percentages were used, except Cr2O3 because of amounts that are exclusively below the detection limit. Prior to analysis, the data were centred log-ratio transformed. Based on the biplot, the log ratios of the variables FeO/(CaO+MgO) and CaO/MgO are most suitable for further analysis (Supplementary Fig. SM3a, available online at https://doi.org/10.1017/S0016756821000017), and are shown in a scatter plot in comparison to mineral inclusion assemblages co-existing with coesite (Fig. 8). Ten of the unclassified grains can be assigned in step V based on: (1) omphacite inclusions indicating a mafic source; (2) graphite inclusions indicating a felsic source; and (3) inclusion assemblages of alkali feldspar, phlogopite–biotite, quartz and cristobalite (see the discussion in Schönig et al. Reference Schönig, von Eynatten, Meinhold, Lünsdorf, Willner and Schulz2020) dominantly occurring in coesite-bearing garnet assigned to a felsic source.
Steps V and VI of the step-wise assignment of coesite-bearing garnet to their most likely source based on log-ratio plots, in comparison with mineral inclusion assemblages. Log-ratios are chosen based on the principal component analysis biplot shown in Figure SM3a (see Supplementary Material SM3, available online at https://doi.org/10.1017/S0016756821000017). For comparison, garnet composition of local crystalline rocks compiled by Schönig et al. (Reference Schönig, von Eynatten, Meinhold, Lünsdorf, Willner and Schulz2020) are shown as 95% confidence ellipsoids with colours similar to those used in Figure 7.

From the remaining 11 unassigned coesite-bearing grains, five show a compositional contrast to local eclogite and compositions similar to garnet previously assigned to a felsic source (Fig. 8). These five grains are assigned to a felsic source in step VI, leading to a total of 87 out of the 93 coesite-bearing garnet grains (c. 94%) assigned to their most likely source. From these 87 grains, 66 (c. 76%) were assigned to a felsic and 21 (c. 24%) to a mafic source. For the six unassigned coesite-bearing grains, there are only subordinate indications with regard to source-rock composition; whether the six remaining garnet grains are assigned to a felsic or a mafic source yields only negligible differences in the grain-size pattern of coesite-bearing garnet (see Supplementary Fig. SM3c, available online at https://doi.org/10.1017/S0016756821000017). We therefore use the c. 94% of coesite-bearing garnet grains confidently assigned. Their frequency and grain-size relations for the seven sediment samples are shown in Figure 9.

Figure 9b shows that mafic coesite-bearing garnet is only present in JS-Erz-3s, JS-Erz-6s and JS-Erz-13s. Because the other samples also show a contribution from eclogitic source rocks as expressed by omphacite-bearing garnet (Fig. 4), this implies that eclogite lenses of the area contain coesite less frequently than the felsic lithologies. Compared with the low amounts in JS-Erz-6s in the eastern part of the studied area, mafic coesite-bearing garnet frequently occurs in samples north of the Saidenbach reservoir (JS-Erz-13s and especially JS-Erz-3s), although JS-Erz-6s show a significantly higher input of garnet from eclogite (Fig. 4). However, because of the presence of mafic coesite-bearing garnet in JS-Erz-6s and the frequent occurrence of felsic coesite-bearing garnet, the generally lower amount of mafic coesite-bearing garnet in the eastern part of the study area is probably related to a lack of free silica in the eastern eclogites at UHP metamorphic conditions, as proposed for many UHP eclogites (e.g. Carswell & Zhang, Reference Carswell and Zhang1999; Tsai & Liou, Reference Tsai and Liou2000), rather than lower-pressure, peak metamorphic conditions below the coesite stability field. Regarding grain size, all grains of mafic affinity are strongly enriched in the coarse fractions and none of them occurs in the 63–125 µm fraction (Fig. 9b). This agrees with the increase of high-grade mafic garnet with increasing grain size due to grain-size inheritance from source to sink (see Section 4.b).
Felsic coesite-bearing garnet occurs in all samples (Fig. 9a). Notably, although diamond inclusions frequently occur in garnet of sample JS-Erz-9s, only one garnet of the sample contains coesite in a polyphase inclusion together with quartz, graphite and rutile. Discussing the virtual absence of coesite in the diamond-bearing paragneiss is beyond the scope of this paper, but probably relates to: diamond crystallization from an entrapped fluid/melt (as implied from the frequent polyphase inclusions); the pressure conditions after diamond crystallization within the melt inclusions, which strongly differ from external metamorphic conditions; no further garnet growth during exhumation through the coesite stability field; and/or coesite replacement by quartz during exhumation.
The felsic coesite-bearing garnet grains show a much more complex and heterogeneous grain-size distribution compared with mafic garnet (Fig. 9). First of all, felsic coesite-bearing garnet occurs in the 250–500 µm fraction of all samples, suggesting an initially large garnet crystal size (Fig. 9a). Nevertheless, an increase of coesite-bearing garnet with increasing grain size is only observed in the northern samples (JS-Erz-3s, JS-Erz-13s) and sample JS-Erz-14s from the largest catchment, the Flöha River. Notably, in JS-Erz-14s, the increase with increasing grain size even overcomes the strong dilution by lower-grade metamorphic garnet in the coarse fraction of this sample (see Sections 4.a and 4.b). In contrast, the eastern samples JS-Erz-5s, JS-Erz-6s and JS-Erz-8s show an increase of felsic coesite-bearing garnet with decreasing grain size. This enrichment in the fine fraction even overcomes that of graphite- and quartz-bearing garnet (Fig. 4), and calls for an additional process apart from the dilution effect of felsic garnet in the coarse fraction due to the increasing contribution of mafic garnet. The increase with decreasing grain size is most prominent in JS-Erz-8s, the only sample where the ratios of quartz-/omphacite-bearing and kyanite-/omphacite-bearing garnet do not significantly differ with grain size (Fig. 5b). All these observations imply that high-grade felsic garnet grains in JS-Erz-8s started with an initially large garnet size, in particular those containing coesite, but strongly disintegrated into smaller fragments during exhumation, weathering and/or sedimentary transport. This also affected, to a smaller extent, the garnet of sample JS-Erz-5s. The grain size of felsic coesite-bearing garnet in JS-Erz-6s (downstream) mainly resembles that of JS-Erz-8s (upstream) which becomes further diluted by the high proportion of eclogitic garnet (see Section 4.b).
In summary, diamond-bearing garnet grains are of felsic affinity, occur only locally and show a strong increase in abundance with increasing grain size. Garnet grains containing coesite are sourced from both mafic and felsic rocks, but felsic coesite-bearing grains are more frequent than mafic (ratio c. 3:1). Both felsic and mafic coesite-bearing garnet grains were initially large. While this leads to a strong increase of mafic coesite-bearing garnet with increasing grain size, this trend is observed only for felsic coesite-bearing garnet grains from catchments north of the Saidenbach reservoir. East of the reservoir, in particular for sample JS-Erz-8s, felsic coesite-bearing garnet also shows an initial large crystal size, but the grains strongly disintegrated from source to sink, leading to increasing abundance with decreasing grain size.
4.d. Coesite preservation: the role of inclusion size and fluid availability
As well as metamorphic conditions below the coesite stability field, reaction kinetics primarily control whether coesite will be preserved or replaced by quartz (e.g. Mosenfelder et al. Reference Mosenfelder, Schertl, Smyth and Liou2005). Fluid availability is a necessary pre-condition to enable the coesite-to-quartz transformation as shown by the occasional preservation of matrix coesite under completely dry conditions (Liou & Zhang, Reference Liou and Zhang1996; Liu et al. Reference Liu, Massonne, Zhang, Wu and Jin2017). In the presence of moderate amounts of fluid (c. 0.04 wt%) and temperatures ≥ 375°C, coesite crystals of c. 100 µm will be completely replaced by quartz within < 1 Ma (Mosenfelder & Bohlen, Reference Mosenfelder and Bohlen1997). Numerous studies of a wide compositional range of crystalline UHP rocks have reported coesite relicts in the centre of bimineralic coesite/quartz inclusions, resulting from the partial coesite-to-quartz transformation during exhumation. These bimineralic inclusions typically show radial fractures originating from the host/inclusion boundary and spreading out into their host mineral. For relatively ‘stiff’ host minerals such as garnet (compared with relatively ‘soft’ coesite, e.g. Ferrero & Angel, Reference Ferrero and Angel2018), the fracturing results from the development of non-lithostatic strains and stresses during exhumation due to the different thermoelastic properties of garnet and coesite. The fractures enable metamorphic fluids to infiltrate the coesite inclusions, which were previously shielded from the external conditions by their nominally anhydrous host minerals such as garnet, facilitating the coesite-to-quartz transformation. Considering the fast reaction kinetics, although exhumation rates of UHP terranes such as the central Erzgebirge are extremely high, the partial preservation of coesite within the inclusions calls for a rather late fracturing, that is, at low temperatures, where reaction kinetics are becoming slow and inhibited shortly thereafter (Mosenfelder, Reference Mosenfelder2000).
Fractures in garnet originating from coesite inclusions represent weakness zones and the higher the amount of coesite being transformed to quartz, the more fractures will develop and the wider the fractures will be due to the volume increase during transformation. For the disintegration process of coesite-bearing garnet, it is therefore of major importance (1) whether coesite inclusions fractured their host garnet; (2) whether fluids were present, enabling their transformation to quartz; and (3) at which temperatures fracturing occurred, controlling the reaction kinetics and available time span. Based on the findings of monomineralic coesite inclusions < 12 µm in detrital garnet, Schönig et al. (Reference Schönig, Meinhold, von Eynatten and Lünsdorf2018 b) supposed that inclusion size may be an important factor for coesite preservation.
To evaluate the role of inclusion size with regard to coesite preservation on a significantly larger number of observations, 192 of the 193 detected coesite inclusions were analysed regarding their size and the presence of quartz (one coesite inclusion in JS-Erz-9s was excluded because of its polyphase inclusion character). For the vast majority, the results were confirmed by high-resolution two-dimensional Raman imaging. Figure 10 shows the relation between monomineralic coesite inclusions and bimineralic coesite/quartz inclusions in terms of inclusion size. Results are shown in form of a histogram (bars) with logarithmic kernel density estimates (lines), and selected Raman images of the inclusions ordered as a function of their size (all at the same scale; for further examples see Supplementary Fig. SM4, available online at https://doi.org/10.1017/S0016756821000017). Monomineralic coesite inclusions are dominant (c. 82%). As shown by the kernel density estimate, inclusions with their long axis < 9 µm are primarily monomineralic coesite, whereas larger inclusions are primarily bimineralic coesite/quartz. However, the transition from a primarily monomineralic to a primarily bimineralic character is rather smooth and both types occur in the range of 5.5–21.0 µm. This transition range may be narrowed to 7.5–15.0 µm by excluding the two largest monomineralic inclusions and the smallest bimineralic inclusion, as they seem exceptional compared with the general distribution (Fig. 10, histogram). In addition, under the microscope, the smallest bimineralic inclusion (Fig. 10, green asterisk) seems to be connected to a larger bimineralic inclusion by a fine fracture. Its bimineralic character may therefore originate from a connection to external fluids by the fracture developed from the larger inclusion next to it.
Monomineralic coesite and bimineralic coesite/quartz inclusions compared with inclusion size. The upper diagram shows a histogram and kernel density estimates of all coesite inclusions, except one inclusion of sample JS-Erz-9s because of its polyphase character. Two-dimensional Raman images show a selection of coesite inclusions at the same scale, ordered by inclusion size. Colours correspond to Raman mode intensities of the garnet (red), coesite (yellow) and quartz (blue) components. Coloured asterisks mark specific inclusions used as examples in the main text, which are referenced at the corresponding section.
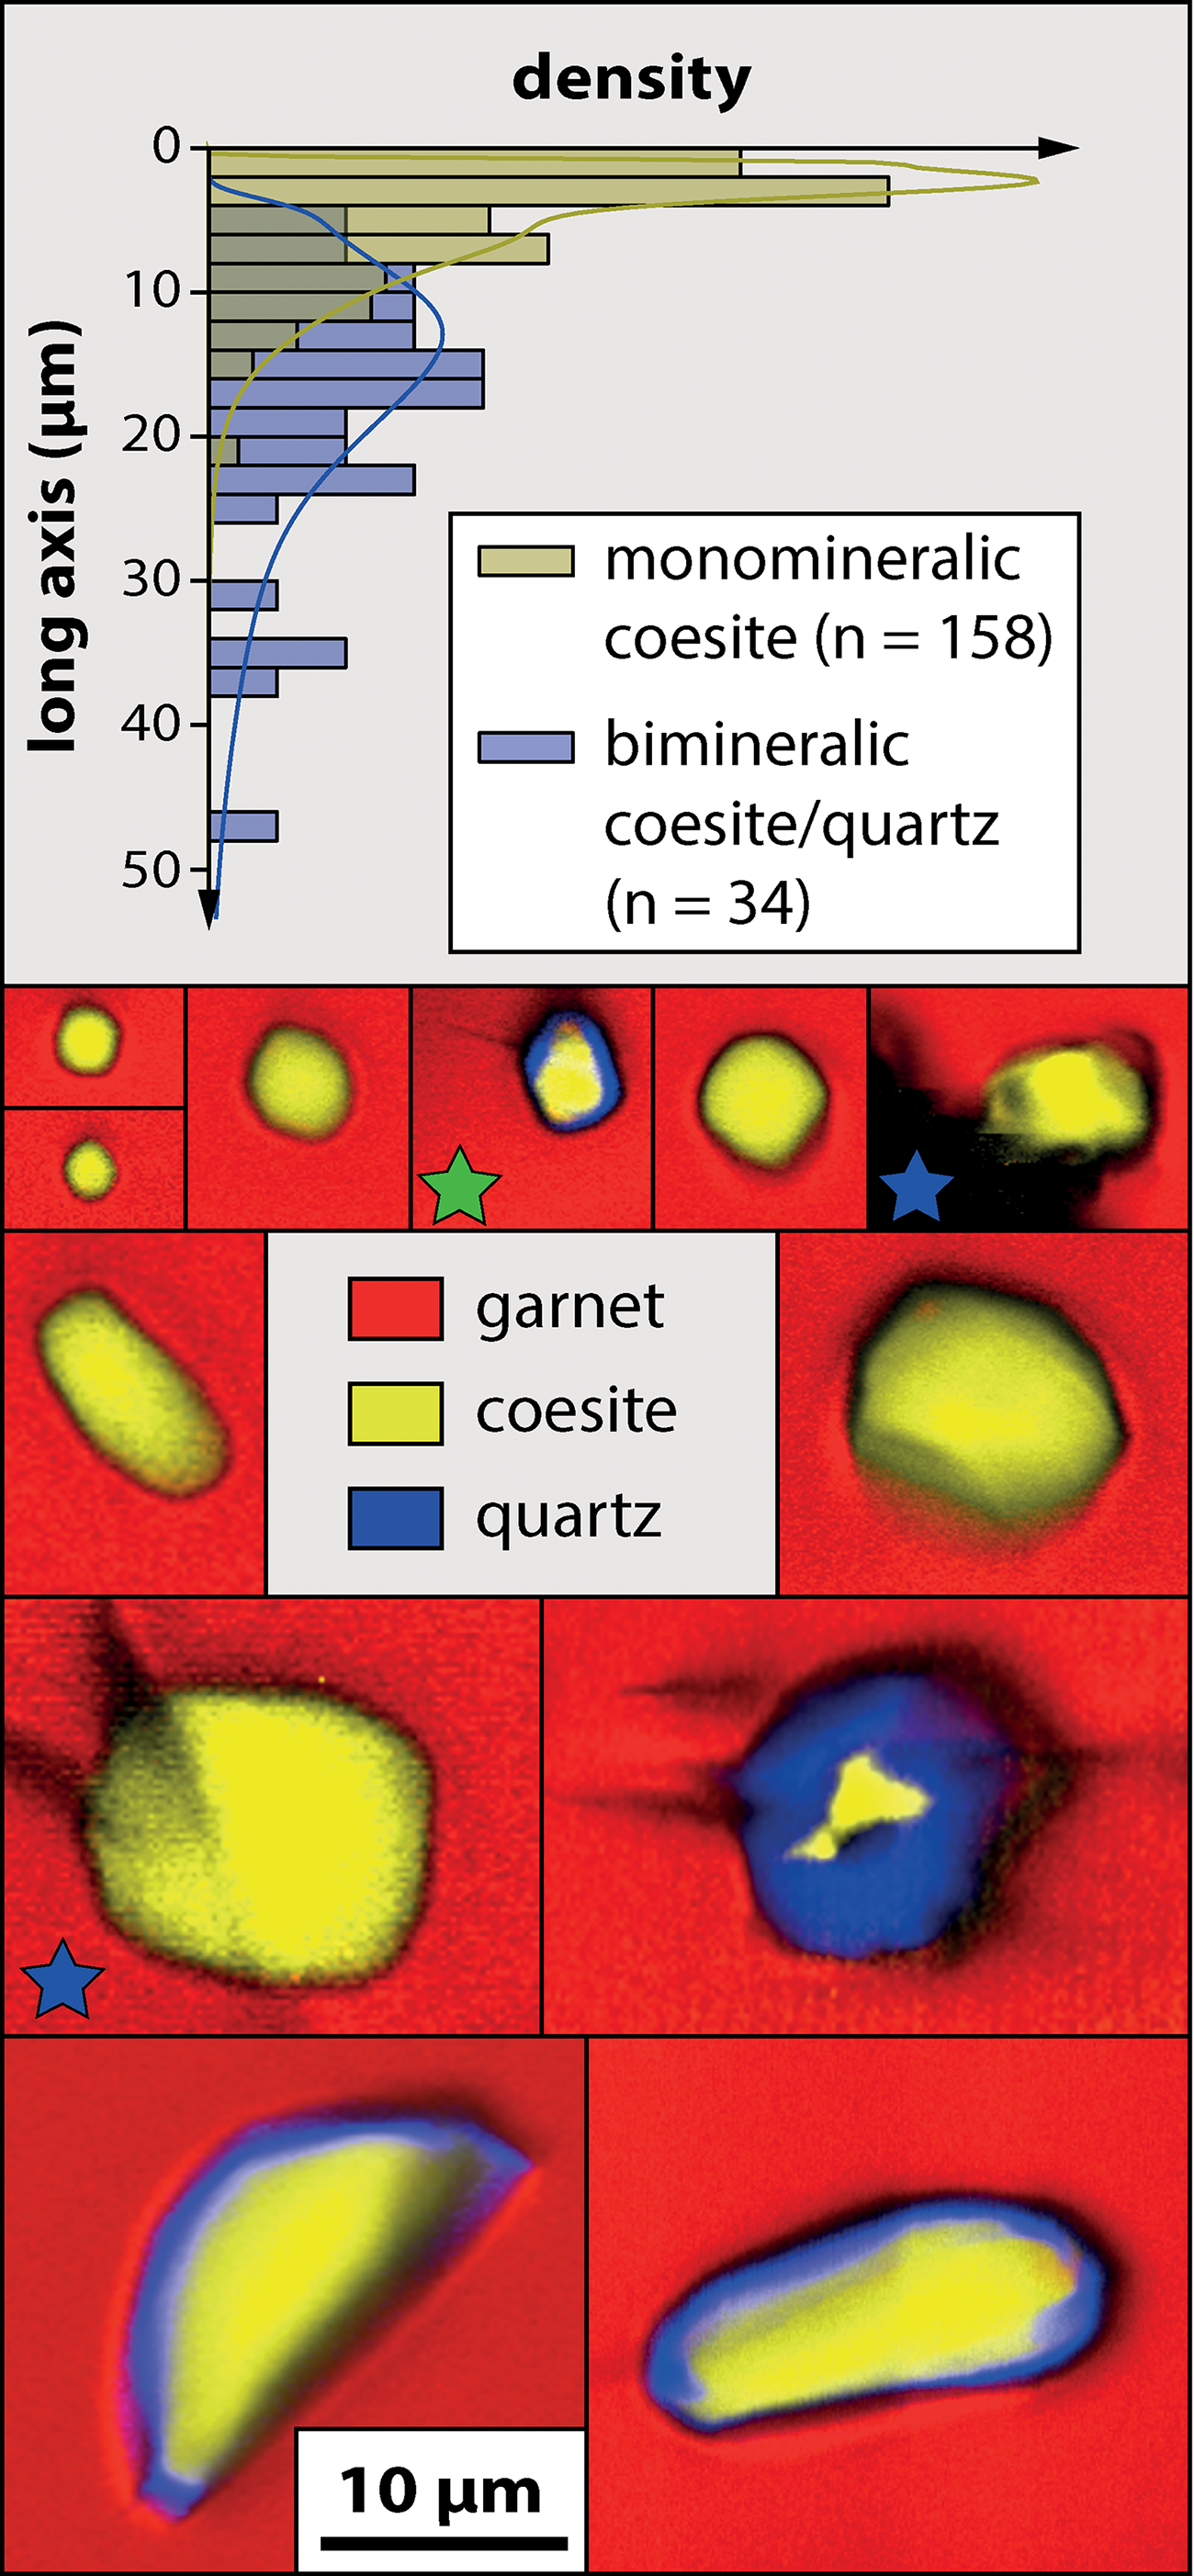
Although monomineralic and bimineralic inclusions occur in a rather large size range, the size seems to be related to the specific garnet where they are entrapped. From the 93 coesite-bearing garnet grains, 10 contain monomineralic as well as bimineralic inclusions, and in each of these grains the bimineralic inclusions are always larger than the monomineralic inclusions. As an example, garnet grains number 55 and number 75 from the coarse fractions of samples JS-Erz-14s and JS-Erz-6s are shown in Figure 11a and b, respectively (for another example see Schönig et al. Reference Schönig, von Eynatten, Meinhold and Lünsdorf2019, fig. 2). Reasons for the varying inclusion size where the coesite inclusions start to fracture their host garnet and (partially) transform into quartz can be diverse. These may be related to various combinations of: (1) slightly diverging thermoelastic properties of the host garnet grains due to compositional differences (e.g. Milani et al. Reference Milani, Nestola, Alvaro, Pasqual, Mazzucchelli, Domeneghetti and Geiger2015, Reference Milani, Angel, Scandolo, Mazzucchelli, Ballaran, Klemme, Domeneghetti, Miletich, Scheidl, Derzsi, Tokár, Prencipe, Alvaro and Nestola2017); (2) different pressure–temperature conditions during entrapment, predefining the highest attainable strain within the inclusion (e.g. Rosenfeld & Chase, Reference Rosenfeld and Chase1961; Angel et al. Reference Angel, Nimis, Mazzucchelli, Alvaro and Nestola2015); (3) anisotropic strains, in particular, due to the monoclinic symmetry of coesite and/or varying inclusion shape (Campomenosi et al. Reference Campomenosi, Mazzucchelli, Mihailova, Scambelluri, Angel, Nestola, Reali and Alvaro2018; Mazzucchelli et al. Reference Mazzucchelli, Burnley, Angel, Morganti, Domeneghetti, Nestola and Alvaro2018; Murri et al. Reference Murri, Mazzucchelli, Campomenosi, Korsakov, Prencipe, Mihailova, Scambelluri, Angel and Alvaro2018); (4) inclusion strain reduction due to viscous relaxation (e.g. Zhong et al. Reference Zhong, Moulas and Tajčmanová2020); and (5) fluid availability (Mosenfelder et al. Reference Mosenfelder, Schertl, Smyth and Liou2005).
Photomicrographs and Raman images of selected garnet grains and coesite inclusions. Colours in Raman images correspond to mode intensities of garnet (red), coesite (yellow), quartz (blue), embedding medium (white), H2O (pink) and carbonaceous material (green). (a) Garnet number 55 from the 250–500 µm fraction of sample JS-Erz-14s showing the inclusion-size dependence on the monomineralic versus bimineralic state. (b) Garnet number 75 from the 250–500 µm fraction of sample JS-Erz-6s, again showing the inclusion-size dependence and the presence of H2O in bimineralic inclusions. (c) Several examples of bimineralic coesite/quartz inclusions containing water at fractures and the inclusion/host boundary and the corresponding H2O Raman spectra. (d) Bimineralic coesite/quartz inclusions containing carbonaceous material at the inclusion/host boundary and the corresponding Raman spectra with peak temperature estimates after Lünsdorf et al. (Reference Lünsdorf, Dunkl, Schmidt, Rantitsch and von Eynatten2017). Colours of asterisks in the Raman images correspond to colours of the Raman spectra.

The importance of available fluids for enabling the coesite-to-quartz transformation is highlighted by the presence of H2O in filigree fractures and at the inclusion/host boundary of several bimineralic coesite/quartz inclusions (Fig. 11b, c, pink component). Even more importantly, carbonaceous material was observed in some bimineralic inclusions, indicating the infiltration by a carbonaceous fluid (Fig. 11d, green component). The Raman spectrum allows the peak temperatures of the carbonaceous material precipitated from the infiltrated fluid to be estimated. By applying the thermometer of Lünsdorf et al. (Reference Lünsdorf, Dunkl, Schmidt, Rantitsch and von Eynatten2017), carbonaceous material in two bimineralic coesite/quartz inclusions of Figure 11d give peak temperatures of 321°C and 341 ± 36°C, respectively. In addition, although the signal-to-noise ratio of the Raman spectrum of carbonaceous material in another bimineralic inclusion does not allow temperature calculations, its pattern qualitatively points to similar temperatures. This shows that partially transformed coesite inclusions fractured their host garnet at a late exhumation state. Based on the experiments of Mosenfelder & Bohlen (Reference Mosenfelder and Bohlen1997), reaction kinetics slow down by two orders of magnitude from c. 375°C to c. 320°C. For the preservation of coesite, small differences in the timing (i.e. temperature) of garnet fracturing are therefore crucial.
In summary, coesite inclusion size represents a primary factor that controls whether the host garnet will be fractured during exhumation and at which temperatures the fracturing takes place. This in turn controls the temperature at which fluids are able to infiltrate the coesite inclusions, the reaction kinetics and the time left for the coesite-to-quartz transformation. Even small differences in the timing of fracturing and fluid infiltration have significant consequences for the proportion of coesite being transformed into quartz. Although the critical inclusion size for garnet fracturing is well-defined for individual grains, it shows a rather large range considering the entire detrital coesite-bearing garnet record. Considering all the additional factors in detail is beyond the scope of this study; however, all these factors are related to the composition and metamorphic evolution of the initial coesite-bearing host rock.
4.e. Source-rock- and catchment-specific coesite inclusion characteristics
Fractures originating from coesite inclusions lead to a disintegration of the initially large garnet grains from UHP source rocks into smaller fragments. This disintegration process is most intense for bimineralic coesite/quartz inclusions, whereby the fractures often form the detrital garnet surface (e.g. Fig. 11a). However, several monomineralic coesite inclusions also show fractures promoting the disintegration of garnet (e.g. Fig. 10; Supplementary Fig. SM4, blue asterisks, dark contrasts, available online at https://doi.org/10.1017/S0016756821000017). Thus, the higher the amount of coesite inclusions per detrital garnet grain and the more of these inclusions transformed to quartz (partially or completely), the higher the degree of garnet disintegration.
To evaluate the disintegration process of coesite-bearing garnet from mafic and felsic sources as well as for the individual catchments, Figure 12 shows logarithmic kernel density estimates for monomineralic versus bimineralic inclusions with regard to the sample and assigned source. Bar-plots show the accompanying density of coesite inclusions, that is, the average number of coesite inclusions per coesite-bearing garnet grain, for the entire 63–500 µm fraction and for each of the individual three grain-size fractions. For comparison, grey vertical lines indicate the intersection of monomineralic versus bimineralic kernel density estimates for all coesite-bearing garnet grains at c. 9 µm and the accompanied density of coesite inclusions of c. 2.1 per coesite-bearing garnet.
Distribution of monomineralic coesite versus bimineralic coesite/quartz inclusions and inclusion frequency with regard to the individual sample and assigned source. Left side shows logarithmic kernel density estimates. Right side shows bar-plots of the accompanied frequency of coesite inclusions, that is, the average number of coesite inclusions per coesite-bearing garnet grain. For comparison, grey vertical lines indicate the intersection of monomineralic versus bimineralic kernel density estimates for all coesite-bearing garnet grains and the accompanied frequency of coesite inclusions. Vertical lines are also shown for felsic (red) and mafic (green) coesite-bearing garnet.

In comparison to all coesite-bearing garnet grains, the changeover from a primary monomineralic to a primary bimineralic state occurs at c. 3 µm larger inclusion size for mafic coesite-bearing garnet (Fig. 12, left side, green line). As samples JS-Erz-6s and JS-Erz-13s contain only very few mafic coesite-bearing grains, this mainly reflects the characteristics from sample JS-Erz-3s, where mafic coesite-bearing garnet is frequent. The bar-plots furthermore show that the mafic grains contain less coesite inclusions per grain compared with all coesite-bearing garnet grains (Fig. 12, right side, green line), and that the number of coesite inclusions per grain increases with increasing grain size. Consequently, the low inclusion density, the late fracturing of the host garnet (i.e. inclusions have to be large and the temperature has to be low) and therefore the lower potential of coesite inclusions to transform into quartz inhibit a strong disintegration of mafic coesite-bearing garnet. This results in enrichment in the coarser detrital fractions compared with the fine fraction as observed in Figure 9b, and an increasing number of coesite inclusions with increasing grain size due to the higher analysed garnet volume.
In contrast to mafic garnet, the changeover from the monomineralic to bimineralic state for felsic coesite-bearing garnet occurs at a significantly smaller inclusion size (Fig. 12, left side, red line). In addition, the inclusion density is higher (Fig. 12, right side, red line) and increases with decreasing grain size. However, there are strong differences between the individually sampled catchments.
Samples JS-Erz-6s and JS-Erz-8s from the eastern part of the study area, which are both strongly enriched in coesite-bearing garnet in the fine fraction (Fig. 9a), show a changeover from the monomineralic to the bimineralic state at even smaller inclusion sizes than the average of felsic garnet grains. This is accompanied by the highest number of coesite inclusions per grain observed in these samples (Fig. 12). Moreover, the fact that much more coesite inclusions per grain occur in the finest fraction, although the analysed volume is the smallest, indicate a felsic source rock with a large initial garnet crystal size and varying coesite inclusion density, whereby those garnets with the highest coesite inclusion density preferentially disintegrated into smaller fragments. Notably, the proportion of bimineralic inclusions in garnet of the two samples is rather low at c. 10 and 11%, respectively. This seems counterintuitive at first instance. However, considering that coesite inclusions fractured their host garnet at higher temperatures, at which reaction kinetics are much faster, and also that small inclusions that fractured their host garnet have much less volume of coesite to be replaced by quartz, most coesite inclusions that were infiltrated by fluids probably completely transformed to quartz. As the coesite-to-quartz transformation is accompanied by a volume increase of c. 10%, this further promotes fracture opening and garnet disintegration.
As well as JS-Erz-6s and JS-Erz-8s, coesite inclusions in garnet of JS-Erz-5s show a changeover from a primary monomineralic to a primary bimineralic state at small inclusion size, even smaller than for JS-Erz-6s and JS-Erz-8s (Fig. 12), accompanied by a high coesite inclusion density. Nevertheless, the coesite density is lower than in JS-Erz-6s and JS-Erz-8s and there is no enrichment of coesite inclusions in a specific grain-size fraction. In addition, the transition zone regarding inclusion size where both monomineralic and bimineralic inclusions occur is very broad. These observations indicate that coesite inclusion density has a strong control on this transition zone. It therefore seems likely that the higher the inclusion density, the higher the potential that fractures originating from large coesite inclusions connect to smaller coesite inclusions, paving the way for fluids to infiltrate the smaller inclusions and enable their transformation to quartz. Moreover, the higher the inclusion density, the more likely that stress fields from adjacent coesite inclusions overlap and may concentrate at specific locations (e.g. Howell et al. Reference Howell, Wood, Dobson, Jones, Nasdala and Harris2010), and the more likely that coesite inclusions occur close to the garnet rim so that stress fields extend beyond the garnet host facilitating fracture development (e.g. Campomenosi et al. Reference Campomenosi, Mazzucchelli, Mihailova, Scambelluri, Angel, Nestola, Reali and Alvaro2018; Zhong et al. Reference Zhong, Moulas and Tajčmanová2020). In conclusion, JS-Erz-5s is similar to JS-Erz-6s and JS-Erz-8s but the lower inclusion density led to a slightly lower disintegration of garnet, which explains that coesite-bearing garnet in JS-Erz-5s is enriched in the fine fraction but less strong than JS-Erz-6s and JS-Erz-8s.
In contrast to the three samples from the eastern study area discussed above, felsic coesite-bearing garnet grains from the northern samples JS-Erz-3s and JS-Erz-13s show a much lower coesite inclusion density and a changeover from monomineralic to bimineralic at a larger inclusion size (Fig. 12). This is best expressed for sample JS-Erz-13s that shows the lowest density and the largest changeover leading to a strong enrichment of coesite-bearing garnet in the coarse fractions (Fig. 9). Felsic coesite-bearing garnet of JS-Erz-3s is also enriched in the coarse fractions but less strongly than for JS-Erz-13s, agreeing with the still low but higher inclusion density. Felsic coesite-bearing garnet of sample JS-Erz-14s is intermediate between JS-Erz-3s and JS-Erz-13s. Although the inclusion density is slightly higher, this is mainly a result of the low number of coesite-bearing grains in this sample (Figs 6, 9) and a single garnet grain containing four coesite inclusions (Fig. 11a), which strongly influence the averaged inclusion density. Regardless, due to the large catchment of JS-Erz-14s comprising lower-grade metamorphic rocks, this sample is less suitable to draw conclusions on the grain-size distribution of coesite-bearing garnet.
In summary, although coesite inclusion size represents a superordinate factor controlling the timing of fracturing during exhumation, the differences in grain-size distribution of coesite-bearing garnet from mafic and felsic sources as well as between the single catchments is highly influenced by coesite inclusion density. Mafic garnet shows the lowest number of coesite inclusions, and the fracturing therefore mainly depends on inclusion size. This leads to a low disintegration potential and an enrichment of mafic coesite-bearing garnet in the coarse garnet grain-size fraction. Felsic coesite-bearing garnet shows a wide range of inclusion density with higher values in the eastern catchments and lower values in the northern catchments. Coesite-bearing felsic garnet from northern catchments therefore behaves more similar to mafic garnet, that is, fracturing is mainly controlled by inclusion size leading to an enrichment in the coarse garnet fraction. In contrast, the disintegration of coesite-bearing felsic garnet from the eastern catchments is not only controlled by inclusion size but more importantly by inclusion density. The high inclusion density leads to a higher disintegration, and thus to an enrichment in the fine detrital garnet fraction.
4.f. A model of coesite-bearing garnet disintegration
Based on all the observations, a model for the disintegration of coesite-bearing garnet during exhumation, weathering and sedimentary transport can be deduced. This model starts with inclusion entrapment, assuming a temperature of c. 950°C, agreeing with estimates for local UHP rocks (e.g. Schmädicke et al. Reference Schmädicke, Okrusch and Schmidt1992; Nasdala & Massonne, Reference Nasdala and Massonne2000; Zack & Luvizotto, Reference Zack and Luvizotto2006). The model considers: (1) mafic garnet with inclusions of omphacite, rutile and lesser kyanite that co-exist with less abundant coesite inclusions; (2) felsic garnet poor in coesite inclusions, which co-exists with graphite, rutile, kyanite and apatite; and (3) felsic garnet rich in coesite inclusions (Fig. 13a).
Disintegration model for coesite-bearing garnet from entrapment to exhumation to mid-crustal levels: (a–e) different time/temperature slices during exhumation (see explanation in the text).

During the pressure and temperature reduction caused by exhumation, a relatively ‘soft’ coesite inclusion will expand more than the cavity in the relatively ‘stiff’ garnet host. If no elastic re-equilibration occurs, an increasing positive strain therefore develops within the inclusion with increasing exhumation state, that is, the coesite inclusion becomes ‘overpressured’ compared with the external metamorphic conditions (Fig. 13b, black arrows). This overpressure is independent of inclusion size. At a specific point along the exhumation path, the inclusion overpressure may become high enough to fracture the host garnet (e.g. van der Molen & van Roermund, Reference van der Molen and van Roermund1986). As shown in Section 4.d, a large coesite inclusion fractures its host garnet at a higher temperature and therefore lower overpressure than a small inclusion. Most likely, this is related to a longer inclusion/host boundary of large inclusions defining a larger initial fracture length that can more easily propagate than a smaller fracture length (Whitney et al. Reference Whitney, Cooke and Du Frane2000). Based on the temperatures of c. 330°C for fluid infiltration estimated from the Raman spectrum of carbonaceous material in ≤ 14 µm bimineralic coesite/quartz inclusions (Fig. 11d), it can be concluded that fracturing is a late process during exhumation. Although the timing of fracturing for larger inclusions is speculative, it must take place earlier, that is, at higher temperatures (Fig. 13b).
Once the fractures of large coesite inclusions reach the garnet surface, the inclusions are no longer isolated from metamorphic fluids in the system, enabling the coesite-to-quartz transformation (Fig. 13c). For garnet grains rich in coesite inclusions, fractures originating from large inclusions have a high probability of connecting small inclusions to the external conditions (Fig. 13c, red arrows). At the same stage, the next smaller coesite inclusions are able to propagate their initial fractures into the garnet host. This process continues to the next time slice and increasingly smaller inclusions fracture the host garnet, resulting in a close-meshed fracture network for felsic garnet that is rich in coesite inclusions, which is less pronounced in inclusion-poor garnet (Fig. 13d). As well as the higher number of larger coesite inclusions and the higher probability of smaller inclusions to be connected by fractures from larger inclusions, the high inclusion density also makes it more likely that smaller inclusions are located close to the garnet surface and other fractures. These inclusions are not elastically isolated; their stress fields extend beyond the next fracture or garnet surface (e.g. Campomenosi et al. Reference Campomenosi, Mazzucchelli, Mihailova, Scambelluri, Angel, Nestola, Reali and Alvaro2018; Zhong et al. Reference Zhong, Moulas and Tajčmanová2020) and they are therefore likely to fracture their host garnet earlier than similar-sized but isolated inclusions (Fig. 13d, red arrows). Because of the still fast reaction kinetics at 400–350°C, high proportions of the coesite inclusions becoming connected to the external conditions transform into quartz. In particular, small inclusions will completely transform into quartz. As this transformation is accompanied by a volume increase of c. 10%, fractures will not heal and instead become wider as long as coesite is left to be transformed.
Based on reaction kinetics, during the 350–300°C time slice the coesite-to-quartz transformation dramatically slows down and finally becomes inhibited (Mosenfelder & Bohlen, Reference Mosenfelder and Bohlen1997). Inclusions in the critical size range of 7.5–15.0 µm fractured the host garnet shortly before and only a tiny rim was transformed into quartz (Fig. 13e, red arrows). For garnet poor in coesite inclusions, these smallest bimineralic coesite/quartz inclusions show a filigree of fine fractures and are likely to be preserved in garnet fragments. In contrast, for inclusion-rich felsic garnet, the fine fractures are more likely to connect to other fractures, resulting in a higher amount of coesite being transformed into quartz and a primary location at the surface of the individual garnet fragments. Below 300°C, the coesite inclusion pressure still increases and some inclusions may fracture the host garnet, but the coesite-to-quartz transformation is kinetically inhibited (Mosenfelder, Reference Mosenfelder2000).
When the coesite-bearing garnets reach the Earth’s surface, they are exposed to weathering processes; at the transition to the sedimentary system, the garnet grains disintegrate along the fracture network created during exhumation (Fig. 14a). In particular, physical weathering has a major influence as surface water can easily infiltrate along the fractures. Because of the more pronounced fracture network of felsic garnet being rich in coesite inclusions, these grains will disintegrate in finer fragments. In contrast, the erosion of inclusion-poor felsic and mafic garnet results in fewer and coarser fragments. Even if some fine fragments exist, they are less likely to contain coesite because of the overall lower number of coesite inclusions.
Disintegration model for coesite-bearing garnet from source to sink. (a) Weathering at surface conditions and transition to the sedimentary system. (b) Rounding and further disintegration during sedimentary transport. (c) Mixing of garnet sourced from different UHP rocks, explaining the observed heterogeneous grain-size distribution of coesite-bearing garnet.

During sedimentary transport, the erosional material is subjected to further mechanical stress. In this way, the large bimineralic coesite/quartz inclusions will often enter the sedimentary system as individual grains (Fig. 14b). Any palisade quartz rims surrounding the coesite inclusions are unstable against mechanical stress and will be quickly abraded. This is shown, for instance, by bimineralic inclusions located at the garnet surface or along wide fractures where the quartz rim has been partially or completely lost and now the remaining cavity is filled by the embedding medium (Supplementary Fig. SM4, white component, available online at https://doi.org/10.1017/S0016756821000017). The produced garnet fragments will be rounded, whereby the loss in volume will be higher for fragments from felsic coesite inclusion-rich garnet because these finer fragments have a much higher surface-to-volume ratio than coarse fragments.
Taken together, sediment derived from felsic UHP rocks with garnet rich in coesite inclusions will have mainly fine-grained garnet fragments often containing coesite inclusions and less coarse-grained fragments, which also contain coesite (Fig. 14b). Bimineralic coesite/quartz inclusions are less likely to be preserved in the fine-grained fragments because of the high probability of connecting their fractures to others; they are therefore often completely transformed or enter the sedimentary system as individual grains. In contrast, sediment derived from felsic and mafic UHP rocks with garnet being poor in coesite inclusions will have mainly coarse-grained fragments containing coesite and few fine-grained fragments, which often do not contain coesite inclusions.
Mixing of these source-rock-specific garnet fragments can explain the grain-size distribution of coesite-bearing garnet in the individual samples as observed in Figure 6 for all garnet grains (also shown in Fig. 14) and in Figure 9 for garnet separated in felsic and mafic origin. The northern samples JS-Erz-3s and JS-Erz-13s show mixing of coesite-poor mafic and felsic garnet leading to a strong enrichment of coesite-bearing garnet in the coarse fraction (Fig. 14c). Further downstream at sample JS-Erz-14s, this signal becomes diluted by the strong contribution of garnet from lower-grade metamorphic lithologies occurring in the large catchment, leading to an even stronger enrichment in the coarse fraction. In the eastern part of the study area, sample JS-Erz-8s shows the characteristics of felsic UHP rocks shedding garnet grains rich in coesite inclusions, resulting in an enrichment of coesite-bearing garnet in the fine fraction. Further downstream to JS-Erz-6s, this signal becomes diluted in the coarse fraction by the strong input of mafic coarse-grained garnet from the large eclogite lenses that rarely contain coesite. Coesite-bearing garnet in JS-Erz-5s is similar to JS-Erz-8s but slightly less enriched in the fine fraction, which points to minor contributions of felsic garnet poorer in coesite inclusions.
4.g. Selecting the most efficient garnet grain-size fraction
Garnet grains from the seven modern sand samples of the central Saxonian Erzgebirge analysed for their mineral inclusion assemblage provide a good example of increasing provenance information by widening the analysed grain-size window (e.g. Garzanti et al. Reference Garzanti, Andò and Vezzoli2009). Initially, the 125–250 µm fraction was investigated. As well as the finding of diamond inclusions in one of the seven samples, coesite inclusions in five of the seven samples revealed that UHP metamorphism affected a larger area than previously assumed, and that both mafic and felsic lithologies were involved (Schönig et al. Reference Schönig, von Eynatten, Meinhold and Lünsdorf2019). Additional analyses of the 63–125 µm and 250–500 µm fractions revealed that: (1) diamond also occurs in another sample; (2) all seven catchments drain coesite-bearing lithologies; and (3) most importantly, the felsic country rocks surrounding the UHP lenses also underwent a UHP stage before re-equilibration at HP/HT conditions (Schönig et al. Reference Schönig, von Eynatten, Meinhold, Lünsdorf, Willner and Schulz2020). However, when considering future studies where large regions are screened by many samples from large drainage systems, it becomes inefficient to apply the time-consuming mineral inclusion analysis to a large number of garnet grains from several grain-size fractions from each sample. When applying detrital garnet analyses to a new terrane in order to decipher the metamorphic history, key questions include the following. (1) Did rocks of the region undergo UHP metamorphism? (2) Did they reach the diamond stability field? (3) What kind of lithologies were involved?
To answer the first and second question, the finding of a single garnet grain of crustal origin containing coesite and/or diamond is already sufficient, whereas to answer the third question at least a few grains are necessary. With regard to efficiency, the selection of a specific grain-size fraction with the highest potential to solve the questions in the least amount of time is therefore important. In our case, the screening of the inclusion assemblages of 100 garnet grains in the 125–250 µm and 250–500 µm fractions took on average c. 1.3 (17 hours) and c. 1.8 (24 hours) times longer than for the 63–125 µm fraction (13 hours). Although the absolute time needed will vary significantly between different laboratories, the relative ratios will be similar.
To evaluate which fraction is most suitable in terms of UHP garnet, the information value must be compared with the invested analytical time. Because diamond-bearing garnet is restricted to two samples, the most efficient grain-size fraction to detect UHP garnet grains is strongly controlled by the heterogeneous grain-size distribution of coesite-bearing garnet, which in turn is mainly controlled by the grain-size distribution of felsic coesite-bearing garnet. In consequence, although the most efficient grain-size fraction varies for the individual samples (see Supplementary Fig. SM5, available online at https://doi.org/10.1017/S0016756821000017), on average none of the fractions is more favourable than any other; the fraction with the highest information value should therefore be selected.
If considering solely the 63–125 µm fraction, the UHP rocks occurring in the catchments of JS-Erz-13s and JS-Erz-14s would not have been detected, including diamond-bearing rocks in JS-Erz-14s. In addition, for detecting mafic coesite-bearing rocks the 63–125 µm fraction is not suitable (JS-Erz-3s and JS-Erz-6s) and also shows the lowest efficiency for detecting diamond-bearing rocks. When considering solely the 125–250 µm fraction, the UHP rocks occurring in the catchment of JS-Erz-6s, the coesite-bearing rocks in the catchment of JS-Erz-9s and the diamond-bearing rocks in the catchment of JS-Erz-14s would not have been detected. Furthermore, the 125–250 µm fraction shows the lowest efficiency for detecting felsic coesite-bearing garnet (see Supplementary Fig. SM5, available online at https://doi.org/10.1017/S0016756821000017). In contrast, the 250–500 µm fraction provides overall the highest information value and efficiency. With the exception of the single coesite-bearing garnet in JS-Erz-9s, no information in terms of the erosion of felsic coesite-bearing rocks, mafic coesite-bearing rocks, and diamond-bearing rocks would be missed in any of the samples by considering solely the 250–500 µm fraction. However, this result cannot be generalized as the 250–500 µm garnet fraction from a sample of the Western Gneiss Region of Norway lacked coesite-bearing garnet, whereas coesite-bearing garnet was found in the 63–125 µm and 125–250 µm fractions (Schönig et al. Reference Schönig, Meinhold, von Eynatten and Lünsdorf2018 b).
In summary, when exploring a new region with regard to presence of UHP rocks by the detrital approach, it is most efficient to start with the 250–500 µm fraction. In the case that the investigated sediment or sedimentary rock contains fine or very fine sand only, it is recommended to start with the coarsest grain-size fraction available. An absence of UHP garnet grains in the starting fraction does not necessarily rule out the presence of UHP rocks in the sampled catchment, but makes it much less likely. Once UHP garnet is detected, it is highly recommended to screen a wider grain-size window to achieve sufficient information with regard to UHP source rocks.
5. Conclusions
The key findings of this sedimentary provenance study of modern sand samples from tributaries draining the UHP nappe in the central Saxonian Erzgebirge, Germany, can be summarized as follows.
-
(1) The geochemical composition of detrital garnet well reflects the geological framework of the sampled catchments, and shows that grain-size inheritance effects are variable and strongly control garnet grain-size distributions. Garnet grains of samples draining exclusively the UHP area typically show an increase in metamorphic grade with increasing grain size, agreeing with the large garnet crystal size in eclogite and high-grade felsic gneiss. However, when mixed with garnet from lower-grade metamorphic units, the grain-size distribution can be completely reversed; this is most likely related to the large crystal size of garnet from micaschist sources. To attain sufficient garnet provenance information, a wide grain-size window should therefore be considered.
-
(2) A combination of garnet composition and mineral inclusion assemblages is a powerful tool to resolve specific source-rock characteristics with regard to detrital garnet grain-size relations by mineralogical evidence. In particular, the proportions of omphacite- versus graphite-bearing garnet are useful to discriminate eclogitic versus felsic sources, reflecting the proportions of eclogite occurring in the individual catchments and showing that the amount of eclogitic garnet increases with increasing grain size. In addition, the proportions of quartz- versus kyanite-bearing garnet compared with omphacite-bearing garnet also show that the amount of garnet shed from high-grade felsic sources increases with increasing grain size.
-
(3) Diamond-bearing garnet grains are of felsic origin, occur only locally, and their amount increases with increasing grain size.
-
(4) Coesite-bearing garnet grains are mainly sourced from felsic lithologies, but significant amounts are also shed from eclogite, in particular in the northern study area. Although all coesite-bearing garnet grains show an initially large grain size, they disintegrated in varying degrees leading to a heterogeneous grain-size distribution. The amount of mafic coesite-bearing garnet generally increases with increasing grain size. Felsic coesite-bearing garnet grains in the northern samples also show an increase with increasing grain size, but those from the eastern samples show a decrease with increasing grain size.
-
(5) A primary factor for the preservation of coesite inclusions is the inclusion size. Inclusions < 9 µm are primarily monomineralic, whereas most larger inclusions partially transformed into quartz. Large inclusions are able to fracture their host garnet at an earlier exhumation stage due to their larger initial fracture length. This in turn controls the temperature conditions at which fluids are able to infiltrate the inclusions, facilitating the coesite-to-quartz transformation. Temperature estimates of carbonaceous material precipitated from fluids in bimineralic coesite/quartz inclusions show that fracturing and transformation are a late process during exhumation occurring at c. 330°C.
-
(6) As well as inclusion size, the number of coesite inclusions per garnet grain strongly controls garnet disintegration during the exhumation processes of the sedimentary cycle. The higher the number of coesite inclusions, the higher the degree of fracturing, the higher the probability of fracture connections, the earlier the fluids are able to infiltrate and the more likely that even small inclusions will transform into quartz, leading to stronger disintegration into smaller garnet fragments.
-
(7) Coesite-bearing garnet of the northern samples originates from mafic and felsic UHP rocks poor in coesite inclusions, resulting in minor garnet disintegration into coarse fragments; the amount of coesite-bearing garnet therefore increases with increasing grain size. In contrast, coesite-bearing garnet of the eastern samples mainly originates from felsic UHP rocks rich in coesite inclusions, resulting in strong garnet disintegration; the amount of coesite-bearing garnet therefore decreases with increasing grain size.
-
(8) The 250–500 µm detrital garnet grain-size fraction is most efficient, in terms of invested analytical time, in providing the highest information value in terms of UHP source rocks.
Acknowledgements
This work was supported by the German Research Foundation (DFG grant EY 23/27-1). We thank JE Dunklné Nagy, I Dunkl and A Grebe for their support with sample preparation, and A Kronz for providing access to the electron microprobe. The manuscript benefitted from thoughtful reviews by two anonymous reviewers.
Declaration of interest
None.
Supplementary material
To view supplementary material for this article, please visit https://doi.org/10.1017/S0016756821000017


 Open access