


Introduction
Platina is the name given by the miners in the Viceroyalty of New Granada in South America (at present, Colombia and Ecuador) to the raw mineral that appears together with gold in the placer deposits. This material was regarded as less valuable than silver and hence the name probably derived from the derogatory diminutive of silver (‘plata’ in Spanish) ‘platina’, meaning cheap silver. Nevertheless, this raw material was already known some centuries before Christ by the ancient La Tolita–Tumaco cultures who were settled at the sea coast along the border of the present day Colombia and Ecuador (Scott, Reference Scott2011 and references therein). These cultures developed a sophisticated metallurgy combining gold and platinum to create alloys, platinum-coated gold objects, platinum–gold sintered alloys and platinum–gold foil-plated objects (Bergsøe, Reference Bergsøe and Reybolds1937; Scott, Reference Scott2011).
Spanish miners noted the presence of platina during mining activities on alluvial gold deposits in the proximal reach of the San Juan river, probably as early as 1690 (Capitán-Vallvey, Reference Capitán-Vallvey1989). Later, it was recognised in most river courses and nearby terraces of the region between the Cordillera Occidental and the Pacific coast, a region known in Colombia as the Chocó (it is likely that the Esmeraldas region, currently in Ecuador, was considered part of the Chocó in the 18th century; Codazzi, Reference Codazzi2002). Platina and gold have similar specific gravities and in these alluvial deposits, they exhibit similar grain sizes (McDonald and Hunt, Reference McDonald and Hunt1982) and occur mixed in different proportions. This prevented efficient separation by panning and consequently, the obtained gold concentrates were always found to contain variable amounts of platina. The much higher melting point of platina relative to gold should have led to its detection in gold concentrates by employees and officials of the local foundries and Royal Mints. However, when it became apparent that there were difficulties identifying and separating platina from gold, miners soon started to deliberately adulterate gold by addition of platina, leading the colonial authorities to ban mining operations in those deposits containing high amounts of platina. Such prohibition remained in force until 1726 when the use of the amalgamation method to separate platina from gold (and to a lesser extent the inquartation and melting methods) spread throughout the region (Capitán-Vallvey, Reference Capitán-Vallvey1988 and Reference Capitán-Vallvey1989). After this year, mining operations in platina-bearing deposits were permitted again but on the condition that platina had to be removed from gold concentrates; a process that had to be covered by the owner of the mine. Since at that time platina was still useless and with a bad reputation (e.g. Bowles, Reference Bowles1775), once separated it had to be stored by Royal Officials who were in charge of throwing, from time to time, the accumulated platina back to rivers, preferably to inaccessible gorges, such as Bogota river, Cauca river (Leblond, Reference Leblond1785) or the one known as the Platina Gorge, in the Novita province (Capitán-Vallvey, Reference Capitán-Vallvey1988). This act prevented easy platina recovery for falsification of gold shipments and had to be supervised by a Royal Official and certified by a Public Notary. Nowadays, platina is still thrown back to the river after gold amalgamation in some mining sites of the Santiago River in Ecuador (V. Yucas, pers. comm.).
Platina attracted the interest of the European scientific community after the publication of a short paragraph on the exceptional properties of this metallic material by Antonio de Ulloa (1716–1795) in the very widespread book written as a result of the French–Spanish geodesic expedition to the Viceroyalty of New Granada (1736–1744) (Juan and Ulloa, Reference Juan and Ulloa1748). The interest of European scholars on platina modified the attitude of Spanish authorities of withdrawing the platina from circulation to the foundation of a real monopoly (Capitán-Vallvey, Reference Capitán-Vallvey1994a,Reference Capitán-Vallveyb). One of their first steps was to establish a platina refining process led by Pierre François Chabaneau (1754–1842) aided by Fausto de Elhuyar (1755–1833) who, in partnership with his brother Juan José, was the first to isolate wolfram in 1783 (Chaston, Reference Chaston1980; McDonald and Hunt, Reference McDonald and Hunt1982). Chabaneau's success took place in 1786 when he was able to produce malleable platinum metal after dissolution of platina in aqua regia, precipitation of Pt as (NH4)2PtCl6, release of Pt by thermal decomposition and alternate annealing and hammering. The procedure was kept secret by a Royal order of King Carlos III promulgated in 1787 to ensure the Spanish crown the monopoly of trade and manufacture of platinum (Rumeu de Armas, Reference Rumeu de Armas1979; Capitán-Vallvey, Reference Capitán-Vallvey1994a,Reference Capitán-Vallveyb). The Spanish crown created a laboratory for the purification of platinum in the Hortaleza Street of Madrid, a place known at that time as the Casa de la Platina (Aragón de la Cruz, Reference Aragón de la Cruz1986) where Chabaneau combined the laboratory work with teaching chemistry. Some of the platinum metal produced in this laboratory was used to create in 1788, one of the first known objects made of platinum in Europe, a beautiful chalice that was given to Pope Pius VI by the Spanish King Carlos III as a present (McDonald and Hunt, Reference McDonald and Hunt1982). A second laboratory mainly oriented to teaching chemistry was created later in El Turco Street and Chabaneau was moved there as Director. The activity of these two laboratories remained until 1808 when the Napoleonic troops plundered and destroyed them. From 1767 to 1805, 2846.49 kg of rough platina in documented shipments were imported from the Viceroyalty of New Granada (Capitán-Vallvey, Reference Capitán-Vallvey1999) and between 435 and 560 kg of platinum metal were produced in the Casa de la Platina and El Turco Street laboratories (Chaston, Reference Chaston1980). This period is known as the Platinum Age in Spain (Fages, Reference Fages y Virgili1909).
The platinum purified by Chabaneau, although useful to produce ingots and different kinds of utensils (including the above mentioned chalice) was not free of impurities. In fact, it was mentioned in Chabaneau's lifetime that the chalice showed an infinity of cracks that were covered with silver, which was justified “for not lending this metal, like gold and silver, to receive other forms and lighter and more delicate ornaments” (Blasco Negrillo, Reference Blasco Negrillo1805). Joseph Louis Proust (1754–1826) himself indicated it in one of the many letters he wrote requesting platina: “other pieces of this metal have not been able to come out … it will undoubtedly have been due to the very palpable defects of porosity, cracks and lack of union between the parts that are seen in these samples” (Proust, Reference Proust1803).
Whereas gold, mercury, lead, copper and mainly iron, were removed efficiently from the refined platinum, the observed variations in colour of the aqua regia solutions and in malleability pointed to the presence of some additional unknown constituents: the other platinum-group metals (osmium, iridium, ruthenium, rhodium and palladium). They were identified later by William Hyde Wollaston (England, 1766 –1828) (he discovered Pd in 1802 and Rh in 1803), Smithson Tennant (England, 1761– 1815) (he discovered Ir in 1803 and Os in 1804) and Karl Karlovitch Klaus (Russia, 1796–1864) (he discovered Ru in 1844). The latter did not use platina from the Viceroyalty of New Granada but from the deposits that were discovered shortly before in the Ural Mountains, in Russia.
A platina sample saved from the looting of Napoleonic troops that is currently preserved in the National Museum of Natural Sciences in Madrid, offered us the opportunity to investigate the mineralogical nature of the platina used by François Chabaneau. In this paper, we present data on the mineralogy and composition of a portion of this historical sample, discussing its probable geological origin by: (1) comparison with published mineralogical data for placer deposits from Ecuador and Colombia; and (2) with results obtained from a mineralogical survey performed on platinum nuggets from active mines in the Rio Santiago, in the Esmeraldas province (northwest Ecuador). We also discuss how the mineralogical expression of the different platinum-group elements (PGE) could help us to understand the experimental results performed by Chabaneau.
The platina sample
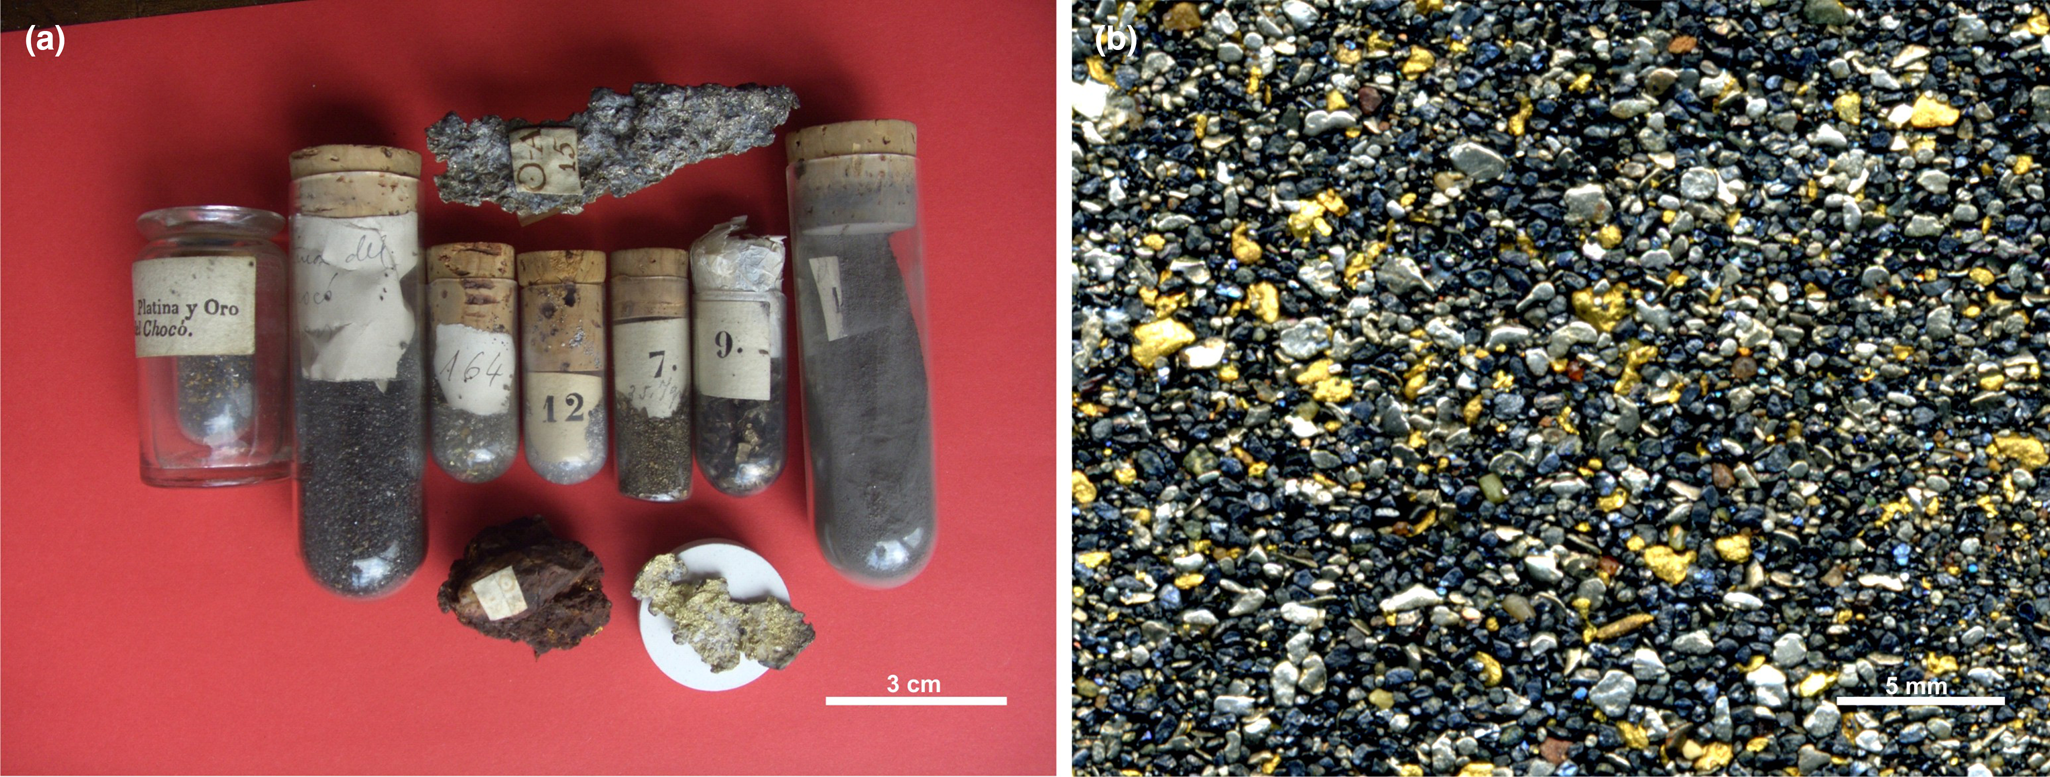
François Chabaneau returned to France in 1797 to restore his health (Dujarric-Descombes, Reference Dujarric-Descombes2005) but beforehand he undertook a detailed inventory of the laboratory stocks in the School of Applied Chemistry of El Turco Street when delivering the laboratory to its substitute (Chabaneau, 1797). The small amount of platina reported in the inventory of the museum draws attention, considering the main use of the laboratory (Gago, Reference Gago1984). According to Chabaneau's inventory there were only “two samples of the mineral (platina) and different results of my work with this metal”. The most valuable specimens of the museum were kept it safe in the Bank of Spain (its main building was located nearby El Turco Street) from French troops pillage, where they remained until 1983. Part of this material is nowadays on exhibition in the National Museum of Natural Sciences in Madrid. The sample investigated here (it currently weighs 64 grams) is one of the two heavy-mineral concentrates (containing platina and gold) selected by Chabaneau to be included in the mineralogical museum of the referred School of Applied Chemistry (Fig. 1a).
(a) Material saved from the Bank of Spain corresponding to the description made by François Chabaneau in his inventory: “two samples of the mineral (platina) and different results of my work with this metal”. The sample studied is the first from the left. (b) Mineral concentrate of the investigated sample where it is possible to see the Pt–Fe alloy (silver grey) and gold (yellow) nuggets, in addition to the ilmenite–hematite (black) grains. Scale bars: (a) 3 cm; (b) 5 mm.
Analytical methods
A portion of the platina sample was first mounted on a resin block, polished and studied by reflected optical microscopy, followed by modal analysis using QEMSCAN at the Centro de Instrumentación Científica of the University of Granada (Spain). QEMSCAN is an automated mineralogical technique based on scanning electron microscopy with linked energy dispersive spectrometers. Single mineral grains were investigated by environmental scanning electron microscope (ESEM) in back-scattered electron mode (BSE) in the Centro de Instrumentación Científica of the University of Granada (Spain), prior to electron microprobe analysis in the CCiT laboratories of the University of Barcelona (Spain).
Mineral identification and mineral assemblage digital maps using QEMSCAN were achieved by acquisition of a chemical spectrum at a set interval (1 μm) on a defined mapping area of the sample's surface. Data were processed later offline by comparison with a mineralogical database. The spatial resolution of this technique allowed us to differentiate even exsolution lamellae from their host.
Data were obtained using a JEOL JXA-8230 electron microprobe equipped with five wavelength-dispersive spectrometers, using an excitation voltage of 20 kV and a beam current of 51 nA, with a beam 2–3 μm in diameter. Monitored spectral lines for platinum-group mineral (PGM) analyses were SKα, AsLα, FeKα, CuKα, CoKα, NiKα, OsLα, IrLα, RuLα, RhLα, PtLα and PdLβ. Standards used were FeS2 (for Fe and S), GaAs (for As), CuFeS4 and metallic Ni, Co, Os, Ir, Ru, Rh, Pt and Pd. The spectral lines monitored for gold analyses were SKα, FeKα, CuKα, SbLα, SnLα, AgLα, TeLα, AuLα, HgLα and BiLα, and the standards used were FeS2 (for Fe and S), CuFeS4, Ag2Te (for Te and HgS) and metallic Sb, Sn, Ag, Au and Bi.
Results
Pt–Fe alloys
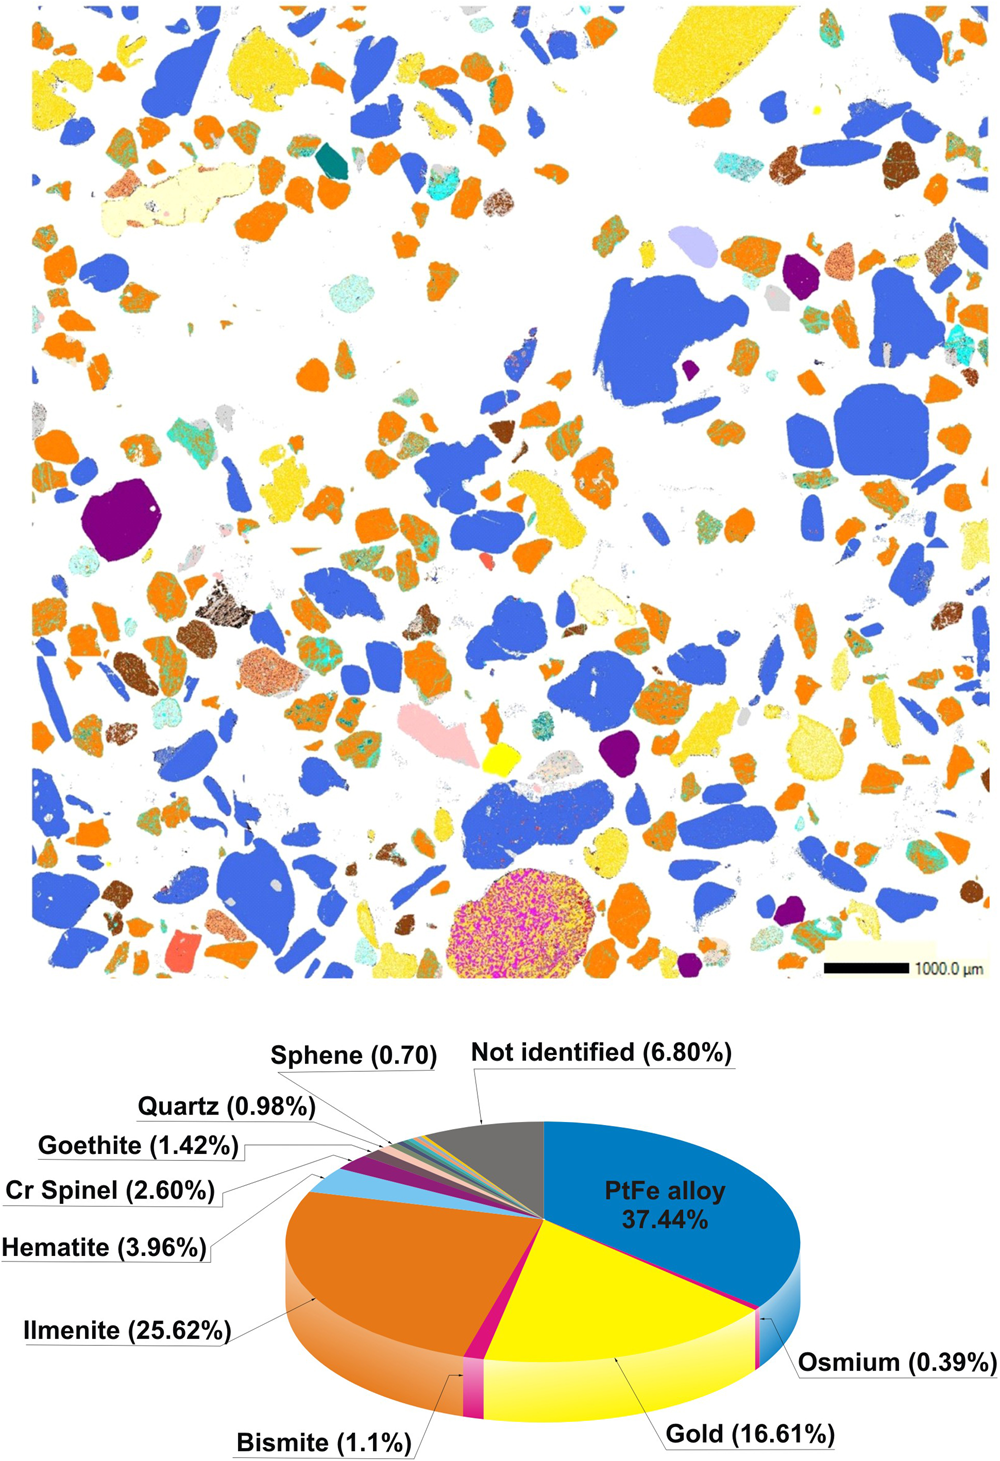
The sample investigated is a heavy-mineral concentrate (Fig. 1b) consisting of flake-like nuggets of Pt–Fe alloys (37.44% of the studied area) and gold (16.61%) with a most frequent grain size ranging from 0.5 to 1 mm Feret diameter. These precious minerals are accompanied by ilmenite (25.62%) frequently intergrown with hematite (3.96%) in the form of exsolution lamellae of the latter, chromian spinel (2.60%), goethite (1.42%), bismite (1.1%), and minor quartz, sphene, rutile, magnetite, hornblende, garnet, calcite, pyrite and native bismuth (each of these minerals represent less than 1% of the whole sample), as well as a few unidentified minerals (Fig. 2).
QEMSCAN digital map showing the mineralogical composition of the studied sample. The colour of each mineral grain corresponds to that used in the lower diagram.
The composition of Pt–Fe alloys is quite homogeneous showing no core to rim variations and consisting of 81.97 to 90.75 wt.% (63.28–78.99 at.%) Pt and 5.08 to 10.81 wt.% (15.34–29.16 at.%) Fe (Table 1). They also contain variable but minor amounts of Cu (0.15–1.1 wt.%), Os (0.07–3.77 wt.%), Ir (<5.62 wt.%), Rh (<2.26 wt.%), Pd (<2.26 wt.%) and Ru (<0.72 wt.%) (Table 1). Total weight of all PGE but Pt in Pt–Fe alloys varies from 0.51 to 8.55 wt.% (0.43–9.63 at.%). These values are comparable to those reported by Cabri et al. (Reference Cabri, Harris and Weiser1996) in Pt–Fe alloys from the Condoto river (Colombia) and by Weiser and Schmidt-Thomé (Reference Weiser and Schmidt-Thomé1993), Yucas (Reference Yucás2017), Lopez-Males (Reference López Males2017) and Castiella (Reference Castiella2018) from the Santiago river (Ecuador).
Representative compositions from electron microprobe analyses of Pt–Fe alloys*.

* Blanks indicate below detection limit
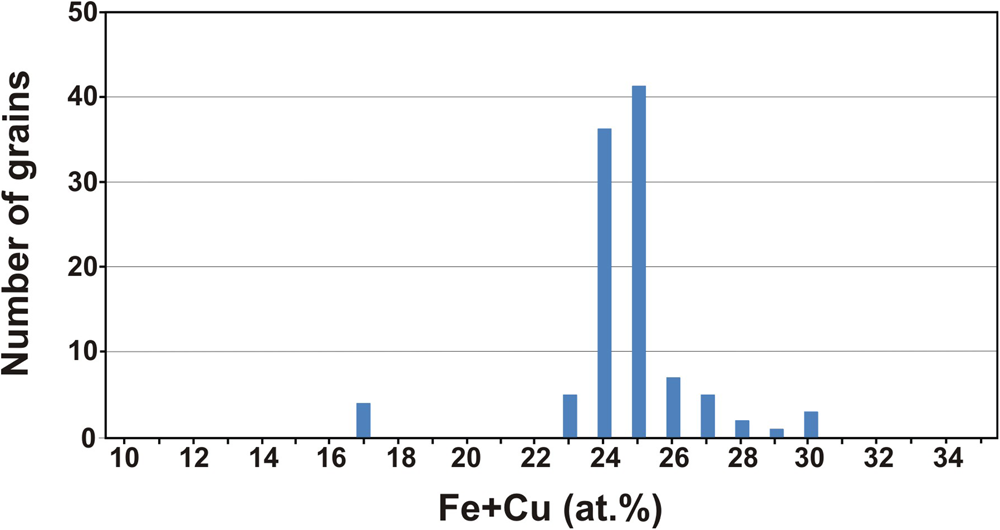
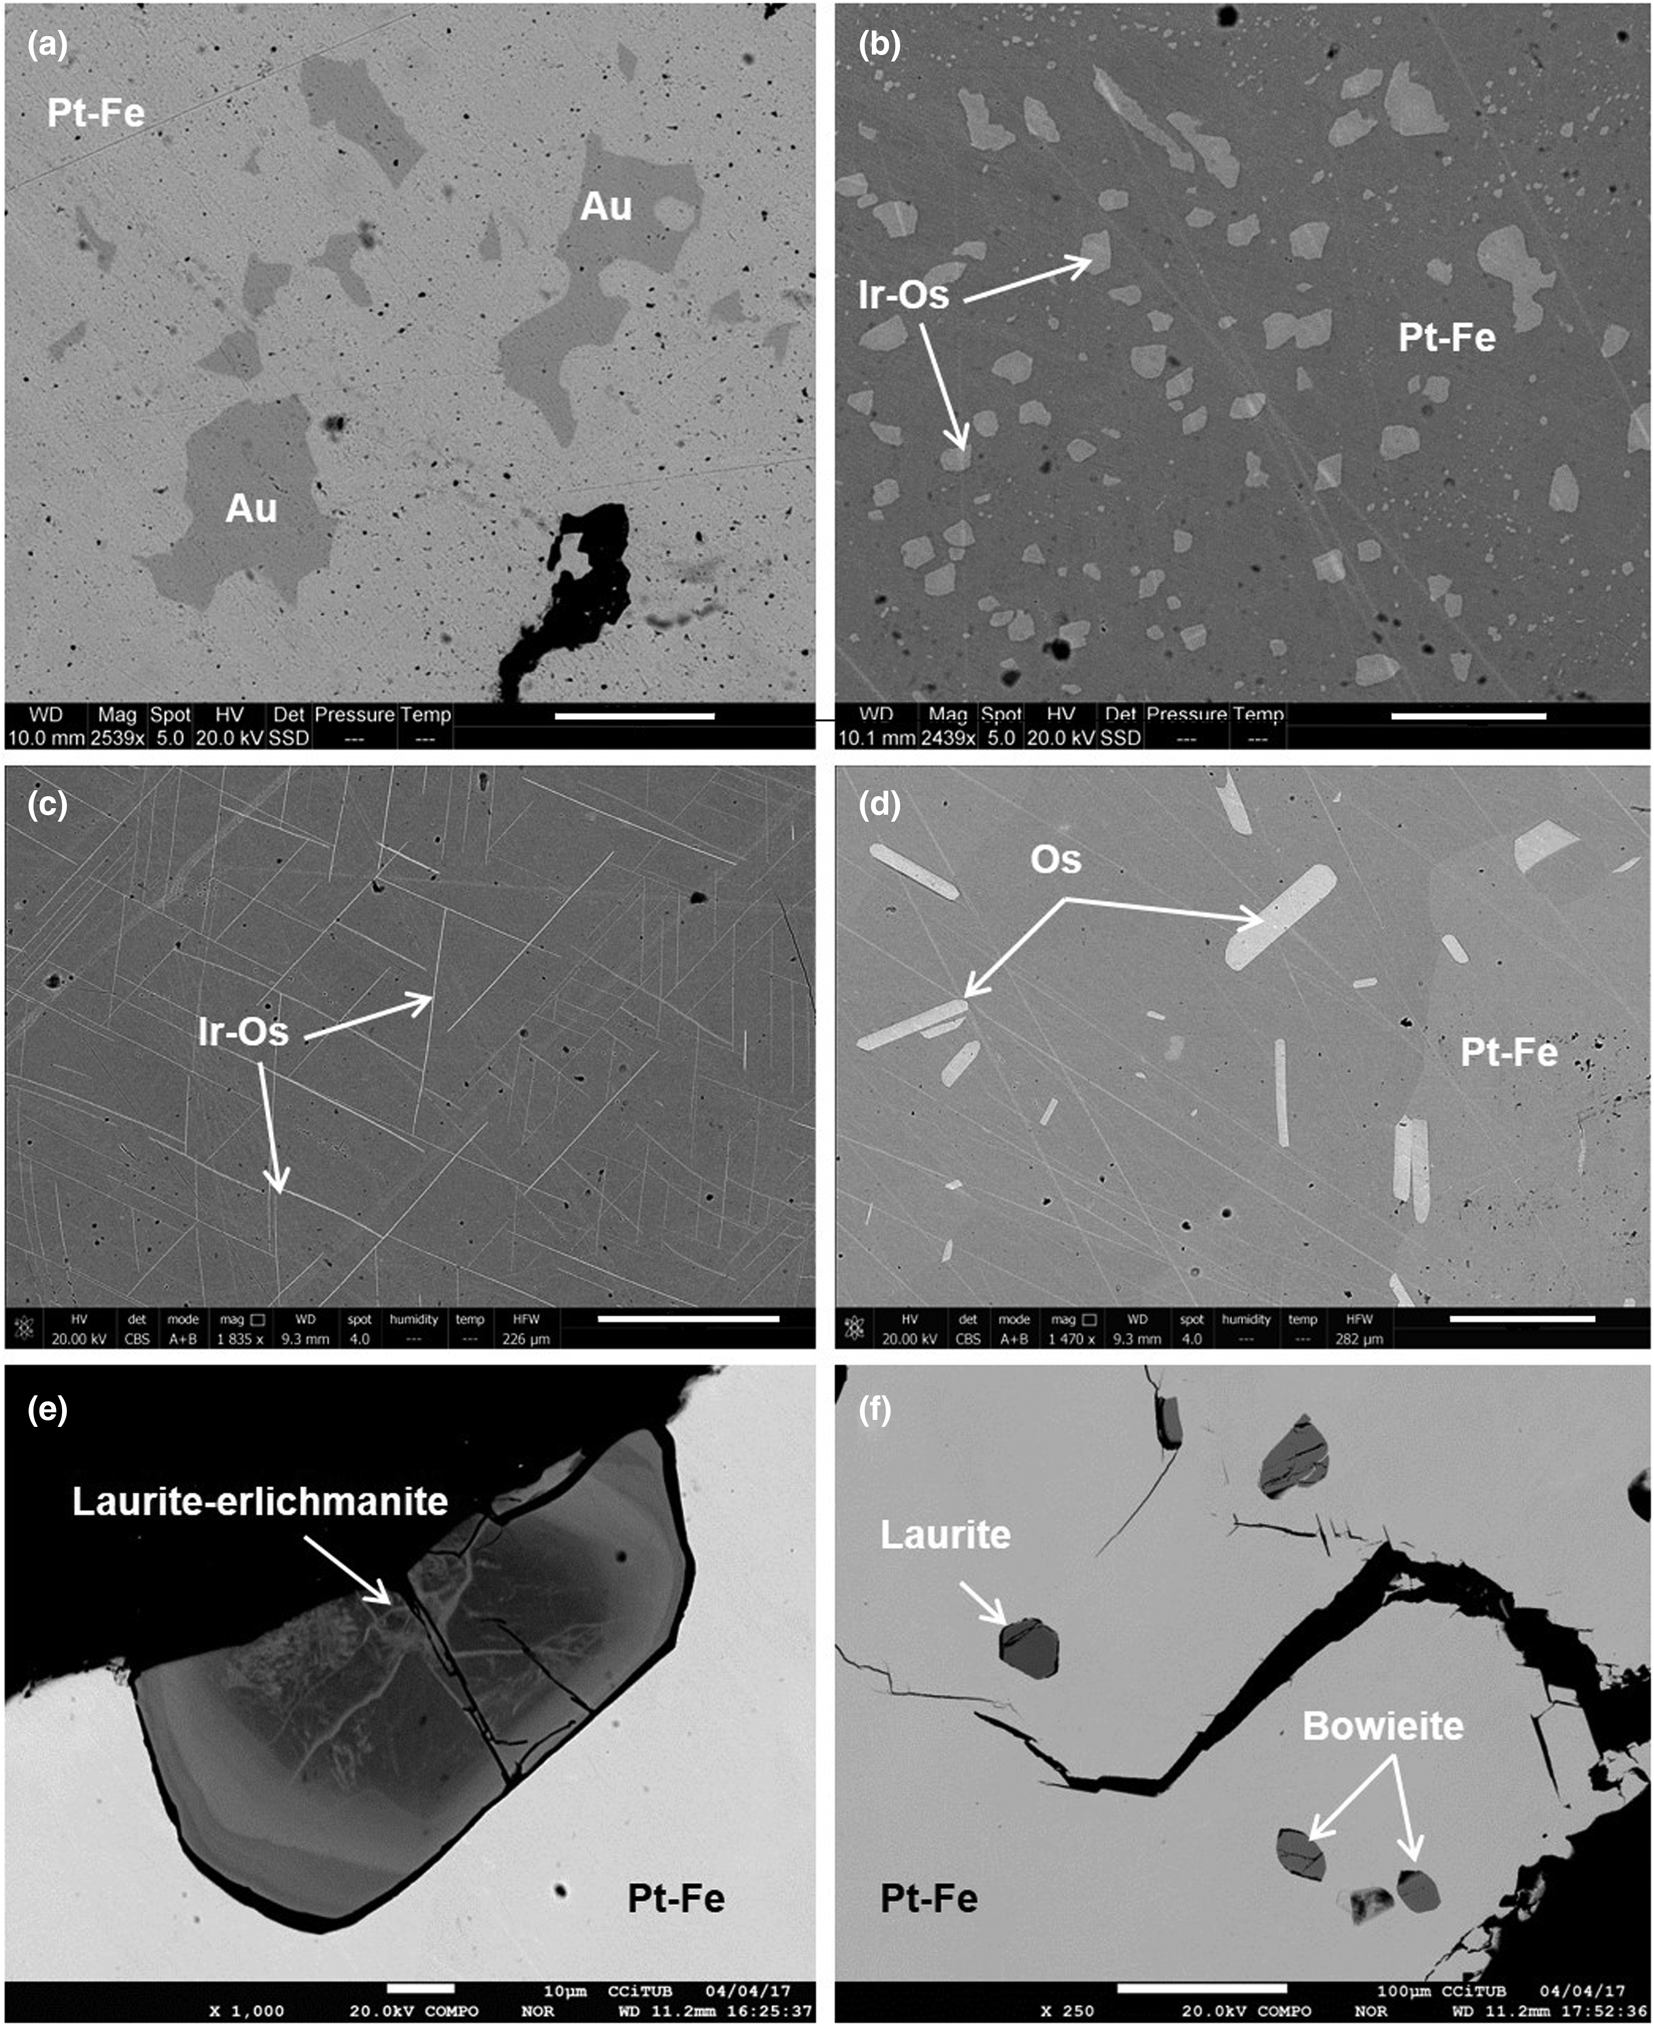
As a whole, the composition of the different grains studied shows a nearly bimodal distribution centred mainly at 24–25 at.% Fe + Cu and ~17 at.% Fe + Cu (Fig. 3). In contrast to compositions, the 136 nuggets investigated are heterogeneous in terms of abundance of mineral inclusions. As shown below, they mainly consist of other platinum-group minerals but also contain minor chromian spinel, quartz and gold. The presence of irregular inclusions of native gold in Pt–Fe alloys, such as those shown in Fig. 4a, has not been reported before and could constitute a characteristic feature of some Chocó placer deposits.
Statistics for the composition of Pt–Fe alloys in terms of their Fe and Cu contents.
Representative back-scattered electron images of noble metal mineral inclusions in Pt–Fe alloys. (a) Irregular gold grains; (b) emulsion-like inclusions of Ir alloy, containing significant amounts of Os; (c) fine (<0.5 μm) exsolution lamellae of Ir alloy containing significant amounts of Os; (d) short tabular lamellae of Os alloy; (e) zoned grain of laurite–erlichmanite; and (f) several granular inclusions of laurite and bowieite. Scale bars: (a,b) 20 μm; (c,d) 50 μm; (e) 10 μm; and (f) 100 μm.
Platinum-group minerals
About 63% of the Pt–Fe nuggets investigated contain iridium inclusions either arranged in an irregular, emulsion-like pattern (the size of individual inclusions ranges from <1 μm to few tens of micrometres) or forming cross-cutting, long (up to 70 μm) but fine (<1 μm) exsolution lamellae oriented crystallographically in the host (Fig. 4b,c). The former textural type also includes anhedral-to-subhedral crystals of iridium. The composition of the iridium inclusions shows important amounts of Os, with the Ir/(Ir + Os) ratio ranging from 0.61 to 0.90, and minor Pt (9.22–17.05 wt.%), Rh (3.18–6.27 wt.%) and Ru (0.28–3.31 wt.%) (Table 2).
Representative compositions from electron microprobe analyses of platinum-group minerals included in Pt–Fe alloys.*
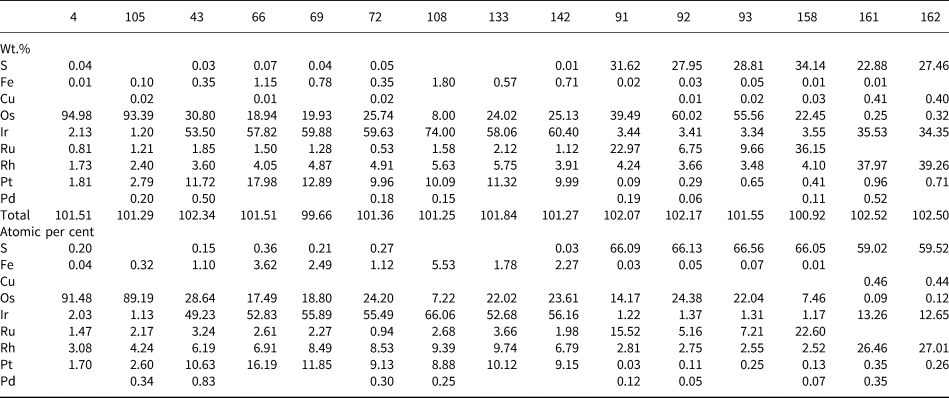
* Osmium alloys: 4 & 105; iridium alloys: 43, 66, 69, 72, 108, 133 & 142; laurite–erlichmanite: 91, 92, 93 &158; bowieite: 161 & 162; blanks indicate below detection limit
Similar inclusions in Pt–Fe alloys were described by Cabri et al. (Reference Cabri, Harris and Weiser1996) in the placer deposits of the Condoto River (Colombia). The extreme thinness of the iridium exsolution lamellae made it difficult for accurate analysis although a few obtained from the intersection of lamellae show compositions very close to those of the emulsion-like inclusions (analysis 43, Table 2).
Some nuggets contain single, variably sized (from 1.13 × 2.5 μm to 4.17 × 187.5 μm) lamellae of osmium, but one measuring 0.62 × 1.48 mm, contains up to 90 lamellae (Fig. 4d). These lamellae were detected and quantified by QEMSCAN showing that their modal percentage reaches 0.39% of the sample area (Fig. 2). They have a rather pure composition, with Os/(Os + Ir + Rh + Ru + Pt) ranging from 0.89 to 0.93 (Table 2).
Four Pt–Fe nuggets contain inclusions of laurite–erlichmanite (RuS2–OsS2). They tend to be subhedral with a grain size varying from 6.4 × 8.6 μm to 35.7 × 85.7 μm, and typically appear highly fractured, especially when the inclusions are located close to grain boundaries or fractures of nuggets. Some of them show oscillatory zoning (in the sense of González-Jiménez et al., Reference González-Jiménez, Gervilla, Proenza, Kerestedjian, Augé and Bailly2009), generally with Ru-rich nuclei [e.g. (Ru0.46Os0.42Rh0.08Ir0.04)Σ1.0(S1.97As0.02)Σ1.99] and rims with variably but higher Os contents [up to (Os0.73Ru0.15Rh0.08Ir0.04)Σ1.01S1.98] (Table 2 and Fig. 4e). The composition of unzoned grains (e.g. Fig. 4f) tends to approach that of laurite: (Ru0.67Os0.22Rh0.07Ir0.04)Σ1.0(S1.96As0.03)Σ1.99.
One Pt–Fe alloy grain contains several subidiomorphic, minute (from 5.9 × 17.6 μm to 32.4 × 76.5 μm) inclusions of bowieite (Rh2S3) (Fig. 4f). Their composition is quite constant, with an average structural formula Rh1.35Ir0.67S2.98 (Table 2). Another contains a rounded inclusion of tulameenite (Pt2FeCu) measuring 26.8 μm across and showing a nearly stoichiometric formula: Pt2.01Fe1.0Cu0.99. A third measuring 200 × 600 μm is partly rimmed by an undetermined Pt and Pd antimonide, containing abundant minute inclusions of Pt–Te and Pt–Ir–Rh–Sb–Te.
Most PGM inclusions identified in this sample have been already described in Pt–Fe nuggets from alluvial placer deposits worldwide (Cabri et al., Reference Cabri, Harris and Weiser1996; Weiser, Reference Weiser and Cabri2002), but the emulsion-like iridium inclusions described here have previously only been observed in nuggets collected in the sites of Delfin and Nevado, located in the proximal reach of the Condoto river in Colombia (Cabri et al., Reference Cabri, Harris and Weiser1996).
Gold
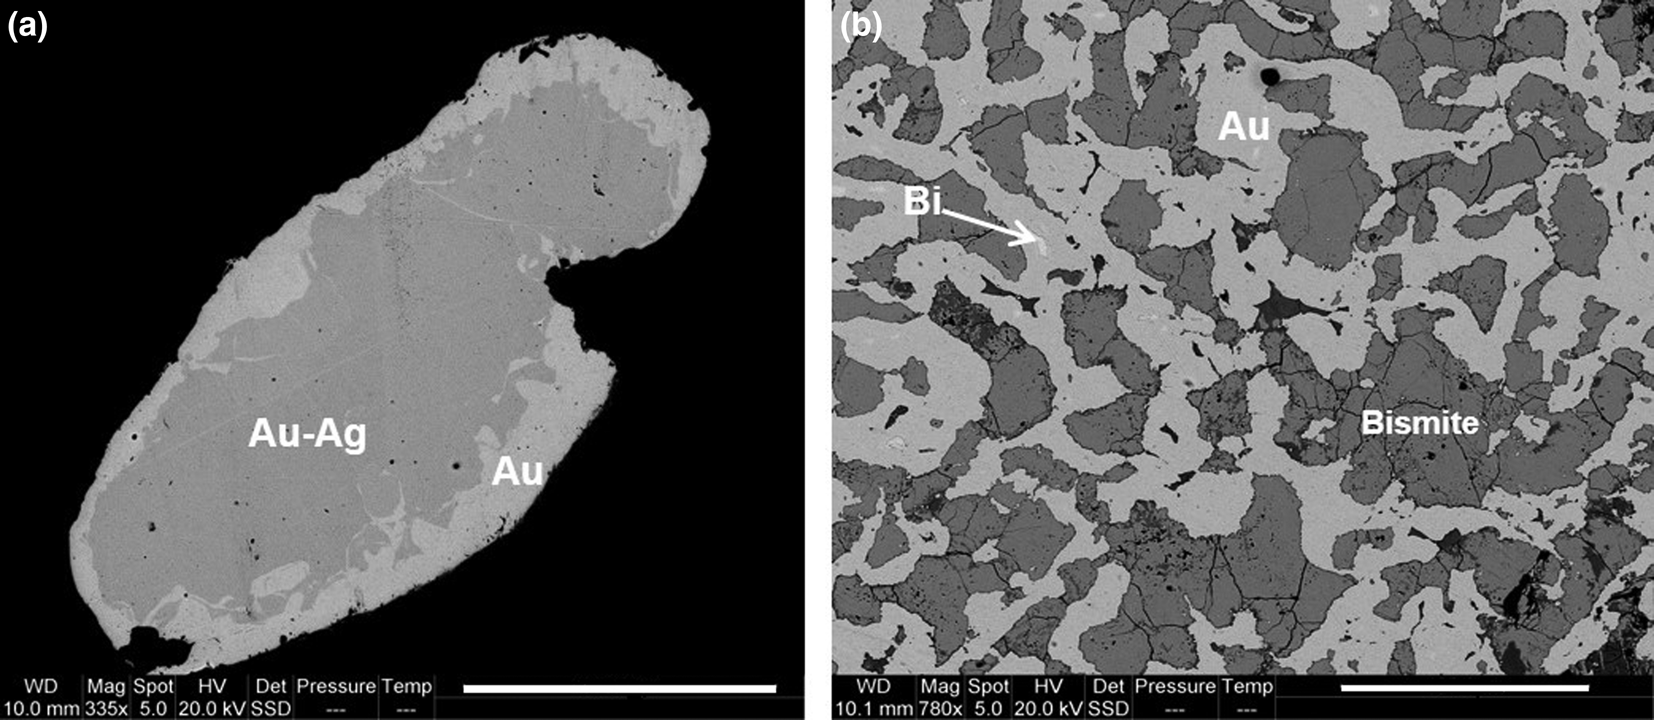
Almost all gold nuggets are zoned, although a large one, measuring 1.3 mm across shows a complex microintergrowth texture. The zoning pattern is rather similar in all grains consisting of Ag-rich nuclei surrounded by almost pure gold rims (Fig. 5a). Rims locally contain inclusions of partially chloritised biotite. The Ag content in nuclei ranges from 4.02 to 17.66 wt.% (7.21–28.46 at.%), whereas in rims it is always below 1.39 wt.% (2.52 at.%) (Table 3). A similar pattern of zoning has been reported in alluvial gold from several placer deposits in the southeastern United States and interpreted as the result of gold precipitation from the surrounding solutions on preexisting electrum nuggets (Groen et al., Reference Groen, Craig and Rimstidt1990). The grain with the intergrowth texture mainly consists of gold (with <3.06 wt.% Bi) and bismite (Bi2O3), but gold typically contains irregular inclusions of native bismuth with up to 3.24 wt.% Au (Fig. 5b; Table 3). This mineral assemblage and texture forms by low-temperature decomposition of maldonite (Au2Bi) giving rise to intergrown Au and Bi (Okamoto and Massalski, Reference Okamoto and Massalski1983; Zhou et al., Reference Zhou, Xiaoming, Fu, Lin and Yiang2016), followed by oxidation of Bi, probably at weathering conditions, forming bismite. The native Bi included in gold kept isolated from oxidising solutions and thus represents proof of the pre-weathering Au–Bi microintergrowth.
(a) zoned gold grain showing a silver-rich core and an irregular, variably-thick rim of almost pure gold; (b) gold–bismite intergrowth formed by the decomposition of maldonite (Au2Bi) into Au and Bi, followed by oxidation of Bi to bismite (note the presence of minute, unoxidised inclusions of Bi in gold). Scale bars: (a) 300 μm; (b) 100 μm
Representative electron microprobe analyses of gold grains and a gold–bismuth intergrowth.*
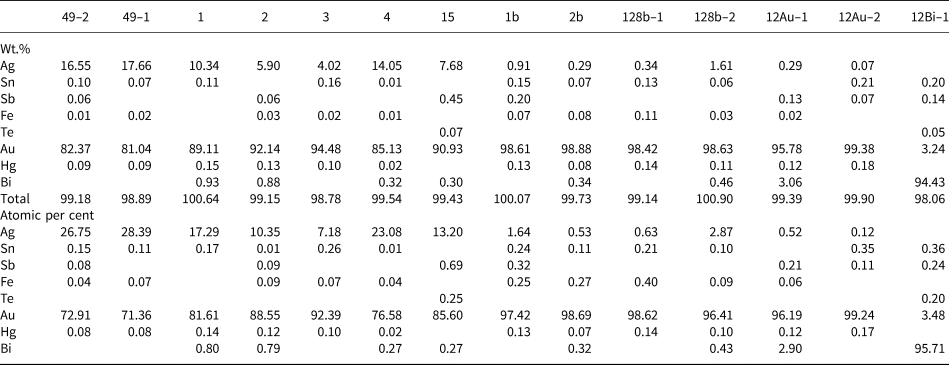
* Au (core): 49-1, 49-2, 1, 2, 3, 4 & 15; Au (rim): 1b, 2b, 128b-1 & 128b-2; Maldonite (Au): 12Au-1 & 12Au-2; Maldonite (Bi): 12Bi-1; blanks indicate below detection limit
Discussion
Origin of the sample
Tracing the local source of platina imported to Spain in the 18th century could be considered an almost impossible task due to the multitude of platina-bearing rivers in the western region of the Viceroyalty of New Granada and the lack of an efficient commercial structure at that time (Capitán-Vallvey, Reference Capitán-Vallvey1996). However, the mineralogical data obtained from the sample investigated here indeed allow us to carry out a comparison with published data on similar mineral concentrates recovered from some placer deposits from the Chocó region (Colombia) and the Esmeraldas province (Ecuador). Unfortunately, published mineralogical information exists only from several sites at the proximal and medial reaches of the Condoto River (Cabri et al., Reference Cabri, Harris and Weiser1996), a tributary of the San Juan River (Colombian Chocó), and from the medial reach of the Santiago River in the Esmeraldas province (Weiser and Schmidt-Thomé, Reference Weiser and Schmidt-Thomé1993).
As noted above, the composition of Pt–Fe alloys from this historical sample shows two maxima at 24–25 at.% Fe + Cu, as well as some few analyses grouping at ~17 at.% (Fig. 3). The comparison of this distribution with that of Pt–Fe nuggets collected at different sites along the proximal and medial reaches of the Condoto River (Cabri et al., Reference Cabri, Harris and Weiser1996) shows some similarities with the composition of Pt–Fe alloys from the El Paso site (Fig. 6a), located in the medial reach of the river. This figure might suggest that the composition of Pt–Fe alloys from the Condoto River slightly varies in terms of their Fe + Cu contents from the proximal to the medial reaches. This would provide evidence that the closer the sampling site to the source rocks (in this case, the Alto Condoto Zoned Complex located at the catchment area of the river) the higher the Fe + Cu contents of the alloys. However, this suggested subtle trend cannot be verified as no data from the distal reach of the Condoto River are available.
Comparison of the composition of Pt–Fe alloys of the sample investigated with those from different sampling points in the proximal and medial reaches of the Condoto River (Cabri et al., Reference Cabri, Harris and Weiser1996) and from the medial reach of the Santiago River (Weiser and Schmidt-Thomé, Reference Weiser and Schmidt-Thomé1993; Yucas, Reference Yucás2017; Castiella, Reference Castiella2018).
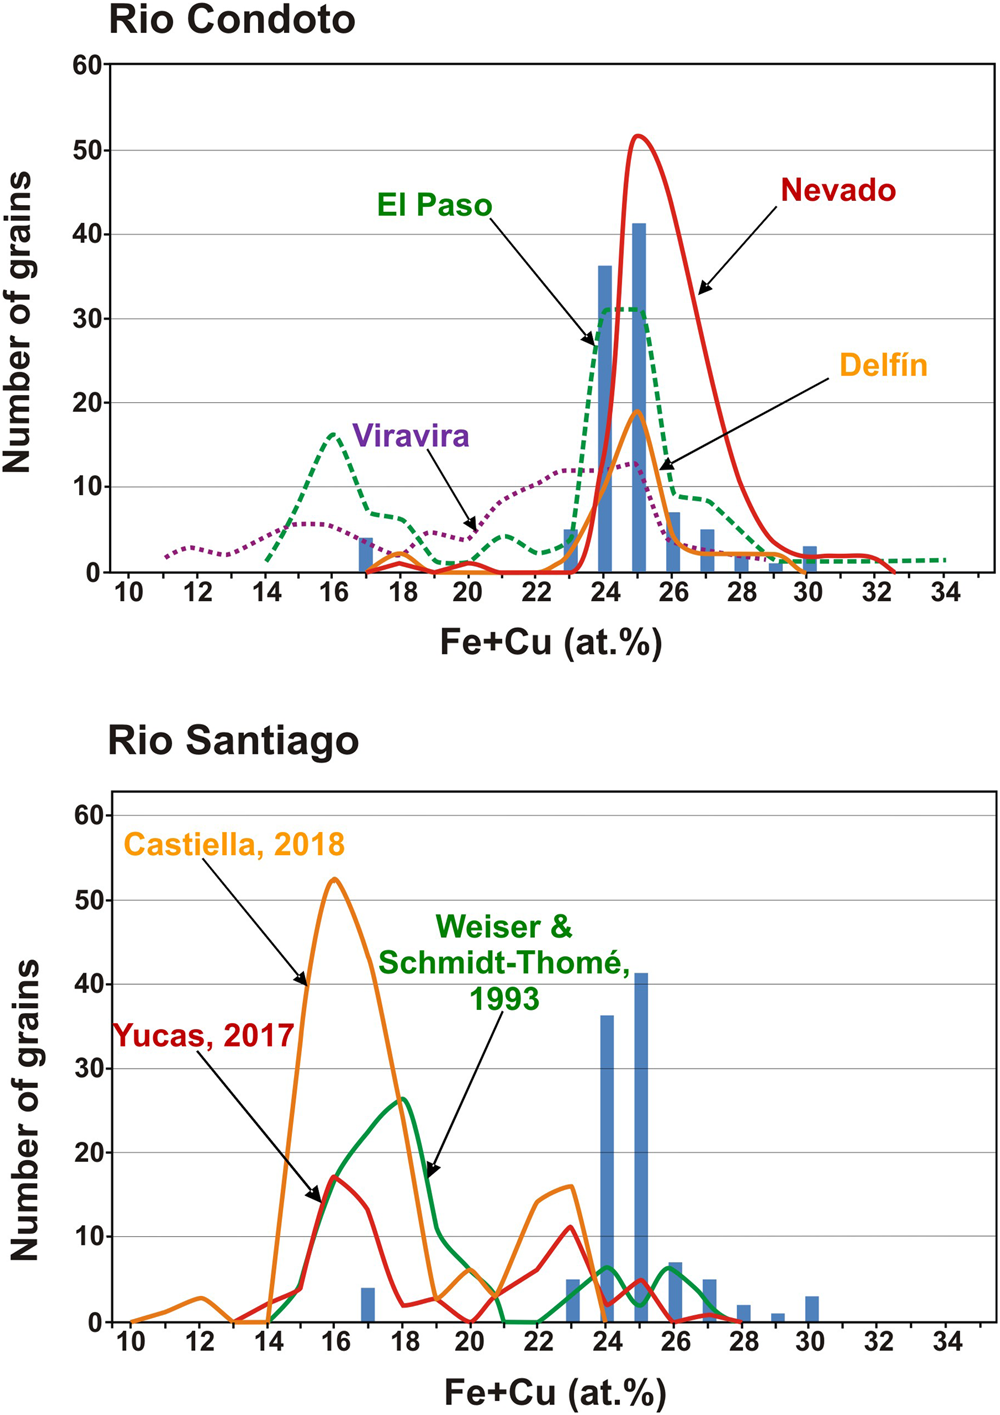
If the Pt–Fe alloys studied are compared with those from the medial reach of the Santiago River (Weiser and Schmidt-Thomé, Reference Weiser and Schmidt-Thomé1993), it becomes evident that Pt–Fe alloys from this river are richer in platinum than those of the investigated historical sample (Fig. 6b). According to Weiser and Schmidt-Thomé (Reference Weiser and Schmidt-Thomé1993) and the analytical data listed by Cabri et al. (Reference Cabri, Harris and Weiser1996), the Fe + Cu contents in the alloys show a bimodal distribution with most nuggets containing 15 to 21 at.% Fe + Cu and few of them between 23 and 28 at.% Fe + Cu (Fig. 6b). Unpublished results of a mineralogical survey of Pt–Fe nuggets, saved from being thrown back to the river in current mining operations on alluvial gold deposits located in the medial reach of the Santiago River too (Yucas, Reference Yucás2017; Lopez-Males, Reference López Males2017; Castiella, Reference Castiella2018), further confirm the bimodal distribution and the overall Fe + Cu contents of Pt–Fe alloys (the maximum is centred at 16 at.% Fe + Cu) from the Santiago River. This distribution contrasts with that of the Pt–Fe alloys of the historical sample whereby 96.15% of the nuggets contain between 21 and 30 at.% Fe (Fig. 6b). These data suggest that the Pt–Fe nuggets of this historical sample used by Chabaneau to purify platinum did not come from the Santiago River but could have been collected in a mine located in the proximal or medial reaches of one of the rivers of the Chocó region (Colombia).
The PGM assemblages occurring as inclusions in Pt–Fe nuggets supply additional information to approach the origin of the sample studied. Apart from the presence of osmium, laurite–erlichmanite, bowieite, tulameenite and several minerals of the Pt–Pd–Rh–Ir–Sb–Te system, the most striking feature of this sample is the abundance of Pt–Fe alloys containing emulsion-like inclusions of iridium (~63% of the grains studied). The fact that these type of iridium inclusions were described only in the Nevado and Delfin sampling sites of the Condoto River (Cabri et al., Reference Cabri, Harris and Weiser1996; Weiser, Reference Weiser and Cabri2002) suggest that this historical sample, very probably came from the proximal or medial reaches of a river in the Chocó region. A reasonable possibility could be the San Juan River, considering the importance of this river in the 18th century for mining operations (Capitán-Vallvey, Reference Capitán-Vallvey1988, Reference Capitán-Vallvey1989) and that many of the mining sites reported in historical documents (Tandó, Opogodó, Itsmina and Novita) are located close to its proximal reach or few kilometres downstream, at the mouth of the Condoto River. PGM inclusions in Pt–Fe alloys further contribute to discard the Santiago river as a source of the historical sample as none of the grains analysed by Weiser and Schmidt-Thomé (Reference Weiser and Schmidt-Thomé1993) or the 217 grains studied by Yucas (Reference Yucás2017), López-Males (Reference López Males2017) and Castiella (Reference Castiella2018) contain iridium inclusions. In contrast, the identified assemblages in these inclusions are characterised by abundance of Cu-bearing PGM such as hongshiite (PtCu) and cuprorhodsite (CuRh2S4) as well as some Pt and Pd sulfides [cooperite (PtS) and braggite (Pt,Pd)S], sperrylite (PtAs2) and bornite (Cu5FeS4) (Weiser and Schmidt-Thomé, Reference Weiser and Schmidt-Thomé1993; Yucas, Reference Yucás2017; López-Males, Reference López Males2017; Castiella, Reference Castiella2018).
Mineralogy of platina and the operations for platinum purification
The method of powder metallurgy developed by Chabaneau can be summarised simply in two reactions:
 $$\eqalign{& {\rm 3P}{\rm t}_{{\rm \lpar s\rpar }}{\rm}+ 4\,{{\rm NO}_ {3}}^{-} _{{\rm \lpar aq\rpar }}{\rm}+{\rm 18C}{\rm l}^-_{{\rm \lpar aq\rpar }} {\rm}+ 22{\rm H}^{\rm +\ }_{{\rm \lpar aq\rpar }} {\rm \;\;} \to {\rm \;\;3}{\rm H}_ 2{\rm PtC}{\rm l}_{{\rm 6\lpar aq\rpar }}{\rm}\cr &\quad +{\rm 4N}{\rm O}_{{\rm \lpar g\rpar }}{\rm}+ 8{\rm H}_ 2{\rm O}\quad \quad {\rm reaction\ 1} \cr & {\rm PtC}{\rm l}_ 6^{{\rm 2\ndash }} _{{\rm \lpar aq\rpar }}{\rm}+{\rm 2N}{\rm H}_ 4^{\rm +\ } _{{\rm \lpar aq\rpar }}{\rm \;\;}\to {\rm \;}\lpar {{\rm N}{\rm H}_ 4} \rpar _ 2{\rm PtC}{\rm l}_ 6\downarrow \quad \quad \quad {\rm reaction\ 2}} $$
By the first one, Pt from platina becomes dissolved in aqua regia as chloroplatinic acid through a complex proccess that involves chloroplatinous acid (H2PtCl4) and nitrosoplatinic chloride ((NO)2PtCl4). In the second one, Pt precipitates as ammonium chloroplatinate (solubility 0.499 g/100 mL). Alternatively and for reasons of economy, Chabaneau proposed to prepare the aqua regia with nitric acid and common salt, which meant Pt precipitated as a mixture of alkaline salts (Na2PtCl6; 39.7 g/100 mL; K2PtCl6; 1.10 g/100 mL). The thermal decomposition of the salts allowed Chabaneau to obtain malleable platinum by washing with water for alkaline salts, hammering the platinum sponge, followed by forging. However, he did not achieve satisfactory results very often as the metal obtained in different runs showed important variations in its characteristics such as the degree of malleability and fragility. According to Chaston (Reference Chaston1980): “the ingots, all too often cracked and sometimes even crumbled away under the hammer – all for no apparent reason” causing the despair of Chabaneau (Delanoue, Reference Delanoue1862). Furthermore, the substitute of Chabaneau in the Casa de la Platina, Joaquin Cabezas, mentioned this problem in a letter sent to the Minister of Finance, Miguel Cayetano Soler in 1804: “I had noticed, a long time ago, that although I always used the same means to purify platina, I did not obtain all bars with equal properties: some possessed all the ductility and softness of this metal, and in others there were a certain rigidity, which did not allow resisting many laminating and drawing operations” (Cabezas, Reference Cabezas1804).
Our results indicate that these effects noticed by Chabaneau were caused by the presence of impurities in platinum, such as other PGE (Os, Ir, Ru, Rh and Pd) as Au, Hg, Pb, Cu and mainly Fe were efficiently removed. Now we know (see Raykhtsaum, Reference Raykhtsaum2013) that alloying Rh, Ru and, especially Ir with Pt increases the melting point and hardness at reducing malleability, and the addition of Pd to Pt reduces the melting point and slightly increases the hardness. This suggests that Chabaneau did not completely control the platinum purification method, obtaining different platinum metal alloys in different experimental runs. The composition and consequently the properties of the alloys depended on the mineralogical nature of platina and on the parameters of the experimental procedure such as temperature, hydrochloric and nitric acid concentrations, particle size and liquid/solid ratio (Hasani, 2017).
The resistance of the PGE to dissolve from PGM into acids is due to the thermodynamic stability of their crystal lattices as well as the protective effect of the formation of monolayers of metal oxides that passivate the surface. Palladium, platinum and to a lesser extent rhodium and iridium are dissolved in aqua regia via the formation of chloro complexes. The formation of such complexes reduces the standard potential of the system, allowing the oxidation of the metals and promoting their dissolution. In contrast, Os and Ru do not form chloro complexes and their dissolution proceeds by alternate alkaline fusion or better oxidative fusions and subsequent treatment with hydrochloric acid, giving rise to the formation of Os and Ru volatile tetroxides (Tennant, Reference Tennant1804) (Table 4). The values of standard potentials of PGE listed in this table show that Pd and Rh dissolve easily under the redox potential conditions suitable for the dissolution of platinum in aqua regia but Ir requires higher values. Oxidation of Os and Ru even as laurite (RuS2) to form the volatile tetroxides does not proceed in aqua regia. Thus, dissolution of platina such as that investigated here via reaction 1 should yield a solution containing Pt, Pd and Rh chloride complexes and an insoluble black residue concentrating Os, Ir and Ru. However, the variability of physical properties of platinum produced by Chabaneau suggests that in some experimental runs Ir could have dissolved, depending on aqua regia concentration, temperature and time conditions, appearing later in the solid platinum. Dissolution of Ir gives rise to a significant change in colour in the solution, from yellow (Ir free) to red (Ir bearing) (Lewis, Reference Lewis1753). It should be expected that thermal treatment and sintering of (NH4)2PtCl6 containing minor amounts of (NH4)2RhCl6, (NH4)2PdCl4 and mainly (NH4)2IrCl6 give rise to a physical mixture of Pt, Pd, Rh and Ir. The forging process used by Chabaneau to produce platinum ingots would promote alloying of the small amounts of Pd and Rh detected in platina with Pt but hardly reach temperatures above 1000°C to incorporate Ir in the alloy. Pt–Ir phase relations (ASM Alloy Phase Diagram Database) predicts that below this temperature Pt and Ir remain unmixed and the resulting material turns highly brittle, as Chabaneau commonly ascertained.
Standard potential of platinum-group elements.
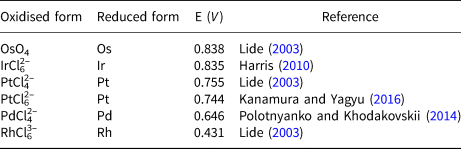
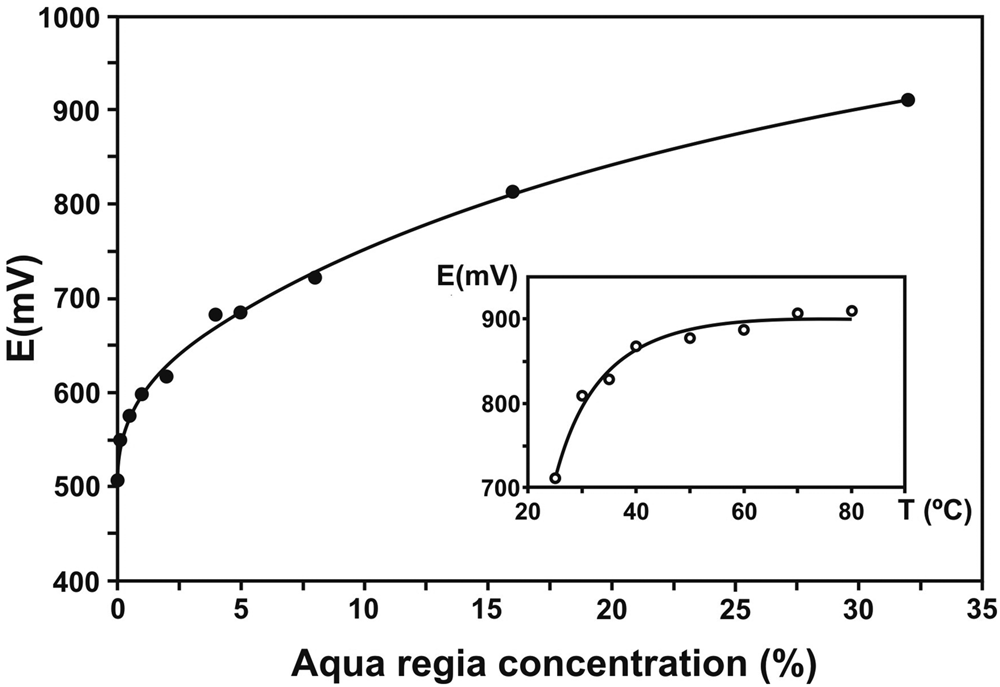
These experimental problems were approached and solved by Wollaston (Reference Wollaston1829) by controlling the oxidising character of the reagent using diluted aqua regia (the method remained secret until he passed away in December 1828). He wrote to “recommend, that to every measure of the strongest muriatic acid employed, there be added an equal measure of water”. Dissolution of platina ore with this diluted aqua regia took 3–4 days and required gradual heating. Recent experimental results by Elomaa et al. (Reference Elomaa, Seisko, Junnila, Sirviö, Wilson, Aromaa and Lundström2017) support this procedure as they clearly show that both concentration of aqua regia and temperature increase the redox potential of the aqua regia (Fig. 7). As expected from the standard potential values listed in Table 4, this analytical procedure prevented dissolution of Ir, Os and Ru, and consequently left a residuum containing mainly these three metals.
Dependence of redox potential with aqua regia concentration. Inset: Temperature dependence of redox potential at 30% aqua regia. Modified from Elomaa et al. (Reference Elomaa, Seisko, Junnila, Sirviö, Wilson, Aromaa and Lundström2017).
Provenance of platina and success of platinum purification
As discussed above, the success of Chabaneau in obtaining purified malleable platinum metal was strongly influenced by the amount of Ir occurring either as inclusions/exsolution lamellae or in solid solution in platina nuggets. The Ir content in Pt–Fe alloys is similar in all the placer deposits studied in the region (Weiser and Schmidt-Thomé, Reference Weiser and Schmidt-Thomé1993; Cabri et al., Reference Cabri, Harris and Weiser1996; Yucas, Reference Yucás2017; López-Males, Reference López Males2017; Castiella, Reference Castiella2018), hence the key factor controlling the quality of platinum metal in Chabaneau's experiments was the presence/absence or mainly the abundance of iridium inclusions in Pt–Fe nuggets. It should be expected that the higher the amount of iridium inclusions in the crude platina was, less malleable and more brittle platinum was obtained. Consequently, any experiment on the sample studied here and on any other from the same locality (most probably the Chocó region) should not produce satisfactory results and this might be the reason why Chabaneau rejected such a sample and left it in the Mineral Museum of the School of Applied Chemistry at El Turco Street.
The presence of a high content of gold in the sample investigated (16.61%) does not agree with the fact that the platina shipped to Spain should be the residue left after gold extraction. According to Cabezas (Reference Cabezas1797) all the platina samples he had stored in the Casa de la Platina and in the laboratories of El Turco street had experienced several treatments to extract gold. As the methods used at that time to separate gold from platina were amalgamation (by addition of mercury) and inquartation (by addition of silver) (Capitán-Vallvey, Reference Capitán-Vallvey1989) one would expect to find some residues or mineralogical evidence of the added metals. During our investigation we could find no traces of mercury or any effects of silver addition on gold nuggets; in contrast most gold grains are zoned with almost silver-free rims. This evidence leads us to suggest that this historical sample is a small portion of the crude material imported to Spain before the establishment of the Platina Monopoly in 1787 and most probably constitutes the remaining material of one of the two first shipments sent to Spain in 1767 and 1784 (Table 5). The compositional and mineralogical features of the sample studied, similar to the material exploited nowadays in the Colombian Chocó, suggest a link with the first one, sent from one of the Chocó Royal Boxes (Table 5).
Provenance of platina shipments from New Granada to Spain.
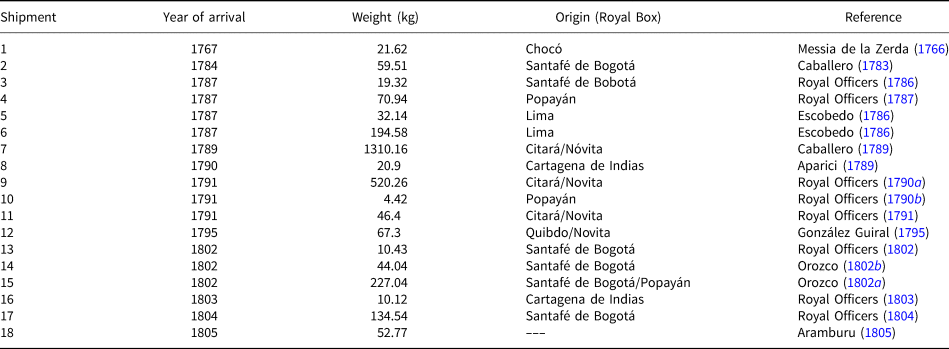
The flow of platina shipments to Spain after the foundation of the Platina Monopoly was carried out through the Royal Boxes of the New Granada Viceroyalty, which were in charge of recording taxes for the Spanish Monarchy. Among the 14 Royal Boxes of the Viceroyalty, only those of Santafé de Bogotá (the principal) and the so-called auriferous boxes were connected with platina. The latter were those from Antioquía, Popayán, Novita, Citará, Cartagena de Indias and Remedios, which in turn had subordinate boxes in charge of separate gold from the crude concentrates extracted from their nearby mines and recovered platina to be sent to Spain. According to Table 5, ~69% of the platina shipped to Spain from 1767 to 1805 came from the Chocó area (Citará, Novita and Quibdo Royal Boxes) whereas only 10.6% came from Popayán. The remaining 20.4% came from Santa Fé de Bogotá and Cartagena de Indias without specification of their local provenance. An exception were shipments 5 and 6 coming from the Viceroyalty of Peru that were sent by private individuals and not from the Royal Boxes (Capitán-Vallvey, Reference Capitán-Vallvey1999). The random temporal distribution of shipments containing platina from different mining sites might explain the heterogeneous chemical and, mainly mineralogical composition of the crude material used by the lab workers of the Casa de la Platina as well as their bewilderment when obtaining different results using the same standard procedure.
Conclusions
A platina sample from the Mineralogical Museum of the School of Applied Chemistry at El Turco Street, in Madrid, saved from the looting of Napoleonic troops in 1808, has been investigated mineralogical and historically.
This historical platina sample (now at the National Museum of Natural Sciences in Madrid) is a heavy-mineral concentrate consisting of Pt–Fe alloy and gold nuggets, associated with ilmenite–hematite, chromian spinel and goethite, as well as with some other minor minerals. Thus, the material known as platina, among other varied names including ‘platina del Pinto’, ‘platita’, ‘platilla’, ‘white gold’, and ‘Juan Blanco’ in the Viceroyalty of New Granada in the 18th century, in fact corresponds to Pt–Fe alloy.
The Pt–Fe alloy nuggets have a quite homogeneous composition, containing mainly 81.97–90.75 wt.% Pt and 5.08–10.81 wt.% Fe, with minor Cu (0.15–1.1 wt.%), Os (0.07–3.77 wt.%), Ir (<5.62 wt.%), Rh (<2.26 wt.%), Pd (<2.26 wt.%) and Ru (<0.72 wt.%). Their mineralogy is characterised by the presence of a varied set of inclusions of platinum-group minerals: Ir alloys (they occur in 63% of the nuggets), Os alloys, laurite–erlichmanite, bowieite, tulameenite and undetermined Pt–Pd–Ir–Rh antimonides and tellurides.
The composition and mineralogical nature of Pt–Fe nuggets are quite similar to those extracted nowadays in the Chocó region (western Colombia), particularly to those from the proximal and medial reaches of the Condoto river, but strongly differ from those occurring in gold placers in the Santiago river in Ecuador.
The high Ir content of the nuggets investigated seems to be characteristic of the Pt–Fe nuggets mined in the Colombian Chocó and would explain the quite frequent lack of success of the François Chabaneau's method for purifying platinum. As he did not modify the concentration of aqua regia, he would probably have frequently obtained a mixture of (NH4)2PtCl6 and (NH4)2IrCl6 which, after forging, gives rise to highly brittle platinum metal due to the presence of unmixed iridium. Only crude platina consisting of Ir-poor, Pt–Fe alloys free of Ir inclusions would have been suitable for obtaining malleable platinum via Chabaneau's method.
Acknowledgements
The authors thank the National Museum of Natural Sciences (Madrid) for allowing us to work on the historical sample used in this study. We also acknowledge two anonymous reviewers and the Principal Editor (Roger Mitchell) for their detailed and critical review of a preliminary version of the manuscript.


 Open access