

1. INTRODUCTION
Mass loss from the Greenland ice sheet has been increasing since the 1990s, resulting in an enhanced contribution to sea-level rise (e.g., Rignot and others, Reference Rignot, Box, Burgess and Hanna2008, Reference Rignot, Velicogna, Van den Broeke, Monaghan and Lenaerts2011; Shepherd and others, Reference Shepherd2012). Satellite observations and surface mass-balance modelling have demonstrated that the recent mass loss from the Greenland ice sheet is driven by two processes: increases in surface melting and ice discharge from outlet glaciers (Rignot and others, Reference Rignot, Box, Burgess and Hanna2008, Reference Rignot, Velicogna, Van den Broeke, Monaghan and Lenaerts2011; van den Broeke and others, Reference van den Broeke2009; Sasgen and others, Reference Sasgen2012; Enderlin and others, Reference Enderlin2014). Observations in southeastern and central-west Greenland showed significant flow acceleration and increase in ice discharge from marine-terminating outlet glaciers in the early 2000s (Joughin and others, Reference Joughin, Abdalati and Fahnestock2004, Reference Joughin2008; Howat and others, Reference Howat, Joughin, Tulaczyk and Gogineni2005, Reference Howat, Joughin and Scambos2007; Luckman and others, Reference Luckman, Murray, de Lange and Hanna2006; Rignot and Kanagaratnam, Reference Rignot and Kanagaratnam2006; Enderlin and others, Reference Enderlin2014). Accelerated ice flow resulted in enhanced stretching of ice along the glacier flow direction. This induced so-called dynamic thinning (Howat and others, Reference Howat, Joughin and Scambos2007, Reference Howat, Joughin, Fahnestock, Smith and Scambos2008; Pritchard and others, Reference Pritchard, Arthern, Vaughan and Edwards2009), which resulted in active calving and rapid retreat of the glaciers. A recent study reported that the relative contribution of the ice discharge in the ice-sheet mass budget is decreasing and more than the half of the mass loss between 2009 and 2012 was due to negative surface mass balance (Enderlin and others, Reference Enderlin2014). However, a future projection of ice discharge from the Greenland ice sheet is still crucial for understanding the magnitude and timing of global sea-level rise. There is a large uncertainty in the future projection of ice discharge because climatic/oceanic control on ice discharge is poorly understood (Carr and others, Reference Carr, Stokes and Vieli2013a). Therefore, an understanding of the mechanisms controlling glacier dynamics is crucial for predicting both the response of the Greenland ice sheet to climate change and future sea-level rise (Church and others, Reference Church, Stocker, Qin, Plattner, Tignor, Allen, Boschung, Nauels, Xia, Bex and Midgley2013).
The magnitudes of acceleration, thinning and retreat of outlet glaciers are unevenly distributed over Greenland (e.g. Pritchard and others, Reference Pritchard, Arthern, Vaughan and Edwards2009; Moon and others, Reference Moon, Joughin, Smith and Howat2012; Murray and others, Reference Murray2015), and it is increasingly important to monitor the northwestern sector of the ice sheet. This is because ice loss is spreading into northwestern Greenland, as demonstrated by measurements from the Gravity Recovery and Climate Experiment (GRACE) mission, long-term crustal uplift monitoring using the GPS, and repeat elevation measurement by ice, cloud and land elevation satellite (ICESat) (Pritchard and others, Reference Pritchard, Arthern, Vaughan and Edwards2009; Velicogna, Reference Velicogna2009; Khan and others, Reference Khan, Wahr, Bevis, Velicogna and Kendrick2010). Recent studies reported significant retreat and acceleration of marine-terminating outlet glaciers in northwestern Greenland in the last decade (Moon and others, Reference Moon, Joughin, Smith and Howat2012, Reference Moon, Joughin and Smith2015; Carr and others, Reference Carr, Vieli and Stokes2013b; Jensen and others, Reference Jensen, Box and Hvidberg2016). Kjær and others (Reference Kjær2012) studied elevation changes and surface mass balance along the coast of Melville Bay in northwestern Greenland. This study reported significant ice loss in this region since 1985 and demonstrated the importance of glacier dynamics in the recession of the ice sheet. However, these previous studies were carried out in multiyear or longer temporal resolutions, and thus higher frequency observation is needed to capture the cause of the changes in marine-terminating outlet glaciers.
Previous studies proposed several mechanisms as drivers of flow speed changes of marine-terminating outlet glaciers in Greenland. One mechanism is the change in the force balance near the terminus. Stresses acting on ice are subject to change whenever a calving glacier retreats, thins, or reduces buttressing effects (Thomas, Reference Thomas2004; Nick and others, Reference Nick, Vieli, Howat and Joughin2009). These geometrical changes reduce resistive stress acting on the terminus, which can be significant enough to cause flow acceleration (Joughin and others, Reference Joughin, Abdalati and Fahnestock2004; Thomas, Reference Thomas2004; Howat and others, Reference Howat, Joughin, Tulaczyk and Gogineni2005). The second mechanism is meltwater input to the glacier bed, which enhances basal ice motion by elevating subglacial water pressure (Zwally and others, Reference Zwally2002). Seasonal and shorter-term speedups observed in Greenlandic glaciers were attributed to this mechanism (e.g. Andersen and others, Reference Andersen2010; Sole and others, Reference Sole2011). However, several studies on land-terminating glaciers in Greenland have demonstrated that melt increase causes long-term slowdown of the glaciers. Such slowdown is a consequence of an earlier development of a subglacial drainage system, leading to a long-lasting period of time with reduced subglacial water pressure (Sundal and others, Reference Sundal2011; Tedstone and others, Reference Tedstone2015). Studies on this mechanism are sparse in Greenland, particularly at marine-terminating glaciers. Therefore, the consequence of atmospheric warming for ice dynamics of marine-terminating glaciers in Greenland is uncertain.
Changes at the terminus are possibly triggered by oceanic as well as atmospheric forcing (Carr and others, Reference Carr, Stokes and Vieli2013a; Straneo and others, Reference Straneo and Heimbach2013). Along the southeastern Greenland coast, many glaciers began to retreat in the summer of 2003, a year of record high air and ocean temperatures (Howat and others, Reference Howat, Joughin, Fahnestock, Smith and Scambos2008). Rapid glacier retreat associated with atmospheric warming was also observed in other sectors of the Greenland ice sheet (Moon and Joughin, Reference Moon and Joughin2008; Howat and Eddy, Reference Howat and Eddy2011). Most likely, ongoing changes in Greenlandic outlet glaciers are the result of multiple processes occurring near the glacier front. Therefore, it is important to assess the relative importance of the relevant processes and specify the most dominant mechanism by studying each individual glacier.
In this study, we present a comprehensive dataset of recent changes in ice front positions and ice speed fields of marine-terminating outlet glaciers located along the coast of Prudhoe Land, northwestern Greenland (Fig. 1). Recently, several glaciological studies have been carried out in this region (e.g. Porter and others, Reference Porter2014; Sugiyama and others, Reference Sugiyama2014, Reference Sugiyama, Sakakibara, Tsutaki, Maruyama and Sawagaki2015; Tsutaki and others, Reference Tsutaki, Sugiyama, Sakakibara and Sawagaki2016; Jouvet and others, Reference Jouvet2017). We analyzed satellite images of 19 glaciers to map their front positions and to measure 2-D ice flow fields during the period from 1987 to 2014. Frontal variations and ice speed changes were analyzed with an annual resolution and compared with atmospheric and oceanic conditions and glacier geometry. Based on the study results, we discuss a possible mechanism for the recent glacier changes observed in the study region.
Locations of the studied glaciers along the coast of Prudhoe Land. The marker color represents the frontal displacement rate from 2000 to 2014 (advance in positive). The background is a true color mosaic Landsat 8 OLI image acquired on 9 July 2014. The inset shows the location of the study area in Greenland.

2. STUDY SITE
The focus of our study is the 19 marine-terminating outlet glaciers located along the coast of Prudhoe Land in northwestern Greenland (77.51–78.18°N and 66.01–72.78°W) (Fig. 1). In the eastern half of the study area, glaciers drain into the ~20 km wide fjord known as Inglefield Bredning. Glaciers in the western half drain into smaller fjords, which are directly connected to northern Baffin Bay (Fig. 1). The width of the studied glaciers at the calving fronts ranges from 0.6 km (Bu Glacier) to 5.0 km (Tracy Glacier) with a mean width of 2.0 km.
Glaciers terminating in the eastern part of Inglefield Bredning retreated between 1892 and 1985 (Dawes and van As, Reference Dawes and van As2010). Since the 1990s, generally retreating trends have been reported for some of the studied glaciers, including the most rapid retreat observed at Tracy Glacier at a rate of 248 m a−1 from 1991 to 2010 (Howat and Eddy, Reference Howat and Eddy2011). Heilprin and Tracy Glaciers are the two largest glaciers in this region, having a drainage basin of 10 439 km2 in total and ice volume loss of 1.0 km3 a−1 in 2005 (Rignot and Kanagaratnam, Reference Rignot and Kanagaratnam2006). Porter and others (Reference Porter2014) estimated the mass budget of these two neighboring glaciers and found faster ice loss at Tracy Glacier. They attributed the difference in the mass budget to the ocean depth at the calving front, i.e. the ice front of Tracy Glacier is more deeply submerged in ~600-m-deep water and thus more strongly influenced by ocean heat. According to previously reported ice speed maps covering this region (Rignot and Kanagaratnam, Reference Rignot and Kanagaratnam2006; Joughin and others, Reference Joughin, Smith, Howat, Scambos and Moon2010; Moon and others, Reference Moon, Joughin, Smith and Howat2012), the fastest flow speed occurs near the terminus of Tracy Glacier, where the ice flowed at a rate of 1400 m a−1 in 2000 (Rignot and Kanagaratnam, Reference Rignot and Kanagaratnam2006). Sugiyama and others (Reference Sugiyama, Sakakibara, Tsutaki, Maruyama and Sawagaki2015) performed field and satellite observations at Bowdoin Glacier and reported a more than twofold speedup from 207 to 457 m a−1 between 2000 and 2004, which was followed by a rapid retreat which began in 2008. According to the study, the rapid retreat of Bowdoin Glacier was triggered by atmospheric and/or ocean warming, and strongly influenced by changes in glacier dynamics near the calving front.
3. DATA AND METHODS
3.1. Data
To measure glacier front positions and ice flow speed, we used satellite images of the Landsat 8 Operational Land Imager (OLI) (level 1 T, with 15/30 m resolutions, 2013/14), the Landsat 7 Enhanced Thematic Mapper Plus (ETM+) (level 1T, with 15/30 m resolutions, 1999–2014), and the Landsat 4 and 5 Thematic Mapper (TM) (level 1T, with 30 m resolution, 1987–98) distributed by the US Geological Survey (Table 1). Because of polar night in the study area, the images used in this study are mainly from the summer period (e.g. May–September). Failure of the scan-line corrector (SLC) on the ETM+ after 31 May 2003 resulted in null strips; however, the geometric quality of the data, when properly masked, is as good as the pre-SLC failure data (Howat and others, Reference Howat, Box, Ahn, Herrington and McFadden2010).
Landsat images used in this study

We obtained daily mean air temperatures at Pituffik (Thule Air Base; 76.53°N, 68.75°W; 77 m a.s.l.), ~100 km south of the study site, from the National Oceanic and Atmospheric Administration. The temperature dataset was utilized to calculate seasonal temperatures and the sum of the positive degree days (PDD) for each year from 1985 to 2014. We also analyzed summer (June–August) mean sea surface temperature (SST) within 77–78°N and 66–72°W from 1985 to 2014. For this purpose, we used Version 5 of the Advanced Very High Resolution Radiometer (AVHRR) Pathfinder Level 3 SST data between 1985 and 2009, which are available with 0.044° and monthly resolutions. We also used Version 3.38 of the Moderate Resolution Imaging Spectro-radiometer (MODIS) Terra level 3 SST data between 2000 and 2014, which are available with 4 km and monthly resolutions. These SST data were provided by the Physical Oceanography Distributed Active Archive Center.
3.2. Ice front position
Glacier front positions were mapped from 1987 to 2014, using false color composite images generated by assigning bands 3–5 (Landsat 4/5/7) and bands 4–6 (Landsat 8) to blue, green and red colors, respectively (McNabb and Hock, Reference McNabb and Hock2014). In each image, the ice fronts of the studied glaciers were manually delineated using geographic information system software QGIS. We obtained 54–106 ice front positions (78 on average) for each of the studied glaciers. Mean displacement of the calving front was computed by dividing the areal change near the terminus between two successive images by the width of the ice front (Moon and Joughin, Reference Moon and Joughin2008). The relative positioning errors introduced in the process of overlapping the Landsat images were ±8 m for the Landsat 8, ±21 m for the Landsat 7 and ±22 m for the Landsat 4 and 5. These values were obtained by averaging the horizontal displacement of off-ice surface features computed by the method described in Section 3.3.
3.3. Ice speed
Ice speed was measured by tracking displacement of glacier surface features on temporally separated satellite image pairs (Scambos and others, Reference Scambos, Dutkiewicz, Wilson and Bindschadler1992). We modified a previously developed automatic image matching scheme (Sakakibara and Sugiyama, Reference Sakakibara and Sugiyama2014) to measure the displacement using the orientation correlation method in the frequency domain (CCF-O) (Haug and others, Reference Haug, Kääb and Skvarca2010; Heid and Kääb, Reference Heid and Kääb2012). The CCF-O method was applied in this study because this scheme works better regardless of image contrast as compared with conventional methods (Heid and Kääb, Reference Heid and Kääb2012). Another advantage of the CCF-O method is its ability to match the striped Landsat images which occurred after the SLC failure (Heid and Kääb, Reference Heid and Kääb2012). We processed 1640 pairs of Landsat images acquired from 1987 to 2014 with temporal separations of 16–365 days. We excluded results obtained with low signal-to-noise ratio (<30), which occurred typically in snow-covered accumulation areas. Displacement vectors based outside the glaciers were removed using digital glacier outlines from the Greenland Mapping Project (GIMP) ice cover mask (Howat and others, Reference Howat, Negrete and Smith2014). Remaining vectors were filtered using directional and median low-pass filters (Sakakibara and Sugiyama, Reference Sakakibara and Sugiyama2014). To obtain a smooth flow field, we took the median values of 7 × 7 neighboring pixels in the displacement vector fields (Howat and others, Reference Howat, Box, Ahn, Herrington and McFadden2010). In this study, annual speed was calculated by taking the average of all monthly speeds, which were obtained from all speed data available in the month of interest. Monthly speed was interpolated when no speed data are available in the month.
Possible errors in a feature-tracking method include (1) ambiguities in the cross-correlation peak, (2) co-registration errors, and (3) false correlations (Howat and others, Reference Howat, Box, Ahn, Herrington and McFadden2010). Errors caused by (1) and (2) were estimated from the root mean square of horizontal displacement of off-ice surface pixels, where the displacement should be zero. Errors caused by (3) were minimized by applying the filters described above. The sum of the errors (1)–(3) computed for each image pair typically ranged from a few to 200 m a−1 with the mean value of 35 m a−1, depending on image quality and temporal separation.
4. RESULTS
4.1. Ice front position
All the studied glaciers along the coast of Prudhoe Land retreated over the study period (Fig. 2 and Table 2). The rate of frontal displacement from the 1980s to 2014 measured at each individual glacier ranged from −200 ± 1 m a−1 (Tracy Glacier) to −12 ± 1 m a−1 (Meehan Glacier), and the median and mean rates were −30 and −44 m a−1, respectively. Among the studied glaciers, Heilprin, Tracy, Farquhar, Melville, Bowdoin and Diebitsch Glaciers retreated by more than 1 km from the 1980s to 2014. The retreat trend is more evident after 2000 as represented by the median (mean) displacement rates of −3 (−6) m a−1 in the 1980s–99 and −40 (−65) m a−1 in 2000–14 (Table 2).
Cumulative frontal displacements of the studied glaciers from the 1980s to 2014. Upward change in the ordinate represents glacier advance.

Rates of frontal displacement for the studied glaciers in the 1980s–2014, the 1980s–99 and 2000–14

Positive values indicate glacier advance. Values in this table were calculated using ice front positions on 1 October in starting and ending years of each period, which were obtained by interpolating the data. ‘NA’ indicates no data available.
Tracy Glacier retreated most rapidly during the study period (Fig. 2 and Table 2). The glacier advanced by 0.7 km between 1987 and 1999, and then retreated by 4.8 km from 1999 to 2007. The retreat rate slightly decreased after 2007, but it increased again in 2011 and the glacier retreated by 1.0 km from 2011 to 2014. The total retreat distance from 1999 to 2014 was 5.7 km (Fig. 2). Farquhar Glacier shared its terminus with Tracy Glacier until they lost contact with each other in 2002 after the disintegration of the terminus. Farquhar Glacier began retreat after this by losing its lower 0.9 km from 2002 to 2007 (Fig. 2). Heilprin Glacier showed a slight advance from 1987 to 1999, which is consistent with the observation at Tracy Glacier. The glacier then began to retreat in 1999 and lost its lower 2.0 km between 1999 and 2014 (Fig. 2). This retreat rate was smaller than that of Tracy Glacier over the same period, but one of the highest among the studied glaciers. Bowdoin Glacier retreated by 0.1 km from 1999 to 2008. After this relatively stable period, this glacier rapidly retreated by 1.2 km from 2008 to 2013 (Fig. 2). Diebitsch Glacier retreated by 0.6 km from 1997 to 2004. The glacier front then advanced slightly until 2006, followed by another retreat of 1.0 km from 2006 to 2014 (Fig. 2).
4.2. Ice speed
Figure 3 shows the ice speed distributions over the studied glaciers in 2014. The ice speed near the front of each individual glacier ranges from 10 m a−1 to 1740 m a−1 (Table 3). Relatively fast ice flow (>500 m a−1) was observed near the front of Heilprin, Tracy, Farquhar and Melville Glaciers, which drain into the eastern part of Inglefield Bredning (<67°W) (Fig. 3). Among 17 glaciers with data available for the period from 2000 to 2014, seven glaciers accelerated by more than 5 m a−2, whereas 10 glaciers showed no substantial change (speed change was <5 m a−2) (Fig. 4 and Table 3). The acceleration from 2000 to 2014 averaged over the glaciers was 6.6 m a−2, but this number is influenced by the significant acceleration of several glaciers (Heilprin, Tracy, Farquhar, Melville, Sharp, Bowdoin and Diebitsch Glaciers) and thus does not represent the general trend.
Ice speed distributions over (a) the western and (b) eastern areas of Prudhoe Land in 2014. The background is a Landsat 8 OLI image acquired on 9 July 2014. The speed at each location indicates annual mean in 2014. The white curves are central flowlines used for the calculation of acceleration shown in Table 3 and for the vertical cross sections in Fig. 5.

Flow acceleration of the studied glaciers in (a) the western and (b) eastern areas of Prudhoe Land in 2000–14. The background is a Landsat 8 OLI image acquired on 9 July 2014.

Ice speeds in 2014 and acceleration between 2000 and 2014 near the termini at the center of the studied glaciers

The distance from the 2014 fronts to the speed sampling sites are given, and the acceleration was computed as a mean along the central flowline (Fig. 3) within 5 km from the 2014 front. ‘NA’ indicates no data available.
To better understand the changes in glacier dynamics over time, we investigated speed changes near the front of Heilprin, Tracy, Farquhar, Bowdoin and Diebitsch Glaciers, which indicated substantial acceleration from 2000 to 2014. The ice speed of Heilprin Glacier was relatively stable before 2000 (Fig. 5a). In this period, speed at 2 km from the 1987 front fluctuated within a range of only 1040–1180 m a−1. Between 2000 and 2014, ice speeds near the front gradually increased from 1120 to 1450 m a−1. During the same period, speed at 10 km from the 1987 front increased from 580 to 770 m a−1 (Fig. 5a). At Tracy Glacier, ice speed at 8 km from the 1987 front was relatively stable before 2000 within a range between 890 and 960 m a−1. Then the speed increased in 2000–07 from 1000 to 1470 m a−1, followed by further acceleration from 1380 to 2070 m a−1 in 2010–14 (Fig. 5b). Similarly, Farquhar Glacier substantially accelerated between 2000 and 2014, showing nearly twofold speed increase from 410 to 790 m a−1 near the front (Fig. 5c). Bowdoin Glacier showed no significant speed change between 1987 and 1999. After this stable period, the glacier accelerated in 1999–2006 from 164 to 446 m a−1. This large acceleration was followed by a slowdown, and then another acceleration began in 2012 (Fig. 5d). The speed variations at Bowdoin Glacier are similar to those at Diebitsch Glacier located 80 km west. This glacier substantially accelerated between 1999 and 2006 (from 106 to 242 m a−1), which was followed by a slowdown in 2006–08 and another acceleration in 2008–10 (Fig. 5e).
Ice speed along the central flowline shown in Figure 3 and its temporal variations at (a) Heilprin, (b) Tracy, (c) Farquhar, (d) Bowdoin and (e) Diebitsch Glaciers. The brown, light blue and blue areas indicate bedrock, glacier and the sea, respectively. Dashed line indicates the sea level. Gray line indicates the flotation level computed with ice and water densities of 910 kg m−3 and 1025 kg m−3, respectively. Surface and bed topography in (a)–(c) are from Center for Remote Sensing of Ice Sheets (CReSIS) level 2 radar data (CReSIS, 2016) obtained on 12 May 2014. Surface and bed topography in (d) are from Sugiyama and others (Reference Sugiyama, Sakakibara, Tsutaki, Maruyama and Sawagaki2015). Surface elevation in (e) is from GIMP DEM (Howat and others, Reference Howat, Negrete and Smith2014).

5. DISCUSSION
5.1. Drivers of retreat since 2000
All the studied glaciers showed frontal retreat over the period from the 1980s to 2014, and most of the glaciers began to retreat around the year 2000 (Fig. 2 and Table 2). Climatic forcing is a possible driver of the observed glacier retreat, in line with the rapid warming trend as reported in the Arctic (e.g. Carr and others, Reference Carr, Stokes and Vieli2013a). Atmospheric warming causes more negative surface mass balance, which results in ice thinning near the calving front and may drive significant calving events due to flotation (van der Veen, Reference van der Veen1996, Reference van der Veen2002). Moreover, increased amounts of surface meltwater fill crevasses near the calving front and may trigger calving by the process of hydrofracturing (Sohn and others, Reference Sohn, Jezek and van der Veen1998; Vieli and Nick, Reference Vieli and Nick2011; Carr and others, Reference Carr2015). In order to investigate the potential influence of atmospheric warming on recent glacier retreat in Prudhoe Land, we compare the observed frontal variations with air temperatures.
Figure 6 shows mean rates of frontal displacements for six rapidly retreating glaciers (having retreated by more than 1 km between the 1980s and 2014: Heilprin, Tracy, Farquhar, Melville, Bowdoin and Diebitsch Glaciers) and for gradually retreating glaciers (the other 13 glaciers). The mean rate for the gradually retreating glaciers was within ±8 m a−1 from the 1980s to 1997. This relatively stable phase was followed by a notable acceleration in retreat from −7 m a−1 to −41 m a−1 between 1997 and 2000. After this change, the rate has been more negative than −17 m a−1 with the only exception occurring in 2008. This result suggests that an important change occurred in the late 1990s. Summer (June–August) mean temperature at Pituffik had fluctuated within a range between 2.0 °C and 6.0 °C from 1985 to 1995 (Fig. 6). From then on, the summer mean temperature rose from 1.4 °C to 5.5 °C between 1996 and 2000, which corresponds to an increase in annual PDD from 174 °C a−1 to 545 °C a−1. This warming trend is also recognized as an increase from 3.3 °C to 4.4 °C in the 5-year mean summer temperature (Fig. 6). This pronounced warming was consistent with a significant increase in glacier runoff of ~250% from 1996 to 1998, reported in northwestern Greenland (Fettweis, Reference Fettweis2007). After this warming, the summer mean temperature did not drop below 3.3 °C until 2014 (Fig. 6). Temperature change was observed in other seasons as well. Five-year mean spring (May–March) temperature increased by 1.6 °C from 1990–94 to 1995–99, and a 5-year mean autumn (September–November) temperature increased by 3.2 °C from 1990–94 to 2000–05 (Fig. 6). These warming trends imply earlier clearing and later formation of sea ice, which might have caused glacier retreat driven by reduction in the buttressing effect on the terminus (Howat and others, Reference Howat, Box, Ahn, Herrington and McFadden2010).
Mean rates of frontal displacement for glaciers that retreated by more than 1 km between the 1980s and 2014 (Heilprin, Tracy, Farquhar, Melville, Bowdoin and Diebitsch Glaciers) (red) and for the rest of the studied glaciers (blue). Standard deviations are given by the shades. Seasonal mean temperature (DFJ: December–February (red), MAM: March–May (green), JJA: June–August (light blue) and SON: September–November (purple)) and annual PDD (black) between 1985 and 2014 at Pituffik. Dot lines indicate 5-year mean seasonal temperatures. Summer mean SST (June–August) measured by AVHRR in the area of 77–78°N and 66–72°W from 1985 to 2009 (red) and by MODIS from 2001 to 2014 (blue). Standard deviations are given by the shades. The gray hatch indicates the period of temperature increase between the summers in 1996 and 2000.

In addition to the atmospheric warming, ocean temperature potentially played a role in the recent glacier retreat. Ocean warming affects submarine melting at the calving front, and the importance of this process to the variations of calving glaciers in Greenland has been emphasized in recent studies (Murray and others, Reference Murray2010; Rignot and others, Reference Rignot, Koppes and Velicogna2010; Motyka and others, Reference Motyka2011). Increase in ocean temperature was observed on the continental shelf in central-west Greenland in the late 1990s (Holland and others, Reference Holland2008). Reanalysis data suggested ocean warming in northwestern Greenland during approximately the same period (Carr and others, Reference Carr, Vieli and Stokes2013b). A warming trend was also observed in summer mean SST in the study region (Fig. 6). Summer mean SST in area 77–78°N and 66–72°W from AVHRR data increased from 0.3 °C to 2.5 °C between 1996 and 1999. After this increase, the summer mean SST was kept above 1.7 °C until 2009. MODIS data suggest that the relatively warm summer mean SST continued until 2012 (Fig. 6). A possible implication of the SST data is that the glacier retreat since 2000 was initiated by an increase in submarine melting after the ocean warming between 1996 and 1999. Nevertheless, care should be taken with this interpretation because glacier melting is driven by the heat carried by deep water in the fjord, which may not be represented by SST sampled at a distance from the glacier. It is likely that the SST trend was affected by the magnitude of runoff from glaciers as well as atmospheric temperature (Murray and others, Reference Murray2010). Therefore, it is difficult to draw a conclusion from available data on the influence of ocean warming on the observed retreat trend.
Based on these data, we hypothesize that the rise in air temperatures in the late 1990s triggered the retreat of the glaciers. Presumably, calving was enhanced by ice thinning near the front due to increased surface melting and/or crevasse deepening due to the hydrofracturing process, which led to the generally retreating trend of the glaciers after 2000. The influence of ocean warming cannot be excluded, but further study is needed to assess the role of ocean forcing in the observed glacier variations.
5.2. Role of ice dynamics in rapid glacier retreat
The general trend of the retreat can be explained by the atmospheric warming as described above. However, rapid retreat of several glaciers cannot be attributed to warming alone. For example, retreat rates at Heilprin, Tracy, Farquhar, Melville, Bowdoin and Diebitsch Glaciers (47–200 m a−1 for the 1980s–2014) were greater than the mean and median rates of all the studied glaciers (44 and 30 m a−1) (Table 2). Year-to-year variations in the frontal change are much more pronounced in the six rapidly retreating glaciers (Fig. 6). These glaciers are distributed randomly over the study region (Fig. 1), suggesting the importance of conditions associated with each glacier, rather than the regional atmospheric environment.
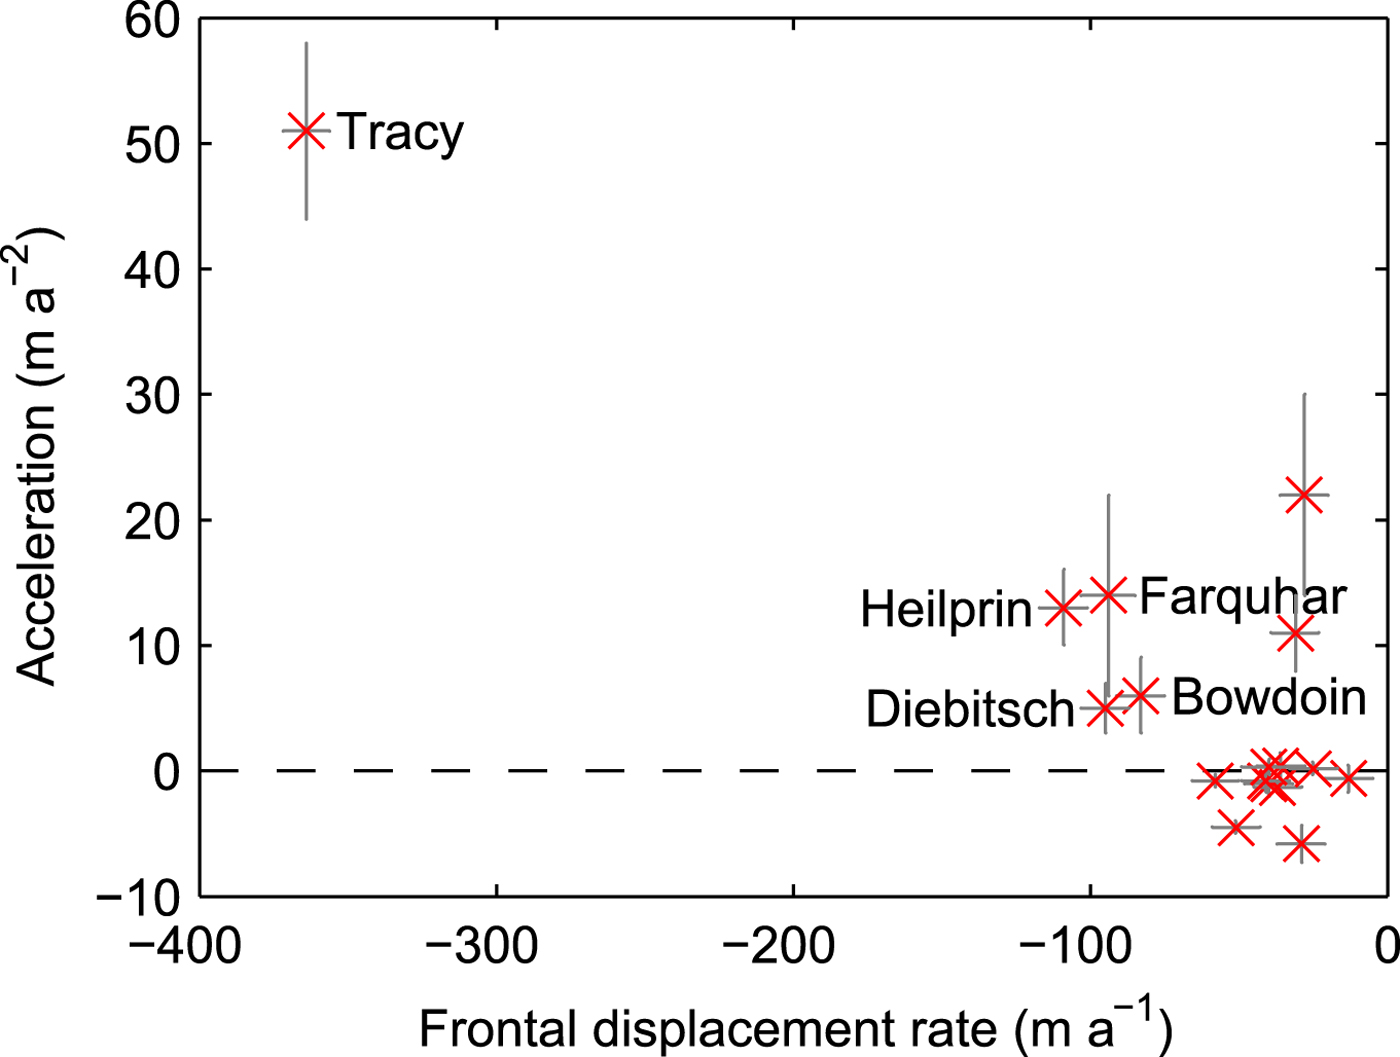
Figure 7 shows a relationship between the changes in ice speed and frontal displacement rate observed at the studied glaciers over the period between 2000 and 2014. Among the six rapidly retreating glaciers, Heilprin, Tracy, Farquhar, Bowdoin and Diebitsch Glaciers accelerated significantly, suggesting ice dynamics as the driver of the rapid retreat. The most likely interpretation of the relationship between the retreat and acceleration is dynamic thinning (e.g. Thomas and others, Reference Thomas2003). Because the magnitude of the acceleration was greater near the ice front (Fig. 5), the speedup enhanced the along-flow stretching rate of the rapidly retreating glaciers. An increase in the tensile strain along the glacier results in vertical compression, i.e. thinning of the glacier due to ice dynamics. This effect was confirmed at Bowdoin Glacier by comparing its thinning rate with that of the nearby land-terminating Tugto Glacier (Tsutaki and others, Reference Tsutaki, Sugiyama, Sakakibara and Sawagaki2016). The thinning of Bowdoin Glacier from 2007 to 2010 (4.1 ± 0.3 m a−1) was ~50% more rapid than that of Tugto Glacier during the same period. Moreover, negative surface mass balance measured on the glacier accounted for only <40% of the glacier thinning. The rest of the thinning was attributed to the vertical straining, which was enhanced by recent flow acceleration. Another example is a comparison between Tracy and Heilprin Glaciers. Between 2003 and 2008, Tracy Glacier thinned at a rate of −7.29 m a−1, whereas the thinning rate of nearby Heilprin Glacier was − 0.77 m a−1 (Pritchard and others, Reference Pritchard, Arthern, Vaughan and Edwards2009). Pritchard and others (Reference Pritchard, Arthern, Vaughan and Edwards2009) attributed this contrasting behavior of the two largest glaciers in this region to enhanced dynamic thinning at Tracy Glacier. During this period, acceleration at Tracy Glacier (51 m a−2) was more than five times greater than that at Heilprin (13 m a−2) (Table 3). This clearly showed the dominant role of ice dynamics in the rapid retreat of Tracy Glacier.
Flow acceleration vs frontal displacement rate at the studied glaciers from 2000 to 2014. The acceleration was measured along the glacier centerline within 5 km from the 2014 front. Gray crosses associated with the markers indicate the standard deviation.
A likely mechanism connecting flow acceleration and rapid retreat is flotation of ice near the terminus as a result of dynamic thinning. According to the glacier surface and bed elevations measured in 2014 (CReSIS, 2016), sea level in front of Heilprin, Tracy and Farquhar Glaciers was nearly equal to the flotation level (i.e., the ice was in hydrostatic equilibrium) (Figs 5a–c). Field measurements near the front of Bowdoin Glacier confirmed the ice was close to the hydrostatic equilibrium condition in 2013 as well (Sugiyama and others, Reference Sugiyama, Sakakibara, Tsutaki, Maruyama and Sawagaki2015). These observations imply that the glaciers began rapid retreat when the ice went afloat after dynamic thinning. This hypothesis is consistent with the previously proposed calving criterion, which states that frontal position is controlled by the ice thickness above flotation and thus ice thinning triggers rapid frontal retreat (van der Veen, Reference van der Veen1996).
5.3. Mechanism of flow acceleration
The foregoing discussion demonstrates that flow acceleration after the initial retreat was the driver of the observed rapid glacier retreat. In this section, we examine two previously proposed mechanisms as the driver of the flow acceleration observed in this study. The first mechanism is a change in the force balance near the terminus (e.g. Joughin and others, Reference Joughin, Abdalati and Fahnestock2004; Howat and others, Reference Howat, Joughin, Tulaczyk and Gogineni2005, Reference Howat, Joughin and Scambos2007). Figure 8 compares the timing of frontal retreat with the flow acceleration of selected glaciers. Tracy Glacier accelerated twice in 1999–2005 (from 770 to 1230 m a−1 at 2.0 km from the most retreated front) and in 2010–14 (from 1250 to 1740 m a−1) (Fig. 8b). The onset of the first speedup coincided with the disintegration of the glacier tongue shared with Farquhar Glacier, which occurred in the summer of 2001. This disintegration affected ice speed of Farquhar Glacier as well. Ice speed at 1.4 km from the front of Farquhar Glacier increased after the disintegration in 2000 (410–600 m a−1 in 2000–02) (Fig. 8c). The geometry of the termini substantially changed after the disintegration, with the ice tongue shared by the two glaciers disappearing and splitting into two ice fronts. Presumably, this change in the geometry altered the force balance near the terminus of the two glaciers.
(a) Cumulative frontal displacement (red) and annual ice speed of Heilprin, (b) Tracy, (c) Farquhar, (d) Bowdoin and (e) Diebitsch Glaciers. The speed was measured near the front (distance approximately equal to a half glacier width) along the glacier centerline.

The above interpretation assumes the frontal retreat as the triggering mechanism of the flow acceleration. Our data from some of the other glaciers provide a support to this cause-and-effect relationship between the retreat and speedup. Bowdoin Glacier showed only a small flow speed change from 1988 to 1999 ( − 10 m a−1). Then ice speed increased more than threefold in 1999–2006 from 130 to 370 m a−1 at 1.8 km from the front (Fig. 8d). The ice front of Bowdoin Glacier stayed at nearly the same position over a period between the 1980s and late 1990s, and retreated by a short distance from 1999 to 2001 at the onset of the large acceleration. Interestingly, the glacier showed more rapid retreat after 2008, but the response of the ice speed to the retreat in 2008 was insignificant. Our interpretation is that the small change in the front position caused significant back-stress reduction and triggered the abrupt flow acceleration that began in 2000. An ocean bed bump near the front of Bowdoin Glacier played a role in such a sensitive response of the ice dynamics to the small retreat (Sugiyama and others, Reference Sugiyama, Sakakibara, Tsutaki, Maruyama and Sawagaki2015). After 2000, the glacier progressively thinned under the fast-flowing condition as described in Section 5.2, which resulted in the rapid retreat initiated in 2008. These observations in Bowdoin Glacier are more difficult to explain if the speedup is taken as the cause of the initial small retreat in 1999–2001. Similar ice speed and frontal variations were obtained in Diebitsch Glacier. The flow speed of the glacier increased in 2000–03 from 100 to 200 m a−1 at 1.4 km from the front (Fig. 8e). The onset of the rapid acceleration coincided with the initiation of the relatively small 0.3 km retreat in 1999–2002 (Fig. 8e). The glacier further retreated after 2007, but the response of the ice speed to the retreat is smaller than that in 2000. These data suggest the change in the force balance associated with the frontal retreat as a possible trigger of the flow acceleration that began in ~2000.
The second proposed mechanism of flow acceleration is basal ice motion enhanced by increased meltwater input to the glacier bed. When surface melt increases and greater amounts of meltwater reach the bed, the glacier accelerates because of enhanced basal ice motion (e.g. Meier and Post, Reference Meier and Post1987; Andersen and others, Reference Andersen2010; Sole and others, Reference Sole2011). The rapidly retreating glaciers in Prudhoe Land accelerated in the early 2000s (Fig. 8). The summer air temperature significantly increased in 1996–2000 and this warm condition lasted until 2014 (Fig. 6). The change in PDD from 1996 to 2000 (174 to 545 °C a−1) suggests a melt increase of 213% (Fig. 6), which is consistent with a previously reported runoff increase of ~250% in northwestern Greenland during the same period (Fettweis, Reference Fettweis2007). Therefore, a larger amount of meltwater was likely produced in the summers between 2000 and 2014 and possibly enhanced basal ice motion. Flow acceleration of Heilprin, Tracy and Bowdoin Glaciers (Fig. 8) began in 2000, several years after the onset of the warming. Thus, the air temperature increase is probably not a trigger of the flow acceleration. Nevertheless, the relatively warm atmospheric condition lasting since 2000 might have contributed to sustaining the recent fast-flowing conditions by enhancing basal sliding.
Our data also suggest that glacier bed topography is important for understanding the spatial extent of flow acceleration. The speed change of Tracy Glacier was observed over a region extending ~23 km from the glacier front, where a ~200 m high bedrock bump is located (Fig. 5b). In contrast to the acceleration over a relatively large region in Tracy Glacier, the speed change of Heilprin Glacier propagated only up to ~9 km from the glacier front. There is a bedrock bump at this location, and surface slope changes there (Fig. 5a). A similar relation between bed geometry and ice speed variation was observed also at Farquhar Glacier (Fig. 5c). There is a bedrock bump at 5 km from the glacier front and the speed change was observed downstream of the bedrock bump (Fig. 5c). These observations suggest that bed topography controls the spatial extent of changes in glacier dynamics. Recent observations in the Canadian High Arctic also showed that the areal extent of glacier speedup and slowdown of tidewater glaciers is controlled by glacier bed elevation (Van Wychen and others, Reference Van Wychen2016). They found that speed change occurred where glacier bed elevation was below sea level and downstream of bedrock bumps. This finding is similar to our observations. A recent study in West Greenland also indicated that glacier bed geometry plays a role for the upstream propagation of dynamic thinning as well as the acceleration (Felikson and others, Reference Felikson2017). Thus, it is crucial to map the bed elevation to project future evolution of the glaciers.
6. CONCLUSIONS
Ice front positions and velocities of 19 marine-terminating outlet glaciers along the coast of Prudhoe Land, northwestern Greenland, were measured using Landsat images acquired from 1987 to 2014. All the 19 studied glaciers retreated at a rate ranging from 12 to 200 m a−1 between the 1980s and 2014, having median and mean retreat rates of 30 and 44 m a−1, respectively. Heilprin, Tracy, Farquhar, Melville, Bowdoin and Diebitsch Glaciers retreated by more than 1 km in the same period. Most of the glaciers began to retreat at around the year 2000, as indicated by the change in the median (mean) retreat rates from 3 (6) m a−1 in the 1980s–99 to 40 (65) in 2000–14. Ice speed near the front of the studied glaciers ranged between 10 and 1740 m a−1. Many of the glaciers accelerated in the early 2000s. Heilprin, Tracy, Farquhar, Bowdoin and Diebitsch Glaciers showed greater acceleration than the other glaciers at a rate of 5–51 m a−2 between 2000 and 2014, which was accompanied by rapid retreat of the glaciers. In general, more rapid retreat was observed at glaciers experiencing large acceleration.
A possible trigger of the glacier retreat initiated in ~2000 is atmospheric warming, as represented by the increase in the air temperatures in the late 1990s and the subsequent warm period. The magnitude of the acceleration correlates with the retreat rate as observed at Heilprin, Tracy, Farquhar, Bowdoin and Diebitsch Glaciers. Flow acceleration of these glaciers was greater near the front, thus it enhanced stretching flow regimes along the glaciers and induced dynamic thinning. The termini of Heilprin, Tracy, Farquhar and Bowdoin Glaciers were close to the hydrostatic equilibrium condition during the retreat, suggesting that thinning of the glaciers resulted in ice flotation and rapid retreat. We hypothesize that the general retreat trend in Prudhoe Land after 2000 was triggered by atmospheric warming, with five glaciers retreating more rapidly than the others under the influence of dynamic thinning induced by flow acceleration. Because it affects the spatial extent of flow acceleration as well as the glacier front stability, ocean and glacier bed geometry is an important controlling factor of future change in outlet glaciers in Greenland.
ACKNOWLEDGEMENTS
Landsat images were downloaded from the US Geological Survey Earth Explorer http://earthexplorer.usgs.gov/. The dataset of air temperature was downloaded from the National Oceanic and Atmospheric Administration's National Centers for Environmental Information https://www.ncdc.noaa.gov/. Glacier outlines were downloaded from the Greenland Mapping Project Ice Cover Mask https://bpcrc.osu.edu/gdg/data/icemask. We thank Rachel Carr for valuable comments on the manuscript. English was corrected by Susan Braun-Clarke. The manuscript was improved by comments from three anonymous reviewers. We thank Helen Amanda Fricker for handling the paper as the scientific editor. This study was funded by MEXT Japan (Japanese Ministry of Education, Culture, Sports, Science and Technology) through the Green Network of Excellence (GRENE) Arctic Climate Change Research Project, Arctic Challenge for Sustainability (ArCS) project and JSPS KAKENHI Grant Number JP16H02224. D.S. was partially supported by Grant-in-Aid for JSPS Research Fellow (JP14J02632).


 Open access