


1. Introduction
In recent years, matrix distributions such as phase-type (PH), inhomogeneous phase-type (IPH), discrete phase-type (DPH), and related multivariate distributions have gained prominence in various fields due to their ability to seamlessly model complex or heterogeneous data. Matrix distributions can be employed to capture diverse behaviors and dependencies in real-world scenarios, making them particularly useful in areas such as survival analysis, actuarial science, queuing theory, and finance.
PH distributions (cf. Bladt & Nielsen, Reference Bladt and Nielsen2017) are a natural extension of the exponential distribution and are defined as the time to reach an absorbing state in an otherwise transient time-homogeneous pure-jump Markov process. These distributions possess closed-form formulas in terms of matrices for various functionals, such as density, cumulative distribution function, Laplace transform, moments, and can approximate any other distribution on the positive real line. Although their support is restricted to the positive real line, they can also be used to model real-valued data through suitable transformations. For example, Albrecher et al. (Reference Albrecher, Bladt and Yslas2022b) employ PH distributions to model the absolute log-returns of financial assets. Since only the time to absorption is observed and not the actual stochastic process trajectory, models based on PH distributions are hidden Markov models. Hence, they are typically estimated using the expectation-maximization (EM) algorithm (cf. Asmussen et al., Reference Asmussen, Nerman and Olsson1996). However, their tail behavior remains exponential, which can be a limiting factor in certain applications that require a more accurate tail description. This shortcoming has led to the exploration of classes extending PH distributions, offering different tail behaviors while retaining PH-like properties. One such class is comprised of IPH distributions (Albrecher & Bladt, Reference Albrecher and Bladt2019), which can be defined equivalently as the law of a transformed PH-distributed random variable or the absorption time of a time-inhomogeneous pure-jump Markov process. The tail behavior of the resulting IPH distribution can be as heavy or light as desired, depending on the chosen transformation. Moreover, for parametric transformations, the estimation procedure has been outlined in Albrecher et al. (Reference Albrecher, Bladt and Müller2022c). Several extensions to the multivariate setting of PH distributions have been introduced in the literature. The most general construction can be found in Kulkarni (Reference Kulkarni1989), called the MPH* class, whose definition consists of considering marginals that depend on a unique Markov jump process but with different rewards at each state. However, explicit expressions for the joint density and distribution function are not available for this class. A more tractable subclass, named the mPH class (see Bladt, Reference Bladt2023), offers greater analytical convenience; we also highlight the work of Cheung et al. (Reference Cheung, Peralta and Woo2022), which provides closed-form expressions for common risk measures, including value-at-risk (VaR) and tail value-at-risk (TVaR), within the framework of multivariate matrix-exponential affine mixtures, a class that encompasses both the mPH distributions and, in particular, the univariate PH distributions. Finally, with respect to multivariate extensions of the IPH class, Albrecher et al. (Reference Albrecher, Bladt and Müller2022c), Bladt (Reference Bladt2023) presented some alternatives that allow estimation.
For modeling count data, the DPH class (cf. Bladt & Nielsen, Reference Bladt and Nielsen2017) provides a tractable and flexible set of distributions, which also allows for estimation via an EM algorithm. Formally, DPH distributions are defined as the time to reach absorption in a discrete Markov chain (MC) with one absorbing state and the remaining states being transient. However, they can also be viewed as an extension of the geometric distribution. The more general class of multivariate DPH distributions was introduced in Campillo-Navarro (Reference Campillo-Navarro2018), employing a similar construction principle as the MPH* class via rewards. More recently, Bladt & Yslas (Reference Bladt and Yslas2023c) presented other more tractable classes of DPH distributions that offer similar versatility in modeling count data.
Matrix distributions have proven to be useful in various applications, motivating the development of regression models tailored to these distributions. Two notable regression models for matrix distributions include the proportional intensities (PI) model and the mixture-of-experts (MoE) specification. The PI model, as proposed by Albrecher et al. (Reference Albrecher, Bladt, Bladt and Yslas2022a), extends the classical Cox proportional hazards model to the IPH setting. This model enables the incorporation of covariate information directly into the intensity matrix of the underlying Markov process. On the other hand, the MoE specification, originally introduced in Bladt & Yslas (Reference Bladt and Yslas2023b), incorporates the covariate information in the vector of initial probabilities and can easily be modified to the multivariate case (cf. Albrecher et al., Reference Albrecher, Bladt and Müller2023b).
This paper presents the matrixdist package (Bladt & Yslas, Reference Bladt and Yslas2023a), designed to work with matrix distributions and implemented in R (R Core Team, 2024). The matrixdist package leverages the S4 class system in R to ensure a well-structured and organized implementation of the various distribution classes and their associated methods. By utilizing S4 classes, the package offers a user-friendly interface for interacting with PH, IPH, DPH, and related multivariate and regression distributions. Users can create distribution objects with their respective parameters, and the package will automatically manage the underlying data structures and computations. This design promotes code reusability, maintainability, and extensibility, making it easier to add new distribution classes and methods in the future while ensuring a consistent and coherent user experience. The object-oriented design can be particularly efficient when dealing with large numbers of parameters during statistical estimation. Furthermore, most computationally intensive functions are implemented using the C++ language to enhance performance. These functions are then made accessible in the R language via the Rcpp package, ensuring both speed and ease-of-use for the matrixdist package. The matrixdist package is now available in CRAN (https://cran.r-project.org/package=matrixdist) and can be installed through install.packages(”matrixdist”). The source code is available in the GitHub repository https://github.com/martinbladt/matrixdist_1.0, where bug reports can also be submitted.
It is worth mentioning that the R package matrixdist offers a preferable solution compared to existing packages for working with matrix distributions. To provide context, we briefly summarize some alternative software tools for matrix distributions:
-
• The R package actuar (Dutang et al., Reference Dutang, Goulet and Pigeon2008) contains implementations for the density, cumulative distribution, moments, and moment-generating function of univariate PH distributions.
-
• The R package mapfit (Okamura & Dohi, Reference Okamura and Dohi2015) offers some estimation methods for PH distributions and for Markovian Arrival Processes (MAP). The latter can loosely be seen as dependent concatenations of PH variables (arrivals).
-
• The recent PhaseTypeR package (Rivas-González et al., Reference Rivas-González, Andersen and Hobolth2023) includes implementations for reward transformations and functionals for some of the multivariate extensions of homogeneous PH and DPH distributions. However, no statistical estimation is considered.
The matrixdist package stands out by providing a comprehensive and efficient suite of tools that cover univariate, multivariate, continuous, discrete, and regression matrix models, and their statistical estimation. Right-censoring is also supported. The package’s versatility, completeness, and high-speed performance make it an ideal choice for researchers and practitioners across all matrix distribution domains.
The remainder of the paper is organized as follows. Section 2 provides the mathematical formulation of univariate DPH, PH, and IPH distributions, their basic properties, and regression extensions. Similar information for multivariate matrix distribution is given in Section 3, where the multivariate extensions of the IPH and DPH classes are introduced. A discussion on estimation methods for the introduced models via EM algorithms is provided in Section 4, and detailed illustrations on the use of the package are provided in Section 5. Finally, Section 6 gives a condensed summary of the methods available in matrixdist and shows how further information can be accessed within the package’s documentation.
2. Univariate matrix distributions
2.1 Discrete phase-type distributions
Let $(Z_n)_{n\in \mathbb{N}_0}$
be a discrete MC on a finite state space
$(Z_n)_{n\in \mathbb{N}_0}$
be a discrete MC on a finite state space $\{1, \ldots , p, p+1\}$
where the first
$\{1, \ldots , p, p+1\}$
where the first $p$
states are transient, and state
$p$
states are transient, and state $p+1$
is absorbing. Then, the MC has transition matrix
$p+1$
is absorbing. Then, the MC has transition matrix $\mathbf{P}$
given by:
$\mathbf{P}$
given by:
 \begin{equation*} \mathbf{P}= \left( \begin{array}{c@{\quad}c} \mathbf{S} & \mathbf{s} \\ \boldsymbol{0} & 1 \end{array} \right)\!, \end{equation*}
where $\mathbf{S}$
is a
$\mathbf{S}$
is a $p\times p$
matrix, known as sub-transition matrix, and
$p\times p$
matrix, known as sub-transition matrix, and $\mathbf{s}$
is a column vector of dimension
$\mathbf{s}$
is a column vector of dimension $p$
. Considering that the rows of
$p$
. Considering that the rows of $\mathbf{P}$
sum to
$\mathbf{P}$
sum to $1$
, the following relation holds
$1$
, the following relation holds $\mathbf{s}=\mathbf{e}-\mathbf{S}\mathbf{e}$
, with
$\mathbf{s}=\mathbf{e}-\mathbf{S}\mathbf{e}$
, with $\mathbf{e} = (1, \ldots , 1)^{\top }$
the
$\mathbf{e} = (1, \ldots , 1)^{\top }$
the $p$
-dimensional column vector of ones. Furthermore, we assume that
$p$
-dimensional column vector of ones. Furthermore, we assume that $(Z_n)_{n\in \mathbb{N}_0}$
may start in any transient state with a certain probability
$(Z_n)_{n\in \mathbb{N}_0}$
may start in any transient state with a certain probability $\alpha _k=\mathbb{P}(Z_0=k)$
,
$\alpha _k=\mathbb{P}(Z_0=k)$
, $k = 1, \ldots , p$
, and let
$k = 1, \ldots , p$
, and let $\boldsymbol{\alpha } = (\alpha _1 ,\ldots ,\alpha _p )$
. Then, the time until absorption
$\boldsymbol{\alpha } = (\alpha _1 ,\ldots ,\alpha _p )$
. Then, the time until absorption $N=\inf \{n \ge 1 \mid Z_n=p+1 \}$
is said to be DPH- distributed with representation
$N=\inf \{n \ge 1 \mid Z_n=p+1 \}$
is said to be DPH- distributed with representation $(\boldsymbol{\alpha },\mathbf{S})$
, and we write
$(\boldsymbol{\alpha },\mathbf{S})$
, and we write $N \sim \mbox{DPH}(\boldsymbol{\alpha },\mathbf{S})$
or
$N \sim \mbox{DPH}(\boldsymbol{\alpha },\mathbf{S})$
or $N \sim \mbox{DPH}_{p}(\boldsymbol{\alpha },\mathbf{S})$
. Such a random variable has probability mass function
$N \sim \mbox{DPH}_{p}(\boldsymbol{\alpha },\mathbf{S})$
. Such a random variable has probability mass function $q$
and distribution function
$q$
and distribution function $Q$
given by
$Q$
given by
 \begin{equation*} q(n) = \boldsymbol{\alpha }\mathbf{S}^{n-1}\mathbf{s} \,, \quad n\ge 1 \,,\\[-12pt] \end{equation*}
 \begin{equation*} Q(n) = 1-\boldsymbol{\alpha }\mathbf{S}^{n}\mathbf{e} \,, \quad n\ge 1 \,. \end{equation*}
The absorption time $N$
has
$N$
has $\kappa$
-factorial moments,
$\kappa$
-factorial moments, $\kappa \in \mathbb{N}$
, given by
$\kappa \in \mathbb{N}$
, given by
 \begin{equation*} \mathbb{E}(N(N - 1)\cdots (N - \kappa + 1))=\kappa ! \boldsymbol{\alpha }\mathbf{S}^{\kappa - 1}\left (\mathbf{I}-\mathbf{S}\right )^{-\kappa }\mathbf{e} \,. \end{equation*}
In particular, we have that $\mathbb{E}(N)=\boldsymbol{\alpha }\left (\mathbf{I}-\mathbf{S}\right )^{-1}\mathbf{e}$
. Furthermore, its probability-generating function
$\mathbb{E}(N)=\boldsymbol{\alpha }\left (\mathbf{I}-\mathbf{S}\right )^{-1}\mathbf{e}$
. Furthermore, its probability-generating function $P_N$
is given by
$P_N$
is given by
 \begin{equation*} P_N(t) = \mathbb{E}(t^N)= \boldsymbol{\alpha } \left ( t^{-1}\mathbf{I} - \mathbf{S} \right )\mathbf{s} \,, \quad |t| \leq 1 \, , \end{equation*}
where $\mathbf{I}$
is the identity matrix of appropriate dimension.
$\mathbf{I}$
is the identity matrix of appropriate dimension.
Let $N_1 \sim \mbox{DPH}_{p_1}(\boldsymbol{\alpha }_1,\mathbf{S}_1)$
and
$N_1 \sim \mbox{DPH}_{p_1}(\boldsymbol{\alpha }_1,\mathbf{S}_1)$
and $N_2 \sim \mbox{DPH}_{p_2}(\boldsymbol{\alpha }_2,\mathbf{S}_2)$
be two independent DPH-distributed random variables. Then,
$N_2 \sim \mbox{DPH}_{p_2}(\boldsymbol{\alpha }_2,\mathbf{S}_2)$
be two independent DPH-distributed random variables. Then,
 \begin{equation*} N_1 + N_2 \sim \mbox{DPH}_{p_1 + p_2} \left ( \left ( \boldsymbol{\alpha }_1, \boldsymbol{0}\right ), \left (\begin{array}{c@{\quad}c} \mathbf{S}_1 & \mathbf{s}_1 \boldsymbol{\alpha }_2 \\ \boldsymbol{0} & \mathbf{S}_2 \end{array} \right ) \right)\!, \end{equation*}
 \begin{equation*} \min \left (N_1, N_2 \right ) \sim \mbox{DPH}_{p_1 p_2}\left ( \boldsymbol{\alpha }_1 \otimes \boldsymbol{\alpha }_2, \mathbf{S}_1 \otimes \mathbf{S}_2 \right)\!, \end{equation*}
and
 \begin{equation*} \max \left (N_1, N_2 \right ) \sim \mbox{DPH}_{p_1 p_2 + p_1 + p_2}\left ( \left ( \boldsymbol{\alpha }_1 \otimes \boldsymbol{\alpha }_2, \boldsymbol{0}, \boldsymbol{0}\right ), \left (\begin{array}{c@{\quad}c@{\quad}c} \mathbf{S}_1 \otimes \mathbf{S}_2 & \mathbf{S}_1 \otimes \mathbf{s}_2 & \mathbf{s}_1 \otimes \mathbf{S}_2 \\ \boldsymbol{0} & \mathbf{S}_1 & \boldsymbol{0} \\ \boldsymbol{0} & \boldsymbol{0} & \mathbf{S}_2 \end{array} \right)\right), \end{equation*}
where $\otimes$
and
$\otimes$
and $\oplus$
denote the Kronecker product and sum, respectively. It should be noted that the above parametric representation of
$\oplus$
denote the Kronecker product and sum, respectively. It should be noted that the above parametric representation of $N_1 + N_2$
is obtained using a sequential addition interpretation, where
$N_1 + N_2$
is obtained using a sequential addition interpretation, where $N_1$
is assumed to be absorbed prior to the initiation of
$N_1$
is assumed to be absorbed prior to the initiation of $N_2$
.
$N_2$
.
Furthermore, if $U \sim Bernoulli(\nu )$
,
$U \sim Bernoulli(\nu )$
, $\nu \in [0, 1]$
, then
$\nu \in [0, 1]$
, then
 \begin{equation*} U N_1 + (1 - U) N_2 \sim \mbox{DPH}_{p_1 + p_2}\left ( \left ( \nu \boldsymbol{\alpha }_1 \,, (1 - \nu ) \boldsymbol{\alpha }_2 \right ), \left ( \begin{array}{c@{\quad}c} \mathbf{S}_1 & \boldsymbol{0} \\ \boldsymbol{0} & \mathbf{S}_2 \end{array} \right)\right)\!. \end{equation*}
Thus, the DPH class is closed under addition, minima, maxima, and finite mixtures. We refer to Bladt & Nielsen (Reference Bladt and Nielsen2017) for a detailed description of DPH distributions.
Regression
Recently, a regression model for frequency modeling based on DPH distributions was introduced in Bladt & Yslas (Reference Bladt and Yslas2023c) as a generalization of MoE models. The main idea is to incorporate the covariate information on the vector of initial probabilities, which play the role of expert weights. The resulting distributional model is flexible, as it possesses the property of denseness on more general regression models satisfying some mild technical conditions. Next, we present the fundamental concepts of this regression model. Define the mapping
 \begin{equation*} \boldsymbol{\alpha}\,:\,D \subset \mathbb{R}^h \rightarrow \Delta ^{p-1}, \end{equation*}
where $\Delta ^{p-1}=\{(\alpha _1,\ldots ,\alpha _p)\in \mathbb{R}^p\mid \sum _k \alpha _k=1,\; \alpha _k\ge 0 \; \forall k \}$
is the standard
$\Delta ^{p-1}=\{(\alpha _1,\ldots ,\alpha _p)\in \mathbb{R}^p\mid \sum _k \alpha _k=1,\; \alpha _k\ge 0 \; \forall k \}$
is the standard $(p-1)$
simplex. Then, for any given vector of covariate information
$(p-1)$
simplex. Then, for any given vector of covariate information $\mathbf{X} = (X_1, \ldots , X_h) \in \mathbb{R}^h$
, the initial probabilities of the underlying MC of a DPH distribution are taken to be
$\mathbf{X} = (X_1, \ldots , X_h) \in \mathbb{R}^h$
, the initial probabilities of the underlying MC of a DPH distribution are taken to be $\mathbb{P}(Z_0=k)=\alpha _k(\mathbf{x})\,:=(\boldsymbol{\alpha }(\mathbf{x}))_k$
,
$\mathbb{P}(Z_0=k)=\alpha _k(\mathbf{x})\,:=(\boldsymbol{\alpha }(\mathbf{x}))_k$
, $k=1,\ldots ,p$
. Thus, we say that
$k=1,\ldots ,p$
. Thus, we say that $N\mid \mathbf{X}\sim \mbox{DPH}(\boldsymbol{\alpha }(\mathbf{X}),\mathbf{S})$
follows the DPH-MoE specification. For
$N\mid \mathbf{X}\sim \mbox{DPH}(\boldsymbol{\alpha }(\mathbf{X}),\mathbf{S})$
follows the DPH-MoE specification. For $D=\mathbb{R}^h$
, we have a convenient parametrization of initial probabilities, namely the softmax parametrization given by
$D=\mathbb{R}^h$
, we have a convenient parametrization of initial probabilities, namely the softmax parametrization given by
 \begin{equation*} \alpha _k(\mathbf{X}\,;\,\boldsymbol{\gamma })=\frac {\exp \left (\mathbf{X}\boldsymbol{\gamma }_k\right )}{\sum _{j=1}^{p}\exp \left (\mathbf{X}\boldsymbol{\gamma }_j\right )} \quad k=1,\ldots ,p, \end{equation*}
where $\boldsymbol{\gamma }_k\in \bar {\mathbb{R}}^h$
and
$\boldsymbol{\gamma }_k\in \bar {\mathbb{R}}^h$
and $\boldsymbol{\gamma }=(\boldsymbol{\gamma }_1^{\top },\ldots ,\boldsymbol{\gamma }_p^{\top })^{\top }\in \bar {\mathbb{R}}^{p\times h}$
. More details about this model as well as precise denseness considerations can be found in Bladt & Yslas (Reference Bladt and Yslas2023c). We also refer to Bladt & Yslas (Reference Bladt and Yslas2023b) for an extension of this regression model to continuous PH distributions.
$\boldsymbol{\gamma }=(\boldsymbol{\gamma }_1^{\top },\ldots ,\boldsymbol{\gamma }_p^{\top })^{\top }\in \bar {\mathbb{R}}^{p\times h}$
. More details about this model as well as precise denseness considerations can be found in Bladt & Yslas (Reference Bladt and Yslas2023c). We also refer to Bladt & Yslas (Reference Bladt and Yslas2023b) for an extension of this regression model to continuous PH distributions.
2.2 Continuous phase-type distributions
Let $( J_t )_{t \geq 0}$
be a time-homogeneous Markov jump process on a finite state space
$( J_t )_{t \geq 0}$
be a time-homogeneous Markov jump process on a finite state space $\{1, \ldots , p, p+1\}$
, where states
$\{1, \ldots , p, p+1\}$
, where states $1,\ldots ,p$
are transient, and state
$1,\ldots ,p$
are transient, and state $p+1$
is absorbing. Then, the intensity matrix
$p+1$
is absorbing. Then, the intensity matrix $\boldsymbol{\Lambda }$
of
$\boldsymbol{\Lambda }$
of $( J_t )_{t \geq 0}$
is of the form
$( J_t )_{t \geq 0}$
is of the form
 \begin{equation*} \boldsymbol{\Lambda }= \left ( \begin{array}{c@{\quad}c} \mathbf{S} & \mathbf{s} \\ \boldsymbol{0} & 0 \end{array}\right)\!, \end{equation*}
where $\mathbf{S}$
is a
$\mathbf{S}$
is a $p \times p$
matrix, called a sub-intensity matrix, and
$p \times p$
matrix, called a sub-intensity matrix, and $\mathbf{s}$
is a
$\mathbf{s}$
is a $p$
-dimensional column vector. Since every row of
$p$
-dimensional column vector. Since every row of $\boldsymbol{\Lambda }$
sums to zero, it follows that
$\boldsymbol{\Lambda }$
sums to zero, it follows that $\mathbf{s}=- \mathbf{S} \, \mathbf{e}$
. Assume that the process starts somewhere in the transient space with probability
$\mathbf{s}=- \mathbf{S} \, \mathbf{e}$
. Assume that the process starts somewhere in the transient space with probability $\alpha _{k} = \mathbb{P}(J_0 = k)$
,
$\alpha _{k} = \mathbb{P}(J_0 = k)$
, $k = 1,\ldots , p$
, and let
$k = 1,\ldots , p$
, and let $\boldsymbol{\alpha } = (\alpha _1 ,\ldots ,\alpha _p )$
. Here, it is assumed that the probability of starting in the absorbing state
$\boldsymbol{\alpha } = (\alpha _1 ,\ldots ,\alpha _p )$
. Here, it is assumed that the probability of starting in the absorbing state $p+1$
is zero, that is,
$p+1$
is zero, that is, $\mathbb{P}(J_0 = p + 1) = 0$
. Then, we say that the time until absorption
$\mathbb{P}(J_0 = p + 1) = 0$
. Then, we say that the time until absorption $Y$
has PH distribution with representation
$Y$
has PH distribution with representation $(\boldsymbol{\alpha },\mathbf{S} )$
, and we write
$(\boldsymbol{\alpha },\mathbf{S} )$
, and we write $Y \sim \mbox{PH}(\boldsymbol{\alpha },\mathbf{S} )$
or
$Y \sim \mbox{PH}(\boldsymbol{\alpha },\mathbf{S} )$
or $Y \sim \mbox{PH}_{p}(\boldsymbol{\alpha },\mathbf{S} )$
. The density
$Y \sim \mbox{PH}_{p}(\boldsymbol{\alpha },\mathbf{S} )$
. The density $f$
and distribution function
$f$
and distribution function $F$
of
$F$
of $Y \sim \mbox{PH}(\boldsymbol{\alpha },\mathbf{S} )$
are given by
$Y \sim \mbox{PH}(\boldsymbol{\alpha },\mathbf{S} )$
are given by
 \begin{equation*} f(y) = \boldsymbol{\alpha } \exp \left (\mathbf{S} y\right ) \mathbf{s} \,, \quad y\gt 0 \,,\\[-12pt] \end{equation*}
 \begin{equation*} F(y) = 1-\boldsymbol{\alpha } \exp \left (\mathbf{S} y\right ) \mathbf{e} \,, \quad y\gt 0 \,, \end{equation*}
where the exponential of a matrix $\mathbf{A}$
is defined by
$\mathbf{A}$
is defined by
 \begin{equation*} \exp \left (\mathbf{A} \right ) = \sum _{n=0}^{\infty } \frac {\mathbf{A}^{n}}{n!} \,. \end{equation*}
The efficient computation of the exponential of a matrix is not a straightforward task in high dimensions, and we refer to Moler & Van Loan (Reference Moler and Van Loan1978) for a survey of different methods. The moments of $Y \sim \mbox{PH}(\boldsymbol{\alpha },\mathbf{S} )$
are given by
$Y \sim \mbox{PH}(\boldsymbol{\alpha },\mathbf{S} )$
are given by
 \begin{equation*} \mathbb{E}\left ( Y^{\theta } \right ) = \Gamma \left ( 1+ \theta \right ) \boldsymbol{\alpha } \left (\!- \mathbf{S} \right )^{-\theta } \mathbf{e}\,, \quad \theta \gt 0 \,, \end{equation*}
with $\Gamma (\cdot )$
being the standard gamma function. Moreover, its Laplace transform
$\Gamma (\cdot )$
being the standard gamma function. Moreover, its Laplace transform $L_Y$
is given by
$L_Y$
is given by
 \begin{equation*} L_Y(u) = \mathbb{E}\left ( \exp (\!-u Y) \right ) = \boldsymbol{\alpha } \left ( u \mathbf{I} - \mathbf{S} \right ) \mathbf{s} \,, \quad u \geq 0 \,. \end{equation*}
Let $Y_1 \sim \mbox{PH}_{p_1}(\boldsymbol{\alpha }_1,\mathbf{S}_1)$
and
$Y_1 \sim \mbox{PH}_{p_1}(\boldsymbol{\alpha }_1,\mathbf{S}_1)$
and $Y_2 \sim \mbox{PH}_{p_2}(\boldsymbol{\alpha }_2,\mathbf{S}_2)$
be independent PH-distributed random variables. Then
$Y_2 \sim \mbox{PH}_{p_2}(\boldsymbol{\alpha }_2,\mathbf{S}_2)$
be independent PH-distributed random variables. Then
 \begin{equation*} Y_1 + Y_2 \sim \mbox{PH}_{p_1 + p_2} \left ( \left ( \boldsymbol{\alpha }_1, \boldsymbol{0}\right ), \left (\begin{array}{c@{\quad}c} \mathbf{S}_1 & \mathbf{s}_1 \boldsymbol{\alpha }_2 \\ \boldsymbol{0} & \mathbf{S}_2 \end{array} \right)\right)\!, \end{equation*}
 \begin{equation*} \min \left (Y_1, Y_2 \right ) \sim \mbox{PH}_{p_1 p_2}\left ( \boldsymbol{\alpha }_1 \otimes \boldsymbol{\alpha }_2, \mathbf{S}_1 \oplus \mathbf{S}_2 \right)\!, \end{equation*}
and
 \begin{equation*} \max \left (Y_1, Y_2 \right ) \sim \mbox{PH}_{p_1 p_2 + p_1 + p_2}\left ( \left ( \boldsymbol{\alpha }_1 \otimes \boldsymbol{\alpha }_2, \boldsymbol{0}, \boldsymbol{0}\right ), \left (\begin{array}{c@{\quad}c@{\quad}c} \mathbf{S}_1 \oplus \mathbf{S}_2 & \mathbf{I} \otimes \mathbf{s}_2 & \mathbf{s}_1 \otimes \mathbf{I} \\ \boldsymbol{0} & \mathbf{S}_1 & \boldsymbol{0} \\ \boldsymbol{0} & \boldsymbol{0} & \mathbf{S}_2 \end{array} \right)\right)\!, \end{equation*}
This means that the PH class is closed under addition, minima, and maxima. In fact, it is also closed under any order statistic (cf. Bladt & Nielsen, Reference Bladt and Nielsen2017) for the exact and more involved expression). Moreover, the class is closed under finite mixtures. Concretely, if $U \sim Bernoulli(\nu )$
,
$U \sim Bernoulli(\nu )$
, $\nu \in [0, 1]$
, then
$\nu \in [0, 1]$
, then
 \begin{equation*} U Y_1 + (1 - U) Y_2 \sim \mbox{PH}_{p_1 + p_2}\left ( \left ( \nu \boldsymbol{\alpha }_1 , (1 - \nu ) \boldsymbol{\alpha }_2 \right ), \left ( \begin{array}{c@{\quad}c} \mathbf{S}_1 & \boldsymbol{0} \\ \boldsymbol{0} & \mathbf{S}_2 \end{array} \right)\right)\!. \end{equation*}
Furthermore, when the mixing probabilities are given by a DPH distribution, the resulting distribution is again PH. More specifically, let $N \sim \mbox{DPH}_{q}(\boldsymbol{\pi },\mathbf{T})$
and
$N \sim \mbox{DPH}_{q}(\boldsymbol{\pi },\mathbf{T})$
and $Y_1, Y_2 \ldots$
be iid, independent of
$Y_1, Y_2 \ldots$
be iid, independent of $N$
, with common element
$N$
, with common element $Y \sim \mbox{PH}_{p}(\boldsymbol{\alpha },\mathbf{S})$
. Then
$Y \sim \mbox{PH}_{p}(\boldsymbol{\alpha },\mathbf{S})$
. Then
 \begin{equation*} \sum _{n = 1}^{N} Y_n \sim \mbox{PH}_{qp}(\boldsymbol{\pi }\otimes \boldsymbol{\alpha },\mathbf{I}\otimes \mathbf{S} + \mathbf{T}\otimes \mathbf{s}\boldsymbol{\alpha }). \end{equation*}
We refer to Bladt & Nielsen (Reference Bladt and Nielsen2017) for a comprehensive reading on PH distributions.
By decomposing the matrix $\mathbf{S}$
into its Jordan normal form, we observe that the right tail of a PH distribution exhibits asymptotically exponential behavior. This limitation motivates the introduction of PH extensions that can accommodate diverse tail behaviors. One such extension is the class of IPH distributions, which is presented in the following section.
$\mathbf{S}$
into its Jordan normal form, we observe that the right tail of a PH distribution exhibits asymptotically exponential behavior. This limitation motivates the introduction of PH extensions that can accommodate diverse tail behaviors. One such extension is the class of IPH distributions, which is presented in the following section.
2.3 Inhomogeneous phase-type distributions
In Albrecher & Bladt (Reference Albrecher and Bladt2019), the class of IPH distribution was introduced by allowing the Markov jump process to be time-inhomogeneous in the construction principle of PH distributions. In this way, $(J_t)_{t \geq 0}$
has an intensity matrix of the form:
$(J_t)_{t \geq 0}$
has an intensity matrix of the form:
 \begin{equation*} \boldsymbol{\Lambda }(t)= \left ( \begin{array}{c@{\quad}c} \mathbf{S}(t) & \mathbf{s}(t) \\ \boldsymbol{0} & 0 \end{array}\right)\!, \end{equation*}
where $\mathbf{s}(t)=- \mathbf{S}(t) \, \mathbf{e}$
. Here, it is assumed that the vector of initial probabilities is
$\mathbf{s}(t)=- \mathbf{S}(t) \, \mathbf{e}$
. Here, it is assumed that the vector of initial probabilities is $\boldsymbol{\alpha } = (\alpha _1 ,\ldots ,\alpha _p )$
. Then, we say that the time until absorption
$\boldsymbol{\alpha } = (\alpha _1 ,\ldots ,\alpha _p )$
. Then, we say that the time until absorption $Y$
has IPH distribution with representation
$Y$
has IPH distribution with representation $(\boldsymbol{\alpha },\mathbf{S}(t) )$
, and we write
$(\boldsymbol{\alpha },\mathbf{S}(t) )$
, and we write $Y \sim \mbox{IPH}(\boldsymbol{\alpha },\mathbf{S}(t) )$
. However, this setting is too general for applications since its functionals are given in terms of product integrals. Thus, we consider the subclass of IPH distribution when
$Y \sim \mbox{IPH}(\boldsymbol{\alpha },\mathbf{S}(t) )$
. However, this setting is too general for applications since its functionals are given in terms of product integrals. Thus, we consider the subclass of IPH distribution when $\mathbf{S}(t)$
is of the form
$\mathbf{S}(t)$
is of the form $\mathbf{S}(t) =\lambda (t)\mathbf{S}$
, where
$\mathbf{S}(t) =\lambda (t)\mathbf{S}$
, where $\lambda$
is some known nonnegative real function, and
$\lambda$
is some known nonnegative real function, and $\mathbf{S}$
is a sub-intensity matrix. In this case, we write
$\mathbf{S}$
is a sub-intensity matrix. In this case, we write $Y \sim \mbox{IPH}(\boldsymbol{\alpha },\mathbf{S}, \lambda )$
. Note that with
$Y \sim \mbox{IPH}(\boldsymbol{\alpha },\mathbf{S}, \lambda )$
. Note that with $\lambda \equiv 1$
, one gets the conventional PH distributions. This subclass is particularly suitable for applications due to the following property. If
$\lambda \equiv 1$
, one gets the conventional PH distributions. This subclass is particularly suitable for applications due to the following property. If $Y \sim \mbox{IPH}(\boldsymbol{\alpha },\mathbf{S}, \lambda )$
, then there exists a function
$Y \sim \mbox{IPH}(\boldsymbol{\alpha },\mathbf{S}, \lambda )$
, then there exists a function $g$
, named the inhomogeneity function, such that
$g$
, named the inhomogeneity function, such that
 \begin{equation*} Y \sim g(\tau), \end{equation*}
where $\tau \sim \mbox{PH}(\boldsymbol{\alpha },\mathbf{S})$
. The relationship between
$\tau \sim \mbox{PH}(\boldsymbol{\alpha },\mathbf{S})$
. The relationship between $g$
and
$g$
and $\lambda$
is given by the following expression:
$\lambda$
is given by the following expression:
 \begin{equation*} g^{-1}(y) = \int _{0}^{y} \lambda (t) dt. \end{equation*}
The density $f$
and distribution function
$f$
and distribution function $F$
of
$F$
of $Y \sim \mbox{IPH}(\boldsymbol{\alpha },\mathbf{S}, \lambda )$
can again be expressed using the exponential of matrices and are given by
$Y \sim \mbox{IPH}(\boldsymbol{\alpha },\mathbf{S}, \lambda )$
can again be expressed using the exponential of matrices and are given by
 \begin{equation*} f(y) = \lambda (y)\, \boldsymbol{\alpha }\exp \left ( \int _0^y \lambda (t) dt\ \mathbf{S} \right )\mathbf{s},\quad y\gt 0, \end{equation*}
 \begin{equation*} F(y) = 1- \boldsymbol{\alpha } \exp \left ( \int _0^y \lambda (t)dt\ \mathbf{S} \right ) \mathbf{e}, \quad y\gt 0. \end{equation*}
The class of IPH distributions is no longer confined to exponential tails, despite being defined in terms of matrix exponentials. Instead, the function $\lambda$
determines their exact asymptotic behavior (see Albrecher et al., Reference Albrecher, Bladt, Bladt and Yslas2022a for details).
$\lambda$
determines their exact asymptotic behavior (see Albrecher et al., Reference Albrecher, Bladt, Bladt and Yslas2022a for details).
It turns out that a number of IPH distributions can be expressed as classical distributions with matrix-valued parameters properly defined using functional calculus. Table 1 contains the IPH transformations as implemented in the matrixdist package (see Albrecher & Bladt, Reference Albrecher and Bladt2019; Albrecher et al., Reference Albrecher, Bladt, Bladt and Yslas2022a, Reference Albrecher, Bladt and Müllerc for further information and rationale on the different parametrizations).
Transformations

Table 1 Long description
A table with five rows and four columns. The columns are labeled as follows: lambda(t), g(y), Parameters domain, and Distribution names. The rows are labeled as follows: Matrix-Pareto, Matrix-Weibull, Matrix-Lognormal, Matrix-Loglogistic, and Matrix-Gompertz. Row 1: Matrix-Pareto, lambda(t) is (t + beta)^(-1), g(y) is beta(exp(y) - 1), Parameters domain is beta > 0. Row 2: Matrix-Weibull, lambda(t) is beta t^(beta - 1), g(y) is y^(1/beta), Parameters domain is beta > 0. Row 3: Matrix-Lognormal, lambda(t) is gamma(log(t + 1))^(-1) / (t + 1), g(y) is exp(y^(1/gamma) - 1), Parameters domain is gamma > 1. Row 4: Matrix-Loglogistic, lambda(t) is theta^(beta - 1) / (t^(beta) + theta^beta), g(y) is gamma(exp(y) - 1)^(1/beta), Parameters domain is gamma, beta > 0. Row 5: Matrix-Gompertz, lambda(t) is exp(beta(t)), g(y) is log(beta(y) + 1) / beta, Parameters domain is beta > 0.
Regression
At least two regression models based on IPH distributions exist in the literature. The first model, known as the PI model, was introduced in Albrecher et al. (Reference Albrecher, Bladt, Bladt and Yslas2022a). The authors, inspired by the proportional hazards model (cf. Cox, Reference Cox1972), formulated a way of regressing on the intensity function $\lambda$
for different covariate information. More specifically, the main idea of the PI model is that the inhomogeneous intensity
$\lambda$
for different covariate information. More specifically, the main idea of the PI model is that the inhomogeneous intensity $\lambda (\cdot\,;\;\boldsymbol{\theta })$
, which is assumed to be fully determined by a vector of parameters
$\lambda (\cdot\,;\;\boldsymbol{\theta })$
, which is assumed to be fully determined by a vector of parameters $\boldsymbol{\theta }$
, is proportionally affected for different covariate information
$\boldsymbol{\theta }$
, is proportionally affected for different covariate information $\mathbf{X}\in \mathbb{R}^h$
according to a positive real-valued and measurable function
$\mathbf{X}\in \mathbb{R}^h$
according to a positive real-valued and measurable function $m(\cdot )$
. In other words, the model assumes that
$m(\cdot )$
. In other words, the model assumes that
 \begin{equation*} \lambda (t\,;\,\mathbf{X},\boldsymbol{\theta }, \boldsymbol{\gamma })=\lambda (t\,;\,\boldsymbol{\theta })m(\mathbf{X}\boldsymbol{\gamma }), \quad t\ge 0, \end{equation*}
where $\boldsymbol{\gamma }$
is a
$\boldsymbol{\gamma }$
is a $h$
-dimensional column vector containing regression coefficients. With this assumption,
$h$
-dimensional column vector containing regression coefficients. With this assumption, $Y \mid \mathbf{X}\sim \mbox{IPH}(\boldsymbol{\alpha },\mathbf{S}, \lambda (\cdot\,;\,\mathbf{X},\boldsymbol{\theta }, \boldsymbol{\gamma }))$
with corresponding density and cumulative functions:
$Y \mid \mathbf{X}\sim \mbox{IPH}(\boldsymbol{\alpha },\mathbf{S}, \lambda (\cdot\,;\,\mathbf{X},\boldsymbol{\theta }, \boldsymbol{\gamma }))$
with corresponding density and cumulative functions:
 \begin{equation*} f(y)= m(\mathbf{X}\boldsymbol{\gamma }) \lambda (y\,;\,\boldsymbol{\theta }) \boldsymbol{\alpha }\exp \left (m(\mathbf{X}\boldsymbol{\gamma }) \int _0^y\lambda (t\,;\,\boldsymbol{\theta })\,dt \mathbf{S}\right )\mathbf{s}\,, \end{equation*}
and
 \begin{equation*} F(y)=1 - \boldsymbol{\alpha }\exp \left (m(\mathbf{X}\boldsymbol{\gamma }) \int _0^y\lambda (t\,;\,\boldsymbol{\theta })\,dt \mathbf{S}\right )\mathbf{e}\,. \end{equation*}
Typically, the measurable function $m()$
is taken to be
$m()$
is taken to be $m(x) = \exp (x)$
, which is the default implementation in matrixdist. In this framework, when
$m(x) = \exp (x)$
, which is the default implementation in matrixdist. In this framework, when $p = 1$
, one recovers the proportional hazard model. However, for
$p = 1$
, one recovers the proportional hazard model. However, for $p\gt 1$
, the implied hazard functions between different subgroups can deviate from proportionality in the distribution body but are asymptotically proportional in the tail. For more details on the PI model, we refer the reader to Albrecher et al. (Reference Albrecher, Bladt, Bladt and Yslas2022) and Bladt (Reference Bladt2022).
$p\gt 1$
, the implied hazard functions between different subgroups can deviate from proportionality in the distribution body but are asymptotically proportional in the tail. For more details on the PI model, we refer the reader to Albrecher et al. (Reference Albrecher, Bladt, Bladt and Yslas2022) and Bladt (Reference Bladt2022).
The second regression model, called the phase-type mixture-of-experts (PH-MoE) model, was introduced in Bladt & Yslas (Reference Bladt and Yslas2023b) as a generalization of MoE models to the PH distributions framework and follows the same rationale as the DPH-MoE specification described above (cf. Bladt & Yslas, Reference Bladt and Yslas2023b for further details).
3. Multivariate matrix distributions
In this section, we present the mathematical foundations of the different classes of multivariate matrix distributions implemented in matrixdist.
3.1 Multivariate discrete phase-type distributions
MDPH* class
Let $N\sim \mbox{DPH}_p(\boldsymbol{\alpha },\mathbf{S})$
be a DPH-distributed random variable with underlying MC
$N\sim \mbox{DPH}_p(\boldsymbol{\alpha },\mathbf{S})$
be a DPH-distributed random variable with underlying MC $(Z_n)_{n \in \mathbb{N}_0}$
. Let
$(Z_n)_{n \in \mathbb{N}_0}$
. Let $\mathbf{r}_j=(r_j(1),\ldots ,r_j(p))^{\top }$
be column vectors of dimension
$\mathbf{r}_j=(r_j(1),\ldots ,r_j(p))^{\top }$
be column vectors of dimension $p$
taking values in
$p$
taking values in $\mathbb{N}_0^{p}$
,
$\mathbb{N}_0^{p}$
, $j=1,\ldots ,d$
, and let
$j=1,\ldots ,d$
, and let $\mathbf{R}=(\mathbf{r}_1,\ldots ,\mathbf{r}_d)$
be a
$\mathbf{R}=(\mathbf{r}_1,\ldots ,\mathbf{r}_d)$
be a $p \times d$
matrix, called the reward matrix. We define
$p \times d$
matrix, called the reward matrix. We define
 \begin{equation*} N^{(j)}=\sum _{n = 0}^N r_j(Z_n) \,, \end{equation*}
for all $j = 1, \ldots , d$
. Then, we say that the random vector
$j = 1, \ldots , d$
. Then, we say that the random vector $\mathbf{N}=(N^{(1)},\ldots ,N^{(d)})$
has a multivariate DPH distribution of the MDPH* type, and we write
$\mathbf{N}=(N^{(1)},\ldots ,N^{(d)})$
has a multivariate DPH distribution of the MDPH* type, and we write $\mathbf{N}\sim \mbox{MDPH*}(\boldsymbol{\alpha },\mathbf{S},\mathbf{R})$
. This class of distributions was introduced in Campillo-Navarro (Reference Campillo-Navarro2018), and the construction principle can be seen as an extension of the so-called transformation via rewards for univariate DPH distributions. In this contribution, the author showed that elements in this class possess explicit expressions for joint probability-generating function, joint moment-generating function, and joint moments. Moreover, the class is dense in the class of distributions with support in
$\mathbf{N}\sim \mbox{MDPH*}(\boldsymbol{\alpha },\mathbf{S},\mathbf{R})$
. This class of distributions was introduced in Campillo-Navarro (Reference Campillo-Navarro2018), and the construction principle can be seen as an extension of the so-called transformation via rewards for univariate DPH distributions. In this contribution, the author showed that elements in this class possess explicit expressions for joint probability-generating function, joint moment-generating function, and joint moments. Moreover, the class is dense in the class of distributions with support in $\mathbb{N}^d$
, and margins are DPH-distributed. However, general closed-form expressions for the joint density and distribution functions are not available, and the estimation of this general class is still an open question, limiting their use in practice. Nonetheless, there are subclasses of MDPH* distributions with explicit expressions of these two functionals that preserve the denseness property of the MDPH* class. The matrixdist package provides implementations for two of these subclasses, which we describe next.
$\mathbb{N}^d$
, and margins are DPH-distributed. However, general closed-form expressions for the joint density and distribution functions are not available, and the estimation of this general class is still an open question, limiting their use in practice. Nonetheless, there are subclasses of MDPH* distributions with explicit expressions of these two functionals that preserve the denseness property of the MDPH* class. The matrixdist package provides implementations for two of these subclasses, which we describe next.
fMDPH class
Let $\mathbf{N} = (N^{(1)}, N^{(2)})\sim \mbox{MDPH*}(\boldsymbol{\alpha },\mathbf{S},\mathbf{R})$
with
$\mathbf{N} = (N^{(1)}, N^{(2)})\sim \mbox{MDPH*}(\boldsymbol{\alpha },\mathbf{S},\mathbf{R})$
with
 \begin{equation*} \boldsymbol{\alpha }=\left ( \boldsymbol{\pi },\boldsymbol{0}\right)\!,\quad \mathbf{S}=\left (\begin{array}{c@{\quad}c} \mathbf{S}_{11} & \mathbf{S}_{12}\\ \boldsymbol{0} &\mathbf{S}_{22} \end{array} \right)\!, \quad \text{and} \quad \mathbf{R}=\left (\begin{array}{c@{\quad}c} \mathbf{e} & \boldsymbol{0}\\ \boldsymbol{0} &\mathbf{e} \end{array}\right)\!. \end{equation*}
Here, $\mathbf{S}_{11}$
and
$\mathbf{S}_{11}$
and $\mathbf{S}_{22}$
are sub-transition matrices of dimensions
$\mathbf{S}_{22}$
are sub-transition matrices of dimensions $p_1$
and
$p_1$
and $p_2$
(
$p_2$
( $p_1+p_2=p$
), respectively,
$p_1+p_2=p$
), respectively, $\mathbf{S}_{12}$
is a
$\mathbf{S}_{12}$
is a $p_1 \times p_2$
matrix satisfying
$p_1 \times p_2$
matrix satisfying $\mathbf{S}_{11}\mathbf{e}+\mathbf{S}_{12}\mathbf{e}=\mathbf{e}$
, and
$\mathbf{S}_{11}\mathbf{e}+\mathbf{S}_{12}\mathbf{e}=\mathbf{e}$
, and $\boldsymbol{\pi }$
is a
$\boldsymbol{\pi }$
is a $p_1$
-dimensional vector of initial probabilities. Then, one can show that the joint density of this random vector is given by
$p_1$
-dimensional vector of initial probabilities. Then, one can show that the joint density of this random vector is given by
 \begin{equation*} f_{\mathbf{N}}(n^{(1)},n^{(2)})=\boldsymbol{\pi }\mathbf{S}_{11}^{n^{(1)} - 1}\mathbf{S}_{12}\mathbf{S}_{22}^{n^{(2)} - 1}\mathbf{s}_2 \,, \end{equation*}
where $\mathbf{s}_2= \mathbf{e}-\mathbf{S}_{22} \mathbf{e}$
. In this case, we say that
$\mathbf{s}_2= \mathbf{e}-\mathbf{S}_{22} \mathbf{e}$
. In this case, we say that $\mathbf{N}$
is bivariate DPH-distributed of the feed-forward type, and we write
$\mathbf{N}$
is bivariate DPH-distributed of the feed-forward type, and we write $\mathbf{N} \sim \mbox{fMDPH}(\boldsymbol{\pi },\mathbf{S}_{11},\mathbf{S}_{12}, \mathbf{S}_{22})$
. In particular, the marginals are parametrized by
$\mathbf{N} \sim \mbox{fMDPH}(\boldsymbol{\pi },\mathbf{S}_{11},\mathbf{S}_{12}, \mathbf{S}_{22})$
. In particular, the marginals are parametrized by $N^{(1)}\sim \mbox{DPH}(\boldsymbol{\pi },\mathbf{S}_{11})$
and
$N^{(1)}\sim \mbox{DPH}(\boldsymbol{\pi },\mathbf{S}_{11})$
and $N^{(2)}\sim \mbox{DPH}(\boldsymbol{\pi }\left (\mathbf{I}-\mathbf{S}_{11}\right )^{-1}\mathbf{S}_{12},\mathbf{S}_{22})$
. For more details on this class of bivariate DPH distributions, we refer the reader to Bladt & Yslas (Reference Bladt and Yslas2023c). Although the above construction principle can be extended to higher dimensions, the implementation of the methods associated with this class becomes more challenging. Fortunately, another subclass of MDPH* distributions introduced in Bladt & Yslas (Reference Bladt and Yslas2023c) can easily be tracked and implemented in higher dimensions, as we describe next.
$N^{(2)}\sim \mbox{DPH}(\boldsymbol{\pi }\left (\mathbf{I}-\mathbf{S}_{11}\right )^{-1}\mathbf{S}_{12},\mathbf{S}_{22})$
. For more details on this class of bivariate DPH distributions, we refer the reader to Bladt & Yslas (Reference Bladt and Yslas2023c). Although the above construction principle can be extended to higher dimensions, the implementation of the methods associated with this class becomes more challenging. Fortunately, another subclass of MDPH* distributions introduced in Bladt & Yslas (Reference Bladt and Yslas2023c) can easily be tracked and implemented in higher dimensions, as we describe next.
mDPH class
Let $(Z_n^{(j)})_{n\in \mathbb{N}_0}$
,
$(Z_n^{(j)})_{n\in \mathbb{N}_0}$
, $j=1,\ldots ,d$
, be MCs on a common state space with
$j=1,\ldots ,d$
, be MCs on a common state space with $p$
transient states. All chains are assumed to start in the same state and then evolve independently until respective absorptions. Formally,
$p$
transient states. All chains are assumed to start in the same state and then evolve independently until respective absorptions. Formally,
 \begin{equation*} Z_0^{(j)}=Z_{0}^{(l)}\,,\quad (Z_n^{(j)})_{n\in \mathbb{N}_0} {\perp\kern-6.8pt\perp}_{Z_0^{(1)}} (Z_n^{(l)})_{n\in \mathbb{N}_0,\:l \neq j}\,, \quad \forall j,l \in \{1,\ldots ,d\}\,. \end{equation*}
If $N^{(j)}$
,
$N^{(j)}$
, $j=1,\ldots ,d$
, are the univariate DPH-distributed absorption times of
$j=1,\ldots ,d$
, are the univariate DPH-distributed absorption times of $(Z_n^{(j)})_{n\in \mathbb{N}_0}$
, we say that the vector
$(Z_n^{(j)})_{n\in \mathbb{N}_0}$
, we say that the vector $\mathbf{N}=( N^{(1)},\ldots , N^{(d)} )$
has a multivariate DPH distribution of the mDPH type, and we write
$\mathbf{N}=( N^{(1)},\ldots , N^{(d)} )$
has a multivariate DPH distribution of the mDPH type, and we write
 \begin{equation*} \mathbf{N}\sim \mbox{mDPH}(\boldsymbol{\alpha },\widetilde {S}) \,, \end{equation*}
where $\boldsymbol{\alpha }$
is the common vector of initial probabilities and
$\boldsymbol{\alpha }$
is the common vector of initial probabilities and $\widetilde {S}=\{\mathbf{S}_1,\ldots ,\mathbf{S}_d\}$
, with
$\widetilde {S}=\{\mathbf{S}_1,\ldots ,\mathbf{S}_d\}$
, with $\mathbf{S}_j$
the sub-transition matrix associated with
$\mathbf{S}_j$
the sub-transition matrix associated with $(Z_n^{(j)})_{n\in \mathbb{N}_0}$
,
$(Z_n^{(j)})_{n\in \mathbb{N}_0}$
, $j=1,\ldots ,d$
. Explicit expressions for several functionals of interest of this class can easily be obtained by conditioning on the starting value of the MCs. For instance, the joint density function of
$j=1,\ldots ,d$
. Explicit expressions for several functionals of interest of this class can easily be obtained by conditioning on the starting value of the MCs. For instance, the joint density function of $\mathbf{N}\sim \mbox{mDPH}(\boldsymbol{\alpha },\widetilde {S})$
is given by
$\mathbf{N}\sim \mbox{mDPH}(\boldsymbol{\alpha },\widetilde {S})$
is given by
 \begin{equation*} f_{\mathbf{N}}(\mathbf{n})=\sum _{k=1}^p \alpha _k \prod _{j=1}^d\mathbf{e}_k^{\top }\mathbf{S}_j^{n^{(j)} - 1} \mathbf{s}_j \,, \quad \mathbf{n}\in \mathbb{N}^d. \end{equation*}
3.2 Multivariate continuous phase-type distributions
We now present the MPH*, fMPH, and mPH classes of distributions, which follow similar construction principles as their discrete counterparts.
Let $\tau \sim \mbox{PH}_p(\boldsymbol{\alpha },\mathbf{S})$
be a PH-distributed random variable,
$\tau \sim \mbox{PH}_p(\boldsymbol{\alpha },\mathbf{S})$
be a PH-distributed random variable, $\mathbf{r}_j=(r_j(1),\ldots ,r_j(p))^{\top }$
be nonnegative column vectors of dimension
$\mathbf{r}_j=(r_j(1),\ldots ,r_j(p))^{\top }$
be nonnegative column vectors of dimension $p$
,
$p$
, $j=1,\ldots ,d$
, and
$j=1,\ldots ,d$
, and $\mathbf{R}=(\mathbf{r}_1,\ldots ,\mathbf{r}_d)$
be a
$\mathbf{R}=(\mathbf{r}_1,\ldots ,\mathbf{r}_d)$
be a $p \times d$
reward matrix. Vectors
$p \times d$
reward matrix. Vectors $\mathbf{r}_j$
represent rates at which a reward is accumulated when
$\mathbf{r}_j$
represent rates at which a reward is accumulated when $(J_t)_{t\ge 0}$
is in a specific state. Thus, we denote by
$(J_t)_{t\ge 0}$
is in a specific state. Thus, we denote by
 \begin{equation*} Y^{(j)}=\int _0^\tau r_j(J_t)\,dt, \end{equation*}
the total reward earned prior to absorption by each component $j$
,
$j$
, $j = 1, \ldots , d$
. Then, we say that the random vector
$j = 1, \ldots , d$
. Then, we say that the random vector $\mathbf{Y}=(Y^{(1)},\ldots ,Y^{(d)})$
has a multivariate PH distribution of the MPH* type, and we write
$\mathbf{Y}=(Y^{(1)},\ldots ,Y^{(d)})$
has a multivariate PH distribution of the MPH* type, and we write $\mathbf{Y}\sim \mbox{MPH*}(\boldsymbol{\alpha },\mathbf{S},\mathbf{R})$
(see Kulkarni, Reference Kulkarni1989; Bladt & Nielsen, Reference Bladt and Nielsen2017; Albrecher et al., Reference Albrecher, Bladt and Müller2022c for more details). One attractive characteristic of this class of multivariate distributions is that, given a nonnegative vector
$\mathbf{Y}\sim \mbox{MPH*}(\boldsymbol{\alpha },\mathbf{S},\mathbf{R})$
(see Kulkarni, Reference Kulkarni1989; Bladt & Nielsen, Reference Bladt and Nielsen2017; Albrecher et al., Reference Albrecher, Bladt and Müller2022c for more details). One attractive characteristic of this class of multivariate distributions is that, given a nonnegative vector $\mathbf{w} = (w_1, \ldots , w_d)$
,
$\mathbf{w} = (w_1, \ldots , w_d)$
, $\lt \mathbf{Y}, \mathbf{w}\gt = \sum _{j = 1}^d w_j Y^{(j)}$
is PH-distributed, with representation
$\lt \mathbf{Y}, \mathbf{w}\gt = \sum _{j = 1}^d w_j Y^{(j)}$
is PH-distributed, with representation $(\boldsymbol{\alpha }_{\mathbf{w}},\mathbf{S}_{\mathbf{w}})$
say. To obtain the exact parametrization, we split the state space
$(\boldsymbol{\alpha }_{\mathbf{w}},\mathbf{S}_{\mathbf{w}})$
say. To obtain the exact parametrization, we split the state space $\{1, \ldots , p\} = E_{+} \cup E_{0}$
, such that
$\{1, \ldots , p\} = E_{+} \cup E_{0}$
, such that $k \in E_{+}$
if
$k \in E_{+}$
if $(\mathbf{R} \mathbf{w}^{\top })_k \gt 0$
and
$(\mathbf{R} \mathbf{w}^{\top })_k \gt 0$
and $k \in E_{0}$
if
$k \in E_{0}$
if $(\mathbf{R} \mathbf{w}^{\top })_k =0$
. Then, by a reordering of the states, we can assume that
$(\mathbf{R} \mathbf{w}^{\top })_k =0$
. Then, by a reordering of the states, we can assume that $\boldsymbol{\alpha }$
and
$\boldsymbol{\alpha }$
and $\mathbf{S}$
can be written as:
$\mathbf{S}$
can be written as:
 \begin{equation*} \boldsymbol{\alpha }=\left (\begin{array}{c@{\quad}c} \boldsymbol{\alpha }^{+}, & \boldsymbol{\alpha }^{0} \end{array}\right ) \quad \text{and} \quad \mathbf{S}=\left (\begin{array}{c@{\quad}c} \mathbf{S}^{++} & \mathbf{S}^{+0} \\ \mathbf{S}^{0+} & \mathbf{S}^{00} \end{array}\right)\!, \end{equation*}
where the $+$
terms correspond to states in
$+$
terms correspond to states in $E_{+}$
, and the
$E_{+}$
, and the $0$
terms to those states in
$0$
terms to those states in $E_{0}$
. For instance,
$E_{0}$
. For instance, $\mathbf{S}^{0+}$
collects transition intensities by which
$\mathbf{S}^{0+}$
collects transition intensities by which $(J_t)_{t\ge 0}$
jumps from states in
$(J_t)_{t\ge 0}$
jumps from states in $E_{0}$
to states in
$E_{0}$
to states in $E_{+}$
. After this arrangement, we can express the distribution of the continuous part of
$E_{+}$
. After this arrangement, we can express the distribution of the continuous part of $\lt \mathbf{Y}, \mathbf{w}\gt$
via a PH representation of the form:
$\lt \mathbf{Y}, \mathbf{w}\gt$
via a PH representation of the form:
 \begin{equation*} \boldsymbol{\alpha }_{\mathbf{w}}=\boldsymbol{\alpha }^{+}+\boldsymbol{\alpha }^{0}\left (\!-\mathbf{S}^{00}\right )^{-1}\mathbf{S}^{0+} \quad \text{and} \quad \mathbf{S}_{\mathbf{w}}=\boldsymbol{\Delta }((\mathbf{R} \mathbf{w}^{\top })_+)^{-1}\left (\mathbf{S}^{++}+\mathbf{S}^{+0}\left (\!-\mathbf{S}^{00}\right )^{-1}\mathbf{S}^{0+}\right ) \,. \end{equation*}
Here, $\boldsymbol{\Delta }((\mathbf{R} \mathbf{w}^{\top })_+)$
is a diagonal matrix with entries the vector
$\boldsymbol{\Delta }((\mathbf{R} \mathbf{w}^{\top })_+)$
is a diagonal matrix with entries the vector $(\mathbf{R} \mathbf{w}^{\top })_+$
formed of the appropriate ordered values satisfying
$(\mathbf{R} \mathbf{w}^{\top })_+$
formed of the appropriate ordered values satisfying $(\mathbf{R} \mathbf{w}^{\top })_k \gt 0$
. Note that an atom at zero of size
$(\mathbf{R} \mathbf{w}^{\top })_k \gt 0$
. Note that an atom at zero of size $\boldsymbol{\alpha }^0\left (\mathbf{I}-\left (\!-\mathbf{S}^{00}\right )^{-1}\mathbf{S}^{0+}\right )\mathbf{e}$
may appear since it is possible that
$\boldsymbol{\alpha }^0\left (\mathbf{I}-\left (\!-\mathbf{S}^{00}\right )^{-1}\mathbf{S}^{0+}\right )\mathbf{e}$
may appear since it is possible that $(J_t)_{t\ge 0}$
starts in a state in
$(J_t)_{t\ge 0}$
starts in a state in $E_0$
and gets absorbed before reaching a state in
$E_0$
and gets absorbed before reaching a state in $E_+$
. In particular, the above result implies that if
$E_+$
. In particular, the above result implies that if $\mathbf{Y}\sim \mbox{MPH*}(\boldsymbol{\alpha },\mathbf{S},\mathbf{R})$
, then its marginals
$\mathbf{Y}\sim \mbox{MPH*}(\boldsymbol{\alpha },\mathbf{S},\mathbf{R})$
, then its marginals $Y^{(j)}$
are PH-distributed with parameters easily computed with the aforementioned formulas. Moreover, the so-called transformation via rewards for univariate PH distributions is retrieved when
$Y^{(j)}$
are PH-distributed with parameters easily computed with the aforementioned formulas. Moreover, the so-called transformation via rewards for univariate PH distributions is retrieved when $d = 1$
above.
$d = 1$
above.
Although members of the MPH* class possess other desirable characteristics, such as explicit expressions for joint Laplace transform and joint moments (see Section 8.1.1 of Bladt & Nielsen, Reference Bladt and Nielsen2017), general closed-form expressions for both joint density and joint distribution functions do not exist. Similar to its discrete counterpart, the MDPH* class, this complicates their use in practice and, more importantly, their estimation. This motivates the introduction of other subclasses of MPH* distributions for which explicit expressions can be achieved. The matrixdist package provides implementations for the fMPH and mPH subclasses, which are derived similarly to their discrete equivalents.
The fMPH class is obtained by considering MPH* parametrizations of the form $\mbox{MPH*}(\boldsymbol{\alpha },\mathbf{S},\mathbf{R})$
with
$\mbox{MPH*}(\boldsymbol{\alpha },\mathbf{S},\mathbf{R})$
with
 \begin{equation*} \boldsymbol{\alpha }=\left(\boldsymbol{\pi },\boldsymbol{0}\right)\!,\quad \mathbf{S}=\left (\begin{array}{c@{\quad}c} \mathbf{S}_{11} & \mathbf{S}_{12}\\ \boldsymbol{0} &\mathbf{S}_{22} \end{array} \right)\!, \quad \text{and} \quad \mathbf{R}=\left (\begin{array}{c@{\quad}c} \mathbf{e} & \boldsymbol{0}\\ \boldsymbol{0} &\mathbf{e} \end{array}\right)\!, \end{equation*}
where $\mathbf{S}_{11}$
and
$\mathbf{S}_{11}$
and $\mathbf{S}_{22}$
are sub-intensity matrices of dimensions
$\mathbf{S}_{22}$
are sub-intensity matrices of dimensions $p_1$
and
$p_1$
and $p_2$
(
$p_2$
( $p_1+p_2=p$
), respectively,
$p_1+p_2=p$
), respectively, $\mathbf{S}_{12}$
is a
$\mathbf{S}_{12}$
is a $p_1 \times p_2$
matrix satisfying
$p_1 \times p_2$
matrix satisfying $\mathbf{S}_{11}\mathbf{e}+\mathbf{S}_{12}\mathbf{e}=\boldsymbol{0}$
, and
$\mathbf{S}_{11}\mathbf{e}+\mathbf{S}_{12}\mathbf{e}=\boldsymbol{0}$
, and $\boldsymbol{\pi }$
is a
$\boldsymbol{\pi }$
is a $p_1$
-dimensional vector of initial probabilities. In such a case, explicit expressions for different functionals can be obtained. For example, the joint density of a random vector
$p_1$
-dimensional vector of initial probabilities. In such a case, explicit expressions for different functionals can be obtained. For example, the joint density of a random vector $\mathbf{Y} = (Y^{(1)}, Y^{(2)})$
with the above parametrization is given by
$\mathbf{Y} = (Y^{(1)}, Y^{(2)})$
with the above parametrization is given by
 \begin{equation*} f_{\mathbf{Y}}(y^{(1)},y^{(2)})=\boldsymbol{\alpha }\exp \left (\mathbf{S}_{11}y^{(1)}\right )\mathbf{S}_{12}\exp \left (\mathbf{S}_{22}y^{(2)}\right )\left (\!-\mathbf{S}_{22}\right )\mathbf{e} \,, \end{equation*}
For more details on this class of bivariate PH distribution and an extension to the IPH framework, we refer to Albrecher et al. (Reference Albrecher, Bladt and Yslas2022).
The tractable class of mIPH distributions (with a particular instance, the mPH class) was introduced in Bladt (Reference Bladt2023) by considering $d$
time-inhomogeneous Markov pure jump processes on a common state space with
$d$
time-inhomogeneous Markov pure jump processes on a common state space with $p$
transient states that start in the same state and then evolve independently until respective absorptions. If
$p$
transient states that start in the same state and then evolve independently until respective absorptions. If $Y^{(j)}$
,
$Y^{(j)}$
, $j=1,\ldots ,d$
, are the univariate IPH-distributed absorption times of these Markov jump processes, we say that the vector
$j=1,\ldots ,d$
, are the univariate IPH-distributed absorption times of these Markov jump processes, we say that the vector $\mathbf{Y}=( Y^{(1)},\ldots , Y^{(d)} )$
has a multivariate IPH distribution of the mIPH type, and we write
$\mathbf{Y}=( Y^{(1)},\ldots , Y^{(d)} )$
has a multivariate IPH distribution of the mIPH type, and we write
 \begin{equation*} \mathbf{Y}\sim \mbox{mIPH}(\boldsymbol{\alpha },\widetilde {S},\widetilde {L}), \quad \mbox{where}\quad \widetilde {S}=\{\mathbf{S}_1,\ldots ,\mathbf{S}_d\}\quad \text{and} \quad \widetilde {L}=\{\lambda _1,\ldots ,\lambda _d\}. \end{equation*}
This construction yields explicit expressions for important functionals. For instance, let $\mathbf{Y}\sim \mbox{mIPH}(\boldsymbol{\alpha },\widetilde {S},\widetilde {L})$
, then we have
$\mathbf{Y}\sim \mbox{mIPH}(\boldsymbol{\alpha },\widetilde {S},\widetilde {L})$
, then we have
 \begin{equation*} f_{\mathbf{Y}}(\mathbf{y})=\sum _{k=1}^p \alpha _k \prod _{j=1}^d\mathbf{e}_k^{\top }\exp \left (\mathbf{S}_j g_j^{-1}(y^{(j)})\right )\mathbf{s}_j\lambda _j(y^{(j)}), \quad \mathbf{y}\in \mathbb{R}^d_+\,. \end{equation*}
Note that this allows for combining different types of IPH marginals, given by $\lambda _i(\cdot )$
and
$\lambda _i(\cdot )$
and $g_i(\cdot )$
, which enables different tail behaviors for the marginals.
$g_i(\cdot )$
, which enables different tail behaviors for the marginals.
3.3 Regression
For some of the multivariate classes introduced earlier, regression in the vector of initial probabilities can be applied by utilizing the same principle as in the univariate MoE approach. This allows us to capture the relationships between the multivariate responses and covariates, while taking advantage of the flexibility and expressiveness of the multivariate matrix distributions. Specifically, the mIPH-MoE model was introduced in Albrecher et al. (Reference Albrecher, Bladt and Müller2023b) and used to estimate the joint remaining lifetimes of spouses. Additionally, the mDPH-MoE and fMDPH-MoE specifications were derived in Bladt & Yslas (Reference Bladt and Yslas2023c) and illustrated for modeling insurance frequencies. The construction principle behind these models is similar to that of the univariate DPH-MoE approach presented in Section 2.1 and is therefore omitted here for conciseness. We refer the interested reader to the aforementioned references for further details.
4. Note on estimation algorithms and computational remarks
Most of the distribution classes presented above can be estimated using various forms of EM algorithms. This framework arises naturally when dealing with PH distributions, as we do not observe the trajectory of the underlying Markov jump processes. Instead, we only observe the time to absorption, with no information about the actual path taken. The PH setting is therefore an incomplete-data problem, a context in which the EM algorithm is known to perform particularly well. The original EM algorithm for PH distribution was introduced in Asmussen et al. (Reference Asmussen, Nerman and Olsson1996) and later extended for censored data in Olsson (Reference Olsson1996). The corresponding algorithm for DPH distributions can be found in Bladt & Nielsen (Reference Bladt and Nielsen2017). More recently, Albrecher et al. (Reference Albrecher, Bladt and Müller2022c) derived an EM algorithm for IPH distributions and illustrated how the implementation of the algorithms for MPH* and fMPH distributions can be carried out smoothly. Regarding the regression models, the estimation method for the PI model is presented in Albrecher et al. (Reference Albrecher, Bladt, Bladt and Yslas2022a), while Bladt & Yslas (Reference Bladt and Yslas2023b) provides the algorithm for the estimation of the PH-MoE specification. This method was then adapted in Albrecher et al. (Reference Albrecher, Bladt, Bladt and Yslas2023a) for the mIPH class and in Bladt & Yslas (Reference Bladt and Yslas2023c) for the DPH framework, which includes extensions to the multivariate classes mDPH and fMDPH.
All estimation procedures implemented in the matrixdist package related to PH distributions require an effective method for computing matrix-exponential operations, as the various E-steps involved hinge on these types of quantities. Several theoretical methods exist for these purposes (see for instance Moler & Van Loan (Reference Moler and Van Loan1978)), but an efficient numerical implementation is crucial due to the significant computational burden of the algorithms. The matrixdist package offers three primary implementations of matrix exponentials: the first, described in Asmussen et al. (Reference Asmussen, Nerman and Olsson1996), involves converting the problem into a system of ordinary differential equations (ODE). The second method utilizes the so-called uniformization, with the exact description available in Albrecher et al. (Reference Albrecher, Bladt and Müller2022c). The third and final method is the Padé approximation, which can be found in Moler & Van Loan (Reference Moler and Van Loan1978). Each method presents its own advantages and disadvantages. More specifically, the method based on ODE performs effectively in most cases, though it can face challenges with datasets containing extremely large data points or high-dimensional matrices. Additionally, this estimation approach might encounter difficulties with specific regression models, for example, the PI model, because it requires data to be ordered. On the other hand, the uniformization approach is typically faster and efficient, with its precision and speed being influenced by the selected truncation error threshold. Lastly, the Padé approximation maintains numerical stability across a broad spectrum of inputs; it tends to be slower than the other two methods and can thus be considered a benchmark. Therefore, the choice of estimation procedure depends on the specific problem/distribution at hand.
The EM algorithm for PH distributions also has a useful structural property: it preserves zeros in the parameter $\boldsymbol{\alpha }$
and
$\boldsymbol{\alpha }$
and $\boldsymbol{S}$
. This means that when an element has been estimated to zero, it remains zero in subsequent iterations. Thus, one can impose and maintain a desired structure during estimation by specifying an appropriate initialization. This can help not only to reduce the number of estimated parameters but also to speed up convergence, as pointed out in Asmussen et al. (Reference Asmussen, Nerman and Olsson1996). The matrixdist package includes random initialization for the following structures:
$\boldsymbol{S}$
. This means that when an element has been estimated to zero, it remains zero in subsequent iterations. Thus, one can impose and maintain a desired structure during estimation by specifying an appropriate initialization. This can help not only to reduce the number of estimated parameters but also to speed up convergence, as pointed out in Asmussen et al. (Reference Asmussen, Nerman and Olsson1996). The matrixdist package includes random initialization for the following structures:
-
• General PH (general). No restrictions, all elements are allowed to be nonzero.
-
• Hyperexponential (hyperexponential). Also known as a mixture of exponentials. Here, the Markov process is allowed to start in any of the transient states but gets absorbed without visiting any other state. This means that the matrix $\boldsymbol{\boldsymbol S}$
is nonzero only on the diagonal.
$\boldsymbol{\boldsymbol S}$
is nonzero only on the diagonal. -
• Generalized Erlang (gerlang). Also known as sum of exponentials. Here, the Markov process starts in state 1 with probability one, that is,
$\boldsymbol{\alpha } =(1,0,\ldots , 0)$
and then visits each subsequent state
$2,\ldots ,p$
, in that order, and finally reaches the absorbing state. -
• Coxian (coxian). Same structure as the generalized Erlang, but the Markov process is allowed to reach absorption from any of the transient states.
-
• Generalized Coxian (gcoxian). Same structure as the Coxian, but the Markov process is allowed to start in any state.


Note that in the above, we have included the names of these structures as they are defined and accessible within the matrixdist package.
5. Applications
In this section, we illustrate the use of the matrixdist package in three actuarial applications of significance. The first example (Section 5.1) addresses the univariate modeling of loss data exhibiting heavy tails. The second example (Section 5.2) deals with the joint modeling of absolute log-returns through MPH* distributions. The final example (Section 5.3) focuses on a multiline insurance claim dataset, addressing both the marginal and joint modeling of claim frequency and severity across two distinct lines of insurance coverage.
The model selection was done using the incremental approach commonly employed in matrix distributions modeling. Typically, this involves beginning with models of low dimension and sparse parameter structures and then incrementally exploring more complex models by increasing the matrix dimension or relaxing structural constraints. The trade-off of adding complexity is assessed by, for example, comparing loglikelihood values and/or using visual diagnostics such as QQ plots. This process continues until a satisfactory model is identified. It is crucial to test multiple initializations of the parameters, as the EM algorithm is sensitive to starting values and may converge to a local maxima or a saddle point, as noted in Asmussen et al. (Reference Asmussen, Nerman and Olsson1996). In the multivariate case, in addition to the margin assessment tools, one can resort to contour plots. Distributional distance tests (such as Kolmogorov–Smirnov) can also add concrete statistical evidence, in both univariate and multivariate settings.
5.1 Automobile bodily injury claims
We consider the AutoBi dataset from the insuranceData package, which contains information about automobile bodily injury claims. The dataset comprises eight variables: one for the economic loss (which we aim to describe), six covariates, and one variable to identify each claim. We start by providing general descriptive statistics for the variable of interest (LOSS).

We observe that the losses range from 0.005 to 1067.697, with 75% of the data smaller than 3.995. The presence of large values, compared to the body of the distribution, serves as an initial indication of a heavy tail. To further confirm this observation, we create a Hill plot using the hill() function from the evir package.
Hill plot for losses in the AutoBi dataset.

The plot (Figure 1) exhibits a flat behavior for the largest order statistics, suggesting a Pareto-type tail (or regularly varying). Therefore, we opt for an IPH model to more accurately capture the tail of the losses. More specifically, we use a matrix-Pareto distribution. The fitting process starts by creating an initial IPH distribution, which provides the starting parameters for the EM algorithm. This can be accomplished by employing the iph() method in matrixdist. For our analysis, we create an IPH object with random parameters of a general structure, a dimension 6, and a Pareto inhomogeneity function.

With an initial IPH distribution in place, we can employ the fit() method to fit the data. It is important to note that fit() requires specifying the number of steps for the EM algorithm. In this instance, we use 1500 steps, as the changes in the loglikelihood become negligible with this number (the same criteria is employed to determine the number of iterations in the subsequent illustration). The method outputs an IPH object containing the fitted parameters. Further steps could be made on the output object if required.
To visually asses the quality of the fit, we create a QQ plot for the fitted distribution and a histogram of the (log) data against the fitted density:

Figures 2 and 3 display these plots, which indicate that the fitted distribution provides a good approximation of the data. In particular, the sample and fitted quantiles align closely with the identity line, especially within the distribution’s body. Although there is a slight deviation from the identity line for quantiles in the tail, they remain relatively close to the blue line. The histogram further supports the notion that the fitted IPH distribution is a satisfactory approximation.
QQ plot of fitted distribution.

Histogram of the logarithm of losses versus fitted density (blue line).

PH regression
We now shift our focus to the regression framework. In particular, we employ the PI specification to capture the influence of covariate information on economic losses. The initial step involves removing any incomplete covariate data. Next, we need to split the covariates and the response variable into two different objects. In our case, we investigate the effect of the variables ATTORNEY, CLMSEX, and CLMAGE. The variable ATTORNEY indicates whether the claimant was represented by an attorney or not, CLMSEX is the claimant’s sex, and CLMAGE corresponds to their age.

Now, we can employ the reg() method to perform the PI regression. This function works similarly to the fit() method, with the main difference being that estimation of the regression parameters is included in each iteration of the EM algorithm (see Albrecher et al., Reference Albrecher, Bladt, Bladt and Yslas2022a for details). Along with the data, the reg() method requires an initial IPH distribution. In this case, we employ the previously fitted matrix-Pareto distribution without covariates.
The resulting object (z.reg) contains the parameters of the underlying IPH model, namely alpha, S, and beta, along with the regression coefficients B. This information can be easily accessed via the coef() function as follows.

The above information can be used, for example, to create customized loss distributions for individual claimants based on their distinctive characteristics. Take, for instance, a new claimant: a 60-year-old male, unrepresented by an attorney. The following code leverages our model to estimate his loss distribution.

If we wish to visualize this claimant’s survival function, we can plot it as follows.

Survival function of losses for the new claimant.

Figure 4 shows the resulting survival function for the new claimant, providing a visual representation of their risk profile. We refer readers to Section 6 and the documentation of matrixdist for further available methods for PH and IPH distributions.
5.2 Multivariate modeling of log-returns
To illustrate the capabilities of the implementations for MPH* distributions in matrixdist, we use the rdj dataset of the copula package. More specifically, our focus is to use an MPH* for describing the joint behavior of the absolute log-returns of the three stock prices in this dataset: Intel, Microsoft, and General Electric.
First, we load the data, take the absolute value, and eliminate any data points with atoms at zero.

As in the univariate case, the fitting process requires the definition of an initial MPHstar object that is subsequently fed into the fit() function. For this class of objects, the function is implemented solely using the uniformization method. As such, a truncation error must be specified. A custom value can be passed via the uni_epsilon argument; otherwise, it defaults to $10^{-4}$
. The method also includes the argument r, which can be used to speed up the fitting procedure by applying random subsampling of the data at each iteration. If not specified, no subsampling is applied. For the present analysis, we use an initial MPHstar object with randomly generated parameters, a general matrix structure, and dimension 8. We also modify the values of uni_epsilon and r in fit() to illustrate their use.
$10^{-4}$
. The method also includes the argument r, which can be used to speed up the fitting procedure by applying random subsampling of the data at each iteration. If not specified, no subsampling is applied. For the present analysis, we use an initial MPHstar object with randomly generated parameters, a general matrix structure, and dimension 8. We also modify the values of uni_epsilon and r in fit() to illustrate their use.

The parameters of the fitted model can be accessed using x.fit@pars, which includes the estimated parameters of the underlying PH model (alpha and S) as well as the estimated reward matrix (R). In particular, the reward matrix can be extracted as follows:

Each row of the reward matrix corresponds to a transient state of the underlying Markov jump process, while each column represents one of the marginal components. The entries indicate the relative contribution of each state to the respective marginals. For example, in row 4, all the weight is placed on the second component, suggesting that this state is almost exclusively associated with that margin.
To assess the quality of the fit, we first examine the marginal behavior of the fitted model. The marginal distributions can be accessed using the marginal() function, which allows us to create QQ plots for a visual comparison between the empirical and fitted distributions.

QQ plot of fitted distirbutions for each marginal.

Upon inspecting the QQ plots (Figure 5), we can observe that the fitted marginals provide a satisfactory approximation of the data. To assess the joint behavior, we simulate data from the fitted MPH* model and use kernel density estimation to produce contour plots, shown in Figure 6. As MPH* models do not possess a closed-form expression for their joint density, this simulation approach provides a practical alternative for visual inspection. The figure also includes the corresponding contour plot of the original data for comparison, where we observe similar behaviors in most regions. It is worth mentioning that although joint density evaluation via Laplace inversion is theoretically possible, it is computationally demanding and slow, making the simulation approach the most practical solution.

Note that contour plots behave well on a global scale but can be volatile at the tail regions due to a lack of data. Consequently, one can additionally resort to statistical tests to determine whether the original data has the same distribution as the simulated data. For example, here we use a Cramér two-sample test introduced in Baringhaus & Franz (Reference Baringhaus and Franz2004) and as implemented in the cramer R package (Franz, Reference Franz2024), which leads to the null hypothesis that both datasets possess the same distribution cannot be rejected.
Contour plots of the kernel density estimates for each combination of the margins of the original data (top) and of a sample simulated from the fitted MPH* model (bottom).


5.3 Wisconsin property insurance dataset
We now consider the Wisconsin Local Government Property Insurance Fund (LGPIF) dataset (see https://sites.google.com/a/wisc.edu/local-government-property-insurance-fund). This fund was established to provide insurance coverage to government properties not owned by the State of Wisconsin. Governmental entities under this fund include counties, cities, towns, schools, and other miscellaneous entities, and properties covered encompass buildings, vehicles, and equipment. The dataset is divided into a training set covering the years 2006–2010 and a testing set encompassing the year 2011. It includes data on claim frequencies and severities across six different coverage groups: building and content (BC), contractor’s equipment (IM), comprehensive new (PN), comprehensive old (PO), collision new (CN), and collision old (CO) coverage.
This dataset, which is publicly available at https://sites.google.com/a/wisc.edu/jed-frees/home, was thoroughly studied in Frees et al. (Reference Frees, Lee and Yang2016), with the corresponding code used for the analysis also accessible at the same URL. Here, we focus on the univariate and multivariate modeling of frequency and severity for two coverages – BC and CO – using matrix models and compare our results to those obtained in the aforementioned study. Note that to reproduce the following analysis, the setup.R script available on the above-mentioned site must be run first to access the necessary data objects.
Severity modeling
We start our analysis with the univariate modeling of the average claim size of BC, which we scale with a factor of $10^{-4}$
to speed up the convergence of the fitting algorithms.
$10^{-4}$
to speed up the convergence of the fitting algorithms.
QQ plot for residuals of IPH for BC.

Regarding explanatory variables, we choose the following as in Frees et al. (Reference Frees, Lee and Yang2016): coverage amount (in log-scale), an indicator for no claims in the previous year, entity type (City, County, Misc, School, Town), and deductible level (in log-scale). We then fit a PH-MoE model of dimension 5 with general Coxian structure of the sub-intensity matrix. For this, we first specify the regression formula and an initial IPH model.

These two objects are then passed into the MoE() function to obtain the fitted PH-MoE model.
Note that we have selected a matrix-lognormal model, as it provided the largest value of the loglikelihood ( $-1,836.67$
) compared to other IPH specifications of the same dimension. In fact, it outperforms the Generalized Beta type 2 (GB2) model in Frees et al. (Reference Frees, Lee and Yang2016), which has corresponding loglikelihood of
$-1,836.67$
) compared to other IPH specifications of the same dimension. In fact, it outperforms the Generalized Beta type 2 (GB2) model in Frees et al. (Reference Frees, Lee and Yang2016), which has corresponding loglikelihood of $-1,973.30$
. The goodness-of-fit is then checked visually using a QQ plot of the quantiles of normal Cox–Snell residuals, which are compared with normal quantiles (see Figure 7).
$-1,973.30$
. The goodness-of-fit is then checked visually using a QQ plot of the quantiles of normal Cox–Snell residuals, which are compared with normal quantiles (see Figure 7).

Moreover, to assess the predictive performance of the fitted model, we use the testing set and compared the mean predictions of the PH-MoE and GB2 models with the observed average severity via the root-mean-square error (RMSE) measure.

We obtain an RMSE of 7.8305 for the PH-MoE model and 29.8380 for the GB2 one, showcasing the superior predictive performance of the matrix model.
Subsequently, we perform a similar analysis for the CO coverage. In this case, we only consider coverage amount (in log-scale) and the indicator for no claims in the previous year as covariates to align the results with the study in Frees et al. (Reference Frees, Lee and Yang2016). Moreover, we have also selected a matrix-lognormal model of dimension 4 and general Coxian structure of the sub-intensity matrix.

Once again, we have that the matrix model outperforms the GB2 model in terms of loglikelihood with $-$
178.78 for the former and
$-$
178.78 for the former and $-$
189.38 for the latter. The QQ plot of the residuals of the PH-MoE model are shown in Figure 8.
$-$
189.38 for the latter. The QQ plot of the residuals of the PH-MoE model are shown in Figure 8.

QQ plot for residuals of IPH for CO.

Regarding the predictive performance, the PH-MoE specification, with an RMSE of 1.1552, outperforms the GB2 model with an RMSE of 1.2277.

We continue the analysis of the severities by presenting a joint modeling of the BC and CO lines using an mIPH model with MoE regression. We start by considering the data with claims in both lines and giving the same scaling of $10^{-4}$
as before.
$10^{-4}$
as before.

We then specify the regression formula and an initial mIPH model. In this case, we have chosen matrix-lognormal margins of dimension 5 and general Coxian structure of their sub-intensity matrices, primarily based on the previous univariate analysis. The initial mIPH model is created using the miph() function, which requires as input an underlying mPH model constructed via mph().

Finally, we fit the regression model using the MoE() function.

We note that the fitted model gives a value of the loglikelihood of −332.79, which outperforms the joint model in Frees et al. (Reference Frees, Lee and Yang2016), consisting of GB2 margins bounded together with a Gaussian copula, with a corresponding loglikelihood of −341.33.
To conclude the severity analysis, we present Table 2, which summarizes the performance of all models considered in terms of loglikelihood and RMSE.
Loglikelihood and RMSE for severity models

Table 2 Long description
A table comparing the performance of different models in terms of loglikelihood and RMSE. The table has 6 rows and 3 columns. The columns are labeled Model, Loglikelihood, and RMSE. The rows are as follows: Row 1: Model, PH-MoE (BC), Loglikelihood, -1,836.67, RMSE, 7.8305. Row 2: Model, GB2 (BC), Loglikelihood, -1,973.30, RMSE, 29.8380. Row 3: Model, PH-MoE (CO), Loglikelihood, -178.78, RMSE, 1.1552. Row 4: Model, GB2 (CO), Loglikelihood, -189.38, RMSE, 1.2277. Row 5: Model, mPH-MoE (BC + CO), Loglikelihood, -332.79, RMSE, ---. Row 6: Model, GB2 + Gaussian copula (BC + CO), Loglikelihood, -341.33, RMSE, ---.
Frequency modeling
As in the previous section, we begin our study with the univariate modeling of the frequency of BC. Since the support of DPH distributions is $\mathbb{N}$
and the dataset includes observations equal to zero, we apply a translation to the data to start at one.
$\mathbb{N}$
and the dataset includes observations equal to zero, we apply a translation to the data to start at one.

We now specify the regression formula, which includes the same covariates as the corresponding analysis in Frees et al. (Reference Frees, Lee and Yang2016), and an initial DPH object of dimension 7 with a general Coxian-like structure of the matrix of transition probabilities.

Regression under the MoE framework can now be performed using the above two objects in the MoE() function.
The fitted model leads to a loglikelihood of $-$
4,777.64, which is considerably higher than the corresponding values of the two models with the largest loglikelihoods in Frees et al. (Reference Frees, Lee and Yang2016); negative binomial (NB) with a value of
$-$
4,777.64, which is considerably higher than the corresponding values of the two models with the largest loglikelihoods in Frees et al. (Reference Frees, Lee and Yang2016); negative binomial (NB) with a value of $-$
5,102.62 and zero-one-inflated negative binomial (zerooneNB) with
$-$
5,102.62 and zero-one-inflated negative binomial (zerooneNB) with $-$
4,958.29. To further evaluate the goodness-of-fit, we calculate the chi-square statistic, which yields a value of 22.45 for the DPH-MoE model. This outperforms the NB and zerooneNB specifications with corresponding values of 88.09 and 34.51.
$-$
4,958.29. To further evaluate the goodness-of-fit, we calculate the chi-square statistic, which yields a value of 22.45 for the DPH-MoE model. This outperforms the NB and zerooneNB specifications with corresponding values of 88.09 and 34.51.

Regarding the predictive performance, we use the testing set and compare the mean predictions of the DPH-MoE, NB, and zerooneNB models with the observed frequencies using the RMSE.

We have that the DPH-MoE specification outperforms the other two models with a RMSE of 6.1806. In contrast, the NB model yields a RMSE of 6.8581, while the zerooneNB model shows a value of 6.9722.
We continue the study with the univariate modeling of the frequency for the CO line. In this case, we have selected a DPH-MoE model of dimension 6 with the same sparse structure of the transition matrix.

We have that the fitted DPH-MoE yields a value of the loglikelihood of $-$
1,022.96, which is larger than the corresponding values of the NB and zerooneNB models with values of
$-$
1,022.96, which is larger than the corresponding values of the NB and zerooneNB models with values of $-$
1,071.14 and
$-$
1,071.14 and $-$
1,067.82, respectively. However, note that the value of the chi-square statistics is 10.49, which is marginally bigger than the values of 10.39 and 10.37 coming from the NB and zerooneNB specifications.
$-$
1,067.82, respectively. However, note that the value of the chi-square statistics is 10.49, which is marginally bigger than the values of 10.39 and 10.37 coming from the NB and zerooneNB specifications.

Moreover, we assess the predictive performance of the fitted DPH-MoE model using the testing set and the RMSE measure. We obtain a value of 0.5847 for this measure, which indicates superior performance compared to the NB and zerooneNB specifications, with corresponding values of 0.6615 and 0.6110.

Finally, we focus on the joint modeling of the frequencies for the BC and CO lines via an mDPH model with MoE regression. We first need to filter the data to consider only the entires with coverage in both lines and apply a translation to one.

We then specify the regression formula and an initial mDPH object. Note that we have selected dimension 7 with a general Coxian-like structure of the transition matrices in accordance with the previous univariate analyses.

With these two objects at hand, we can now perform regression via the MoE framework using the MoE() function.

The resulting fitted matrix model yields a loglikelihood of $-$
2,979.96. This outperforms the multivariate model in Frees et al. (Reference Frees, Lee and Yang2016), consisting of a Gaussian copula with zerooneNB margin for BC and NB margin for CO, which has leads to a value of
$-$
2,979.96. This outperforms the multivariate model in Frees et al. (Reference Frees, Lee and Yang2016), consisting of a Gaussian copula with zerooneNB margin for BC and NB margin for CO, which has leads to a value of $-$
3,321.73 of the loglikelihood.
$-$
3,321.73 of the loglikelihood.
We conclude the frequency analysis as in Table 3, which summarizes the performance of the models discussed above based on loglikelihood, chi-square statistics, and RMSE.
Summary of frequency model performance: loglikelihood, chi-square statistic, and RMSE

Table 3 Long description
A table comparing model performance metrics across different models and criteria. The table has 8 rows and 4 columns. Column headers are Model, Loglikelihood, Chi-square, and RMSE. Row labels are DPH-MoE (BC), NB (BC), ZeroOneNB (BC), DPH-MoE (CO), NB (CO), ZeroOneNB (CO), mDPH-MoE (BC + CO), and ZeroOneNB + NB + Gaussian copula (BC + CO). Row 1: Model, DPH-MoE (BC); Loglikelihood, -4,777.64; Chi-square, 22.45; RMSE, 6.1806. Row 2: Model, NB (BC); Loglikelihood, -5,102.62; Chi-square, 88.09; RMSE, 6.8581. Row 3: Model, ZeroOneNB (BC); Loglikelihood, -4,958.29; Chi-square, 34.51; RMSE, 6.9722. Row 4: Model, DPH-MoE (CO); Loglikelihood, -1,022.96; Chi-square, 10.49; RMSE, 0.5847. Row 5: Model, NB (CO); Loglikelihood, -1,071.14; Chi-square, 10.39; RMSE, 0.6615. Row 6: Model, ZeroOneNB (CO); Loglikelihood, -1,067.82; Chi-square, 10.37; RMSE, 0.6110. Row 7: Model, mDPH-MoE (BC + CO); Loglikelihood, -2,979.96; Chi-square, —; RMSE, —. Row 8: Model, ZeroOneNB + NB + Gaussian copula (BC + CO); Loglikelihood, -3,321.73; Chi-square, —; RMSE, —.
Classes of matrix distributions available in matrixdist

Table 4 Long description
A table with two columns and ten rows. The first column is labeled Class and the second column is labeled Constructor function. The table lists various classes of matrix distributions and their corresponding constructor functions. Row 1: Class, DPH; Constructor function, dph(). Row 2: Class, PH; Constructor function, ph(). Row 3: Class, IPH; Constructor function, iph(). Row 4: Class, fMDPH; Constructor function, bivdph(). Row 5: Class, mDPH; Constructor function, mdph(). Row 6: Class, MPH*; Constructor function, MPHstar(). Row 7: Class, fMPH; Constructor function, bivph(). Row 8: Class, mPH; Constructor function, mph(). Row 9: Class, fMIPH; Constructor function, biviph(). Row 10: Class, mIPH; Constructor function, miph().
6. Summary of methods
We have explored the fundamental properties of some matrix distributions and demonstrated the use of the matrixdist package for analyzing real-life data through detailed examples. The package encompasses methods for computing various functionals and estimating most of the classes discussed in this paper. Table 4 presents the families of matrix distributions currently implemented in the package. We refer readers to the package documentation for guidance on using these construction functions. For example, consulting ?ph will provide instructions on creating PH distributions. Additionally, Table 5 offers a comprehensive list of the implemented methods, along with a mapping to the applicable classes. For examples of the use of these methods, the package help can be consulted. The general structure for accessing the desired examples is ?`method_name,class_name-method`. For instance, ?`fit,ph-method` directs to the documentation of the fit() method for the ph class. In future versions of the package, methods and classes are expected to gradually be included, including general heavy-tailed models as in Albrecher et al. (Reference Albrecher, Bladt, Bladt and Yslas2023a) and Bladt & Yslas (Reference Bladt and Yslas2022). Moreover, dedicated functions for computing risk measures, such as Expected Shortfall, will be provided in future iterations of the package. It is worth mentioning that VaR can be already obtained using the quan() method, and moment-based risk measures can be calculated from the raw moments, which are available using the moment() method.
Methods for matrix distributions available in matrixdist

Table 5 Long description
The table presents methods for matrix distributions available in the matrixdist package. It includes columns for Method, Description, and Available for. The table has 23 rows and 3 columns. Row 1: Method, sim, Simulates iid realizations, Available for, dph, ph, iph, bivdph, mdph, MPHstar, bivph, mph, miph. Row 2: Method, moment, Moments, Available for, dph, ph, bivdph, mdph, bivph, mph. Row 3: Method, laplace, Laplace transform, Available for, ph, bivph, mph. Row 4: Method, mgf, Moment-generating function, Available for, ph, bivph, mph. Row 5: Method, pgf, Probability-generating function, Available for, dph, bivdph, mdph. Row 6: Method, +, Parmetrization of the sum of two matrix distributions, Available for, dph, ph. Row 7: Method, minimum, Parmetrization of the minimum of two matrix distributions, Available for, dph, ph, iph. Row 8: Method, maximum, Parmetrization of the maximum of two matrix distributions, Available for, dph, ph, iph. Row 9: Method, mixture, Parmetrization of a mixture of two matrix distributions, Available for, dph, ph. Row 10: Method, Nfold, N-fold convolution with NDPH-distributed, Available for, dph, ph. Row 11: Method, dens, Density function, Available for, dph, ph, iph, bivdph, mdph, bivph, mph, biviph, miph. Row 12: Method, cdf, Cumulative distribution function, Available for, dph, ph, iph, mph, miph. Row 13: Method, hazt, Hazard rate function, Available for, ph, iph. Row 14: Method, quan, Quantiles, Available for, ph, iph. Row 15: Method, TVR, Transformation via rewards, Available for, dph, ph. Row 16: Method, fit, Estimation, Available for, dph, ph, iph, bivdph, mdph, MPHstar, bivph, mph, biviph, miph. Row 17: Method, reg, PI regression, Available for, ph, iph. Row 18: Method, MoE, MoE regression, Available for, dph, ph, iph, bivdph, mdph, mph, miph. Row 19: Method, marginal, Parametrization of marginal distribution, Available for, bivdph, mdph, MPHstar, bivph, mph, biviph, miph. Row 20: Method, linCom, Parametrization of a linear combination of marginals, Available for, MPHstar, bivph. Row 21: Method, mean, Mean or vector of means, Available for, dph, ph, bivdph, mdph, MPHstar, bivph, mph. Row 22: Method, var, Variance or covariance matrix, Available for, dph, ph, bivdph, mdph, MPHstar, bivph, mph. Row 23: Method, cor, Correlation matrix, Available for, bivdph, mdph, MPHstar, bivph, mph.
Supplementary material
The supplementary material for this article can be found at https://doi.org/10.1017/S1748499525100134.
Data availability statement
Data availability does not apply to this article as no new data were created or analyzed. The matrixdist package is available in the Comprehensive R Archive Network (CRAN) and the GitHub repository https://github.com/martinbladt/matrixdist_1.0. The numerical examples are reproducible using the code contained in the manuscript.
Funding statement
The first author was supported by the Carlsberg Foundation, grant CF23-1096.
Competing interests
The authors declare none.
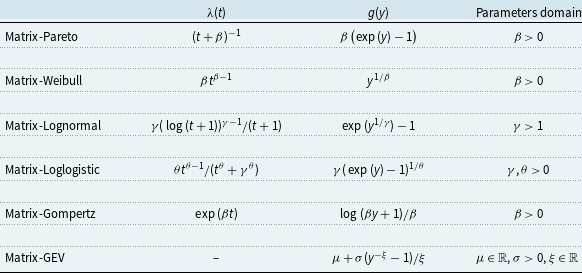


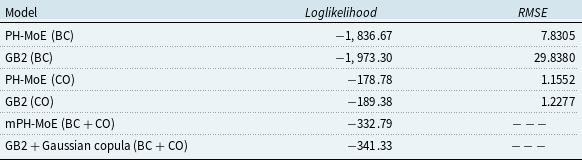
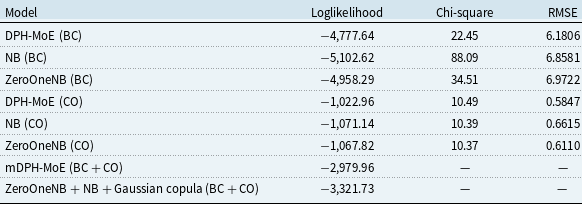
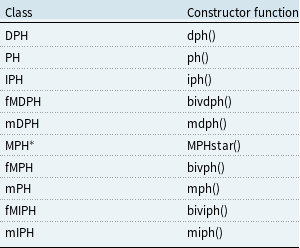
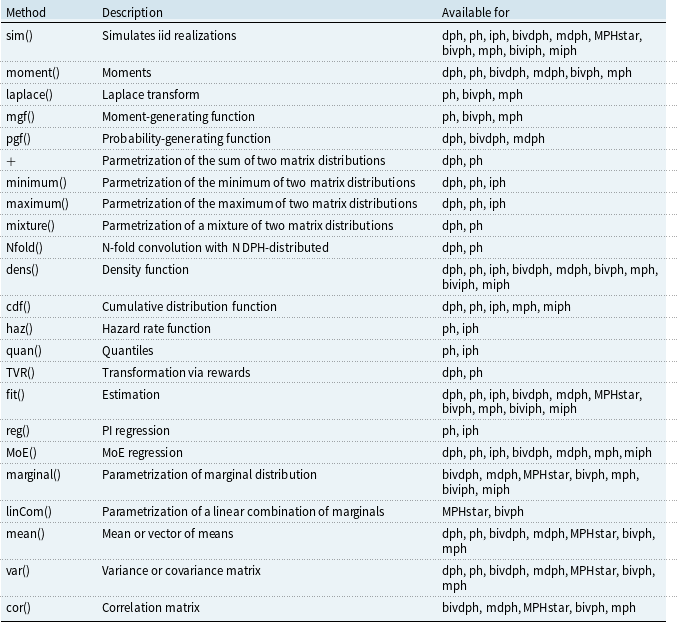


 Open access