

1. INTRODUCTION
Acceleration of ions via the interaction of ultra-intense lasers with thin, solid density targets is a currently a topic of intense interest (Snavely et al., 2000; Maksimchuk et al., 2000; Chirila et al., 2004; Honrubia & Tikhonchuk, 2004; Borghesi et al., 2005; Chen & Wilks, 2005). In addition to the early proton acceleration experiments, higher-Z ion beams have been generated (Hegelich et al., 2002, 2005; Fernández et al., 2005; Roth et al., 2005; Flippo et al., 2006), and monoenergetic higher-Z ion beams have been realized (Hegelich et al., 2006). These beams are produced by the conversion of a short pulse laser onto the front surface of a target foil of thickness ranging, typically, from a few to tens of microns. In these settings, target normal sheath acceleration (TNSA) (Hatchett et al., 2000; Wilks et al., 2001) has been identified as the dominant ion acceleration mechanism.
Recently, Fuchs et al. (2006a, 2006b) reported proton acceleration from aluminum targets of varying target thickness. An innovative feature of these experiments was the use of extremely high contrast ratio (1012) short pulse laser beam to irradiate the target. The high contrast ratio allowed good target integrity to be maintained with very thin targets that would be destroyed by the shocks from the prepulses of typical high-intensity short-pulse lasers, which have contrast ratios of 106 to 107. The high contrast ratio allowed good target integrity to be maintained with very thin targets that would normally be destroyed by the shock driven by the laser prepulse of a typical high-intensity short-pulse laser with contrast ratio of 106 to 107. The Fuchs et al. (2006a, 2006b) measurements at a laser driver of lower intensity than in the thicker target shots show an increase in maximum ion energy with very thin targets. A local maximum in proton energy was obtained with a 50 nm thick target.
Motivated by these results, we have performed particle-in-cell (PIC) simulations on the interaction of a short pulse laser (I0 = 1021 W/cm2), with targets of thickness ranging from 10 to 500 nm. In these simulations, behavior resembling that observed in the Fuchs et al. (2006a, 2006b) experiments is obtained. With the use of a 30 nm carbon foil (target thickness comparable to an laser skin depth), a relative increase in ion beam energy by more than an order of magnitude over traditional TNSA is achieved. This dramatic increase suggests the presence of an ion acceleration mechanism beyond normal TNSA.
In this paper, we examine using PIC simulations the kinetic physics of ion acceleration from ultrathin targets. In the simulations, target thicknesses are varied from 0.5 micron to ten nanometers in size (Section 2). Enhanced acceleration occurs when the target thickness becomes comparable to the laser skin depth. Then, the behavior of the laser-target interaction is modified, and a sizable enhancement in beam energy and quality (ΔEbeam/Ebeam) over TNSA acceleration is attained. After a brief period of TNSA, the enhanced acceleration phase has two distinct stages: the first stage, a period of enhanced TNSA, during which the cold electron background converts entirely to hot electrons. The laser then reheats the refluxing hot electrons to higher energy. TNSA electric fields scale with the hot electron temperature, so further heating of the hot electron population to yet higher energies leads to larger electric fields in the sheath. The second stage is the “laser break-out afterburner” (BOA), when the laser penetrates the rear of the target and generates a large longitudinal electric field localized at the rear of the target, with the location of the peak field co-moving with the ions. The physics underlying the two enhanced acceleration stages, as well as the nonlinear end state of BOA, is described below. We conclude with discussion of possible applications of this technique, including as drivers for fast ignition inertial confinement fusion, medical applications, and radiography.
2. PARTICLE-IN-CELL SIMULATIONS AND ANALYSIS OF ENHANCED TNSA AND THE LASER BREAK-OUT AFTERBURNER
Simulations of ion acceleration are performed using the fully explicit, massively parallel, relativistic, and electromagnetic PIC code VPIC (Albright et al., 2006). VPIC employs exact charge and magnetic field divergence-conserving algorithms, energy-conserving field interpolations (E and B solve), a sixth order magnetic field advance, and an exponentially differenced explicit field solver on a Cartesian Yee-mesh (Yee, 1966). The simulations are conducted in one spatial dimension (1D), in a system domain 100 μm in length, with absorbing boundary conditions for the fields and particles. A 1 μm wavelength laser of intensity 1021 W/cm2 enters from the left boundary and the front surface of the thin target is located at a distance 20 μm from the entrance. The target is composed of electrons and fully ionized carbon ions C6+ of solid density (ne /ncr = 660, where ncr is the critical density), and with a thickness ranging from 10 to 500 nm. A rise time of tωpe = 2500 (∼0.055 ps), where ωpe is the initial electron plasma frequency is used for the laser intensity at the entrance to reach its maximum. After this time, the laser intensity is held constant throughout the simulation. The simulation cell size is 0.3λD0, with λD0 representing the initial Debye length of the electrons, which are of temperature Te = 165 keV initially; the ions are cold (Ti ≈ 0). In the following discussion, we describe the different stages of enhanced ion acceleration using results from a representative simulation in which the target is a pure carbon target of thickness 30 nm and the laser intensity is 1021 W/cm2.
2.1. Initial TNSA Acceleration Phase
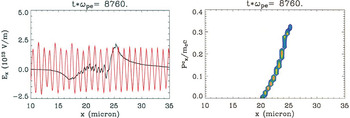
At an earlier time, the ion acceleration follows the TNSA mechanism. Hot electrons generated by the conversion of the laser on the front surface of the target propagate through the target and form a sheath on the rear target surface. After an initial transient phase, this sheath evolves to a quasi-steady-state associated with the two-temperature (cold background and laser-heated hot electron component) electron plasma, consistent with that examined previously (Passoni & Lontano, 2004; Passoni et al., 2004). Thick target foils experience an extended period of TNSA. In thin foils, the early-time sheath structure shown in Figure 1 (and found in all of the simulations at the target thicknesses considered) is arrested by enhanced TNSA and, later, the break-out afterburner (both described below). An important feature of the early TNSA phase is the presence of a dense, cold electron component within the target that provides the dominant source of return current to the laser conversion region, and which prevents significant penetration of the laser into the foil. The acceleration of ions during this phase is modest compared with that of the later stages of the acceleration. In Figure 1, the carbon ion energy during this phase is only of order MC c2(5 × 10⁻⁵) ∼ 0.6 MeV for the thin targets. Obviously, TNSA in thicker (∼10 micron) targets can produces ions of much higher peak energy than this; the advantage of using thin targets is manifest in the later stages.
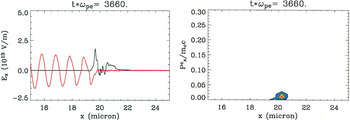
Electric field and ion momentum during the TNSA phase of the ion acceleration for a simulation in which the target is a carbon foil of thickness 30 nm and the peak laser intensity is 1021 W/cm2. The left panel shows the longitudinal (Ex) component of the electric field (black curve). The field exhibits a ponderomotive region at the front surface (the peak located at 19.5 microns) and a modest sheath field (x > 20.5 microns) at the rear target surface. This sheath provides the TNSA. The laser field (arb. units) is shown in red. In the right panel, ion momentum vs. position are shown.
2.2. Enhanced TNSA Phase
In very thin targets, when a sufficient fraction of the cold electrons is promoted to hot, the physics changes, as shown in Figure 2. We call this phase “enhanced TNSA.” In the top panel, the electrostatic field Ex is shown with the laser field Ey at tωpe = 4920, with units for each as in Figure 1. At this time, the plasma, although still overdense, has the electron skin depth comparable to the target thickness (this is shown in the figure by the penetration of the finite-amplitude transverse electric field into the target). This condition arises for two reasons: first, as the laser heats the cold electrons in the foil, an increasing number of electrons are expelled to the sheath at the rear of the target, so fewer electrons remain within the foil, and ωpe decreases within the target. Second, the electrons are heated by the laser to highly relativistic speeds, which lowers the plasma frequency by approximately a factor 〈γ〉−1/2, with 〈γ〉 the mean relativistic gamma parameter.
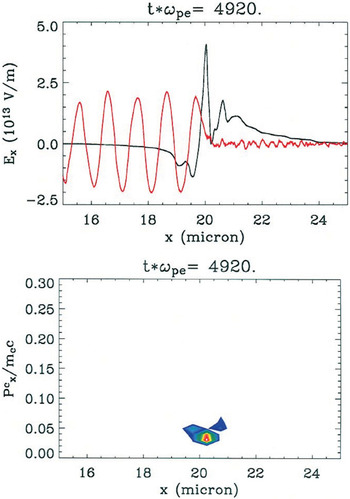
Electric field and ion momentum during the enhanced TNSA phase of the same simulation shown in Fig. 1. The skin depth within the target has become comparable in size to the target thickness. The ponderomotive force imparted by the laser field (Ey: red curve, upper panel, in arb. units) augments the sheath field on the rear target surface (Ex: black curve, upper panel) and produces a period of enhanced ion acceleration (bottom panel).
During the enhanced TNSA phase, the attenuated but finite oscillating laser field in the target imposes a ponderomotive drive to all of the electrons within the target. This modifies the profile of the longitudinal field by introducing at the rear surface, in addition to the sheath field, a spiky component in the center of the target associated with the ponderomotive drive of the laser (see the spike in the Ex field in the top panel of Fig. 2). This results in an increased conversion efficiency of the laser into hot electrons. Moreover, the entire layer of electrons within the target oscillates in the laser field, which very rapidly heats the electrons. After a brief time interval (Δt < 28 fs—the time between the two snapshots in Figs. 1 and 2), essentially no cold electrons remain: all have been promoted to highly relativistic energies by their interaction with the laser.
The electric field experienced by the ions (see the lower panel), which is a combination of space-charge separation from the sheath and ponderomotive drive from the laser, is considerably larger than experienced during the TNSA phase. Moreover, in sufficiently thin targets, the ions accelerate as a solitary bunch peaked around a well defined mean energy. This characteristic is reminiscent of the monoenergetic ions measured by Hegelich et al. (2006), but without the requirement of a complex, multi-component target. In Figure 2, the carbon ion energy during this phase is localized around MC c2(6.2 × 10⁻⁴) ∼ 7.4 MeV.
2.3. Laser Break-Out Afterburner Phase
The laser BOA process is exemplified by the conditions at tωpe = 7320 in Figure 3, where the laser field Ey and electron phase space distribution for the entire simulation domain are shown (left two panels). At this time, the hot electron plasma expands sufficiently to become underdense to the laser and the laser penetrates the target. The resulting longitudinal electric field is enhanced significantly compared with that of the earlier phases and co-moves with the ions, as shown in the black curve in the upper right panel. During this phase, the ions accelerate into a high energy, quasi-monoenergetic ion beam (bottom right panel). The ion beam shown has energy peaked about 0.022MC c2 ∼ 300 MeV and comprises ∼35% of the ions within the layer (see the inset), with a FWHM of the beam that is approximately 15% of the mean energy. At this time, 4% of the incident laser energy has been converted to the energy of the quasi-monoenergetic ion beam. If realized experimentally, the BOA could represent a substantial improvement in conversion efficiency over the TNSA-based mechanism for generating monoenergetic ions discovered by Hegelich et al. (2006).
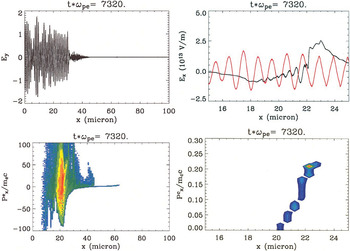
Laser field (top left) and electron phase space (bottom left) over the entire simulation domain during the break-out afterburner phase of the same simulation as shown in Fig. 1. The top-right panel is a blow-up of longitudinal (black) and transverse (red, arb. units) electric fields in the region near the ion layer. The bottom-right panel shows ion momentum vs. position.
The origin of the enhanced electric field during this stage is associated with the electron dynamics in the penetrated laser field. The laser interaction with the sheath electrons produces a highly relativistic high-temperature electron beam with mean momentum near the ion layer (at position x ≈ 22 microns) of approximately 20me c and pth/me c ∼ 50. As is well known from plasma kinetic theory, conditions of large relative drift between electrons and ions can lead to a Buneman-like instability, suitably generalized here to account for kinetic and relativistic effects. In this case, the electron beam moves with speed ∼ c compared with a relatively slow (non-relativistic) ion beam. Buneman instabilities grow extremely rapidly and act to reduce the relative drift between ions and electrons. The phase velocity of the Buneman instability is resonant with the ions and results in an acceleration and eventual heating of the ions. With the laser drive present, as the electrons lose momentum to the ions, the electrons regain their lost momentum from their interaction with the laser. In this way, the instability may be maintained for a longer period of time before saturation. In this process, the laser and co-moving electron beam efficiently couple momentum from the incident laser field to the ions. An initial study of the wave dispersion spectra obtained from the PIC simulations is consistent with this hypothesis. More detailed analysis of the plasma kinetics underlying the BOA will be provided in a forthcoming article.
To summarize, the three processes: initially, a period of pure TNSA occurs, where the dominant return current is provided by the cold electrons and the laser ponderomotive drive is localized to the front of the target. Then, enhanced TNSA ensues, where the peak laser ponderomotive drive moves into the target and the efficiency with which the laser converts to hot electrons increases; during this phase, essentially all cold electrons are promoted to hot. As the target plasma becomes underdense to the laser, and the penetration of the laser produces strong longitudinal electric fields through a Buneman-like instability which accelerates the ions into a very high energy beam. A comparison of the longitudinal electric fields from the three stages is shown in Figure 4.
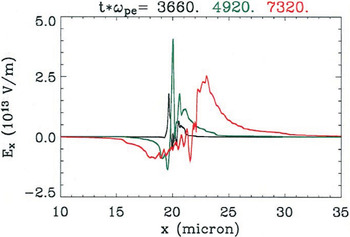
A comparison of longitudinal electric field for the three times shown in Figures 1 (black), 2 (green), and 3 (red). During the period when the break-out afterburner is operative, the longitudinal electric field is much larger than the early-time TNSA field and the peak field co-moves with the ions. This large electric field is responsible for the dramatic enhancement in ion acceleration.
2.4. Late-Time Dynamics of Laser Break-Out Afterburner
After the laser penetrates the foil and propagates through the sheath, the nonlinear interaction among the light wave and particles, as well as possibly the relaxation of the ion distribution as the result of the Buneman instability, causes the ion distribution to lose its monoenergetic character and break into a series of “beamlets” of successively decreasing energy. This behavior is shown in Figure 5. The front portion of the ion beam continues to accelerate to higher energy and the highest energy beamlet shown in the figure achieves a peak energy 0.04MC c2 ∼ 700 MeV, albeit with a low number of particles at this energy. The energy spectra, a portion of which is shown in the left panel of Figure 7, evinces this succession of peaks.
Late-time evolution of the laser break-out afterburner for the same simulation as shown in Fig. 1. As the laser penetrates the foil, the quasi-monoenergetic ion beam breaks up into a sequence of beamlets of decreasing energy. The most energetic ions continue to be accelerated to yet higher energy as this phase of the afterburner evolves. At the time shown, the most energetic ions have energy 700 MeV.
At very late time, the beamlet structure of the ion distribution evolves into a Boltzmann-like distribution of ion energies that extends to yet higher energy. In the right panel of Figure 7, carbon ions are promoted to energies of 2 GeV from the nonlinear, late-time action of the BOA. The temperature of the high energy tail of the carbon spectrum is approximately 540 MeV.
3. ION ENERGY SCALING WITH TARGET THICKNESS
The scaling of peak acceleration with target thickness for targets of size 0.5, 0.05, 0.03, and 0.01 μm has been obtained (Fig. 6). In this scaling study, the ion kinetic energy from the simulations is measured at a time when the ion beam has reached its maximum energy while remaining essentially monoenergetic. The scaling thus obtained resembles the experimental results of Fuchs et al. (2006a, 2006b) from proton acceleration data with variable Al target thickness. The maximum ion kinetic energy increases significantly with target thickness from 0.5 μm to 0.05 μm thickness; optimal ion acceleration was attained at 0.03 μm thickness, with an energy decrease as the target thickness reduces further.
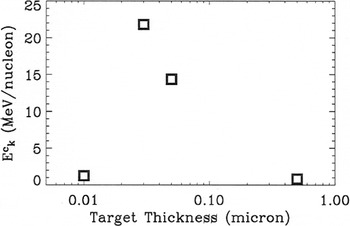
Scaling of maximum energy of monoenergetic C6+ ion beam as a function of target thickness from PIC simulations at intensity I = 1021 W/cm2. The target of thickness 30 nm yields the highest energy monoenergetic beam.
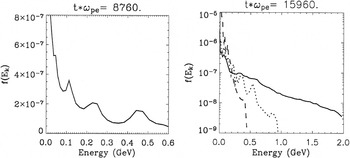
Energy spectra obtained for two times during the later stages of the break-out afterburner for intensity I = 1021 W/cm2 and target thickness 30 nm (solid curves). The leftmost panel shows the ion energy spectrum at time tωpe = 8760, when the beam has broken into a sequence of beamlets. The solid curve in the right panel shows the very late stage of the afterburner dynamics, where the beamlets are no longer present and the high-energy tail of the energy spectrum has a Boltzmann distribution with temperature TC = 540 MeV and cut-off energy of 2 GeV. The dotted curve is from the late-time evolution (tωpe = 59460) of a similar simulation, also with 30 nm target thickness, but with a laser intensity 1020 W/cm2. In the lower intensity case, the ion temperature attained is lower (TC = 190 MeV), as is the peak ion energy (∼1 GeV). The dashed curve is from a simulation using an identical laser drive as the simulation producing the solid curve, but with a target thick enough (5 microns) to admit only TNSA, this simulation exhibited a much lower beam temperature and cutoff energy.
This scaling indicates that an optimal target thickness exists for a given set of laser conditions for enhanced TNSA and BOA to manifest the highest energy, monoenergetic ion beam: If the target is too thin, the laser burns through very early and the co-moving electron population imparts little acceleration to the ions before the late-time BOA phase; the resulting ion beam is neither monoenergetic nor of especially high energy. If the target is too thick, then TNSA occurs with an ion layer of larger areal charge density. In a manner similar to TNSA with thicker targets (Hatchett et al., 2000; Hegelich et al., 2006), this leads to variation in the accelerating electric field from the front to the rear of the ion layer and a subsequent spreading of ion energies prior to the BOA phase.
4. DISCUSSION
In this article, we have analyzed PIC simulations of a new process for enhanced ion acceleration from the interaction of a petawatt-class short pulse laser with an ultrathin target. Following a brief period of TNSA, the enhanced acceleration has two phases: the first is an enhanced TNSA phase, characterized by penetration of the laser pulse into the skin-depth-thickness target, and eventual promotion of all cold electrons to hot. The second phase is a novel laser break-out afterburner which further promotes the ions to very high energy by the penetration of the laser to the rear of the target and the consequent in situ heating of the sheath electrons. In this phase, the peak longitudinal electric field moves with the ions beyond the rear of the target. In the simulations, when the target thickness is chosen optimally, the ions initially accelerate as a quasi-monoenergetic beam. This process exhibits high efficiency (4%) conversion of the incident laser energy into the quasi-monoenergetic component. At later time, the BOA evolution breaks the ion beam into a train of beamlets, which, ultimately, evolve into a Boltzmann distribution with a high-temperature tail (TC ∼ 540 MeV) and a peak carbon ion energy of 2 GeV. These energies are approximately an order of magnitude higher than have been achieved to date in experiments. Moreover, unlike alternative GeV laser-driven ion acceleration techniques (Habs et al., 2001; Esirkepov et al., 2004), these energies are attained with a much lower laser intensity—1021 W/cm2 as opposed to 1024 W/cm2 and beyond. These laser intensities have been realized experimentally.
Several applications of laser-ion accelerators, such as ion-beam-driven fast ignition inertial confinement fusion, require both high energy and monoenergetic ion distributions (Temporal et al., 2002), and would thus benefit from control of the laser pulse length, with the laser drive turned off just prior to the onset of the late-time evolution of the BOA, which ultimately destroys the ion beam quality. Other applications, such as tumor therapy, require instead high energy ions (∼3 GeV carbon ions for hadron therapy of tumors (Hartmann et al., 1999)), but substantially lower beam currents. These applications could benefit from a longer period of late-time BOA acceleration, with an energy selector that retains only ions within a desired energy window. At intermediate durations of the BOA dynamics, the ion phase space evolves to a train of quasi-monoenergetic “beamlets” of decreasing energy. These trains of beamlets could be used, possibly, in the production of an ion radiography “movie” from a single ion beam source.
This work motivates a number of follow-on studies. For instance, it would be desirable to investigate the behavior of enhanced TNSA and BOA in multi-dimensions. One has reason to believe, however, that the essential physics of enhanced TNSA and BOA will be preserved. Enhanced TNSA requires depletion of the cold electrons so that the hot electrons provide the dominant return current. In very thin targets, lateral return current would be limited by the target geometry. Moreover, with a high contrast ratio pulse, large density gradients would be likely at the front target surface, so the generation of magnetic fields at the target surface would further impede cold electron return current (Mason et al., 2005). BOA occurs when the laser breaks out of the rear target surface and propagates with the co-moving electrons. However, the dominant acceleration from BOA is over a distance of only a few microns, which is much smaller than the transverse scale of the laser. 2D simulations to explore enhanced ion acceleration from ultrathin targets are underway and will be reported in future work.
A second consideration is the effect of contaminants on the enhanced acceleration process. In vacuum chambers, hydrocarbons and water inevitably collect on the target surface and this has necessitated in prior mid- to high-Z laser-ion acceleration experiments a need to clean the target in order to remove these contaminants (Hegelich et al., 2002, 2005; Fernández et al., 2005; Flippo et al., 2006). It is conceivable for protons and other low-Z contaminants, by virtue of their larger charge-to-mass ratios, to propagate far enough from the target during the initial TNSA phase for the BOA to take place in an essentially “self-cleaned” layer. This hypothesis requires verification.
Finally, it will prove useful to examine how the enhanced acceleration physics is modified as a function of laser energy and intensity. Initial simulation studies using a finite-duration (500 fs) laser pulse with intensity 1020 W/cm2 and a target of thickness 30 nm (not necessarily the optimal thickness for these laser parameters) show that enhanced TNSA and the BOA processes indeed still occur, but with degradation of ion beam quality, lower energy in the monoenergetic beam, and a longer interval of time before the BOA operates. Interestingly, with the less intense laser drive, the late-stages of the BOA still produce GeV carbon ions, as shown in the dashed curve in Figure 7.
ACKNOWLEDGMENTS
This work was performed under the auspices of the United States Department of Energy by the University of California Los Alamos National Laboratory under contract W-7405-ENG-36. The authors are grateful to Dr. Kevin J. Bowers, architect of the VPIC simulation code, for assistance with the particle-in-cell simulations. The authors acknowledge Drs. Thomas J. T. Kwan and Kirk A. Flippo for several useful conversations. This work was supported by the LANL Laboratory Directed Research and Development (LDRD) program.


