


Urbanisation and unfavourable socioeconomic, physical and social neighbourhood characteristics could relate to depression either through, or in interaction with, psychological stressors, unhealthy lifestyles or biological stress pathways.Reference Lorenc, Clayton, Neary, Whitehead, Petticrew and Thomson1,Reference Dulin-Keita, Casazza, Fernandez, Goran and Gower2 However, which neighbourhood characteristics are most consistently associated with depression remains unclear, mainly because previous studies are heterogeneous in their measurement of neighbourhood characteristics, confounders and depression.Reference Gong, Palmer, Gallacher, Marsden and Fone3–Reference Rautio, Filatova, Lehtiniemi and Miettunen5 Several earlier studies observed higher prevalence rates of major depressive disorder or increased depressive symptoms in urban areas as compared with rural areas,Reference Peen, Schoevers, Beekman and Dekker6–Reference de Vries, ten Have, van Dorsselaer, van Wezep, Hermans and de Graaf8 although findings are inconsistent.Reference Rautio, Filatova, Lehtiniemi and Miettunen5,Reference Generaal, Timmermans, Dekkers, Smit and Penninx9,Reference de Graaf, ten Have, van Gool and van Dorsselaer10 Neighbourhood incomeReference Klijs, Kibele, Ellwardt, Zuidersma, Stolk and Wittek11 and availability of green space and waterReference de Vries, ten Have, van Dorsselaer, van Wezep, Hermans and de Graaf8 have also been associated with depression, even after adjusting for individual-level socioeconomic status (SES). For other physical neighbourhood characteristics, such as air pollution and traffic noise, associations with depression are less clear and inconclusive.Reference Zijlema, Wolf, Emeny, Ladwig, Peters and Kongsgård12,Reference Tzivian, Winkler, Dlugaj, Schikowski, Vossoughi and Fuks13 A recent systematic review in 2018 demonstrated more consistent evidence for physical neighbourhood characteristics, such as green space, air pollution and traffic noise, than for urbanisation in relation to depression.Reference Rautio, Filatova, Lehtiniemi and Miettunen5 Additionally, some studies found subjective (self-reported) measures of the social neighbourhood, such as social cohesion and safety, to be protective for depression,Reference Mair, Diez Roux and Galea14 and this association was confirmed for objectively measured neighbourhood data on safety.Reference Putrik, de Vries, Mujakovic, van Amelsvoort, Kant and Kunst15 A large disadvantage of using subjective environmental measures is that self-report bias is likely to occur in individuals with depression because of changes in perception,Reference Althubaiti16 whereas neighbourhood characteristics do not have this kind of bias as a result of using geographic information system (GIS) data. Another limitation of most previous studies on this topic is that only single neighbourhood characteristics were examined,Reference Zijlema, Klijs, Stolk and Rosmalen7,Reference de Vries, ten Have, van Dorsselaer, van Wezep, Hermans and de Graaf8,Reference Klijs, Kibele, Ellwardt, Zuidersma, Stolk and Wittek11,Reference Mair, Diez Roux and Galea14,Reference Diez Roux and Mair17 such as neighbourhood income or green space, even though neighbourhood factors are highly intercorrelated.Reference Generaal, Timmermans, Dekkers, Smit and Penninx9,Reference Judd, Jackson, Komiti, Murray, Hodgins and Fraser18
Our recent study from the Netherlands Study of Depression and Anxiety (NESDA) combined several environmental characteristics and showed that not urbanisation grade, but rather high number of social security beneficiaries, high levels of traffic noise and low social cohesion were associated with the prevalence of DSM-IV depressive disorder and with symptom severity, independently of individual-level SES.Reference Generaal, Timmermans, Dekkers, Smit and Penninx9 This is in line with another study suggesting that a variety of sociodemographic neighbourhood-level risk factors may be more important for affective disorders than urbanisation.Reference Judd, Jackson, Komiti, Murray, Hodgins and Fraser18 Large-scale multicohort studies with consistency in assessment of a wide variety of objective neighbourhood characteristics may provide a more consistent and comprehensive picture of which neighbourhood aspects are associated with the individual's depression status. The current coordinated pooled analysis including cross-sectional data of eight Dutch cohort studies (n = 32 487) examines to what extent (a) urbanisation grade; (b) socioeconomic neighbourhood characteristics: SES score, average home value, number of social security beneficiaries and percentage of residents from non-Dutch ancestry; (c) physical neighbourhood characteristics: levels of air pollution and traffic noise and availability of green space and water; and (d) social neighbourhood characteristics: social cohesion and safety scores, are associated with participant data on depression, either measured using DSM-IV psychiatric interviews or symptom severity scales.
Method
Participants
Data were derived from eight population-based or case–control cohort studies. Participants in the included studies lived across the Netherlands, and both men and women from different social strata participated. Written informed consent was obtained from all participants. Cohort data on depression, age, gender and educational level had to be present in order to be included. Cohort data were matched to GIS data of comparable years. The successful data linkage rates were high and ranged from 97% to 100%.Reference Timmermans, Lakerveld, Beulens, Boomsma, Kramer and Oosterman19 Missing GIS data or postal-code information (for example as a result of living abroad) were the main reasons for unsuccessful data linkage.
Eight cohorts participated in the analysis, mostly general population-based with a focus on mental health (Netherlands Mental Health Survey and Incidence Study-2 (NEMESIS-2)), ethnicity (Healthy Life in an Urban Setting study (HELIUS)), genetics/twins (Netherlands Twin Register (NTR)), diabetes (New Hoorn Study (HOORN)), ageing (Longitudinal Aging Study Amsterdam (LASA)), hearing (Netherlands Longitudinal Study on Hearing (NL-SH)), and pregnancy (Generations2), and one psychiatric cohort (Netherlands Study of Depression and Anxiety (NESDA)). A total of 32 487 respondents participated in the pooled analysis of diagnosis of depression, whereas a total of 26 071 individuals participated in the analysis of severity of depression. For further description of cohort studies, sample size and data linkage see supplementary Appendix 1 available at https://doi.org/10.1192/bjp.2019.100.
All procedures contributing to this work comply with the ethical standards of the relevant national and institutional committees on human experimentation and with the Helsinki Declaration of 1975, as revised in 2008. All procedures involving patients were approved by the organisational Dutch Medical Ethical Committees.
Prevalence and severity of depression
Psychiatric interviews
In NEMESIS-2 and NESDA, 12-month prevalence of depressive disorders, including major depressive disorder and dysthymia, was determined based on the semi-structured Composite International Diagnostic Interview (CIDI; WHO version 3.0 and 2.1 respectively) according to DSM-IV criteria (see supplementary Appendix 1). We excluded individuals with anxiety disorders from the control group in NESDA (n = 508; n = 1197 remaining controls) as this patient group was overrepresented by design, which may confound the neighbourhood–depression relationship.Reference Generaal, Timmermans, Dekkers, Smit and Penninx9 For reasons of consistency, in NEMESIS-2 participants from the control group with anxiety disorders were also excluded (n = 265; n = 5971 remaining controls).
Symptom scales
In the other six cohort studies, severity of depressive disorders was assessed using Dutch versions of the following validated symptom scales: the 9-item Patient Health Questionnaire (PHQ-9; range 0–27) in HELIUS, the depression subscale of the 14-item Hospital Anxiety and Depression Scale (HADS-D, range 0–21) in NTR, the 20-item Center for Epidemiologic Studies Depression Scale (CESD, range 0–60) in HOORN and LASA, the depression subscale of the 40-item Four-Dimensional Symptom Questionnaire (4DSQ, range 0–12 for depression) in NL-SH and the Beck Depression Inventory-II (BDI-II; range 0–63) in Generations2. For NESDA, the 28-item Inventory of Depressive Symptomatology (IDS; range: 0–84) was used. All symptom scales used had a 1-week recency, with the exception of the PHQ-9 and BDI-II with a 2-week recency. See supplementary Appendix 1 for references to the symptom scales.
Depressive symptom scales were analysed as dichotomous scores using the following cut-off values for moderately severe depression: PHQ-9 ≥10; CESD ≥23; HADS-D ≥8, and BDI-II ≥20, which are in line with Wahl et al. Reference Wahl, Lowe, Bjorner, Fischer, Langs and Voderholzer20 who tested conversion scores to allow comparison across different studies. The cut-off for 4DSQ (4DSQ ≥6) is in line with previous recommendations (see reference 18 in supplementary Appendix 1). Since cut-off scores for depression are frequently debated, we additionally analysed the depressive symptom scales as continuous outcome variables to check whether findings are consistent. Please note that the term depression is used to indicate a clinical diagnosis of depression (in NESDA and NEMESIS) as well as to indicate relevant levels of high depressive symptomatology (in the remaining studies).
Neighbourhood characteristics
Nationwide data on neighbourhood characteristics were retrieved from national registration organisations such as Statistics Netherlands for years ranging from 1995 to 2014, initiated by the Geoscience and Health Cohort Consortium.Reference Timmermans, Lakerveld, Beulens, Boomsma, Kramer and Oosterman19 Data on urbanisation grade, country of birth (ancestry), home value, social benefits, green/blue spaces were originally retrieved at the neighbourhood level. Data on SES, social cohesion and safety were retrieved at the four-digit postal-code level, traffic noise at the six-digit postal-code level and air pollution at the address level. For the current study, all variables, further referred to as ‘neighbourhood characteristics’, were aggregated to mean values for each postal-code area and linked to cohort data using respondents' six-digit or four-digit postal codes. See supplementary Appendix 1 for details on data linkage and references to the neighbourhood characteristics.
In the Netherlands, six-digit postal-code areas (average area size: 0.0025 km2), four-digit postal-code areas (average area size: 8.3 km2) and neighbourhoods (average area size: 3.1 km2) are geographically delineated areas within municipalities (average size: 91 km2) and include, on average, approximately 15, 1870 and 630 households, respectively (data from 2006).Reference Timmermans, Lakerveld, Beulens, Boomsma, Kramer and Oosterman19
Urbanisation grade
Urbanisation grade was operationalised as the mean number of addresses per km2 within a circle with a radius of 1 km. Data were provided by Statistics Netherlands and are defined in five categories: one, not urbanised (<500 addresses/km2); two, hardly urbanised (500–1000 addresses/km2); three, moderately urbanised (1000–1500 addresses/km2); four, strongly urbanised (1500–2500 addresses/km2); and five, extremely urbanised (≥2500 addresses/km2).
Socioeconomic neighbourhood characteristics
Neighbourhood SES scores were obtained from the Netherlands Institute of Social Research (supplementary Appendix 1). The SES score was modelled for clustered neighbourhoods, i.e. districts, using several sources of nationwide survey data on the residents' education level, income and position in the labour market. The neighbourhood SES score was based on mean income, percentage of low incomes, percentage of low-educated residents and percentage of unemployed residents in the neighbourhood as determined by a principal component analysis. SES scores were subsequently made available as averages per four-digit postal-code area.
The average home value (in k€) was provided by Statistics Netherlands. All registered residential housing properties/offices in the Netherlands were included, whereas recreational housing and other non-residential housing such as garages were excluded from calculation of the score.
The number of social security beneficiaries was also provided by Statistics Netherlands. All registered social security beneficiaries were included, and the number of beneficiaries per 1000 households in the neighbourhood was calculated. Social security benefits in the Netherlands pertain to long-term unemployment, either because of disability or the inability to (find) work. Benefits issued to residents who lived in (healthcare) institutions or to individuals older than 65 years were excluded.
The percentage of residents from non-Dutch ancestry was provided by Statistics Netherlands. This is a sociodemographic variable that was assessed as part of the socioeconomic domain as it is highly correlated with SES and social benefit receipt in the area (supplementary Table 1). Non-Dutch ancestry at the individual-level has frequently been associated with higher prevalence of depression (see reference 3 in supplementary Appendix 1). Residents were considered from non-Dutch origin if they were born outside the Netherlands with one or both parents born outside the Netherlands, or if they were born inside the Netherlands and one or both parents were born abroad.
Physical neighbourhood characteristics
Daily average noise of road, rail and air traffic were modelled by the Netherlands Environmental Assessment Agency. Noise was measured as level day–evening–night (Lden) in decibels (dB (A)) and calculated by dividing the sum of noise levels during the day (7.00–19.00 h), evening (19.00–23.00 h) and night (23.00–7.00 h) by three. Noise data were linked to all addresses that were included in the Register of Addresses and Building (June, 2015) of the Netherlands' Cadastre, Land Registry and Mapping Agency. This study uses noise data from 2007 and 2008 because these years are in line with selected cohort data.
Annual average air pollution concentration at the participants' home addresses were estimated by land-use regression models for the year 2009 by the Institute for Risk Assessment Sciences as part of the European Study of Cohorts for Air Pollution Effects (ESCAPE-project). The current study uses data of the annual average concentration of the mean blackness of PM2.5 filters, which is a proxy for elemental carbon (soot), the dominant light absorbing substance.
The percentage of green space and blue space (water) of total land use was calculated using an overlay operation in a standard GIS-package (ArcMap version 10.4) that involved land-use data and neighbourhood delineations from Statistics Netherlands. Categories of green space include recreation, such as parks and gardens, agriculture, forest or nature. Blue space includes inland water, sea and lakes. For an exact description of physical neighourhood characteristics see supplementary Appendix 1.
Social neighbourhood characteristics
Both social cohesion and safety in the neighbourhood have been measured as part of the assessment of neighbourhood liveability by the Netherlands Ministry of the Interior and Kingdom Relations. This monitoring system uses survey data among the residents to select relevant indicators of social cohesion and safety, which were retrieved from objective nationwide registry databases. The social cohesion score (range −50 to 50) is based on indicators such as number of relocations and homogeneity of family composition. The safety score (range −50 to 50) is based on indicators such as number of crimes and annoyance from drug misuse, loitering youth, neighbours, destruction, rubbish and daubing/graffiti in the neighbourhood. Higher scores reflect better social cohesion and safety.
Covariates
In line with previous studies on the association between neighbourhood characteristics and depression,Reference de Vries, ten Have, van Dorsselaer, van Wezep, Hermans and de Graaf8,Reference Generaal, Timmermans, Dekkers, Smit and Penninx9,Reference Zijlema, Wolf, Emeny, Ladwig, Peters and Kongsgård12 the following individual-level variables were included as covariates: age, gender, educational level and income. For all cohort studies, educational level was measured as a categorical variable. To harmonise this covariate, these categories were subsequently converted to a continuous score for years of education, using formulas described in supplementary Appendix 1. Income, measured in net euros per month, was assessed as household income in NEMESIS-2, NESDA, LASA and Generations2 or as income of the respondent in NL-SH. To improve data harmonisation, income was stratified into a categorical variable, namely four categories: low, medium (reference), high and unknown (see supplementary Appendix 1 for details). In HELIUS, NTR and HOORN, data on income was unavailable and therefore not included as a covariate in those cohort-specific analyses.
Statistical analyses
Participant baseline characteristics are described stratified for each cohort study as means with standard deviations, medians with interquartile range or percentages. Distributions of neighbourhood characteristics were determined based on examination of the nationwide GIS data-set including all 4766 six-digit postal code areas of the Netherlands (GIS data-set 2006 in supplementary Appendix 1).
Data were analysed separately in each cohort following a uniform protocol. Multilevel regression analyses were conducted to examine the associations of each neighbourhood characteristic with (a) the prevalence of depression, i.e. having a 12-month diagnosis according to the CIDI or being above the cut-off value for depression on the symptom scale, and (b) the severity of depression, i.e. continuous scores on the symptom scales, except for NEMESIS-2 as no continuous outcome for depression was available for this sample. To account for clustering at the area level, univariable multilevel analyses were performed for participants (level 1), nested within either municipalities (level 2 in NEMESIS-2, NTR, NESDA, LASA, NL-SH and Generations2) or neighbourhoods (level 2 in HELIUS and HOORN, because all participants were from one municipality). For all cohorts, less than 5% of depression rates were explained by adding municipality or neighbourhood as random intercepts, except for NESDA (15%; intraclass correlation 0.15), based on the models including the SES score as determinant, severity of depression as outcome and all covariates. Thus, the inconsistency in selection of second level in multivariable analyses is unlikely to influence our results.
All multilevel analyses were adjusted for age, gender, years of education and income. Multilevel regression analyses were computed with R (version 3.3.2) using the ‘lme4’ package (version 1.1–12) (see supplementary Appendix 1). Output of fixed parameter estimates were expressed as standardised odds ratios (ORs) for prevalence of depression and as standardised regression coefficients (β) for severity of depression, meaning that 1 unit corresponds to 1 s.d. difference, except for urbanisation grade (difference in 1 grade).
The pooled analysis was conducted using Comprehensive Meta-analysis software, version 3.3.070. We performed a random-effect analysis for each neighbourhood characteristic separately. Beta and OR with corresponding 95% confidence intervals were used to summarise data. Since we could not adjust for the participants' income in HELIUS, NTR and HOORN, we additionally ran the pooled analysis excluding these three cohort studies to examine whether this affected our findings. The Cochrane's χ2 (Q-statistic) and I 2 were reported as measures for heterogeneity between studies. See supplementary Appendix 1 for details on the statistical procedures.
Results
Baseline characteristics for each cohort are shown in supplementary Table 2. Overall, urbanisation level was equally represented in the eight cohorts, except for HELIUS with 98% of participants from strongly or extremely urbanised areas in the city Amsterdam, and for HOORN with 100% of participants from hardly, moderately or strongly urbanised areas in the (more rural) city Hoorn. As expected, and partly because of the design, the prevalence of individuals with depression ranges from 4% in Generations2 to 52% in NESDA. Regarding severity of depression, the average score in NESDA (IDS, 22) indicates mild depressive symptoms (see reference 24, supplementary Appendix 1), which is what can be expected in this study because of over-recruitment of patients with depression. However, the average severity scores in other cohorts (CES-D, 8; PHQ-9, 4; HADS-D, 3; and BDI-II, 2) are in line with mean population scoresReference Wahl, Lowe, Bjorner, Fischer, Langs and Voderholzer20 indicating that these samples are – in terms of depression scores – similar to the general population.
Neighbourhood characteristics and prevalence of depression
Table 1 and Fig. 1 report the results for the individual cohorts and the pooled random-effects analysis for each neighbourhood characteristic with the prevalence of depression (n = 32 487). In pooled analysis, higher urbanisation level, lower SES in the neighbourhood, higher number of social security beneficiaries, higher percentage of non-Dutch residents, higher levels of air pollution, less green space and less safety were associated with higher prevalence of depression. To be precise, pooled prevalence of depression was 1.05 (95% CI 1.01–1.10, P = 0.03) per one grade increase in urbanisation grade; 0.90 (95% CI 0.87–0.95, P<0.001) per one point increase in neighbourhood SES score; 1.12 (95% CI 1.06–1.19, P = 0.002) per 3.4% increase of households with social security beneficiaries, and 1.08 (95% CI 1.02–1.14, P = 0.01) per 12% increase in non-Dutch residents in the neighbourhood.
Associations of neighbourhood characteristics with prevalence of depression (n = 32 487), statistically significant in pooled analysis in Table 1.
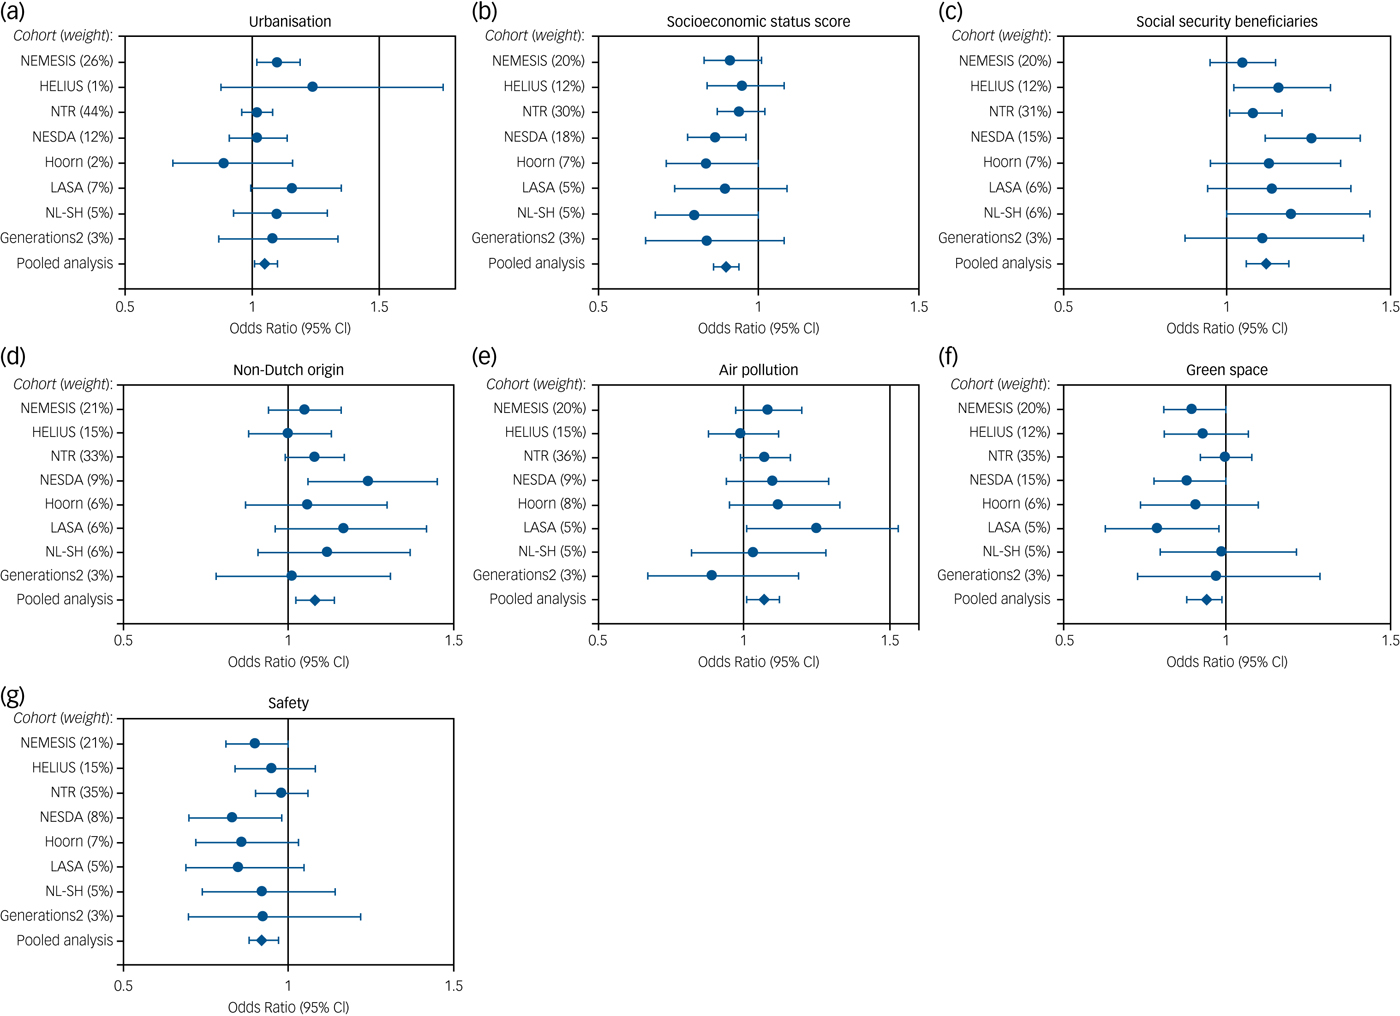
Associations between neighbourhood characteristics and prevalence of depression using dichotomous scores (total n = 32 487)
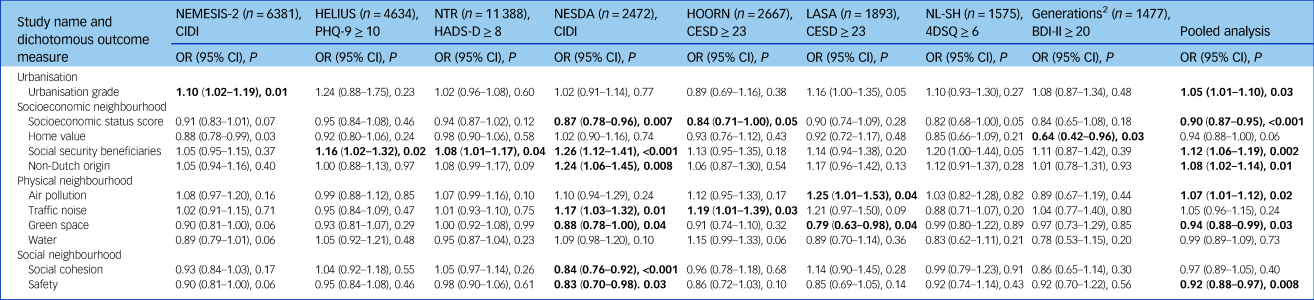
NEMESIS-2, Netherlands Mental Health Survey and Incidence Study-2; CIDI, Composite International Diagnostic Interview, HELIUS, Healthy Life in an Urban Setting study; PHQ, Patient Health Questionnaire; NTR, Netherlands Twin Register; HADS-D, Hospital Anxiety and Depression Scale – Depression; NESDA, Netherlands Study of Depression and Anxiety; HOORN, New Hoorn Study; CESD, Center for Epidemiologic Studies Depression Scale; LASA, Longitudinal Aging Study Amsterdam; NL-SH, Netherlands Longitudinal Study on Hearing; 4DSQ, Four-Dimensional Symptom Questionnaire; BDI, Beck Depression Inventory. Results in bold (P ≤ 0.05) are regarded as statistically significant. For details on the analysis, see supplementary Appendix 1.
Regarding physical characteristics, pooled prevalence of depression was 1.07 (95% CI 1.01–1.12, P = 0.02) per 0.2 10−5/m increase in PM2.5 absorbance and 0.94 (95% CI 0.88–0.99, P = 0.03) per 30% increase of green space in the neighbourhood. Regarding social characteristics, pooled prevalence of depression was 0.92 (95% CI 0.88–0.97, P = 0.008) per 26 points increase in the social safety score. These corresponding s.d. values can be retreived from supplementary Appendix 1 in the footnote Table 1.
Sensitivity analyses
Additional sensitivity analyses excluding HELIUS, NTR and HOORN from the pooled analysis (remaining n = 13 798) showed similar or even somewhat stronger associations for SES (ΔOR = −2%), social security beneficiaries (ΔOR = +3%), percentage of non-Dutch origin (ΔOR = +3%) and safety (ΔOR = −4%). Thus, our results are unlikely to be explained by the lack of adjusting for income in these studies. Our pooled analysis indicates that associations for neighbourhood factors with depression appear to be strongest for NESDA (see Fig. 1). To check whether our findings were not solely driven by NESDA, we repeated the pooled analysis excluding this cohort (remaining n = 30 015) and found similar results (range ΔOR −2% to +1%).
Heterogeneity tests
Supplementary Table 3 shows the results of the heterogeneity tests for each model of the pooled random-effects analysis. On the basis of I 2, there was little to moderate heterogeneity, with an average of 16% (range: 0–58%). The Q-statistics provided no indications of significant dispersion across studies for most neighbourhood characteristics, with the exception of water in the neighbourhood (Q = 15, d.f. = 7, P = 0.03) and social cohesion (Q = 17, d.f. = 7, P = 0.02).
The direction of the effect sizes appeared to be the same across the eight cohorts, although some cohort studies show more consistent evidence than others (see Fig. 1). For example, in NESDA (psychiatric cohort), larger and significant (P≤0.05) effect sizes were found as compared with NEMESIS-2 (general population). This could possibly be explained by differences in severity of depression or geographical coverage of respondents. The inclusion of either CIDI-based or cut-off-based depression status might also explain the mild heterogeneity between studies. On the other hand, the magnitude of effect sizes in other cohorts, for example including CESD and HADS-D, appeared to be similar (Table 1 and Fig. 1). Thus, the pooled analysis seems to obtain homogeneous results despite differences in the depression assessment methods.
Neighbourhood characteristics and severity of depression
Table 2 reports the results for the individual cohorts and the pooled random-effects analysis for each neighbourhood characteristic with continuous depression severity scores (n = 26 071). The pooled analysis consistently showed lower SES, higher number of social security beneficiaries, higher percentage of non-Dutch residents and less safety to be associated with severity of depression. In addition, lower home value in the neighbourhood was associated with severity of depression (β = −0.03, 95% CI −0.04 to −0.02, P = 0.001). No associations were found for air pollution and green space in analyses of severity of depression (β = 0.03, 95% CI 0.00 to 0.07, P = 0.07 and β = −0.03, 95% CI −0.07 to 0.01, P = 0.13).
Associations between neighbourhood factors and severity of depression using continuous scores (total n = 26 071)
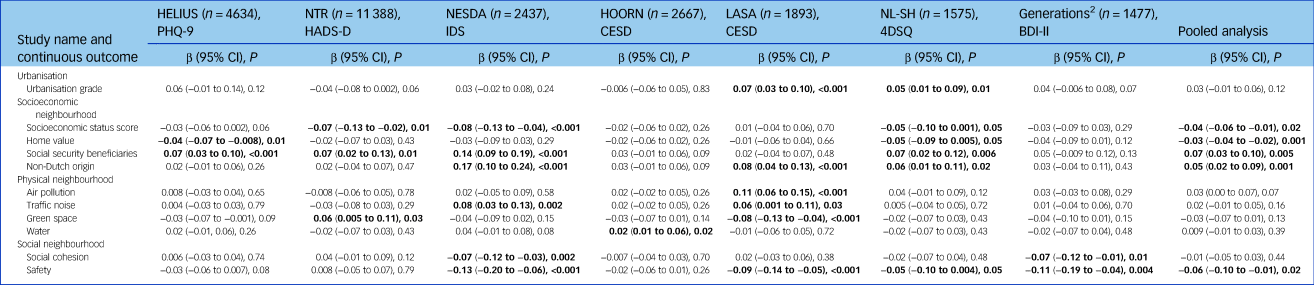
HELIUS, Healthy Life in an Urban Setting study; PHQ, Patient Health Questionnaire; NTR, Netherlands Twin Register; HADS-D, Hospital Anxiety and Depression Scale – Depression; NESDA, Netherlands Study of Depression and Anxiety; IDS, Inventory of Depressive Symptomatology; HOORN, New Hoorn Study; CESD, Center for Epidemiologic Studies Depression Scale; LASA, Longitudinal Aging Study Amsterdam; NL-SH, Netherlands Longitudinal Study on Hearing; 4DSQ, Four-Dimensional Symptom Questionnaire; BDI, Beck Depression Inventory. NEMESIS-2 was not included because no continuous outcome was available. Results in bold (P≤0.05) are regarded as statistically significant. See supplementary Appendix 1 for more details.
Discussion
Main findings
We investigated the association between a multitude of objectively measured neighbourhood characteristics and depression. The pooled analysis of eight Dutch cohort studies (n = 32 487) showed that urbanisation level and several socioeconomic, physical and social neighbourhood characteristics were associated with the prevalence and severity of depression. More specifically, higher urbanisation grade, lower neighbourhood SES, higher number of security beneficiaries, higher percentage of non-Dutch residents, higher levels of air pollution, less green space and less social safety were associated with the prevalence of depression, independent of individual-level SES. These findings were highly consistent across cohorts. In addition, homogeneous results were obtained for both depression diagnoses and symptom scales, meaning that the evidence for the relationship between these neighbourhood characteristics and depression can be considered as very strong. For depression symptomatology, associations were less consistent for urbanisation, air pollution and green space.
Our findings suggest that a wide range of environmental aspects, such as socioeconomic characteristics, urban design and social safety, are associated with the prevalence and severity of depression.
Comparison with findings from other studies
Our findings are congruent with some results from previous literature reviews.Reference Gong, Palmer, Gallacher, Marsden and Fone3,Reference Rautio, Filatova, Lehtiniemi and Miettunen5,Reference Judd, Jackson, Komiti, Murray, Hodgins and Fraser18 One earlier study suggested that sociodemographic community-based risk factors such as poverty, unemployment and poor social networks in the neighbourhood were stronger predictors of affective disorders than urbanisation alone.Reference Judd, Jackson, Komiti, Murray, Hodgins and Fraser18 The relation between urbanisation and depression has been demonstrated in several previous studies,Reference Peen, Schoevers, Beekman and Dekker6–Reference de Vries, ten Have, van Dorsselaer, van Wezep, Hermans and de Graaf8 although other studies could not confirm this.Reference Generaal, Timmermans, Dekkers, Smit and Penninx9,Reference de Graaf, ten Have, van Gool and van Dorsselaer10,Reference Judd, Jackson, Komiti, Murray, Hodgins and Fraser18 These inconsistent findings are possibly explained by different research designs and distinct measures of urbanisation, depression or confounders.Reference Rautio, Filatova, Lehtiniemi and Miettunen5 The results from our pooled analysis may be more reliable because of the larger sample size, the larger distribution of participants across the country and the use of similar neighbourhood and confounding variables for all cohort studies.
Socioeconomic characteristics
We found the most consistent evidence for the neighbourhood socioeconomic characteristics, i.e. SES, percentages of social security beneficiaries and non-Dutch origin, and for social safety, because these variables were associated with depression both as a dichotomous and continuous outcome. Low neighbourhood SES appears to be strongly correlated with a higher number of social security beneficiaries for unemployment (r = −0.74; supplementary Table 1) and a higher percentage of non-Dutch residents (r = −0.50) in the neighbourhood. The findings for low SES score and high social benefit receipt are in line with a large number of previous studies showing that socioeconomic disadvantage in the area lived in is consistently associated with depression.Reference Generaal, Timmermans, Dekkers, Smit and Penninx9,Reference Klijs, Kibele, Ellwardt, Zuidersma, Stolk and Wittek11,Reference Richardson, Westley, Gariépy, Austin and Nandi21 The finding for non-Dutch residents and depression might also be explained by the highly correlated socioeconomic neighbourhood factors, meaning that areas with a high percentage of non-Dutch inhabitants have lower neighbourhood SES scores and higher social benefit receipt. This is supported by our previous NESDA study in which the association with depression became statistically non-significant for non-Dutch residents (ΔOR = −15%) when all 11 neighbourhood variables were included in a multivariable model.Reference Generaal, Timmermans, Dekkers, Smit and Penninx9 However, there might also be other variables explaining our findings for non-Dutch origin; for example poor (perceived) neighbourhood quality or poor housing.Reference Gong, Palmer, Gallacher, Marsden and Fone3
Socioeconomic neighbourhood factors in our study were related to depression independent of individual-level SES, which underlines the relevance of examining mental health from a contextual perspective as an alternative to focusing solely on individual-level risk factors.Reference Diez Roux and Mair17 A previous meta-analysis also provided evidence for a longitudinal association between neighbourhood socioeconomic conditions and depression,Reference Richardson, Westley, Gariépy, Austin and Nandi21 although findings were inconsistent as a result of large heterogeneity in used SES measures. Although the mechanism linking neighbourhood SES with depression is rather unclear, people living in socioeconomically disadvantaged areas may experience greater exposure to stressors, such as violence, which have an impact on their mental health.Reference Lorenc, Clayton, Neary, Whitehead, Petticrew and Thomson1
Social safety
Our observed association between less social safety and depression also seems consistent with results of other studies that used either subjective perceptions of safetyReference Baum, Ziersch, Zhang and Osborne22,Reference Leslie and Cerin23 or objective measures such as crime rates,Reference Putrik, de Vries, Mujakovic, van Amelsvoort, Kant and Kunst15 or both.Reference Mair, Diez Roux and Galea14 We have now confirmed this relationship in a large Dutch sample using GIS data, independently of single-source bias. Suggested mechanisms underlying the pathways from poor neighbourhood safety to depression could be the experience of stress, annoyance from hazards such as drug use and violence, or reduced social relationships and cohesion.Reference Lorenc, Clayton, Neary, Whitehead, Petticrew and Thomson1,Reference Ruijsbroek, Droomers, Groenewegen, Hardyns and Stronks24 It may be useful to examine whether our associations are partly explained by these other neighbourhood-level characteristics. Moreover, the relationship between neighbourhoods and depression may also be bidirectional, as a person's mental health status could affect the selection of the residential location.Reference Mossakowski25 The reciprocal dynamics of the individual and his/her neighbourhood should be clarified in future longitudinal and experimental studies.
Research implications
We should acknowledge that the overall effect sizes of environmental aspects from our pooled analysis might be considered small (Cohens’ d = −0.10 to +0.11). However, despite the noise that is known to occur with large epidemiological study designs utilising crude environmental indicators, we still find consistent evidence for a relationship between various neighbourhood factors and depression. One might expect that our results become even more prominent when examining individuals during critical periods for the onset of depression, i.e. during young adulthood. So, in light of this, we feel that the neighbourhood characteristics indicated in our study may be relevant and could be further examined as potential contributors to depression.
Strengths and limitations
There are some methodological issues to be considered. First, this is a cross-sectional observational study, making it impossible to draw any conclusions regarding causal inference of the environment–depression relationship and regarding clinical implications. It would be useful to follow this study up with longitudinal studies in which neighbourhood characteristics are, for example, linked with the development or course of depression over time. Second, although the year of assessment of GIS data closely matched the year of assessment of cohort data, there may still be some neighbourhood characteristics that were measured after the assessment of depression. Ideally, GIS data are collected before diagnosing depression to account for some ‘incubation time’ in the environment–depression association. However, air pollution and traffic noise (in four out of eight cohort studies) were measured 1 or 2 years later than the measurement of depression (supplementary Appendix 1; GIS data-set 2006) and participants may have moved in this period. Nevertheless, levels of air pollution and traffic noise in the neighbourhood have previously been shown to be relatively stable over time (see supplementary Appendix 1), so it is unlikely that unsynchronised data collection influenced our findings for these variables. Third, it could be that combining environmental exposure at home with those at work, for example by the use of more sophisticated global positioning system tracking methods, may provide more exact exposure measures. Fourth, there are other characteristics that we did not assess in our study, such as the individuals' access to green or blue areas and the activity behaviour triggered by living in these environments. These should be integrated in future studies in order to study the extent to which these characteristics determine the association found between green areas and depression. Finally, the Netherlands is a very densely populated country with approximately 483 residents/km2 in 2006 (see reference 48 in supplementary Appendix 1), hence future research should test whether our results can be generalised to other countries.
Strong aspects of our study are the large sample size, the use of similar objectively measured neighbourhood characteristics and the pooled analysis with uniform analysis protocols across cohorts covering all parts of the Netherlands. The Netherlands offers a unique opportunity to investigate such relationships, as detailed GIS data and high-quality data from cohort studies are available nationwide. This large epidemiological study took an important step towards a better understanding of contextual risk factors in a person's mental health. The pooled analysis examined multiple neighbourhood characteristics, urbanisation grade and socioeconomic, physical and social factors, in relation to both the prevalence and severity of depression, while taking into account individual-level SES.
Funding
The current analysis is a collaboration of the Amsterdam UMC, locations Vrije Universiteit (VUmc) and University of Amsterdam (AMC), and the Vrije Universiteit in Amsterdam with the Netherlands Institute of Mental Health and Addiction (Trimbos Institute) in Utrecht. The study is part of the Geoscience and Health Cohort Consortium (GECCO), a collaborative project of six cohort studies of VUmc Amsterdam studying environmental determinants of health. GECCO was supported by the EMGO Institute for Health and Care Research (EMGO+) of VUmc and Vrije Universiteit in Amsterdam, the Netherlands, which covered the identification and gathering of existing environmental registry data and linkage of these data to data from the cohort studies of the consortium. Additional funding from some data analyses were obtained from the Amsterdam Public Health Research Institute. The data collection in the Netherlands Twin Register was financially supported by multiple grants from NWO and ZonMw (575-25-006, 480-04-004, 904-61-090, 904-61-193, 400-05-717, 311-60008, SPI 56-464-14192). We gratefully acknowledge grant NWO (480-15-001/674), Netherlands Twin Registry Repository: researching the interplay between genome and environment; the Biobanking and Biomolecular Resources Research Infrastructure (BBMRI-NL) (184.021.007); the European Research Council, Genetics of Mental Illness (ERC-230374) and a Royal Netherlands Academy of Science Professor Award (PAH/6635) to D.I.B. The infrastructure for the NESDA study (www.nesda.nl) is funded through the Geestkracht program of the Netherlands Organisation for Health Research and Development (ZonMw) (10-000-1002) and financial contributions by participating universities and mental healthcare organisations (Amsterdam UMC VUmc, GGZ inGeest, Leiden University Medical Center, Leiden University, GGZ Rivierduinen, University Medical Center Groningen, University of Groningen, Lentis, GGZ Friesland, GGZ Drenthe, Rob Giel Onderzoekscentrum). The New Hoorn Study was financially supported by multiple grants from the Amsterdam UMC VUmc, Novartis Pharma B.V.; the European Union and the Innovative Medicine Initiative. The Longitudinal Aging Study Amsterdam (LASA) is primarily supported by grants from the Netherlands Ministry of Health Welfare and Sports, Directorate of Long-Term Care. The data collection for the Netherlands Longitudinal Study on Hearing and analysis for this paper were financially supported by the Heinsius-Houbolt Foundation, the Netherlands and Sonova AG, Switzerland. The Generations2-study is sponsored by The Netherlands Organisation for Scientific Research (NWO); Stichting tot Steun/Pro Juventute and Fonds NutsOhra Zorgsubsidies. The HELIUS study is conducted by the Academic Medical Center (AMC) Amsterdam and the Public Health Service (GGD) of Amsterdam. Both organisations provided core support for HELIUS. The HELIUS study is also funded by the Dutch Heart Foundation; the Netherlands Organization for Health Research and Development (ZonMw); the European Union (FP-7), and the European Fund for the Integration of non-EU immigrants (EIF). NEMESIS-2 is conducted by the Netherlands Institute of Mental Health and Addiction (Trimbos Institute) in Utrecht, which receives financial support from the Ministry of Health, Welfare and Sport, with supplementary support from the Netherlands Organisation for Health Research and Development (ZonMw) and the Genetic Risk and Outcome of Psychosis (GROUP) investigators. NEMESIS-2 was financed by the Ministry of Economic Affairs of the Netherlands, project BO-11-013-007.
Acknowledgements
We would like to thank the Institute for Risk Assessment Sciences of the Utrecht University, the coordinating centre of the European Study of Cohorts for Air Pollution Effects (ESCAPE), for providing data on air pollution. Furthermore, we would like to thank the Netherlands Environmental Assessment Agency for providing data on road, rail and air traffic noise. We also would like to thank all respondents who participated in the cohort studies.
Supplementary material
Supplementary material is available online at https://doi.org/10.1192/bjp.2019.100.


 Open access
eLetters
No eLetters have been published for this article.