


Introduction
One of the most puzzling results in contemporary corruption studies is the wide variation in the ability of democracies to contain corruption (Fukuyama Reference Fukuyama2015; Keefer Reference Keefer2007; Montinola & Jackman Reference Montinola and Jackman2002; Sung Reference Sung2004; Treisman Reference Treisman2007; Bauhr & Charron Reference Bauhr and Charron2017). Theoretically, and assuming that the public prefers public over particularistic goods, introducing democratic reforms should help the demos to exercise control over its representatives, and incentivise elected officials to opt out of corruption. However, the corruption‐reducing functions of democracies seem to be much less present than theories would suggest, and many democracies are still struggling with widespread corruption and venality. While several explanations have been suggested thus far for the wide variation in the ability of democracies to contain corruption, one of the most consistent findings is that there seems to be a link between the share of females in elected office and the level of corruption (Dollar et al. Reference Dollar, Fisman and Gatti2001; Esarey & Chirillo Reference Esarey and Chirillo2013; Esarey & Schwindt‐Bayer Reference Esarey and Schwindt‐Bayer2017; Swamy et al. Reference Swamy, Knack, Lee and Azfar2001). In other words, the greater the number of females in elected assemblies, the lower the level of corruption.
Thus far, studies investigating the effect of female representatives on corruption have focused on aggregate indices of corruption rather than on its vastly different forms. However, research increasingly shows that different forms of corruption can have widely different causes and societal effects, and that distinguishing between different forms of corruption helps us to understand not only the effects of reforms, but also why these effects occur (Bauhr Reference Bauhr2017). This article distinguishes between two forms of corruption: petty corruption, defined as small‐scale transactions in public service delivery; and grand corruption, defined as collusion at the highest layers of government, involving major public sector projects, procurement and large financial benefits among public and private elites (Rose‐Ackerman Reference Rose‐Ackerman1999: 27). We suggest that women in elected office will mobilise against both forms of corruption, and consequently serve to reduce both petty and grand corruption, but for partly different reasons.
The distinction between different forms of corruption allows us to suggest a two‐level theory. On one level, related to electoral responsiveness (Pitkin Reference Pitkin1967: 209), the correlation between female elected representatives and reduced petty corruption can be explained by female politicians’ choice of policy agendas. Research on political representation typically shows that women in elected office are more likely than their male colleagues to seek to improve public service delivery, and in particular the type of services that tend to benefit women (Bolzendahl Reference Bolzendahl2009; Bratton & Ray Reference Bratton and Ray2002; Ennser‐Jedenastik Reference Ennser‐Jedenastik2017; Holman Reference Holman2013; Schwindt‐Bayer & Mishler Reference Schwindt‐Bayer and Mishler2005; Smith Reference Smith2014; Wängnerud & Sundell Reference Wängnerud and Sundell2012). Such improvements in public service delivery can decrease the need for women to engage in corrupt transactions in the first place. We label the mechanism at work on this level the ‘women's interest mechanism’ (Alexander & Ravlik Reference Alexander and Ravlik2015; Jha & Sarangi Reference Jha and Sarangi2015), and suggest that this mechanism mobilises female elected representatives primarily against petty corruption. On another level, more related to the dynamics within institutions, there is evidence to suggest that the presence of grand corruption serves as an obstacle to the political advancement of women (Bjarnegård Reference Bjarnegård2013; Goetz Reference Goetz2007; Stockemer Reference Stockemer2011; Sundström & Wängnerud Reference Sundström and Wängnerud2016). Therefore, female politicians may have strong incentives to seek to break these collusive networks that are clearly detrimental to their personal careers. We label the mechanism at work on this level ‘the exclusion mechanism’, and contend that this mechanism increases the impetus of women to mobilise against grand corruption.Footnote 1
Using data from a regional level survey of 85,000 Europeans, and new objective measures of both grand corruption risks and the share of locally elected female representatives in 182 European regions, our empirical results largely corroborate our theoretical expectations. The sub‐national focus increases our sample size by over sixfold, while the use of micro‐level data in several of our models allows us to avoid some of the potential ecological fallacies present in cross‐country research. We find strong evidence that the proportion of local female political representatives is associated with decreased levels of both grand and petty corruption. Using cross‐level interactions between female representation in local councils and gender of the respondent, we find that while both men and women experience less bribery as the share of women elected increases, it is in fact the rate of bribe paying among women that decreases most strongly – particularly in the education and health services.
We thereby make several contributions to the literature. First, studies investigating the influence of gender on corruption typically do not distinguish between different forms of corruption but tend to use aggregate measures capturing overall levels of corruption, which, we suggest, limits opportunities for theory building. Most scholars in the area focus either on corruption as an obstacle to the advancement of women (Bjarnegård Reference Bjarnegård2013; Goetz Reference Goetz2007; Stockemer Reference Stockemer2011; Sundström & Wängnerud Reference Sundström and Wängnerud2016) or the inclusion of women as a factor decreasing the level of corruption (Alexander & Ravlik Reference Alexander and Ravlik2015; Dollar et al. Reference Dollar, Fisman and Gatti2001; Jha & Sarangi Reference Jha and Sarangi2015; Swamy et al. Reference Swamy, Knack, Lee and Azfar2001). We contribute to this field of research by arguing that a greater representation of women causes decreased corruption, and that greater corruption is an obstacle to the political advancement of women. More specifically, we suggest that because corruption serves as a barrier to women's advancement, female politicians have a strong incentive to break up collusive networks.
Second, perhaps the most dominanant explanation to date about why female representation reduces corruption is related to theories suggesting that women are generally more risk‐averse and norm‐compliant (see Barnes et al. Reference Barnes, Beaulieu and Saxton2018; Esarey & Chirillo Reference Esarey and Chirillo2013; Esarey & Schwindt‐Bayer Reference Esarey and Schwindt‐Bayer2017). While this may most certainly be a plausible explanation for the beneficial effects of increasing female representation, we suggest that these theories may only provide a partial explanation to the differences that we find. While women on average may be more risk‐averse than men, elite women assuming office may deviate from this pattern. Furthermore, evidence suggests that mobilising against corruption can also be extremely risky. Therefore, we highlight an alternative and complementary explanation for the effects of women's representation on reduced corruption: that women actively mobilise against corruption in order to further particular political and personal goals. We also seek to more closely define what these different policy agendas are.
Finally, we use newly collected data that enables the examination of heterogeneous effects among citizens and sectors. Rather than using perception‐based measures, on which many scholars in this field tend to rely, we utilise more objective data: a measure of risk of corruption in high‐level procurement (grand corruption) and corruption experiences among citizens (petty corruption). We thereby seek to develop a closer and more multifaceted understanding of why and how female representation reduces corruption.
The study proceeds as follows. The next section provides an overview of the literature on women's representation and corruption. After that, a theory is developed which suggests that increases in women's representation leads to reductions in both petty and grand forms of corruption, but for largely different reasons: while the women's interest mechanism explains reductions in petty corruption, the exclusion mechanism is more likely to explain women's mobilisation against grand corruption. However, since men and women tend to use corruption to provide solutions to problems that sometimes vary dramatically in kind, we also suggest that the inclusion of women in locally elected assemblies is more likely to reduce experiences of corruption among women citizens. Following the presentation of our data, we discuss our results and provide our conclusions.
Women's representation and corruption
The first studies demonstrating a link between women's representation and national levels of corruption appeared in the late 1990s, and the correlation between higher proportions of women and lower levels of corruption is by now well‐established. Dollar et al. (Reference Dollar, Fisman and Gatti2001) demonstrated that the proportion of women in parliament has a significant effect on national levels of corruption. However, apart from general references to evidence on women's ʻhelping’ behaviour and the tendency among women to base voting decisions on social concerns (Eagly & Crowley Reference Eagly and Crowley1986; Goertzel Reference Goertzel1983), the explanations provided for the strong empirical evidence found were not very elaborate.
A follow‐up study by Swamy et al. (Reference Swamy, Knack, Lee and Azfar2001) included not only indicators on the proportion of women in national parliaments, but also on women government ministers, women as heads of firms and women in the labour force. They concluded that ʻseveral distinct datasets’ corroborate a gender difference in the tolerance of corruption. Swamy et al. suggested a number of potential reason for the differences found: that women may be brought up to be more honest or risk‐averse than men; that women, who are typically involved in raising children, may find they have to behave honestly in order to teach their children appropriate values; and that women may feel that laws exist to protect them or, more generally, that girls may be brought up to have higher levels of self‐control than boys, which is assumed to affect women's propensity to engage in criminal behaviour.
More recent studies have convincingly shown that the correlation between the proportion of women in parliament and national levels of corruption is stronger in democracies than in authoritarian states (Esarey & Chirillo Reference Esarey and Chirillo2013) and that, even within democracies, the correlation is stronger within the electoral arena than in other branches of government (Stensöta et al. Reference Stensöta, Wängnerud and Svensson2015). Contemporary research on the link between women's representation and levels of corruption tends to follow and expand on the suggestion by Swamy et al. (Reference Swamy, Knack, Lee and Azfar2001) that women reduce corruption since they are, on average, more risk‐averse than men. Esarey and Chirillo (Reference Esarey and Chirillo2013) contend that democratic institutions ʻactivate’ the relationship between gender and corruption since women are more likely to be punished for norm transgressions than men. Esarey and Schwindt‐Bayer (Reference Esarey and Schwindt‐Bayer2017) suggest that both women's risk‐aversion and voters’ propensity to hold women to higher standards than men may explain the stronger gender‐corruption link in high accountability settings (see also Barnes et al. Reference Barnes, Beaulieu and Saxton2018). Eggers et al. (Reference Eggers, Vivyan and Wagner2018) add that female voters in particular are more likely to punish female politicians for misconduct.
Thus, while studies present a wide range of potential explanations for the differences found, they have, thus far, often tended to attribute gender differences to differences in risk‐aversion, rather than the political agendas that female politicians pursue. This study is an attempt to highlight these different political agendas by disaggregating corruption into different forms, as well as investigating the heterogenous effects of female representation across different service delivery sectors.
The concept of ʻcorruption’ is one of the most complex concepts in the social sciences. Perhaps in response to this complexity, several of the most influential analyses on the causes and effects of corruption rely on some variant of the definition ʻthe abuse of entrusted power for private gain’ and use aggregate indices that focus on how much corruption there is in any particular polity, rather than on its different types (e.g., Ades & Di Tella Reference Ades and Di Tella1997; Fisman & Gatti Reference Fisman and Gatti2002; Mauro Reference Mauro1995; Pellegrini & Gerlagh Reference Pellegrini and Gerlagh2004; Tanzi Reference Tanzi1998; Treisman Reference Treisman2007). Focusing exclusively on levels of corruption, however, entails a risk of over simplistic inference, since different forms of corruption may have widely different causes and societal effects (Bauhr Reference Bauhr2017). While such an examination has been under‐represented in gender research, as well as in comparative empirical research in general, there have been several attempts to distinguish between different forms of corruption. These include distinctions based on the level in society at which corruption takes place, among low‐level public officials or at the highest level of government (petty versus grand corruption); relational distinctions (extortive versus collusive corruption); motivations for engaging in corruption (need versus greed); the perceived normality of corruption (such as white, grey or black corruption); and distinctions between different forms of favouritism (nepotism, cronyism, clientelism).Footnote 2 Studies have granted surprisingly little attention to the effect of women's representation on these different forms of corruption. In particular, we believe that doing so provides insight into the reasons why, and the mechanisms through which, the inclusion of women in elected assemblies can reduce corruption.
How the share of elected female representatives influences petty and grand corruption
Studies from a variety of different fields, ranging from criminology and risk sociology to political psychology (Bord & O'Connor Reference Bord and O'Connor1997; Flynn et al. Reference Flynn, Slovic and Mertz1994; Slovic Reference Slovic1999; Watson & McNaughton Reference Watson and McNaughton2007) support the notion that women are typically more risk‐averse than men. While most certainly a plausible explantion for gender differences, there are several limitations to the theory, including evidence suggesting that elite women may constitute a skewed sample and not least the fact that mobilising against corruption can also be extremely risky, at least in certain settings. Thus, while women on average may be more risk‐averse than men, elite women, and perhaps in particular women that attain positions of power in male‐dominated sectors, may in fact be less risk‐averse than average. For example, a large‐scale comparative study on innovation and entrepreneurship, based on responses by 5,909 senior public managers from 20 countries, did not display significant gender differences relating to risk‐taking/risk‐aversion (Lapuente & Suzuki Reference Lapuente and Suzuki2017), and studies show that while there can be robust gender differences in studies using a representative sample of women at large, elite women may have very similar perceptions regarding future risks and threats as men (Djerf‐Pierre & Wängnerud Reference Djerf‐Pierre and Wängnerud2016). In addition, evidence shows that it could, in certain settings, be very risky to mobilise against corruption since it tends to sometimes create very powerful enemies.Footnote 3 In sum, norm‐compliance and risk‐aversion may only provide a partial explanation for the gender differences observed, suggesting a need to develop theoretical propositions on other potential mechanisms at work.
In this study we suggest that the influence of women's representation on levels of corruption can be better understood by paying closer attention to research on the political agenda(s) female politicians pursue once they attain public office. In other words, women not only avoid participation in corrupt transactions, as anticipated in risk‐aversion theory, but in settings such as elected assemblies they may also actively mobilise against corruption in order to further particular political and personal goals. Based on previous studies we suggest that two of these agendas in particular may explain why female politicians mobilise against venality and promote reduction in corruption in society at large. We use the concepts ’the women's interest mechanism’ and ’the exclusion mechanism’ to explain these two agendas.
The women's interest mechanism
One of the political agendas female politicians may pursue is to support policies that improve public service delivery and, in particular, those that improve the everyday life of women, such as family policy and health policy. It is by now rather well‐established in research on political representation that female politicians prioritise issues and policies pertaining to the situation of women in society at large to a higher degree than their male collegues (see Bolzendahl Reference Bolzendahl2009; Bratton & Ray Reference Bratton and Ray2002; Ennser‐Jedenastik Reference Ennser‐Jedenastik2017; Holman Reference Holman2013; Schwindt‐Bayer & Mishler Reference Schwindt‐Bayer and Mishler2005; Smith Reference Smith2014; Wängnerud & Sundell Reference Wängnerud and Sundell2012).
Alexander and Ravlik (Reference Alexander and Ravlik2015) transfer these findings to corruption studies, label them ʻthe women's interest mechanism’ and highlight the fact that some actions by female politicians may have important spin‐off effects on corruption in society at large. They suggest that women are particularly dependent upon a ʻstate on track’, where resources are used for the public good rather than for private gain, and that women politicians therefore strive for a strict monitoring of the state, which, in the long run, may lower levels of corruption (Alexander & Ravlik Reference Alexander and Ravlik2015; see also Jha & Sarangi Reference Jha and Sarangi2015; Neudorfer Reference Neudorfer2016).
A study by Watson and Moreland (Reference Watson and Moreland2014) brings empirical evidence to this strand of research. Using a time‐series analysis and data from 140 countries between 1998 and 2011, they show that the number of female elected representatives has implications for the substantive representation of women, particularly health expenditure and pregnancy protection, and show that perceptions of corruption are lower in countries with higher levels of substantive representation of women. Thus these authors suggest that women legislators focus on issues of particular interest to women citizens, such as social spending and women's rights. The passing of laws about gender issues and protection of disadvantaged groups eventually generates positive effects on citizens’ perceptions of corruption and the quality of government at large. Moreover, a study by Brollo and Troiano (Reference Brollo and Troiano2016) used government audits at the local level in Brazil to show that the probability of observing corruption is between 29 and 35 per cent lower in municipalities with female mayors than in those with male mayors. In addition, they were able to show that female mayors did a better job of providing public goods such as prenatal care delivery.
Thus, the womens’ interest mechanism relates to ideas of electoral responsiveness (Pitkin Reference Pitkin1967: 209) and the important dynamics between elected representatives and voters/citizens. There is a rather comprehensive bulk of research underpinning the notion that female politicians push for slightly different agendas than their male counterparts in both election campaigns and between election periods. This, we suggest, may have consequences for corruption levels. However, important dynamics also take place among elected officials themselves – that is, within political institutions rather than between politicans and voters.
The exclusion mechanism
Several studies note that women are seldom part of ʻold boys’ networks’ where collusive and highly sensitive exchanges take place (Bjarnegård Reference Bjarnegård2013; Goetz Reference Goetz2007; Stockemer Reference Stockemer2011; Sundström & Wängnerud Reference Sundström and Wängnerud2016). Female politicians may therefore be more likely to perceive collusion and various forms of grand corruption as prevalent in society and their exclusion from the benefits of this type of corruption entices them to mobilise against it. In many European countries women are still under‐represented in elected assemblies – both nationally and at the sub‐national level. Moreover, research shows that, even though women get elected, it normally takes time before they reach the most powerful political positions (Bolzendahl Reference Bolzendahl2014; Galais et al. Reference Galais, Öhberg and Coller2016). This means that women tend to be excluded from the inner circles of power and that they are unable to access the privileges that come with grand corruption. Bjarnegård (Reference Bjarnegård2013) describes how homosocial capital functions as a glue that connects men in clientelist networks where corrupt transactions take place. Bjarnegård builds on an indepth study of Thailand. However, it is unlikely that women, including those in Europe, will in the near future be seen as entrusted partners on a par with men in corrupt transactions.Footnote 4 It may thus be in the (individual) interest of women politicians to break structures and networks detrimental to their careers. The assumption we are making is that the break up of old boys’ networks will, further down the road, make collusive arrangements more difficult and by implication less likely, thereby contributing towards reducing corruption risks (Bauhr & Charron Reference Bauhr and Charron2017; Fazekas et al. Reference Fazekas, Tóth and King2016).
Our first hypothesis suggests that increases in women's representation reduce both petty and grand corruption because women are disproportionately affected by a state that has derailed, and because they are excluded from the benefits of grand corruption. Thus, the women's interest mechanism and the exclusion mechanism are parallel phenomena: while the former tends to reduce petty corruption, the latter tends to reduce grand corruption.
H1: Higher proportions of women in elected assemblies are strongly negatively associated with both petty and grand forms of corruption.
Different forms of corruption, however, operate very differently and are used in efforts to seek solutions to problems that sometimes vary dramatically in kind (Bauhr Reference Bauhr2017). Despite an increasing attention to how citizens use corruption in efforts to deal with problems that they face, the varying effects of different forms of corruption have only gained limited theoretical attention and empirical traction. The distinction between need and greed corruption developed by Bauhr (Reference Bauhr2017) is useful for substantiating how the societal effects of corruption can be heterogeneous and vary among different segments of the population. In essence, individuals engage in need corruption since it is the only way to receive services or avoid abuses of power, and in greed corruption to receive special advantages. Sometimes, individuals use corruption because they see no other way to receive services such as health care or education, or to avoid being fined for made‐up offences, and corruption may even be regarded as an extra tax going straight into the pockets of public officials.Footnote 5
The United Nations Development Programme (UNDP) concludes that many of the world's poorest people are women who serve also as the primary family caregivers.Footnote 6 Studies conducted in Europe also tend to highlight that poverty is not a gender‐neutral condition as the number of poor women exceeds that of poor men, and women and men experience poverty in distinct ways (e.g., Bastos et al. Reference Bastos, Casaca, Nunes and Pereirinha2009). Even if women are more likely than men to be excluded from grand corruption, the networks and structures upholding this form of corruption exclude most men and women, and large layers of the population are unlikely to experience reductions in grand corruption first hand. Alternatively, petty corruption may hit women harder than men because they often have to give away larger proportions of their income to receive services. Therefore, reductions in petty corruption are more likely to benefit women than men, and we hypothesise that when women's representation increases, the effect is most significant among women citizens, particularly in care‐oriented sectors such as education and health where women frequently interact with public officials.
H2: Higher proportions of women in elected assemblies are more strongly associated with lower levels of petty corruption among women than men.
In sum, our theory builds on insights into the kind of agenda(s) female politicians pursue once they attain public office. Whether female politicians like it or not, they are expected by voters and women's movements to seek to improve public service delivery and particularly the type of public service delivery that tends to benefit large groups of women. This often means making existing public services not only more encompassing,Footnote 7 but also more effective, which requires monitoring and a ʻstate on track’. However, women may also have more personal motives to reduce venality and break informal institutions and tightly knit male‐dominated networks that are detrimental to their careers (see also Lovenduski Reference Lovenduski2005). Outsider status may be beneficial for women in terms of contact with voters (Kostadinova & Mikulska Reference Kostadinova and Mikulska2015), but exclusion from the inner power networks is not an asset when attempting to reach the top‐level positions (Bolzendahl Reference Bolzendahl2014; Galais et al. Reference Galais, Öhberg and Coller2016).
Data and design
We begin by examining the relationship between female representation and two types of corruption: petty and grand. To test H1, that increased female representation reduces both forms, we employ sub‐national‐level data for up to 182 regions in 20 European Union countries. The sub‐national level offers clear advantages over national‐level comparisons in that our observations increase by approximately sixfold and we avoid ʻwhole‐country bias’. Furthermore, it offers a more precise look at the relationship, essentially holding constant many country‐level cultural and institutional differences (Snyder Reference Snyder2001). The full sample of our study can be found in the Online Appendix.
The proportion of women in locally elected councils comes from data collected by Sundström (Reference Sundström2013) and serves as our main independent variable for the analyses. The percentages reflect averages per region, and these are the best data available for measuring variation in women's political empowerment at the local level across a large number of European countries. At the regional level, we capture the dependent variable ʻpetty corruption’ as the proportion of respondents who claim that they have paid a bribe for any public service during the last 12 months, from the latest European Quality of Government Survey (Charron et al. Reference Charron, Dijkstra and Lapuente2015). Among the regional sample, the data are not normally distributed as roughly 45 per cent of regions have ‘0’ or near ‘0’, while the remainder has a skewed distribution. For data such as these, the error term will not be normally distributed and variance will not be constant (e.g., heteroscedasticity). We checked residual plots from post‐regression ordinary least square (OLS) estimation, which reveal that the mean error term is not ‘0’ and that dispersion is greater at higher levels of the dependent variable. The analyses for petty corruption models at the regional level therefore report results from generalised linear model (GLM) estimation, modeling a Poisson distribution with a logged linked function, which is appropriate for non‐negative continuous dependent variables that are non‐count data (Dobson & Barnett Reference Dobson and Barnett2008).Footnote 8
To measure high‐level corruption risk at the regional level, we operationalise our dependent variable ʻgrand corruption’ as a measure of corruption risk (from Fazekas et al. Reference Fazekas, Tóth and King2016). Our indicator incorporates characteristics of the procedure that are in the hands of public officials and suggests deliberate competition restriction.Footnote 9 While not a direct measure of corruption, the data combine 11 different indicators of risk of high‐level collusion in public procurement. First, the measure incorporates the proportion of contracts with only a single bidder. In addition, the following process‐related indicators of corruption risk are included in the risk index: (1) a restricted, non‐open tendering procedure such as invitation tenders that are by default much less competitive. Using less open and transparent types of procedures can indicate the deliberate limitation of competition, hence, corruption risks (2) the use of subjective, non‐price‐related assessment criteria: different types of evaluation criteria are prone to fiddling to different degrees. Subjective, hard‐to‐quantify criteria often accompany rigged assessment procedures, as they create room for discretion and limit accountability mechanisms. If there is (3) a curtailed advertisement period whereby the interval between advertising of a tender and the submission deadline is too short to prepare an adequate bid, it can serve corrupt purposes, whereby the issuer informally gives the well‐connected company advance notice of the opportunity. Where there is (4) a quick evaluation of bids such that the time used to decide between the bids submitted is excessively short, or lengthened by legal challenge, this can also signal corruption risks. Snap decisions may reflect premeditated assessment, while legal challenge and the corresponding long decision period suggest an outright violation of laws. Each of these are large and significant predictors of single‐bidder contract awards when controlling for the sector of the contracting entity (e.g., education, health), type of contracting entity (e.g., municipality, central government), year of contract award, main product market of procured goods and services (e.g., roads, training) and contract value. The average unweighted incidence of single bids received and the four processes related to ʻred flags’ constitute a composite indicator: the Corruption Risk Index (0 ≤ CRI ≤ 1, where 0 = minimum corruption risk and 1 = maximum corruption risk).Footnote 10 Model diagnostics show that OLS regression is the proper model fit for these data.
Several potentially confounding factors are controlled for in these tests. First, the level of economic development could be a determinant of both gender equality and corruption, thus we control for a region's gross domestic product (GDP) per capita. The level of ethnic diversity could also be a confounding factor, related to both corruption and gender equality. Thus, we take the percentage of non‐EU‐born residents by region. Finally, we control for the potentially confounding effects of rural/urban divides across regions, with the population density (logged). More information on all variables is found in the Online Appendix.
Due to the nature of the data, a concern is our unit of analysis (regions in countries). The White‐Koenker test of heteroscedasticity from bivariate corruption–representation models shows signs of heteroscedasticity due to country clustering (p = 0.02), while in later models with more control variables the test shows stronger signs (p < 0.01). This issue leads to a second potential violation of OLS assumptions – that our observations might not be independent due to the regions being nested in countries. This implies that there are spatial dependencies in the data and that the slope estimates and, in particular, the standard error can be biased due to issues of group‐wise heteroscedasticity. On the basis of this and the nature of our data, we take the country context into account via regression with country‐clustered standard errors as hierarchical estimation with less than 30 second‐level units is more likely to yield questionable results (Stegmueller Reference Stegmueller2013). However, we run several alternative estimations to check the robustness of our main findings.
Indicators for the second part of our study – the examination of petty corruption among the general public – are estimated via individuals’ experiences with corruption, which are nested in regions and countries. In this case, we test whether the fixed or random (multilevel) model would be most appropriate, given our data, with a Hausman test. We find that the fixed‐effects model is the more appropriate (p < 0.0000), particularly given that we have a limited number of top‐level observations (18 countries) in the sample. Thus, in these cases, we regress direct experience with petty corruption in the public sector on a number of individual‐ and regional‐level factors while accounting for country‐level fixed effects. As the outcome variables in these models are binary – whether a respondent has had direct experience with corruption or not – we use logistic estimation for these models. More information on the survey data used and question formulation can be found in the Online Appendix.
Having rich sub‐national and individual data and novel, non‐perceptions‐based measures of corruption, as opposed to the perception‐based data typically employed in corruption studies, constitute clear strengths. One obvious drawback with the research design employed here is, however, the lack of a time component to better show how changes in women's representation affect changes in various forms of corruption. An alternative could be to employ an instrumental design, but finding a proper instrument for gender equality that is not theoretically or empirically related to corruption is rather an elusive aim, and in the end, a poor instrument could do more harm than good. Thus, as temporal data and a clear valid instrument are lacking, we elect to estimate our models via spatial analyses.
Results
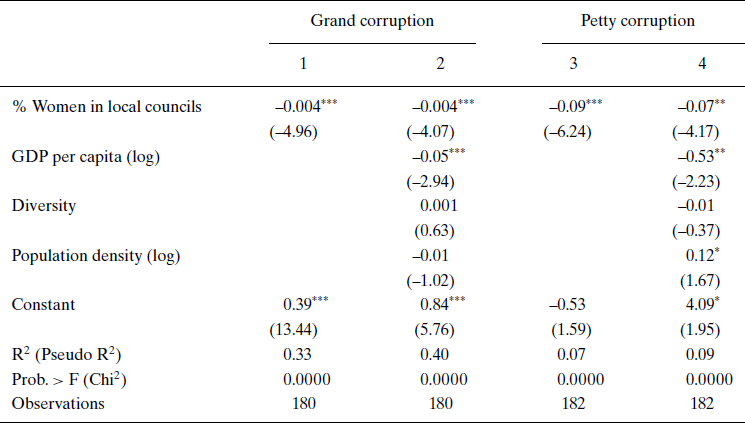
Looking at pairwise correlations, we observe the bivariate relationship between the main variables of interest – female representation and grand versus petty corruption – to be –0.57 and –0.50, respectively (see Online Appendix Table A2), and in models 1 and 3 in Table 1 we find that the bivariate relationships in the regressions are significant. Models 2 and 4 in Table 1 test whether the bivariate relationships hold, accounting for other factors. In both cases, H1 is corroborated: regions with higher levels of female representation have, on average, lower levels of both grand and petty corruption.
Female representation and grand versus petty corruption in EU regions

Notes: In models 1 and 2, t‐scores in parentheses from country‐clustered standard errors. Regions weighted by population. Models 3 and 4 report coefficients from Poisson GLM estimation with log linked function, with country clustered standard errors (z‐scores in parentheses). Pseudo R2 and Chi2 are reported fit statistics for these models. ***p < 0.01; **p < 0.05; *p < 0.10.
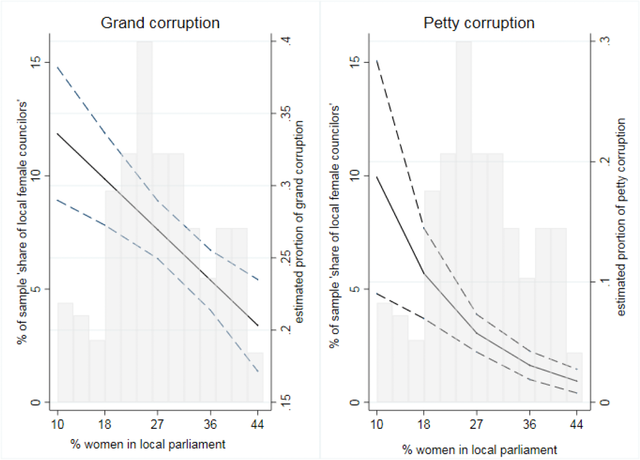
Figure 1 summarises the results from models 2 and 4, highlighting the predicted levels of corruption as a function of women in local councils, holding constant economic development, diversity and population density, with 95 per cent confidence intervals. In sum, we find that there is a clear negative relationship between female representation and both types of corruption at the sub‐national level in Europe: the higher the share of women, the lower the regional level of both petty and grand corruption. With respect to grand corruption, for example, model 2 shows that going from a low level of female representation in a region such as Campania in Italy (10 per cent) to Navarre in Spain (40.4 per cent) is associated with a decrease in grand corruption risk from 0.34 to 0.22. The model predicts a similar decrease in bribe experience, and it is also noteworthy that the data show a clear threshold relationship between these two variables: while there is considerable variation in aggregate levels of petty corruption experience when women's representation is low (between 0.1 and 43 per cent personal experience) when women's representation exceeds 30 per cent in a region, there are no regions above 8 per cent in terms of experience with petty corruption.
The association between female representation and regional‐level petty and grand corruption.
Notes: Summary of predicted effects from models 2 and 4, respectively. Y‐axis (right side) is predicted level of corruption risk (grand) and predicted proportion of regional petty corruption experience (petty). Y‐axis (left side) is the percentage of the sample with respect to the histogram representing the percentage of women in local parliaments. Dashed lines represent a 95 per cent confidence interval. [Color figure can be viewed at wileyonlinelibrary.com]

Next, we turn to the second of our hypotheses and examine corruption at the individual level as a function of female representation in local councils, controlling for a host of individual‐ and regional‐level factors, using data from the latest European Quality of Government Survey (Charron et al. Reference Charron, Dijkstra and Lapuente2015), which contains approximately 85,000 respondents. The survey's design is especially helpful here in that it samples 400 people per region (196 regions in total) in 24 European countries.Footnote 11 We utilise several questions about EU citizens’ experiences and perceptions of corruption in their local public services. Here, we are interested in how female representation is related to experiences (self‐reported petty corruption).Footnote 12 We estimate these models using country fixed effects and the same regional‐level control variables as in Table 1.Footnote 13 We also control for the level of grand corruption in a region (corruption risk measure from Table 1), which could be a confounding factor that impacts obstacles to the entry of women in politics as well as individual‐level perceptions of corruption and fairness. As per individual‐level variables, we account for gender, age, education, income, population of residence, unemployment, satisfaction with the economy and self‐placement on the left‐right political scale. Of particular interest is a possible cross‐level interaction between individual‐level gender and the level of political gender equality in a region. Each dependent variable is regressed on the full model with and without the cross‐level interaction.
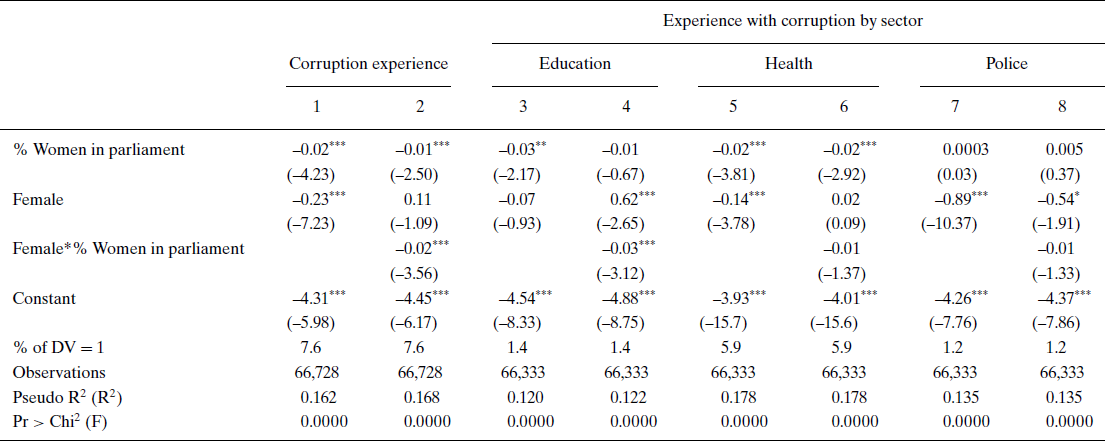
Table 2 and Figure 2 report results for our indicators on the effects of female representation on petty corruption. H2 stated that increased female representation increases the gender gap in experience of corruption: women's likelihood of bribery reduces more than men's. The findings in the table above show that where female representation is greater, experiences with corruption in local institutions are systematically lower, which is in line with our hypotheses. Moreover, the cross‐level interaction between gender at the individual level and the regional share of women in the local councils elucidates several intriguing findings.
Gendered effects of the inclusion of women in local councils: Petty corruption

Notes: Models have a binary dependent variable and are thus run with logit estimation, with log of odds coefficients reported (z statistics in parentheses). The dependent variable of each model is in the column heading. All models include individual‐level controls: age, education, income, population of residence, unemployment, economic satisfaction and self‐placement on a left‐right scale. Regional‐level controls include gross domestic product (GDP) per capita (log), population density (log), share of non‐EU‐born residents, the support for left of centre parties in the previous election, the level of grand corruption risk and country‐level fixed effects. ‘% of DV = 1’ is the percentage of each model's sample that has petty corruption experience (e.g., dependent variable = 1). ***p < 0.01; **p < 0.05; *p < 0.10.
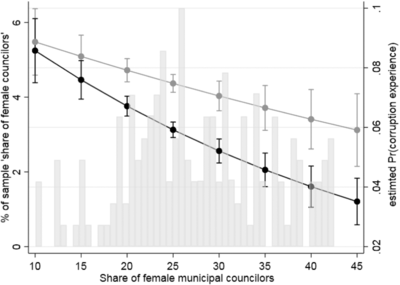
Petty corruption experience by gender and political gender equality.
Notes: Summary of results from cross‐level interaction in Table 2, model 2. The black line represents probability of experience with petty corruption for women, while the grey line represents men's experience. Grey bars show a histogram distribution of the share of women in local councils for the sample.

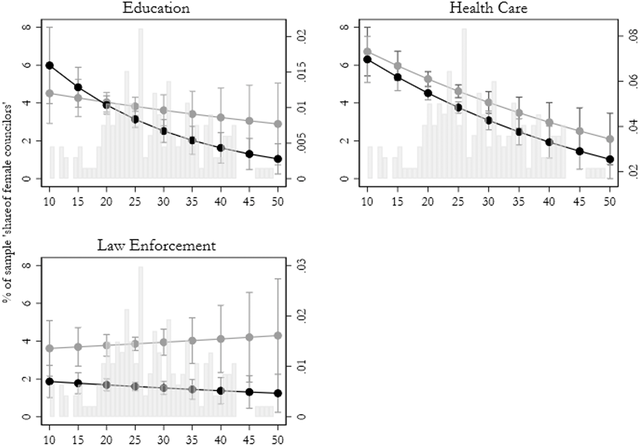
Figure 3 summarises the findings in Tables 2 for the cross‐level interactions. The findings are noteworthy. First, while we find that female representation is a negative predictor of firsthand experience with petty corruption overall, irrespective of gender, we see a clear gender gap in individual‐level experience with corruption between men and women as the proportion of women represented in local councils increases. That is to say, women citizens on average become much less likely than men to have experienced corruption firsthand in places where the number of women in local councils is higher (Figure 3). This gender gap is negligible at low levels of women's representation and becomes significant (p < 0.05) when the proportion of women in local councils exceeds 18 per cent.
Estimated probability of experience with petty corruption by sector.
Notes: Results from models 4, 6 and 8, respectively. Black lines represent estimates for women, while grey represent men. Y‐axes (right side) are the estimated probability of petty corruption in a given sector, while Y‐axes (left side) show the percentage of the sample with respect to local women councilors (shown in histogram). X‐axes are the share of women in local councils. Also, 95 per cent confidence intervals are shown. [Correction added on 4 April, 2019, after first online publication: Figure 3 has been corrected.]

The remaining models attempt to tease out if certain sectors more than others drive the results in Figure 3. Our expectation is that when women get into power, on average, they will tend to attempt to improve public service delivery in areas likely to benefit women citizens. In our data, this is best captured with public sector services such as education and health care. Law enforcement, however, is less likely to fit into this category. The results, in fact, corroborate this expectation quite strongly. Models 3–6, which test the effects of political representation of women in local councils on corruption experience in education (models 3 and 4) and health care (models 5 and 6) show just this:as the proportion of women increases, we observe that experience with petty corruption is significantly lower on average. Yet, we do not observe this pattern with respect to law enforcement. Further, with respect to the gender gap in experience of petty corruption, we find that while men are equally likely to have paid a bribe in education irrespective of gender equality in local councils, women become far less likely than men to have paid a bribe in education services when the proportion of women in local councils is high. For example, a woman is roughly 3.5 times more likely to pay a bribe in education when female representation is at its lowest compared to when it is at its highest, other things being equal. With respect to health care, where the prevalence of petty corruption is by far the greatest in our sample, we observe a substantial decrease in the likelihood of bribe paying in more gender‐equal areas for both men and women, yet the effect is slightly stronger for women. As noted, there is no effect of female representation in local councils on the probability of paying a bribe in law enforcement. Here we find that a gender gap exists: men are roughly two to three times more likely to pay a bribe to law enforcement, yet this gap is not significantly affected by local council gender equality.
Robustness
For the regional‐level analysis in Table 1, we also directly modeled the spatial dependence across units with several autoregressive models, accounting for corruption levels in neighbouring regions (Haining Reference Haining2003). Essentially, we added an extra parameter to these models, which was a distance‐weighted function of the average neighbouring corruption values.Footnote 14 Results for grand corruption were similar to those reported, while those for bribery were somewhat weaker (see Table A6 in the Online Appendix). As per the individual‐level survey data estimation (Table 2), we first tested to see whether more limited samples had an effect on the results. We took only those respondents who claimed to have had direct contact with a public sector service area in the past year so as to limit the sample to only those who had an opportunity to pay a bribe. Second, we ran all models in Table 2 using a country‐jackknife approach (Table A5 in the Online Appendix), whereby we removed one country at a time. We found no discernable effect on the overall results. In some cases, when Italy or France were removed, we observed weaker effects in some models, and when Romania or Portugal were removed, we found stronger effects – yet the overall effects were mostly the same as in Table 2.
We also re‐ran the models in Table 2 using hierarchical estimation with random country or regional intercepts in lieu of fixed effects, and the results were mostly similar for models testing the direct effects of local council gender equality, yet showed weaker results for the cross‐level interaction term. However, since the Hausman test revealed that the fixed effects approach was more suitable, this most likely explains the differences we found.
Third, we tested whether the inclusion of additional regional‐level factors confound the relationship reported. We include a proxy of health and education investment: average life expectancy and the percentage of the population aged 25–64 with less than a middle secondary education for both the regional‐level and individual‐level analyses. Higher values for life expectancy proxy higher expenditures, while a higher proportion of residents with only a middle secondary education or less indicate lower expenditures. As partisanship could also confound the relationship between the ‘women's interest mechanism’ and the proportion of women in local parliament, we proxy regional left‐wing partisanship by taking the proportion of support for all left of centre parties in the national parliamentary election (presidential election in France) prior to 2013 from the Norsk Senter for forskningsdata,Footnote 15 which although admittedly does not capture the partisanship of the individual local legislators, does give us some sense of the region's political culture. We find the main relationships hold (see Tables A3 and A4 in the Online Appendix).
Finally, we removed each of the regional‐level control variables one at a time in the model to see whether there were any differences in results. We found no such differences.
Testing the mechanism
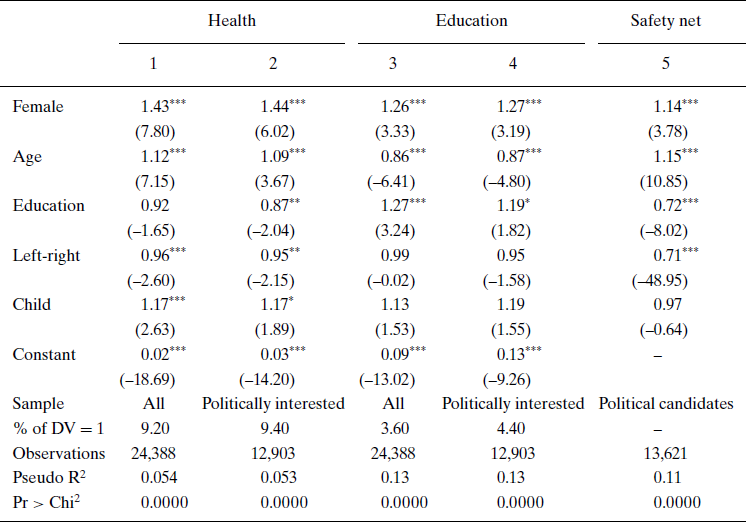
The models presented above of course do not examine the effects of our proposed mechanisms – exclusion and interest – directly. Ideally for the exclusion mechanism, we would have some comparative regional‐level proxy of the extent to which women are included in high‐level political and business positions, such as committee chairs or the proportion of board members or chief executive officers of major local firms that are women. As per interest, it would also be ideal to have information on the political platforms of all candidates who enter office so as to compare the proportion of men and women running on issues such as health or education. Unfortunately, such data are not available to us at this time. However, while proxies for networks and exclusion at the regional level in Europe should be developed and tested in future research, we can explore whether or not women prioritise health care and education issues more than men. To do this, we employ data from two different sources. First, we take the latest round of the European Elections Survey (i.e., 2014), which asks respondents in an open question what are the first and second ‘foremost issues or problems facing your country’. We code respondents who answered health care and health services for their first or second issue as ‘1’ for prioritising health care, and similarly ‘1’ if the response pertains to education matters. Of the total respondents in the survey, 9.2 per cent are coded as having prioritised health care, while 3.6 per cent prioritise education. Second, we take survey data from the first wave of the Comparative Candidate Survey (CCS 2016), which contains a host of survey questions on political attitudes and experiences of current candidates (local and national) in 24 democratic countries. In this survey, the closest question of interest to this study is ʻProviding a stable network of social security should be the prime goal of governmentʼ to which respondents answer ‘strongly agree’ to ‘strongly disagree’ on a five‐point Likert scale with a neutral middle category.
In Table 3 we report the odds ratios of female respondents for each outcome from a parsimonious logit (EES data) and ordered logit (CCS data), country fixed effects models, controlling for age, education, whether or not the respondent has a child under 15 and where they place themselves on the left‐right scale. We find that women are significantly more likely to claim health care or education as a key issue or problem in their country in models 1 and 3 – the odds of a respondent claiming health issues increase by a factor of 1.44 and 1.26, respectively, for females compared with men. While admittedly this does not show that female candidates prioritise these issues, it does show strong gender differences in health and education priorities among the population. In models 2 and 4 we attempt to get even closer to this by including only those who answered that they are ‘interested in politics’ and find even slightly stronger gender differences in these two priorities, thus demonstrating evidence of systematic gender differences in issue priorities across European countries. In model 5 we analyse gender differences of political candidates themselves with respect to government prioritising stable networks and social security for citizens. Again, we find evidence of systematic gender differences even among candidates, controlling for age, education, self‐identified political ideology, having children and country fixed effects. Females, on average, increase the odds of having a one point higher response on the five‐point scale by a factor of 1.14, ceteris paribus.
Testing the ‘interest mechanism’

Notes: Results in models 1–4 use 2014 European Elections Survey data, which includes all EU28 countries. Dependent variables are binary, logit model with odds ratios reported (z‐score in parentheses). Model 5 uses data on politicians from the Comparative Candidates Survey (CCS) from 24 Western democratic countries, with an ordered logit estimation. The four cut‐points in model 5 are –4.4, –2.6, –1.5 and 0.73, respectively. Age is a six‐category variable with ten‐year intervals, while education = 1 for those with at least 20 years of schooling. Left‐right is a five‐point self‐placement scale from far left (1) to far right (5) (1–10 in model 5). ‘Child’ = 1 if the respondent has any children 14 years and younger in their household. Models 2 and 4 include only those that claim to have voted in the last national parliamentary election ‘voters only’. All models include country fixed effects (not shown). ***p < 0.01; **p < 0.05; *p < 0.10.
Conclusion
While the evidence on the detrimental effects of corruption is steadily growing, attempts to reduce or contain corruption often fail. Disappointed by the numerous failures of anti‐corruption reforms, international organisations, scholars and policy makers increasingly place their hopes on measures aimed at enhancing gender equality and, in particular, increasing the inclusion of female representatives in elected assemblies. This study shows that the inclusion of women in locally elected assemblies is strongly negatively associated with the prevalence of both petty and grand forms of corruption. However, we suggest that women in elected office mobilise against these two forms of corruption for largely different reasons. Women who attain public office in locally elected councils seek to further two separate political agendas: the improvement of public service delivery, particularly the care‐oriented types of services that benefit traditionally female‐oriented sectors, such as education and health care; and the breakup of male‐dominated clientelist networks. While there is an overlap between these two agendas, the former is more likely to reduce the need for petty corruption among women, while the latter is more likely to obstruct more greed or grand‐oriented forms of corruption. Using newly collected regional‐level data in Europe, we find support for these claims.
This study thereby seeks to contribute to the literature in several distinct ways. First of all, it breaks new ground by pointing to the benefits that can be reaped by starting to better distinguish between different forms of corruption in order to understand why the inclusion of women in elected assemblies may curb corruption. Second, while previous research has relied on explanations such as women being more risk‐averse than men, we suggest that risk‐aversion and norm‐compliance only provide a partial explanation to the differences found, particularly since elite women may constitute a skewed sample and thus may not always be more risk‐averse than elite men, and also considering that anti‐corruption mobilisation may sometimes be very risky. We therefore build our theory on studies of female politicians’ role as representatives and the kinds of agendas they can be expected to pursue once elected. The underlying logic in the risk‐aversion theory is that an increased presence of women in positions of power will eventually ʻcrowd out’ corrupt networks and thereby reduce corruption. The theory we propose is more clearly tied to the politician's specific role as an elected representative. In Mayhew's (Reference Mayhew1974) classic work, politicians were described as ʻsingle‐minded seekers of reelection’. This perspective has been critiqued, but Manin (Reference Manin1997) points out that to be elected politicians need to stand out, and thus there is a strong impetus for politicians to push for certain policy‐oriented goals as well as for changes that improve the conditions for their personal careers. The assumption we are making is that when corruption serves as an obstacle to women in elected assemblies, they will start to look for ways to delimit it in their ambition to push for women's interests and for better career possibilities. Regardless of whether they like it or not, female politicians tend to be held accountable for improvement (or lack of it) in the lives of women citizens. The evidence for this conjecture is found in looking at how the prevalence of experience with petty corruption in the education and health sectors decreases most strongly among female respondents in areas where gender equality in local councils is greatest.
Empirically, our study offers several contributions and steps forward in better capturing the relationship between gender and corruption. When compared with many country‐level studies, our study focuses on the relationship between institutions and corruption at the sub‐national level, allowing for within country variation and increasing the ‘N’ of our primary macro level by roughly sixfold compared with the country level. Furthermore, rather than using perception measures of corruption, we rely on more objective measures, a risk indicator of elite collusion within high‐level procurement contracts, and citizens’ experiences with petty corruption in the public sector, which we argue are more valid indicators of the concept in question here, and less prone to ‘feedback loops’ as compared to measures built via expert surveys. In addition, we use sectoral data on corruption experiences and are therefore better able to tease out what specific policy areas are most affected by this dynamic – namely education and health care.
While our study shows that distinguishing between different forms of corruption can genereate important insights into understanding the effects of increasing female representation, future research is needed to better understand the important temporal dynamics of this relationship as well as the more specific mechanisms linking representation to reduced petty and grand corruption. Our study is a call for taking the explanations for and mechanisms through which female representation decreases corruption seriously. If risk‐aversion theory, or explanations relating to the norm compliance of women, are the most prominent explanation for why female representation reduce corruption, increasing female representation may lead to reductions in corruption levels in the long term. If, on the other hand, reduction can at least partly be attributed to women simply being new and less‐networked actors in politics, breaking up old male‐dominated collusive networks may have more temporal or short‐term effects. At least we see the risk that women in turn create their own collusive and potentially corrupt networks. Furthermore, organisations and policy makers pushing for anti‐corruption reforms should take into account that need corruption will most likely prevail if there is no other way for citizens to solve the problems they face. Women, who in most contemporary societies still serve as the primary family caregiver, will benefit from policies that not only reduce opportunities for corruption (i.e., various forms of legal sanctions), but also from those reforms that reduce the need for engaging in it in the first place.
Acknowledgments
The authors would like to thank participants at the research seminar, Department of Government and Public Administration, Chinese University of Hong Kong, 29 August 2017; participants at the U4 annual seminar 2017; participants at the American Political Science Association Meeting, San Francisco, 2017; participants at the Anxieties of Democracy Program Workshop: The Performance of Democracies, 21–23 May 2017; the Blavatnik School of Government, University of Oxford, the Quality of Government Institute and two anonymous reviewers for helpful comments on earlier versions of the manuscript. We would also like to thank Elin Bjarnegård and Jane Mansbridge for helpful comments.
Online Appendix
Additional supporting information may be found online in the Online Appendix at the end of the article.




 Open access

