


Introduction
“The temptation to encourage false expectations among the electorate becomes overwhelming to politicians. The opposition parties are bound to promise to do better and the government party must join in the auction ‐ explaining away the past and outbidding its rivals for the future, whether by general hints or detailed promises”.
Samuel Brittan (Reference Brittan1975, p. 140)The Irish general election of 1977 represents a notorious example of what is sometimes called ‘auction politics’: that is, attempts by political parties to win votes during an election campaign through promises of economic largesse. Fianna Fáil, the main opposition party, had decided (in the words of one of their representatives) that the election would be about ‘putting up the best goodies and seeing who would vote for them’.Footnote 1 The party produced a manifesto that contained commitments for unprecedented increases in public spending. As the Irish Times expressed it, ‘never has so much been given to so many by so few’ (quoted in Farrell, Reference Farrell1978, p. 25). The outgoing government parties, Fine Gael and Labour, responded by attacking the credibility of the Fianna Fáil programme. Acting ‘as if victory were certain’, they produced a joint manifesto that was much more cautious, focusing on the continuation of existing policies rather than new initiatives (Farrell, Reference Farrell1978, p. 25; Farrell & Manning, Reference Farrell, Manning and Penniman1978, p. 138). However, as the campaign progressed and their earlier confidence began to waver, Fine Gael and Labour began to make additional and more ambitious spending commitments themselves (Farrell, Reference Farrell1978, p. 28; Farrell & Manning, Reference Farrell, Manning and Penniman1978, p. 140).
This phenomenon is not confined to the past: in contemporary politics, parties are often accused of trying to ‘buy’ elections with expansionary election promises.Footnote 2 In this article, I focus on the political circumstances that incentivise parties to compete through promises of economic largesse.Footnote 3 Of course, there are strong ideological patterns to parties’ spending commitments, with left‐wing parties associated with greater public spending than right‐wing parties (e.g., Benoit & Laver, Reference Benoit and Laver2006, p. 133), and economic circumstances also influence what parties promise. But the Irish example highlights two election‐specific political factors that I argue are likely to influence spending promises independent of ideological position or economic context.
Firstly, at the time of the 1977 election, party competition in Ireland was not ideologically driven and the two main parties (Fianna Fáil and Fine Gael) were virtually indistinguishable from one another in left‐right terms (Gallagher, Reference Gallagher1981, p. 279; Mair, Reference Mair1986, p. 463). It seems plausible that the lack of ideological competition made it more likely that these parties would compete over how much they could offer to voters. Secondly, Fianna Fáil entered the 1977 election as the clear underdog, primarily because the incumbent Fine Gael‐led coalition had implemented extensive constituency boundary revisions that were designed to shore up its own majority (Farrell & Manning, Reference Farrell, Manning and Penniman1978, p. 133). I argue that parties that expect to play a significant role in the government that forms after the election (such as Fine Gael in 1977) are likely to make pledges with one eye on the subsequent election, when voters will evaluate their performance both in terms of pledge fulfilment and responsible management of the economy. In contrast, if a party does not expect to be in government after an election (such as Fianna Fáil in 1977), it is more likely to use pledges to maximise its vote share in the present election, paying less attention to the feasibility of its commitments. These two arguments are developed in this article, based on a model of voter utility which assumes that (other things equal) voters will tend to prefer the party that they think will deliver greater economic largesse, but will also punish parties who over‐promise and under‐deliver.
While it is often noted that there is a political bias towards higher spending (e.g., Buchanan & Wagner, Reference Buchanan and Wagner1978, p. 5; Nordhaus, Reference Nordhaus1975), previous research has primarily focused on how this affects government expenditure. However, it is also important to understand the political determinants of election promises. If a party wins an election having made expansionary election promises for strategic rather than ideological or economic reasons, then it will face a choice of either breaking its election promises or implementing economically unsound policies. Both of these outcomes are associated with a loss of trust in politics (e.g. Kroknes et al., Reference Kroknes, Jakobsen and Grønning2015; Matthieß, Reference Matthieß2022; Torcal, Reference Torcal2014). Again, the example from the 1977 Irish election is instructive. Against expectations, Fianna Fáil won that election in a landslide, but the party struggled to fulfil its overly ambitious election promises (fulfilling only 44% of its pledges; Thomson & Costello, Reference Thomson and Costello2016, 192). What policies the party did implement resulted in a huge increase in the national debt, a cut in Ireland's credit rating, and contributed to the deep economic recession that the country experienced throughout most of the 1980s (O'Donnell, Reference O'Donnell1998; O'Malley, Reference O'Malley, Penniman and Farrell1987).
The article is structured as follows. The next section discusses previous research on how political competition shapes fiscal policy. I then develop the theoretical expectations about when parties are more or less likely to put forward expansionary election programmes to win votes. The research design section develops and validates a measure of spending promises using the MARPOR manifesto dataset and explains the measurement of the independent variables. The hypotheses are tested using data from election manifestos in developed democracies over the post‐war period. As discussed in the conclusion, the findings have implications for several distinct strands of literature, including debates about the consequences of party polarisation, research on the fulfilment of election pledges and work on the political determinants of government expenditure.
Relationship to previous research
Standard accounts of the representative process assume that the prospect of electoral sanctions in future elections is sufficient to incentivise good behaviour in parties (Manin, Reference Manin1997, p. 177). As Harrington (Reference Harrington1993, p. 71) puts it, ‘it is part of the political science folklore that future reelection considerations can induce politicians to put forth campaign promises that they intend to keep’. For example, Downs (Reference Downs1957) argues that voters would choose a reliable party with less appealing policies over an unreliable party with more attractive policy offerings. Thus, for Downs, integrity and reliability are more important traits for a vote‐seeking party than policy attractiveness, and ‘all parties are forced by competition to be relatively honest and responsible’ (Downs Reference Downs1957, p. 113).
On the other hand, it is well known that parties sometimes promise more than they can deliver or believe to be economically prudent. Tufte (Reference Tufte1978, p. 148), in his landmark analysis of the relationship between politics and economics, quotes an economic advisor to the US government as saying that there is ‘a great temptation [for politicians] to embrace programs that in the short run might be popular even if they are inimical to the longer‐run economic vitality of the country’. Samuel Brittan, quoted at the beginning of this article, believed that the ‘generation of excessive expectations’ by politicians was one of the great threats to democracy (Brittan, Reference Brittan1975, p. 129). For Ray (Reference Ray2007, p. 17), the purpose of election manifestos varies between parties and contexts, but at least in some cases manifestos serve as a form of advertising, containing ‘a proliferation of vague or unrealistic promises’. It has also been observed that over‐promising generally takes the form of more expansionary fiscal policies (Cameron, Reference Cameron1978, p. 1246).
However, there has been limited empirical research on how political context shapes the spending commitments contained in party manifestos. Stokes (Reference Stokes2001, p. 15) identifies some examples of Latin American governments campaigning on policies that entail high government spending but switching to fiscally conservative policies when in office. More recently, Jacques (Reference Jacques2022) examines how a party's prospects of entering government shape the extent to which it proposes long‐term as opposed to short‐term investments. He argues that a party is more likely to commit to long‐term investments (in areas such as infrastructure) if it is very confident of winning office, and to prioritise short‐term investments which deliver greater electoral dividends (e.g., education spending) if electoral success is less certain.
The most significant body of work that links parties’ fiscal policies with electioneering has focused on the policies implemented by government parties, rather than the policies contained in election manifestos. Beginning with Nordhaus (Reference Nordhaus1975), the literature on the political business cycle (PBC) has examined the tendency of parties in government to manipulate economic instruments (such as taxes and transfers) or economic outcomes (such as unemployment) in the run‐up to an election in order create an illusion of prosperity and thereby maximise their vote (see Dubois, Reference Dubois2016 and Franzese, Reference Franzese2002 for reviews of this extensive body of work). Critics of the PBC theory argue that rational voters would anticipate this behaviour by government parties and thus negate the effect (McCallum, Reference McCallum1978, p. 505). However, this objection is addressed by a number of authors who explain the failure of voters to prevent the PBC from taking place with reference to temporary information asymmetries between voters and the government (Cukierman & Meltzer, Reference Cukierman and Meltzer1986; Rogoff & Sibert, Reference Rogoff and Sibert1988).
More recent research has considered how the political context (such as the clarity of responsibility, electoral competitiveness or ideological polarisation) can shape government spending and the PBC. Firstly, voters find it more difficult to assign credit for policy successes and blame for policy failures when power is dispersed (Powell & Whitten, Reference Powell and Whitten1993), and this reduces the incentives for parties in coalition governments to manipulate the economy in the run‐up to an election. The empirical evidence supports this argument, as PBC's are associated more with majoritarian than proportional systems (see Franzese, Reference Franzese2002, pp. 407‐408). Secondly, incumbent governments that are facing competitive elections will be more likely to focus on vote‐maximising policies compared to governments that are confident of re‐election (Hobolt & Klemmensen, Reference Hobolt and Klemmensen2008). Such vote‐maximising policies can include spending increases or focusing on short‐term rather than long‐term investments (Abou‐Chadi & Immergut, Reference Abou‐Chadi and Immergut2019; Jacobs, Reference Jacobs2016, p. 445). Thirdly, greater ideological polarisation may reduce the extent to which voters are responsive to economic incentives (such as increased spending), thus limiting the extent to which governments engage in pre‐electoral spending (Franzese, Reference Franzese2013, p.12; Melki & Pickering, Reference Melki and Pickering2022).
In contrast to previous studies on election promises, but mirroring the focus on much of the PBC literature on overall spending levels, this study examines the degree of expansionism in party manifestos. This is measured in terms of a party's relative focus on spending increases versus spending cuts. Some of the arguments from the literature on government spending can be applied to manifesto commitments. For instance, if ideological polarisation reduces the extent to which governments are incentivised to spend to win votes, the same logic implies that parties will be less likely to try to out‐bid one another in their election promises under conditions of polarisation. However, other arguments from the PBC literature do not translate to manifesto commitments. For one thing, all parties can potentially benefit from promising more to voters; these benefits are not (as in the case of government spending) moderated by the clarity of responsibility. In contrast, not all parties will face electoral sanctions for making irresponsible spending promises, only those parties that go on to hold significant levels of government responsibility after the election. In the following section, the incentives for parties to promise increased spending are considered in detail, leading to hypotheses regarding the political determinants of expansionist election manifestos.
When are parties likely to make expansionary election promises?
Model and assumptions
In this section, I consider the incentives for parties to make expansionary election promises; in the following sections I use these arguments to identify the political conditions under which expansionary promises are more or less likely to be made. Regarding party motivations, I assume that parties aim to maximise their vote share in the present and subsequent elections and make decisions regarding manifesto spending commitments with these goals in mind.Footnote 4
To understand how the level of promised spending is likely to impact on a party's vote share in the short‐ and long‐term, I begin with a simple model of voter utility. In line with much of the literature, I assume that voters are influenced in their decision by a mixture of policy and non‐policy factors (e.g., Adams et al., Reference Adams, Merrill and Grofman2005; Ansolabehere & Snyder, Reference Ansolabehere and Snyder2000; Green, Reference Green2007). Non‐policy factors can include party identification, assessments of party competence, etc. Policy factors are usually characterised in terms of a proximity model, whereby voters prefer parties that are closer to them in the policy space. Accordingly, voter i’s evaluation (U) of party a can be described as follows:
 $$\begin{equation}{{\mathrm{U}}_{ia}} = - {({p_i} - {p_a})^2} + {t_{ia}}\end{equation}$$
Where p i is the ideological location of voter i; pa is the ideological location of party a; and tia is the non‐policy component of voter i’s evaluation of party a (e.g., competence or partisanship).
This model does not capture the idea that voters compare parties based on how much they offer, so must be modified to incorporate this possibility. To this end, I make two further assumptions. First, I assume that voters generally prefer more spending to less. This implies that competition between parties on economic largesse is not like ideological competition, because voters do not differ in their preferences. Second, I assume that voters are unable to prospectively judge whether a party's spending promises are realistic or not; however, voters can form an assessment of an outgoing government party's credibility based on a retrospective evaluation of its record of pledge fulfilment. These two assumptions can be accommodated by an additional component in the model, representing the interaction between a party's promised largesse (la) and the voter's assessment of the party's credibility (cia):
 $$\begin{equation}{U_{ia}} = - {({p_i} - {p_a})^2} + {t_{ia}} + {c_{ia}}({l_a})\end{equation}$$
Credibility here is taken to mean the probability that the party will seek to implement its policies (0≤c≤1). If a voter evaluates two parties equally in terms of the non‐policy component (t) and has the same ideological distance to both parties, then she will prefer the party that she believes will deliver more economic largesse, which is a function of how much the party promises (l) and how much trust the voter has in the party to honour those commitments (c).
How realistic are the assumptions underpinning equation 2? The assumption that voters generally prefer more spending to less is supported by cross‐national survey research which finds strong support across different social classes for high levels of government spending (e.g. Bremer & Bürgisser, Reference Bremer and Bürgisser2023; Busemeyer & Garritzmann, Reference Busemeyer and Garritzmann2017; Elkjær, Reference Elkjær2020). This is particularly the case when the trade‐offs involved (such as higher taxes or debt) are not made explicit (Neimanns et al., Reference Neimanns, Busemeyer and Garritzmann2018). The assumption is also consistent with the well‐known ‘fiscal illusion’ that is said to characterise public perceptions on matters of fiscal policy more generally, whereby voters ignore or do not care about the fiscal consequences of government spending (e.g., Buchanan, Reference Buchanan1967; Winter & Mouritzen, Reference Winter and Mouritzen2001). Sears and Citrin (Reference Sears and Citrin1985, p. 260) put it bluntly: ‘(t)he desire to get something for nothing is well entrenched among a substantial portion of the citizenry in all segments of society’.
While this view is challenged by evidence that suggests voters will, under some circumstances, support parties who aim to reduce government debt (e.g., Alesina et al., Reference Alesina, Perotti, Tavares, Obstfeld and Eichengreen1998), recent research based on survey experiments has found that most voters do not support reducing government debt if it means spending cuts or tax increases and will punish parties who pursue such policies (Bremer & Bürgisser, Reference Bremer and Bürgisser2023; Hübscher et al., Reference Hübscher, Sattler and Wagner2021). There is also strong evidence that support for government parties declines if they implement spending cuts (Bojar et al., Reference Bojar, Bremer, Kriesi and Wang2022; Jacques & Haffert, Reference Jacques and Haffert2021; Talving, Reference Talving2018).
Relatedly, there is evidence to suggest that parties are likely to believe they can win more support by promising more than their competitors. For instance, Woon and Kanthak (Reference Woon and Kanthak2019) provide experimental evidence that election candidates will exaggerate as a rational response to their belief that other candidates will do likewise. Similarly, the experiments carried out by Corazzini et al. (Reference Corazzini, Kube, Maréchal and Nicolo2014) find that electoral competition leads candidates to promise more to voters, and that voters are more likely to select candidates who promise more.
Turning to the second assumption, it seems relatively unproblematic to say that voters are unable to judge how realistic parties’ spending promises are. For example, if a party promises to reduce class sizes in schools by a particular amount, or increase welfare supports, how are voters to know whether or not it is feasible?Footnote 5 The assumption that voters can retrospectively assess government parties’ record of pledge fulfilment is perhaps less self‐evident. However, this is supported by research which shows that voters are generally able to tell which election pledges have been fulfilled and which have been broken by outgoing government parties (Naurin & Oscarsson, Reference Naurin and Oscarsson2017; Thomson, Reference Thomson2011). This is not as surprising as it might first appear, as government parties’ pledge fulfilment records are often a focal point in election campaigns (see Costello et al., Reference Costello, O'Neill, Thomson, Gallagher and Marsh2016 for an example), and opposition parties are often focused on ‘blame generating’ tactics that seek to highlight government failings (Weaver, Reference Weaver1986).Footnote 6
If these assumptions are accepted and equation 2 is a reasonable description of voters’ party evaluations, then a number of conclusions follow regarding the circumstances under which parties are more or less likely to make expansionary election promises.
Ideological competition
The first implication of the model described above is that the extent to which parties are ideologically differentiated will shape the relative importance of non‐policy evaluations and economic largesse in the voting calculus. If parties are not ideologically distinctive, then voters must make their choice based on other factors, including how much the parties are offering. In contrast, if parties have clear and distinct ideological profiles, then this will tend to dominate the voting decision: voters will be reluctant to vote for a party that they are opposed to on ideological grounds, regardless of how much they are offering. From the perspective of political parties, what this implies is that when ideological competition is muted for whatever reason (e.g., if parties lack a clear ideological identity, or if parties have converged), parties will be more likely to compete with one another based on how much they can offer.
Similar arguments have often been made with regards to the non‐policy component of the voting decision. For example, Downs (Reference Downs1957, p. 136) argued that when parties are ideologically indistinct, voters are encouraged to decide based on assessments of a candidate's personality or party loyalty. Green (Reference Green2007) finds that in the UK case, competition based on competence (i.e., valence competition) has tended to be higher when the parties have been less ideologically polarised. For similar reasons, it has also been argued (as discussed above) that ideological polarisation reduces the tendency for governments to spend more before an election.
This argument regarding the degree of ideological competition can be applied at the level of the party system and at the level of the individual party. At the party system level, it implies that parties will be less likely to compete through economic largesse when the party system is ideologically polarised. At the level of the individual party, the implication is that parties that lack a clear ideological position (e.g. catch‐all parties, like Fianna Fáil in the Irish example at the beginning of the article) will be more likely to compete through spending commitments. I therefore test the following hypotheses:
H1a: The greater the ideological polarisation in a party system, the less expansionist party manifestos will tend to be.
H1b: The more ideologically indistinct a party is, the more expansionist its manifesto will tend to be.
Expected level of government responsibility
The second implication of the voter utility model in equation 2 is that the potential costs of making expansionary promises varies between parties. While the benefits to a party of making expansionary promises occur in the present election, the costs of making them (and the benefits of not making them) are counted in the subsequent election. The value of c (credibility) in equation 2 will be shaped by the degree of largesse in the party's previous manifesto (the greater the largesse, the more difficult to implement), and the party's level of responsibility in the outgoing government. Voters can only undertake retrospective evaluations of pledge fulfilment in relation to parties that have participated in government, and in proportion to the party's role in that government (Fisher & Hobolt, Reference Fisher and Hobolt2010; Powell & Whitten, Reference Powell and Whitten1993).
To see how past largesse and past government responsibility can interact, consider first a party that had full control of the outgoing government and had over‐promised in the last election. Given the party's poor track‐record of pledge fulfilment, we can assume that the average voter's assessment of the probability that the party will seek to implement the promises it makes in the current election will be low (i.e., $\bar $c<0.5). If the same party had not over‐promised in the previous election and had a positive track‐record of pledge fulfilment, voters would on average have a positive assessment of the credibility of its new election promises ( $\bar $c>0.5). If the party had instead occupied a smaller role in the outgoing government (as a junior member of a coalition), its credibility would still be shaped by its record of pledge fulfilment, but to a lesser extent, because voters would have less confidence in assigning credit or blame to the party for government policy. Finally, if the party had been in opposition, then voters would have no information about the party's credibility, regardless of what it promised in the previous election. We can assume that voters on average would assess the credibility of an opposition party as being above a governing party with a negative track‐record of pledge fulfilment and below a governing party with a positive track record (i.e., $\bar $c≈0.5).
Accordingly, a party that expects a higher level of government responsibility will also expect higher costs at the next election for producing an overly expansionary manifesto, and higher benefits for issuing a more achievable set of promises. The party's expected level of government responsibility should therefore affect its incentives to make expansionary promises. Below, I operationalise a party's expected level of government responsibility in terms of its expected seat share relative to the seat shares of its competitors. This applies both in contexts where single‐party governments are the norm and where coalitions tend to form. In the context of a coalition, it is reasonable to assume that parties with smaller expected seat shares will expect lower levels of government responsibility. Empirically, there is a very close relationship between the size of a coalition party and the number of ministerial portfolios it receives, which also holds true when portfolios are weighted by salience (Browne & Franklin, Reference Browne and Franklin1973; Warwick & Druckman, Reference Warwick and Druckman2006).
It should be noted that the logic behind this argument does not imply that a party can over‐promise freely when it does not expect to have any government responsibility following the election. We have already seen how more expansionary promises will tend to increase a party's vote share, and therefore its likelihood of being in government. Overly expansionary promises are therefore never entirely risk‐free. However, there are many other determinants of party support, as described in equation 2. Parties can vary greatly in their base support level coming into an election, and therefore vary greatly in their expected level of government responsibility. A party with a high base level of support that produces an expansionary manifesto might increase its expected level of government responsibility from high to very high, while a party that issues an expansionary manifesto from a low base level of support might increase its expectations of government responsibility from low to medium. The anticipated costs of expansionary promises therefore vary depending on the party's base level of support at the time of issuing the manifesto. These considerations suggest the following hypothesis:
H2a: The more government responsibility a party expects to have after an election, the less expansionist its manifesto will tend to be.
While it is of course to be expected that left‐wing parties (such as socialist and social democratic parties) will tend to be more expansionary than economically right‐wing parties (such as conservative, Christian democratic and liberal parties), it might also be the case that the effect of government expectations on spending commitments (H2a) will be greater for parties on the left. There are a number of reasons for this. Firstly, while research suggests that voters generally prefer more spending to less, this is particularly true of voters for left‐wing parties (Bremer & Bürgisser, Reference Bremer and Bürgisser2023, p. 250). Therefore, the electoral incentive for a left‐wing party with low government expectations to make spending promises will be greater than for a right‐wing party in the same situation. Secondly, as Budge (Reference Budge1994) demonstrates, parties face pressures for ideological consistency which limits the extent to which they can alter policies from one election to the next. Promises of increased spending could entail reputational costs for parties that are traditionally associated with fiscal prudence. Thirdly, economically right‐wing parties may be ideologically opposed to economic expansionism, which could prevent them making spending commitments even if it was electorally advantageous.Footnote 7 The final hypothesis is therefore as follows:
H2b: The effect of expected government responsibility on expansionism will be greater for left‐wing parties.
Research design
Dependent variable: expansionism
The dependent variable for this study is the level of spending commitments (expansionism) in party manifestos. Ideally, this would be measured by totting up the net cost of every policy proposal in each manifesto. This would be a huge undertaking. Such a measure does exist in the Netherlands, where the Bureau for Economic Policy Analysis (CPB, www.cpb.nl), an independent government agency, has, since the 1980s, subjected party manifestos to detailed analyses to assess their overall fiscal implications and likely economic consequences. Such detailed assessments are not available in other countries, but the CPB measure is used to evaluate the more widely available measure developed here.Footnote 8
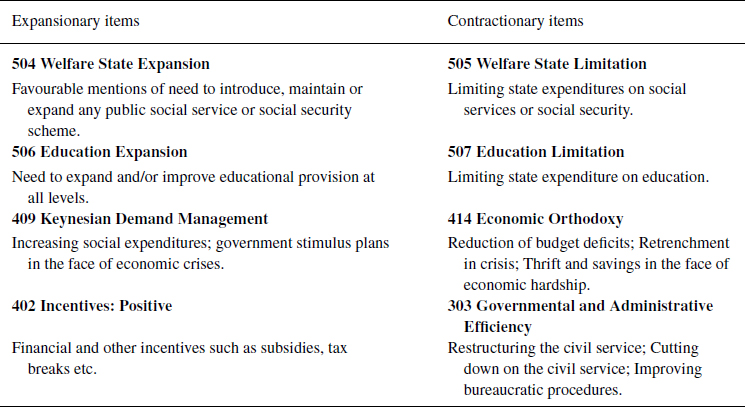
The approach taken by the present study is to use the Manifesto Project Database (MARPOR) to measure the relative emphasis on spending increases versus spending cuts in election manifestos.Footnote 9 The MARPOR data (Lehmann et al., Reference Lehmann, Franzmann, Burst, Regel, Riethmüller, Volkens, Weßels and Zehnter2023) is the largest and most widely used dataset on party manifestos. It is based on manual coding of election manifestos from political parties across countries and over time. Each quasi‐sentence in a manifesto is assigned to one of 56 categories in order to estimate the relative emphasis that the party places on different issues or policy positions. To construct a measure of fiscal expansionism, I use eight of these categories: four relating to spending increases and four relating to spending cuts. The eight items are listed in Table 1.Footnote 10 Adopting the approach of Lowe et al. (Reference Lowe, Benoit, Mikhaylov and Laver2011), a logit scale is constructed from these items as follows:
 $$\begin{equation}{\mathrm{Expansionism}} = \log \frac{{E + .5}}{{C + .5}}\end{equation}$$
where E is the number of expansionary sentences and C is the number of contractionary sentences in a given manifesto.Footnote 11 The scale takes on positive values when there are more expansionary than contractionary sentences, and negative values when there are more contractionary than expansionary sentences. The variable is normally distributed around a mean of 1.05, with a standard deviation of 1.3. This means that, according to this measure, manifestos on average include more expansionary than contractionary statements.
MARPOR items used to construct the expansionism scale.

Source: MARPOR codebook. Note: only the most relevant passages from the item description are included. Numbers refer to the MARPOR category.
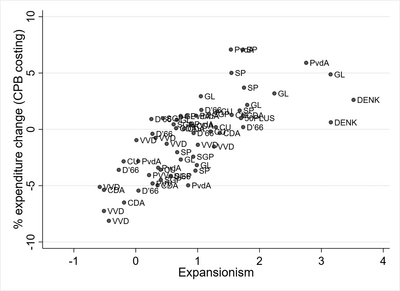
The manifesto costings carried out by the Dutch CPB are used as a benchmark to validate this measure of expansionism. The CPB data employed covers seven Dutch elections between 1994 and 2021, and a total of 63 party manifestos.Footnote 12 For each manifesto, I use the CPB costings to calculate the net change in government expenditure (as a percentage of total government expenditure in the election year) that would occur if the manifesto was implemented. Figure 1 presents a scatterplot of the relationship between this CPB‐based measure of manifesto spending and the measure of expansionism based on MARPOR data described in Table 1. Overall, there is a very strong positive correlation between the two measures (r = 0.74). Party manifestos that are costed as producing a reduction in overall government expenditure tend to have scores below 1 on the expansionism measure, while manifestos that are costed as producing significant increases in government expenditure are generally associated with expansionism scores of above 2. This strong correlation provides confidence in the validity of the MARPOR‐based measure of expansionism used in this study. The supplementary material provides a number of additional validations, showing that the average level of promised spending as measured with the MARPOR data varies in expected ways with economic conditions, and also shows over‐time patterns that reflect the main historical trends of fiscal expansion and retrenchment among western democracies.
Relationship between ‘Expansionism’ and costed expenditure change in party manifestos in the Netherlands.
Note: each observation is a party in a particular election. R = 0.74.

Ideological polarisation and distinctiveness
Testing the first hypothesis (H1a) requires a measure of the degree of ideological polarisation in a party system at a given election. I again rely on MARPOR data for this, in order to maximise the number of observations. I use the ‘logrile’ measure of a party's left‐right positioning, as proposed by Lowe et al. (Reference Lowe, Benoit, Mikhaylov and Laver2011), who in turn build on the measure developed by Laver and Budge (Reference Laver, Budge, Laver and Budge1992). The left‐right scale derived from this dataset incorporates differences between parties across a wide selection of issues, including law and order, defence, rights, market regulation, welfare and morality.
To capture the level of party system polarisation on this dimension, I calculate the sum of the weighted average distance between parties (where weights are seat shares) and, following Dalton (Reference Dalton2008), I reduce the impact of outliers by taking the square root of this measure. The resulting variable ‘Polarisation’ has an observed range in the data of between 0 and 7, with a standard deviation of 1. It should be stressed that the relationship between ideological polarisation, measured in this way, and the degree of expansionism as described above, is not endogenous. Polarisation captures the dissimilarity in party manifestos (along a pre‐defined dimension). If all parties pursue expansionary policies, this will tend to decrease ideological polarisation as measured here; but the same is true if all parties pursue contractionary policies or fiscally balanced policies.
To measure the ideological (in)distinctiveness of each party (H1b), I draw on the 2019 Chapel Hill Expert Survey (CHES) on party positions (Jolly et al., Reference Jolly, Bakker, Hooghe, Marks, Polk, Rovny, Steenbergen and Vachudova2022). This survey included a question on how ‘blurry’ each party's position was on the economic left‐right dimension on a scale from 0 (not at all blurred) to 10 (extremely blurred). This measure is only available for EU member states at one point in time, so the analysis using this variable is carried out on a smaller set of cases.
Expected level of government responsibility
Hypothesis 2a relates to parties’ government expectations at the time they finalise their manifestos. Specifically, it is concerned with the level responsibility a party expects to have after the election (rather than simply whether or not they expect to be in government).Footnote 13 While it is not possible to directly measure parties’ expectations about how much government responsibility they will have, it can be approximated based on parties’ electoral position at the beginning of the campaign. I construct a variable (‘Lead’) which captures each party's expected seat share compared to its largest rival.
The approach I adopt for this involves three steps. First, I use opinion poll data compiled by Jennings and Wleizen (Reference Jennings and Wlezien2018) to measure party popularity at the start of the election campaign. The number of weeks prior to an election that parties publish their manifestos can vary by party and election, but previous research from several different countries suggests that they are typically published between 3 and 8 weeks prior to the election date, but it can be as little as one week before the election (e.g., Dolezal et al., Reference Dolezal, Ennser‐Jedenastick, Müller and Winkler2012, p. 882; Naurin, Reference Naurin, Narin, Royed and Thomson2019, p. 179; Suiter & Farrell, Reference Suiter, Farrell, Gallagher and Marsh2011, p. 31). Lacking specific publication dates for the manifestos included in the MARPOR dataset, I estimate parties’ pre‐campaign popularity using the average level of support from opinion polls taken between 10 and 3 weeks prior to election day.
Second, I use this to estimate each party's expected seat share in the election (measured as a proportion). I model expected seat shares as a function of a party's seat share in the previous election and the change in the party's popularity since the previous election.Footnote 14 This estimate is very highly correlated with the actual seat shares that parties went on to win (r = 0.94). The third step is to simply take the difference in the expected seat share between each party and its largest rival. The party with the largest expected seat share in a given election has a positive value on this measure, while other parties have negative values. The variable ‘Lead’ has a mean of −0.14 and a standard deviation of 0.21.
This measure takes account of the fact that the relationship between seat shares and government prospects is not the same in all contexts. For example, a party that expects 25 per cent of the seats in a fragmented system where its biggest rival is expected to win 20 per cent of the seats, is likely to expect a significant level of government responsibility. In this case, the variable ‘Lead’ would have a value of 0.05 (i.e., 0.25–0.20). In contrast, if a party expects to win 25 per cent of the seats in an election where a competitor is expected to win 50 per cent of the seats, the party will have very limited expectations of government responsibility. The variable ‘Lead’ would have a value of −0.25 for this party.
Control variables
Apart from strategic considerations related to electoral competition, there are two other obvious determinants of a party's spending promises: ideology and economic circumstances. The control variables included in the analysis are designed to remove these ideological and economic sources of variation in expansionism.
Turning first to ideology, left‐wing parties are characterised by a strong commitment to public investment and government support, while right‐wing parties prefer to rely more on the free market and are associated with smaller government (e.g., Blais et al., Reference Blais, Blake and Dion1993, p. 43). In order to separate out expansionism from left‐right ideology it is necessary to control for the latter. What is needed is a measure of party ideology that does not depend on a party's spending commitments in a given election year – thus ruling out the standard left‐right measures derived from the manifesto data (such as the ‘logrile’ variable described above).
I use two measures to capture party ideology. First, I include a simple dichotomous measure to distinguish parties that are from traditionally left‐wing party families from other parties. I use the MARPOR categorisations of party families for this, and code the following three categories as left‐wing: ‘ecological parties’; ‘social democratic parties’; and ‘socialist or other left parties’. Second, I construct a modified version of the ‘logrile’ variable, which excludes items used in the measurement of the dependent variable (as listed in Table 1). The new variable (‘logrile modified’) uses 21 out of the 26 MARPOR categories used in the original measure. It has an observed range in the data from −6.8 to 7.3, with higher values meaning a more right‐wing position.
Regarding the economic determinants of expansionism, I firstly control for annual GDP growth in the election year. Economic growth enhances government revenue and the capacity of the government to spend. According to Wagner's law of expanding state activity, economic growth also leads to greater demands from citizens for public services (Cameron, Reference Cameron1978). This implies a positive relationship between economic growth and fiscal expansionism in party manifestos. Other economic variables that shape the resources available to parties in government and might be expected to influence parties’ spending commitments include the government's budget balance in the election year and the size of the national debt (e.g., Mulas‐Granados, Reference Mulas‐Granados2003). I measure these economic indicators using data from the IMF.Footnote 15
A baseline model reported in the online Supporting Information models party expansionism solely as a function of a party's previous expansionism plus economic conditions. The results show that expansionism tends to increase with economic growth and with the size of the budget surplus (as expected), but is not affected by national debt. The main analyses below therefore do not control for national debt (although the results are the same when this variable is included).
Dummy variables for each 5‐year time period (the typical duration of an election cycle) are included to control for changes in spending preferences over time, while country fixed effects are included to minimise the risk of omitted variable bias. I also control for the incumbency status of the party, as incumbent parties’ spending commitments may be constrained by their past actions in government.
A lot of research has examined how electoral systems moderate the responsiveness of parties to voters (e.g., Soroka & Wleizen, Reference Soroka and Wlezien2015), and this may be relevant to the level of expansionism in parties’ manifestos. However, the likely direction of this effect is not obvious. On one hand, parties in majoritarian systems will on average have a greater likelihood of forming a single‐party government than parties in a proportional system, which might induce them to be more cautious in what they promise. On the other hand, parties in proportional systems will on average have a greater likelihood of participating in government in some form than parties in majoritarian systems, which could lead to greater caution. In the analysis below, I include a dichotomous variable (using the electoral systems categorisations provided by V‐Dem (Coppedge et al., Reference Coppedge, Gerring, Knutsen, Lindberg, Teorell, Altman, Bernhard, Cornell, Fish, Gastaldi, Gjerløw, Glynn, Good God, Grahn, Hicken, Kinzelbach, Krusell, Marquardt and McMann2023)) to distinguish majoritarian electoral systems from other systems, without formulating any clear expectations about the likely direction of this effect.Footnote 16
Finally, there are arguments for and against the inclusion of a lagged dependent variable in the analysis. On one hand, a party's spending commitments may be partly dependent on its spending commitments in its last manifesto. On the other hand, controlling for past spending commitments (which themselves are expected to be influenced by electoral prospects at the last election) is likely to bias downwards the effect of expected government responsibility (see Achen, Reference Achen2000). I therefore run models with and without a lagged dependent variable.
As the dependent variable is the ratio of spending increase statements to spending decrease statements, it is not necessary to control for the length of the manifesto. Additional analyses (not reported) find that the inclusion of this variable does not affect the results.
Case selection
Case selection is largely determined by the availability of data on the variables described above. For the main analyses (Table 2 below), data on the relevant variables are available for a total of 20 democracies over the period 1945–2017. The time‐period reflects the overlap in the MARPOR data and the opinion poll data from Jennings and Wleizen. The criterion for selecting countries was simply that they have multiple elections covered by these datasets. The 20 countries are as follows: Australia, Austria, Belgium, Canada, Denmark, Germany, Greece, Iceland, Ireland, Italy, Japan, the Netherlands, New Zealand, Norway, Portugal, Slovakia, Spain, Sweden, the United Kingdom and the United States. In total, there are 761 observations (party‐elections) available for analysis. The supplementary material lists the election years included for each country.
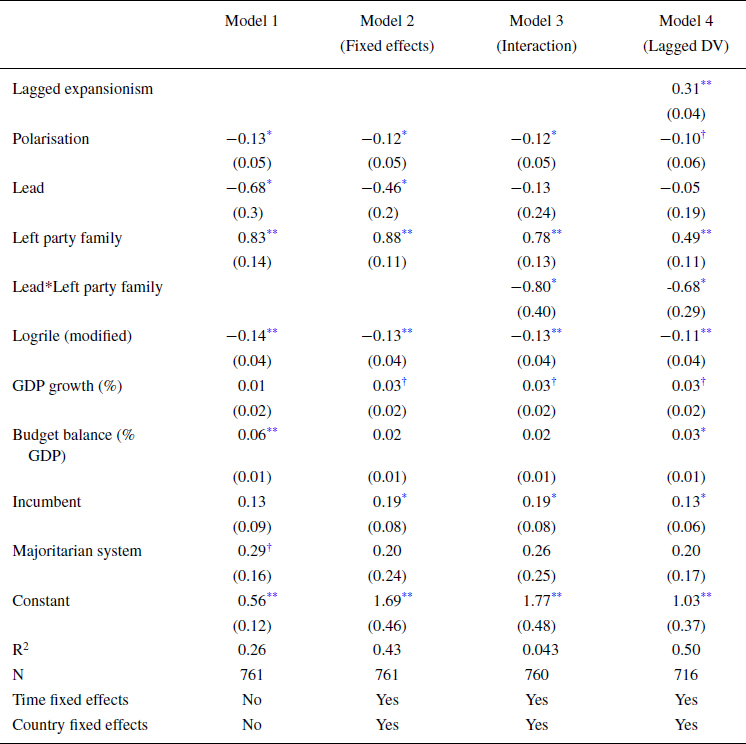
Factors affecting expansionism in party manifestos.

Note: †p < 0.1 *p < 0.05; **p < 0.01. Robust standard errors adjusted for 138 party clusters.
As mentioned above, the hypothesis on ideological indistinctiveness (H1b) relies on data from the 2019 CHES survey, so is carried out using a smaller set of cases. A total of 134 parties from EU member states, with one observation per‐party, are included in this analysis. Each observation relates to the election closest to 2019 (the year the survey on position blurring was carried out).
Results
Main analysis
Table 2 presents the results of the regression analyses, where each observation is a party in a given election, and the dependent variable is ‘Expansionism’. The models are estimated using OLS with robust standard errors clustered at the party level. Model 1 includes the main independent variables (‘Polarisation’ and ‘Lead’) along with the controls for party left‐right position, party family (left or not left), incumbency, economic conditions, and electoral system. Model 2 adds fixed effects for country and time period (measured in 5‐year intervals). Model 3 adds the interaction between ‘Left party family’ and ‘Lead’, to test H2b, and Model 4 adds a lagged dependent variable.
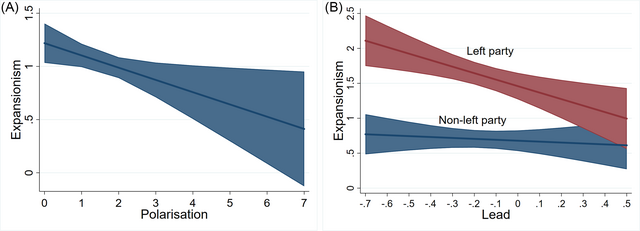
The coefficient for the variable ‘Polarisation’ is negative and significant in the four modelsFootnote 17. This effect is plotted in Figure 2 (Panel A) over the observed range of polarisation, using the estimates from Model 3. The graph gives the predicted level of ‘Expansionism’ for a given level of polarisation. It shows that an increase of polarisation from the minimum to the maximum observed level in the data is associated with a decrease in ‘Expansionism’ from 1.3 to 0.37, which is approximately one standard deviation in this variable. These results imply that there is a tendency for parties to put forward more expansionary manifestos when ideological polarisation is low, in line with H1a.
Predicted level of expansionism across the observed range of ‘Polarisation’ and ‘Lead’
Note: estimated using the coefficients from Table 2 Model 3.

Turning to H2a, the variable ‘Lead’ is also negative and significant (Models 1 and 2), indicating that on average parties that expect a larger seat share relative to their competitors have less expansionary manifestos. However, when this variable is interacted with party family (Models 3 and 4), we see that this relationship does not hold for all parties. In line with H2b, the effect of ‘Lead’ is significantly larger for parties from traditionally left‐wing party families. For other parties, the effect of ‘Lead’ is not significant. The relationship between these variables is plotted in Figure 2 (Panel B). It shows that traditionally left‐wing parties whose government prospects are poor (i.e., they have negative values on the variable ‘Lead’), are significantly more expansionist than other parties who are in a similar electoral position. As left‐wing parties’ electoral position strengthens, their expansionism declines sharply. An increase in a left‐wing party's value on the variable ‘Lead’ from the minimum to maximum observed level is associated with a drop in ‘Expansionism’ of just under one standard deviation. Interestingly, left‐wing parties with the strongest government prospects (i.e. high values on ‘Lead’) are not significantly more expansionist than non‐left‐wing parties.
Turning to the control variables, there is a strong negative correlation between the modified measure of parties’ left‐right position (‘logrile modified’) and expansionism, indicating that the further to the right a party is on other (non‐spending) issues, the less expansionist it tends to be. Perhaps surprisingly, incumbency has a significant positive effect on expansionism in some models, indicating outgoing incumbent parties are more expansionist than non‐incumbents. However, in models that do not control for a party's government prospects, this effect disappears (see Supporting Information). The electoral system does not have a significant effect. The economic variables do not have consistently significant effects, but as mentioned above, the baseline economic model reported in the Supporting Information finds a significant positive effect for both growth and budget balance.
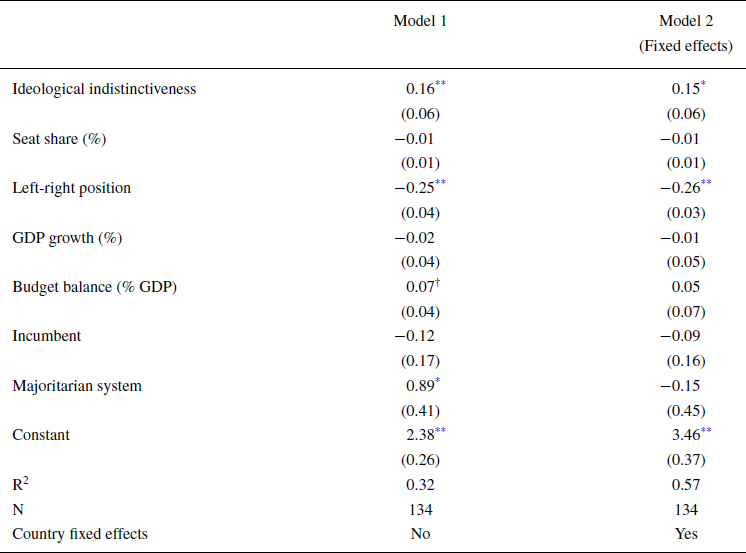
Ideological indistinctiveness
The final set of analyses relate to H1b, which requires a measure of how ideologically distinct or indistinct each party is. As discussed, there is one observation per party in this analysis, relating to the election closest to 2019, so fixed effects for time or a lagged dependent variable are not relevant here. I include a control for party size, as the size of a party may affect an expert's evaluation of its ideological clarity.Footnote 18 To control for ideology, I include the CHES measure of parties’ general left‐right positions (although the results are the same if the controls from Table 2 are used instead). The remaining variables are the same as in Table 2.
The results of this analysis (Table 3) confirm that ideologically indistinct parties are on average more expansionist than parties that have a clear left‐right location. This tallies with the previous results that show that expansionism tends to be lower when parties are ideologically polarised. The coefficient for ideological indistinctiveness in Model 1 indicates that an increase in this variable from the minimum (0) to maximum (10) level is associated with an increase in ‘Expansionism’ of 1.7 on average. This is quite a large effect, given the distribution of the dependent variable. Model 2 shows that the coefficient remains significant when country fixed effects are used.
Effect of ideological indistinctiveness on expansionism

Note: *p < 0.05; **p < 0.01.
Robustness checks
A number of additional analyses were conducted to assess the robustness of the findings reported in Tables 2 and 3. These results are shown in the Supporting Information (see Tables S3 and S4), but I summarise them here. First, the analysis in Table 2 was repeated on a larger set of cases, which is possible when the variable ‘Lead’ (which relies on opinion poll data) is excluded. The effect of polarisation is very similar to that reported in Table 2 when using this larger sample, and is statistically significant under all model specifications.
Second, I re‐run the analysis in Table 2 using an alternative measure of polarisation, based on CHES estimates of parties’ left‐right positions rather than the left‐right position derived from MARPOR. Using CHES rather than MARPOR to measure party polarisation results in a reduced sample size covering a much shorter time‐period, because the CHES data only extends back to 1999. In this estimation, the effect of polarisation is not significant (see Table S4). It would appear that the difference between this result and the result in Table 2 is at least partly due to the differences in the time‐periods covered, because the MARPOR‐based measure of polarisation is also found to be insignificant when applied to this shorter timeframe. This null finding means that the results with regards to H1a are inconclusive, and further research is needed.
Third, I re‐run the analysis in Table 3 using an alternative measure of ideological indistinctiveness, again drawing on CHES. Following Rovny (Reference Rovny2013), I take the standard deviation in expert's assessments of parties’ left‐right positions as a proxy for indistinctiveness. While the direct measure of ideological blurring used in Table 3 is only available for the 2019 wave of CHES, the standard deviation in experts’ assessments is available for five waves (2002‐2019). As reported in Table S4 in the Supplementary Material, parties for which there is greater uncertainty in expert's placement on the left‐right dimension are associated with significantly higher levels of expansionism, in line with H1b.
Conclusion
The tendency for parties to try and win votes by promises of economic largesse has potentially negative consequences for the economy and for trust in politics, as the example from Ireland in the introduction highlights. This study has sought to identify the political circumstances that shape parties’ incentives to make expansionary election promises. The results show that the level of expansionism in election manifestos varies in predictable ways depending on political circumstances. Firstly, parties tend to make more expansionary election promises when they are ideologically indistinct. There was also some support for the related hypothesis that parties will be more expansionary when party‐system ideological polarisation is low, but this finding was not consistent across all analyses. Secondly, for left‐wing parties, lower expectations of government responsibility (specifically, lower expected seat shares compared to other parties) are associated with more expansionary manifestos. This is because a party that expects to be in government faces potentially significant costs for over‐promising, while a party that does not expect a substantial level of government responsibility can tell voters what they want to hear, confident that its bluff will not be called. This pattern does not appear to exist for other (non‐left) parties, who may face reputational costs for issuing expansionary election manifestos.
These findings have implications for several ongoing debates in the literature. One concerns the consequences of elite polarisation (see Layman et al., Reference Layman, Carsey and Horowitz2006 for a review). It has often been argued that polarisation produces several negative consequences, including legislative gridlock, declining trust in politics, and democratic erosion (e.g., McCoy et al., Reference McCoy, Rahman and Somer2018). On the other hand, some scholars have pointed to the benefits of party polarisation, such as higher political engagement and increasing ideological sophistication among the electorate (Hetherington, Reference Hetherington, Nivola and Brady2007; Levendusky, Reference Levendusky2010; Pomper & Weiner, Reference Pomper, Weiner, Green and Herrnson2002). The findings of this study in relation to ideological distinctiveness and (in some specifications) ideological polarisation provide an additional reason why a certain degree of ideological differentiation is desirable: it reduces the likelihood that elections will descend into an auction, with the winner being the party that promises the most.
The finding that a party's expected level of government responsibility shapes how much it promises has potential relevance for research on government spending and for research on pledge fulfilment. A large body of research on comparative political economy has found that government spending tends to be higher under proportional electoral systems and coalition governments than under majoritarian systems and single‐party governments (Annett, Reference Annett2002; Grilli et al., Reference Grilli, Masciandaro and Tabellini1991; Milesi‐Ferretti et al., Reference Milesi‐Ferretti, Perotti and Rostagno2002; Persson & Tabellini, Reference Persson and Tabellini1999; Thames & Edwards, Reference Thames and Edwards2006). Separately, a number of studies have found that the rate at which government parties fulfil their election pledges tends to be significantly lower when power is shared in a coalition compared to when parties govern alone (e.g., Naurin et al., Reference Naurin, Royed and Thomson2019; Thomson et al., Reference Thomson, Royed, Naurin, Artés, Costello, Ennser‐Jedenastik, Ferguson, Kostadinova, Moury, Pétry and Praprotnik2017). Existing explanations for these empirical patterns have tended to focus on the nature of decision making under a coalition government. An alternative explanation is suggested by the findings of this study: coalition governments consist of a number of smaller parties, who face lower costs of over‐promising and thus tend to promise more. Promising more spending can lead to either more broken promises or higher government spending, or both. Future research should therefore examine the links between spending commitments in election manifestos, government spending and election pledge fulfilment.
Another avenue for future research concerns the relationship between populism and spending commitments. The finding that ideologically indistinct parties are more likely to compete through spending promises is particularly relevant here, as previous research has found that it is populist right‐wing parties who are most likely to blur their position on the economic left‐right dimension (Rovny, Reference Rovny2013; Rovny & Polk, Reference Rovny and Polk2020). The relationship between populism and expansionism was not investigated in the present article because measures of populism are not available for the full time‐period examined.
Finally, the findings point to a potential downside to surprise election results. Parties who expect to hold power after an election make promises that they intend to deliver upon, while parties who do not expect to have a significant level of government responsibility can afford to be more cavalier in their election promises. As the example from Ireland discussed in the introduction highlights, parties that attain power unexpectedly can be shackled with fiscally irresponsible election promises that they never thought they would have to implement. While the focus of this study has been on spending promises, this problem may be more widespread. For example, it has been argued that the commitment in the 2015 UK Conservative Party manifesto to hold a referendum on EU membership was only made because the party leader, David Cameron, expected to have to share power with the Liberal Democrats after the election, providing the necessary cover to renege on the promise (Smith, Reference Smith2018). The party instead won an outright majority, forcing Cameron to hold a referendum that he did not want. Future research should therefore examine how electoral prospects shape election promises more broadly.
Acknowledgements
Earlier versions of this paper were presented at the ECPR Annual Conference 2023 and the Political Studies Association of Ireland Annual Conference 2022. I would like to thank participants at both conferences, particularly Katrin Praprotnik and Thomas Däubler, along with the anonymous reviewers, for their very valuable comments.
Open access funding provided by IReL.
Data Availability Statement
The data that support the findings of this study are available from the corresponding author upon request.
Online Appendix
Additional supporting information may be found in the Online Appendix section at the end of the article:
Supplementary material


 Open access