


1. Introduction
Arctic sea-ice extent and thickness have reduced significantly in recent decades, especially since the mid-1990s (Peng and Meier, Reference Peng and Meier2017; Onarheim and others, Reference Onarheim, Eldevik, Smedsrud and Stroeve2018), and the Arctic sea-ice cover is gradually becoming younger and thinner (Kwok, Reference Kwok2018). In the Northern Hemisphere, landfast sea ice (LFSI) along the Arctic coast in winter accounts for ~13% of the total ice cover by area (Karvonen, Reference Karvonen2018). LFSI does not drift but can move vertically in response to tides and swell, and it can deform mechanically through ridging or shearing at its outer and coastal boundaries. The distribution of Arctic LFSI varies dramatically with regional geography. Moreover, local bathymetry and atmospheric/oceanic conditions are major factors that determine LFSI characteristics (Leppäranta, Reference Leppäranta2011). Along the coast of Barrow, Alaska, the width of the LFSI zone in winter is ~5–50 km (Mahoney and others, Reference Mahoney, Eicken, Gaylord and Shapiro2007). In the Beaufort Sea, LFSI is more robust and has a longer lifetime than that in the Chukchi Sea (Mahoney and others, Reference Mahoney, Eicken, Gaylord and Gens2014). In the Laptev and East Siberian Seas, the outer boundary of LFSI can extend up to 500 km from the coast (Selyuzhenok and others, Reference Selyuzhenok, Mahoney, Krumpen, Castellani and Gerdes2017). Grounded icebergs and sea-ice ridges on shallow shoals and banks to the northeast of Greenland can lead to the formation of LFSI (Hughes and others, Reference Hughes, Wilkinson and Wadhams2011), which is not always attached to the shore because of abnormal offshore winds (Wang and others, Reference Wang2020). In certain channels and straits of the Canadian Arctic Archipelago, LFSI can persist throughout the melt season, playing an important role in regulating the outflow of sea ice from the Arctic Ocean (Mahoney, Reference Mahoney2018).
LFSI keeps Arctic drift ice away from the coast, reducing coastal erosion by drift ice and waves (Rachold and others, Reference Rachold2000; Radosavljevic and others, Reference Radosavljevic2016). In estuaries, LFSI affects the freshwater flux cycle and halocline stability owing to its low salinity and freezing–melting cycle (Eicken and others, Reference Eicken2005; Itkin and others, Reference Itkin, Losch and Gerdes2015). Moreover, LFSI reduces material, momentum and energy exchanges between ocean and atmosphere (Proshutinsky and others, Reference Proshutinsky2007), and determines the location and evolution of coastal polynyas and flaw leads, thereby greatly impacting atmosphere–ocean interactions on the regional scale (Maqueda, Reference Maqueda2004; Fraser and others, Reference Fraser2019). These openings in the sea ice provide breeding and feeding sites for polar bears, seals and birds and also represent important habitats for large vertebrates and microorganisms (Bluhm and Gradinger, Reference Bluhm2008; Kooyman and Ponganis, Reference Kooyman and Ponganis2014; Stauffer and others, Reference Stauffer, Goes, McKee, do Rosario Gomes and Stabeno2014). Additionally, LFSI has also been used as a platform for offshore oil/gas exploitation and indigenous fishing activities, promoting local economic development (Eicken and others, Reference Eicken, Lovecraft and Druckenmiller2009).
Depletion of multiyear sea ice has been most pronounced in the eastern Arctic Ocean (Kwok, Reference Kwok2018). This loss of protection by drift ice is expected to lead to a shorter ice season and to enhanced dynamics of LFSI along the Russian coast. The process of LFSI break-up is of great importance. Fragmentation and subsequent northward advection of LFSI floes may lead to the transportation of large amounts of terrigenous or shelf-derived materials into the deep basin (e.g. Peeken and others, Reference Peeken2018; Krumpen and others, Reference Krumpen2020). Outlying islands (e.g. the New Siberian Islands) are crucial nodes affecting the accessibility of the Northeast Passage (Lei and others, Reference Lei2015). Ice formation in the peripheral seas around these islands is affected by the local shoreline and bathymetry, which can lead to further northward protrusion of the LFSI edge.
Although large-scale monitoring of Arctic LFSI is based mainly on satellite remote sensing and operational sea-ice charts (e.g. Mahoney and others, Reference Mahoney, Eicken, Gaylord and Shapiro2007, Reference Mahoney, Eicken, Gaylord and Gens2014; Karvonen, Reference Karvonen2018; Li and others, Reference Li2020), field observations and numerical models are also highly valuable in studies of Arctic LFSI (e.g. Howell and others, Reference Howell, Laliberté, Kwok, Derksen and King2016; Jones and others, Reference Jones2016; Laliberté and others, Reference Laliberté, Howell, Lemieux, Dupont and Lei2018; Wang and others, Reference Wang2020). Along the Siberian coast, only a few field observations of LFSI are implemented on a continuous basis; however, regular long-term meteorological observations on shore are available, which can be used to model the annual cycle and interannual variations of the LFSI mass balance. For example, Yang and others (Reference Yang2015) conducted a preliminary study of LFSI in the East Siberian Sea by combining a sea-ice thermodynamic model and satellite remote-sensing data.
LFSI break-up results from the combined effects of mechanical fracturing and thermodynamic melting (Leppäranta, Reference Leppäranta2013; Selyuzhenok and others, Reference Selyuzhenok, Krumpen, Mahaney, Janout and Gerdes2015; Yang and others, Reference Yang2015). Therefore, it is essential to understand both the thermodynamics of LFSI and the process of break-up. As horizontal movement of LFSI is limited, the life cycle of the LFSI zone is controlled largely by thermodynamics (Flato and Brown, Reference Flato and Brown1996; Selyuzhenok and others, Reference Selyuzhenok, Krumpen, Mahaney, Janout and Gerdes2015). Thawing degree-days represent a useful climatological index related to LFSI decay (Barry and others, Reference Barry, Moritz and Rogers1979; Bilello, Reference Bilello and Pritchard1980)); however, it oversimplifies the energy balance by omitting proper consideration of the radiation balance and snowmelting (Shirasawa and others, Reference Shirasawa2005, Reference Shirasawa, Eicken, Tateyama, Takatsuka and Kawamura2009; Dumas and others, Reference Dumas, Flato and Brown2006). Ground-based and remote-sensing observations have been used to study and predict the seasonal decay and break-up of LFSI at Barrow, Alaska (Petrich and others, Reference Petrich2012), where grounded pressure ridges play a role in the breakup process (Jones and others, Reference Jones2016). Few studies have considered the seasonal cycle and break-up of LFSI along the Siberian coast. Zubov (Reference Zubov1945) revealed extensive information regarding the Siberian LFSI, mainly presenting its general geographical distribution. More recently, Selyuzhenok and others (Reference Selyuzhenok, Krumpen, Mahaney, Janout and Gerdes2015) used weekly operational sea-ice charts to analyze the seasonal and interannual variability of LFSI in the southeastern Laptev Sea, and Polyakov and others (Reference Polyakov, Walsh and Kwok2012) investigated the long-term changes in LFSI thickness using in situ measurements obtained at 15 sites along the Siberian coast. However, as these previous studies were based on remote-sensing data and only a limited number of observations, they were unable to provide adequate descriptions of the full seasonal cycle and interannual variations of the LFSI zone.
The objective of this study was to explore the seasonal and interannual variations, and the break-up of the LFSI area along the northwest coast of Kotelny Island, East Siberian Sea. We combined a sea-ice thermodynamic model and remote-sensing observations to obtain a full picture of the annual cycle of LFSI in this area. To examine the multidecadal changes in the snow and ice mass balance, we conducted numerical simulations using local weather observations as external forcing. To identify the expansion and fracturing of the LFSI zone, we used MODIS optical remote-sensing images and Advanced Synthetic Aperture Radar (ASAR) images from Envisat. The findings of this study contribute toward better understanding of the mechanisms of LFSI break-up and its long-term changes in the Arctic.
2. Data and methods
2.1. Study site and meteorological data
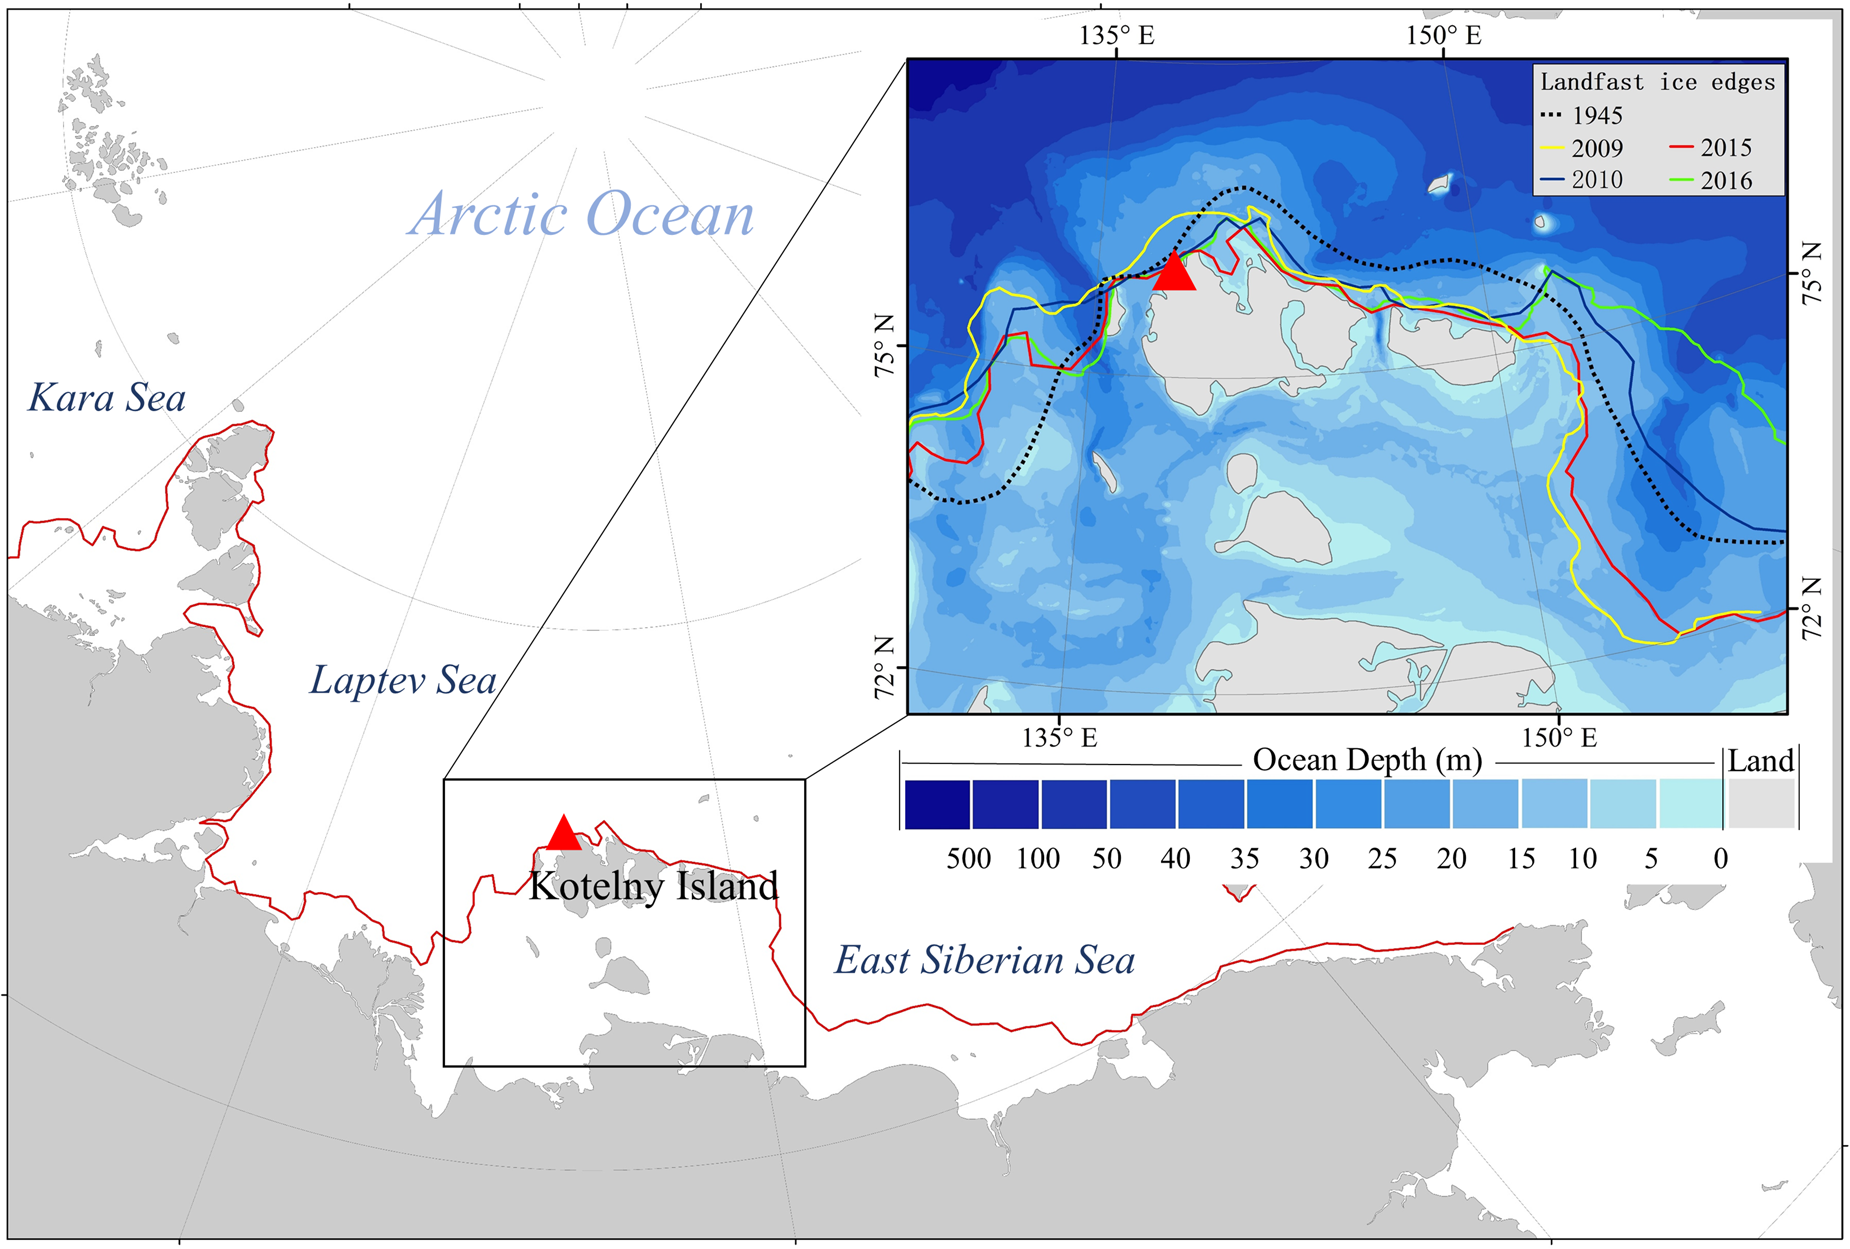
Kotelny Island (76.00° N, 137.87° E) is one of the New Siberian Islands (Fig. 1). It lies to the north of the Russian coast between the Laptev and East Siberian seas. Generally, LFSI starts to form in October in this region and disappears completely by July. On average, between December and May, LFSI extends outward from the shoreline to areas with sea depth of 15–20 m. However, there is large interannual variability in the annual maximum extent of LFSI (Fig. 1), which is attributable to the thickness and forcing history.
Main panel shows the LFSI edge (red line) along the Russian shoreline extracted from MODIS images on 31 May 2015. The inset shows bathymetry (data source: the International Bathymetric Chart of the Arctic Ocean) and LFSI edge around the New Siberian Islands at the end of May in 2009, 2010, 2015 and 2016 (extracted from MODIS images) and in Zubov (Reference Zubov1945). Red triangles indicate the location of the study site on the west coast of Kotelny Island.
Meteorological observations are conducted at a weather station (76° N, 137.87° E, elevation: 8 m) located in the northwestern part of Kotelny Island. The measurements acquired routinely at this station include air temperature (T a) at 2-m height, relative humidity (Rh), visual cloud fraction (CN), wind speed (V a) and wind direction (V d). The temporal resolution of these measurements was taken as 6 h. Additionally, accumulated precipitation (Prec), measured twice daily (in terms of w.e.), was used for assessment of the local snowfall. These meteorological observations were available without major gaps for the entirety of our study period (1994–2014). The data were interpolated linearly to 1-h intervals and used as external forcing for the thermodynamic snow/ice model. No on-site ice thickness (h i) and snow depth (h s) data were available for model validation; however, the snow depth on land (H s), which is recorded daily, was used to validate the modeled onset of snowmelting.
The large-scale atmospheric circulation affects the regional LFSI conditions through regulation of local synoptic processes. In this study, atmospheric circulation patterns were analyzed using ERA-Interim reanalysis data from the ECMWF (https://apps.ecmwf.int/datasets/data/interim-full-daily/levtype=sfc/). We extracted the mean sea level pressure, air temperature at 2-m height and 500-hPa geopotential height north of 60° N between October and June to characterize the atmospheric patterns from both thermodynamic and dynamic perspectives.
2.2. LFSI remote-sensing observations
For the period of investigation, 5518 MODIS and 307 Envisat ASAR images from October to August were collected. True-color MODIS images with 250-m resolution are available from NASA's Worldview, and they can be acquired twice daily. Such data are very useful for monitoring the LFSI breakup process, and we sampled MODIS images from 1 March to 31 August of each year between 2000 and 2014. However, clouds frequently obscure the ice and visible-band MODIS imagery is available only during daylight. Therefore, for the fall and winter period (October–April), we used Envisat ASAR data. The temporal coverage of ASAR imagery is limited, but we were able to collect sufficient data for five ice seasons: 2007/08 (95 images), 2008/09 (26 images), 2009/10 (57 images), 2010/11 (51 images) and 2011/12 (56 images). This allowed us to obtain five full seasonal cycles of LFSI by combining the MODIS and ASAR images (Section 3.3). For the other seasons, we focused mainly on assessing LFSI break-up using MODIS data. Envisat ASAR operates in the C-band with a central frequency of 5.331 GHz, and it has five distinct measurement modes with different spatial resolutions and swath widths. We used Level 1 Medium Resolution (150 m) products, which were obtained using the wide swath mode (405 km) and ScanSAR technique. For our analysis, a subscene (60 km × 60 km) of the target area was extracted from the original satellite images.
2.3. Thermodynamic modeling
The High-Resolution Thermodynamic Snow and Ice (HIGHTSI) model was used in this study to simulate LFSI formation, growth and decay. The model was initially designed for the seasonal sea-ice zone, e.g. the Baltic Sea and the Bohai Sea (Launiainen and Cheng, Reference Launiainen and Cheng1998; Cheng and others, Reference Cheng, Vihma and Launiainen2003, Reference Cheng, Vihma, Pirazzini and Granskog2006). It has been further developed and applied to the Arctic Ocean (Cheng and others, Reference Cheng2008; Wang and others, Reference Wang, Cheng, Wang, Gerland and Pavlova2015; Merkouriadi and others, Reference Merkouriadi, Cheng, Graham, Rösel and Granskog2017) and lake ice (Yang and others, Reference Yang, Leppäranta, Cheng and Li2012).
The HIGHTSI model solves the heat conduction equation for both snow and ice layers with different thermal properties:

where T is the temperature, ρ is the density, c is the specific heat and k is the thermal conductivity. The subscripts s and i denote snow and sea ice, respectively, q(z, t) is the solar radiation penetrating below the surface, the vertical coordinate z is taken as positive downward and t denotes time. The temperature at the ice–snow interface is calculated assuming heat flux continuity. Modeling of the penetration of solar radiation through snow and ice is adapted from Grenfell and Maykut (Reference Grenfell and Maykut1977) using a two-layer scheme (Launiainen and Cheng, Reference Launiainen and Cheng1998), allowing quantification of subsurface snow and ice melting.
The surface heat balance equation is used to calculate the surface temperature and surface melting:

where α is the surface albedo, Q s is the incident shortwave radiative flux at the surface, I 0 is the solar radiation penetrating below the near-surface snow/ice layer, Q d is the incoming atmospheric longwave radiation, T sfc is the surface temperature, Q b is the longwave radiation emitted by the surface, ɛ is the surface emissivity (0.97; Vihma and others, Reference Vihma, Johansson and Launiainen2009), Q h and Q le are the sensible and latent heat fluxes, respectively, F c is the conductive heat flux from below the surface and F m is the heat flux due to surface melting. In this study, Q s and Q d were derived following Shine (Reference Shine1984) and Efimova (Reference Efimova1961), respectively, and the surface albedo was parameterized following Briegleb and others (Reference Briegleb2004). Sensible and latent heat fluxes were calculated using meteorological observations and the modeled surface temperature.
Freezing and melting at the ice bottom are determined by the conductive heat flux and the upward oceanic heat flux at the ice bottom:

where ρ i is the sea-ice density at the basal layer, H is the ice thickness, L f is the latent heat of freezing and F w is the oceanic heat flux. At the ice–water interface, the temperature is at freezing point, i.e. T bot = T f.
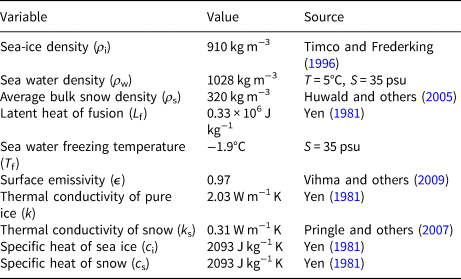
Thermal properties of sea ice are parameterized according to Yen (Reference Yen1981) and Pringle and others (Reference Pringle, Eicken, Trodahl and Backstrom2007). Parameterization of time-dependent snow density (Briegleb and others, Reference Briegleb2004) and snow heat conductivity (Sturm and others, Reference Sturm, Holmgren, König and Morris1997) allows the insulation effect of snow to be taken into account. Table 1 lists the values of the HIGHTSI model parameters used in this study, which are largely based on the literature. In practice, F w below Arctic sea ice is time dependent (McPhee and others, Reference McPhee, Kikuchi, Morison and Stanton2003). In the coastal area, F w reveals an annual cycle (Yang and others, Reference Yang2015); it tends to be large in late summer, reduced to a comparatively small value during the freezing season, and increases as the ice melts. In the coastal area, the increased oceanic heat is the result of solar radiation penetrating through the sea ice into the water in late spring and directly into open water in summer. Unfortunately, we did not have an observed F w time series to use as model input. Therefore, a representative constant value of F w (2 W m−2) was used in the seasonal ice simulation for the ice-covered Arctic Ocean during winter (e.g. Merkouriadi and others, Reference Merkouriadi, Cheng, Graham, Rösel and Granskog2017).
Values of the HIGHTSI model parameters
Model simulations were conducted for the entire annual ice cycle each year, i.e. from 1 September to final break-up. The snow depth and ice thickness initial conditions were specified as 1 and 2 cm, respectively. This choice was simply technical for the sake of the model algorithm; in practice, snow depth and ice thickness remain at their initial values until the surface energy balance becomes negative (Yang and others, Reference Yang, Leppäranta, Cheng and Li2012; Zhao, Reference Zhao2019). The resulting ice and snow evolution is not sensitive to the technical initial conditions.
2.4. Identification of LFSI evolution
Two basic principles were applied in previous studies to distinguish LFSI from drift ice: (1) contiguous to the coast and (2) lack of movement (Mahoney and others, Reference Mahoney, Eicken, Gaylord and Shapiro2007; Fraser and others, Reference Fraser, Massom and Michael2010). In our study, we followed these principles to determine the LFSI coverage using remote-sensing data. At the local scale, LFSI inside an embayment is more stable than ice outside (Leppäranta, Reference Leppäranta2013). To identify dynamic LFSI events, the visual inspection approach (VIA) can be adopted. Smith and others (Reference Smith2016) applied this technique to high-temporal resolution satellite images and land-based marine radar to detect any visible changes of the target (i.e. the LFSI area) from consecutive images. In the current study, LFSI evolution was divided into four stages: (1) initial freezing, (2) rapid ice formation, (3) stable ice and (4) ice decay.
The freeze-up of the LFSI zone is controlled by thermodynamic processes (Leppäranta, Reference Leppäranta2013; Selyuzhenok and others, Reference Selyuzhenok, Krumpen, Mahaney, Janout and Gerdes2015), and can be determined from MODIS and Envisat images. Newly formed loose ice floes are clearly visible from ASAR images during this stage. We defined the day when level ice is observed to be attached to the shore as the beginning of the initial freezing stage. Based on consecutive remote-sensing images, the first day when consolidated ice filled the entire study area was defined as the onset of rapid ice formation stage. The stable stage was characterized by persistence between LFSI and drift ice areas. During this stage, LFSI growth slowed and its thickness gradually reached the maximum. The ice decay stage was defined as beginning when drastic changes were observed from consecutive satellite images. The surface was black in the Envisat ASAR images (low backscatter) and blue in the MODIS images (bare ice), both suggest the existence of meltwater on the surface. Diminishment of the LFSI area and fracturing of ice floes could be identified clearly from the satellite images.
The major weakness of VIA is the temporal gaps in satellite image acquisition attributable to satellite repeat cycles or contamination of imagery by clouds or darkness. Break-up and consolidation of ice fields could occur during such gaps, generating uncertainties in the VIA results. Therefore, we introduced a quantitative method to estimate the LFSI cycle by combining remote-sensing imagery with the results of simulations of the HIGHTSI model.
Previous observations suggested that LFSI in the Laptev Sea is formed when the ice thickness reaches 0.05–0.1 m (Karklin and others, Reference Karklin, Karelin, Yulin and Usol'tsceva2013). Thus, based on the HIGHTSI model runs, we defined the following phenological indices of the LFSI cycle:
• Ice freeze-up date (IFD) as the onset day of LFSI growth when the modeled ice thickness reaches 0.1 m;
• Snow-accumulation date (SAD) as the first day of continuous snow accumulation of a snow layer thicker than 0.01 m;
• Snow-melting onset date (SMD) as the first day of continuous decrease of snow depth, which usually coincides with the day of annual maximum snow depth;
• Snow-free date (SFD) as the day modeled snow depth becomes zero;
• Ice-melting onset date (IMD) as the first day of continuous decrease of ice thickness, which usually coincides with the day of annual maximum ice thickness;
• Ice-free date (FD) as the day the calculated ice thickness becomes zero.
Ice break-up occurs between the IMD and the FD owing to the combined effects of fracturing and melting of ice. We quantitatively estimated LFSI breakup process by combining satellite observations and the results of the HIGHTSI model simulations (Section 3.4).
3. Results
3.1. Seasonal and interannual variations of meteorological parameters
We categorized the meteorological data according to season, i.e. winter (December–February), spring (March–May), summer (June–August) and fall (September–November). The long-term means and trends of monthly air temperature are summarized in Table 2. Kotelny Island has a harsh Arctic climate. During the study period, the mean air temperature was >0°C only in the summer months. January and February were the coldest months with mean temperatures of −29.1 and −29.5°C, respectively. The air temperature trends were positive for all months except for February. Seasonally, the mean temperature showed a significant trend of warming that was highest in spring (2.3°C decade−1, P < 0.001) and followed in descending order by fall (1.9°C decade−1, P < 0.05), winter (1.7°C decade−1, P < 0.01) and summer (0.8°C decade−1, P < 0.05). The annual mean air temperature increased at the rate of 1.6°C decade−1 (P < 0.001), i.e. greater than that over the entire Arctic (0.76°C decade−1) reported by Huang and others (Reference Huang2017). The warming in fall and spring has changed the length of the ice season and influenced the formation/break-up of sea ice.
Trends of monthly air temperature (°C) between 1995 and 2014

*Significance level: P < 0.05, **significance level: P < 0.01, ***significance level: P < 0.001.
The annual accumulated precipitation during 1995–2014 was in the range of 90–180 mm. Approximately 70% of the annual precipitation was received during June–October. The wind speed was <10 m s−1 in 87% of the measurements, but exceeded 20 m s−1 in a few cases. On the west coast of Kotelny Island, the prevailing winds are southwesterly (parallel to the coast) during winter, easterly (onshore) in spring, northerly and easterly in summer and southerly and southwesterly (offshore) in fall. In spring and summer, the prevailing onshore wind is not conducive to mechanical break-up of LFSI. No statistically significant trends were identified for humidity or precipitation. Cloudy days (cloud cover >60%), which lower incident shortwave radiation but are conducive to increased downward longwave radiation, occurred most frequently in summer. Days with cloud cover of <40% occurred mainly in winter.
3.2. Modeled thicknesses of snow and sea ice
The SAD, SMD and SFD were 28 September (±10 d), 22 May (±7 d) and 15 June (±9 d), respectively (Fig. 2). The duration of the snowmelt season was 24 ± 9 d. The seasonal mean snow depth was 0.12 ± 0.05 m. However, there was large interannual variability in snow depth, probably relating to changes in precipitation and wind forcing.
Time series of modeled snow depth and ice thickness (black dotted lines) for the ice seasons of 1995/96 to 2013/14. Bold black lines indicate the average thickness of snow (top panel) and ice (bottom panel). The reference level (0) is the initial ice surface. In the top panel, vertical lines indicate the average SAD (light orange), SMD (medium orange) and SFD (dark orange). In the bottom panel, vertical lines indicate the freeze-up date (light blue), IMD (medium blue) and FD (dark blue). Shaded areas illustrate the std dev.
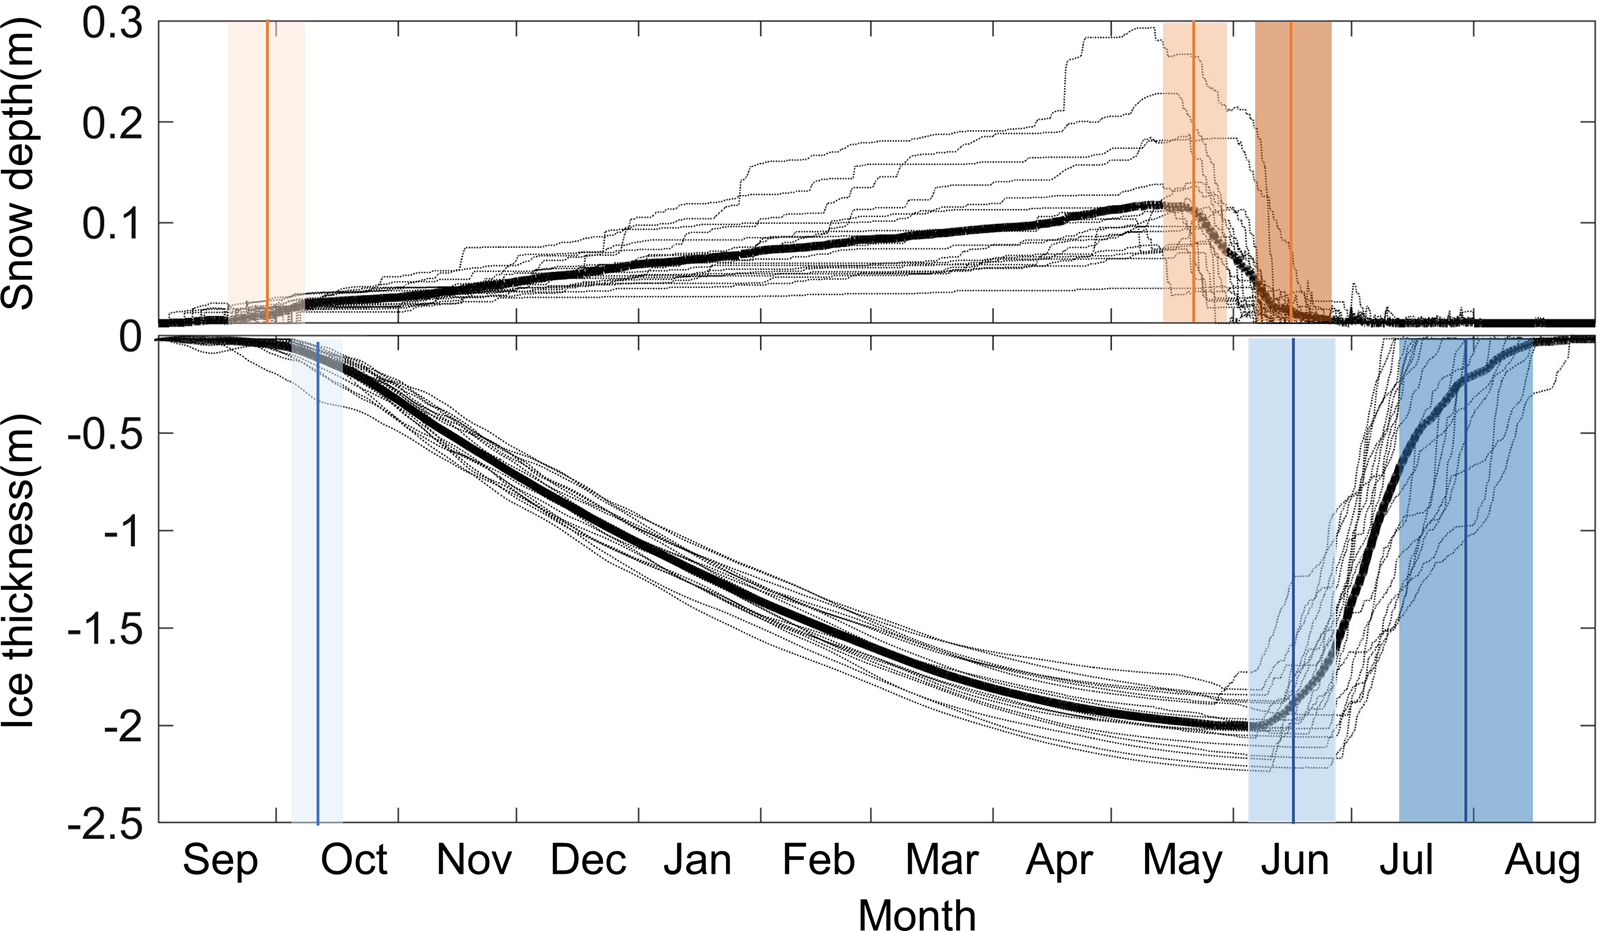
The IFD, IMD and FD were 10 October (±6 d), 14 June (±9 d) and 29 July (±16 d), respectively. The thermodynamically modeled ice season lasted 293 ± 19 d, i.e. on average, from 10 October to 29 July. However, the actual ice season could be shorter owing to fracturing of the LFSI area prior to the modeled FD. The modeled annual maximum ice thickness was 2.02 ± 0.12 m. Among the above temporal indices of climatology, the FD had the largest interannual variability, probably because more complex processes and feedback mechanisms exist in the melting season than in the ice growth season. There were relatively small interannual variabilities in the IFD and SMD. The seasonal evolution of ice thickness found in this study is consistent with a previous modeling study in the same region that used ERA-Interim reanalysis data as the external forcing (Yang and others, Reference Yang2015).
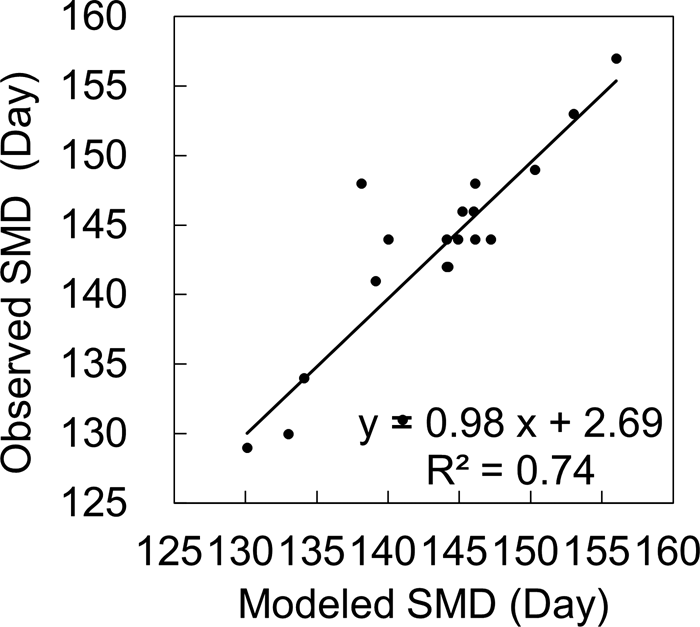
Owing to the lack of in situ observations of snow depth and ice thickness, we estimated the SMD from the snow depth measured at the meteorological station. The reasonable agreement between the modeled and observed land SMD (RMSE = 3.70 d, R 2 = 0.74, P < 0.01) can be seen in Figure 3. Interannual variations of the modeled maximum and average snow depth showed increasing but not significant trends. This finding is consistent with the observations on land, which revealed that the average snow depth was 0.22 m but with large interannual variability. The difference regarding LFSI is probably attributable to the combined effects of changes in precipitation, snowdrift and snow ice formation. Over the study period, modeled seasonal mean snow depth on LFSI was 0.12 m. The ratio between snow depth observed on land and that obtained from modeling was 1.8, which is consistent with the observation that snow depth is usually larger on land than on ice, although this ratio depends on location (e.g. Kärkäs, Reference Kärkäs2000, Yang and others, Reference Yang, Leppäranta, Cheng and Li2012, Cheng and others, Reference Cheng2020). Snow cover simulation is challenging largely owing to uncertainties in the magnitude and phase of precipitation, as well as the snowdrift.
Observed (on land) and modeled (on LFSI) SMD (shown as the day of the year). The solid line is the linear regression line.
3.3. Seasonal cycle of LFSI
Despite the limitations of the satellite data, we established the LFSI evolution for five entire seasonal cycles (2007/08 to 2011/12) using VIA. One full seasonal (2007/08) cycle of LFSI is described below; the other four seasonal cycles of LFSI are provided in the Supplementary material (Figs S1–S4). In 2007/08, initial freeze-up occurred between 13 October and 5 November when the air temperature was well below freezing point (Fig. 4a). The main ice types at that time were nilas or young ice, with no integrated and immobile LFSI. In the ASAR image obtained on 20 October 2007 (Fig. 4a), a dim surface with low backscatter indicated the presence of loose ice floes and fragile connections between the new ice and the shore. Close to the shoreline, a small area of LFSI was consolidated. Newly formed LFSI that is slightly further from the shore is more sensitive to the external forcings of wind and tide, and can easily be moved away from the shoreline. As shown in the image from 2 November 2007, the LFSI was driven away, leaving an ice-free lead (black area in the middle of the image). Modeled LFSI thickness by that time reached 0.3 m as a result of thermodynamic growth.
(a) Observed annual wind speed, direction and air temperature at Kotelny Island weather station in 2007/08 and (b) HIGHTSI-modeled seasonal cycle of snow depth, ice thickness and temperature accompanied by selected snapshots of MODIS and Envisat ASAR images. The acquisition date is shown in each image and the arrows point to the corresponding modeled ice thicknesses. The vertical dashed lines separate the LFSI stages.
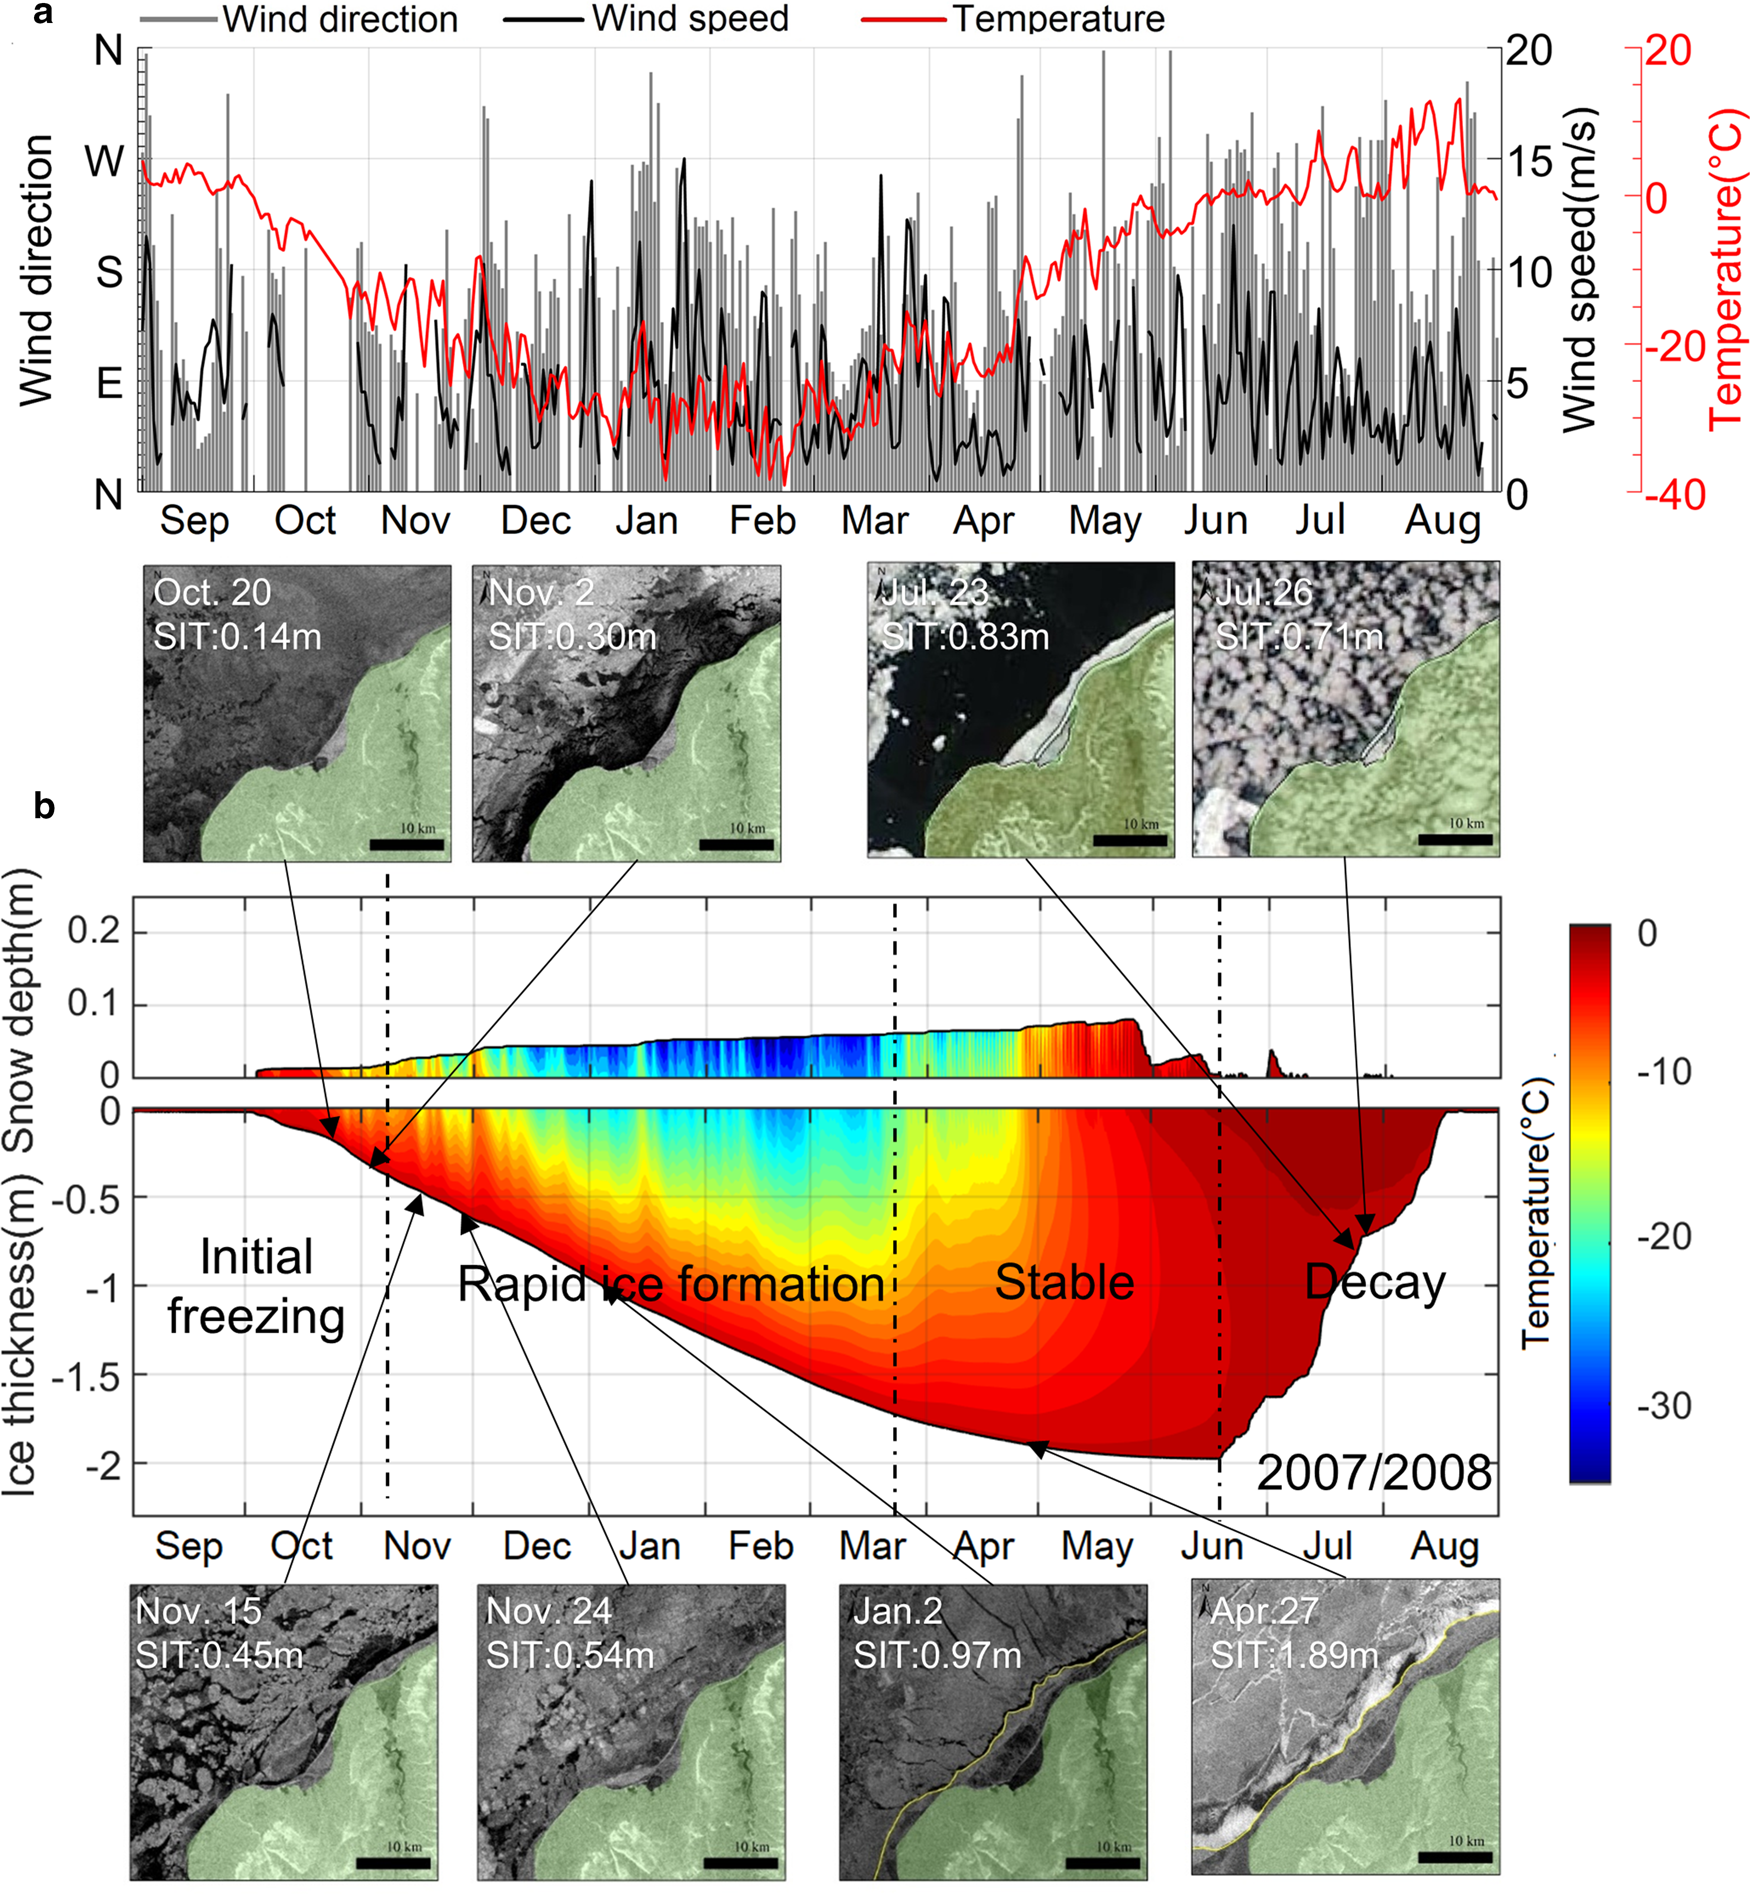
Over the following days, the air temperature dropped further (to below −12°C), resulting in rapid ice formation. Ice growth rate was nearly constant from early November to late March. The coastal area was filled with ice, and large ice floes are visible in ASAR images from 15 and 24 November 2007. Increased backscatter and decreased specular reflection indicate the presence of thicker ice and higher surface roughness. However, during LFSI formation, LFSI ice floes might reveal displacement by dynamic forcing. The prevailing offshore wind in fall promoted LFSI break-up. The LFSI eventually stabilized when modeled level ice thickness reached 0.6 m in late December as a result of thermodynamic growth. The ASAR images on 2 January and 27 April 2008 show stable LFSI conditions.
During the stable stage, ice growth slowed down, and ice thickness reached its annual maximum around mid-June 2008. From late March onward, the LFSI edge remained nearly unchanged until June. The LFSI was attached to the drift ice, and flaw leads decreased in size and could not be identified in the images.
Ice decay started between mid-June and late July. At this stage, the air temperature rose gradually above the freezing point, which together with increased solar radiation and the ice-albedo feedback mechanism, caused the sea ice to begin to melt. Melting took place within the ice column and at the top and basal surfaces. Consequently, the ice strength was weakened owing to the decreasing thickness and increasing porosity and temperature (Yang and others, Reference Yang2015; Leppäranta and others, Reference Leppäranta, Lindgren, Wen and Kirillin2019). When the strength of LFSI drops below a certain level, natural forcing can initiate fracture of the ice cover.
The dates and corresponding LFSI thickness data of these LFSI stages were quantified based on VIA and the HIGHTSI modeling results (Table S1). The freeze-up date obtained by both methods showed good agreement (Fig. S5). The initial ice formation stage ended at ~6 November (±2 d). The HIGHTSI model produced an ice thickness of 0.45 ± 0.07 m on that date. The satellite images revealed that the rapid ice formation stage can be characterized by the expansion of the LFSI area and frequent ice break-up at the LFSI edge. This stage lasted 2–4 months, until the ice thickness reached 1.58 ± 0.12 m, depending on the weather conditions. The model results showed ice growth rates of >0.03 m d−1, with 58% of the total ice thickness formed during this stage.
The LFSI stable stage lasted until the surface was free of snow. During this stage, a persistent and unchangeable LFSI area could be identified by VIA. The HIGHTSI model showed ice growth of 0.2–0.4 m after the stable stage, and the ice thickness gradually reached its seasonal maximum of 1.94 ± 0.11 m prior to the ice decay stage.
3.4. Break-up of LFSI
The break-up of LFSI occurred during the decay stage. Melting is a slow process in which the ice becomes thinner and weaker over a period of weeks. The exact duration of this stage depends on the maximum ice thickness and the solar, atmospheric and oceanic forcings. At the end of the ice decay stage, the LFSI was fractured and disintegrated closely linked to the coastal geometry and bathymetry. To better understand the break-up of the LFSI, we divided the study area into three subdomains (Fig. 5): A1 (2 km from the shore), which is a small bay surrounded by land that acts as a shelter for the LFSI, and where the LFSI survived for the longest period; A2, which is further from the coast (2–5 km from the shore) and acts as a buffer between the inner bay and the outer LFSI, and is responsible for entrapment of ice within A1 during break-up; and A3, at the outer boundary of the LFSI (5–10 km from the shore), which has no direct connection to the coastline and has dynamic processes such as ridging, rafting and shearing.
Study area (red rectangle) divided into three subdomains according to geographical characteristics: A1 (inner bay surrounded by land), A2 (intermediate LFSI zone between A1 and A3 with land on one side) and A3 (LFSI in conjunction with drift ice without connection to the shore). The MODIS image was acquired on 11 June 2005.

Progressive melting and fracturing in the subdomains led to the final break-up of the LFSI. We defined two breakup patterns that could be identified in the satellite images: melting break-up and fracturing break-up. Melting break-up occurred without any sudden changes in ice area and floe distribution, where the ice cover gradually disintegrated into smaller thinner floes and finally disappeared (Fig. 6). Fracturing break-up took place when a consolidated ice floe was fractured and drifted away from the LFSI area (Figs 7, 8a).
MODIS images showing melting break-up in A1 and A2 during ice decay stage in eight ice seasons.
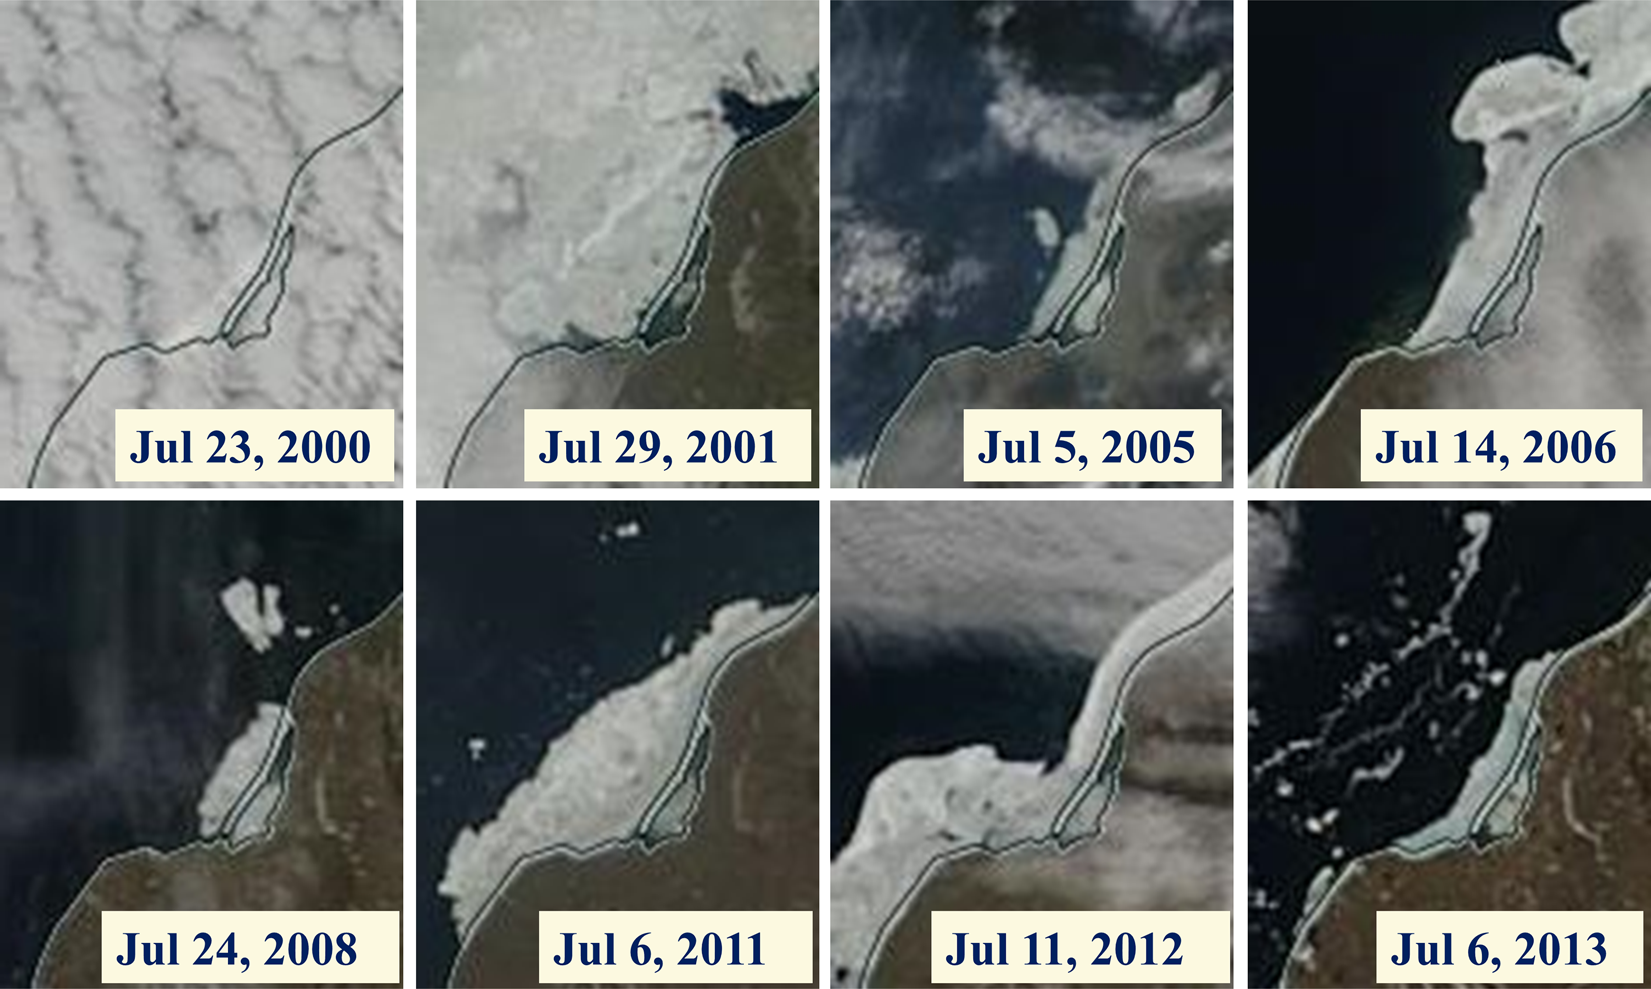
MODIS images showing fracturing break-up in A2 during ice decay stage in three ice seasons.

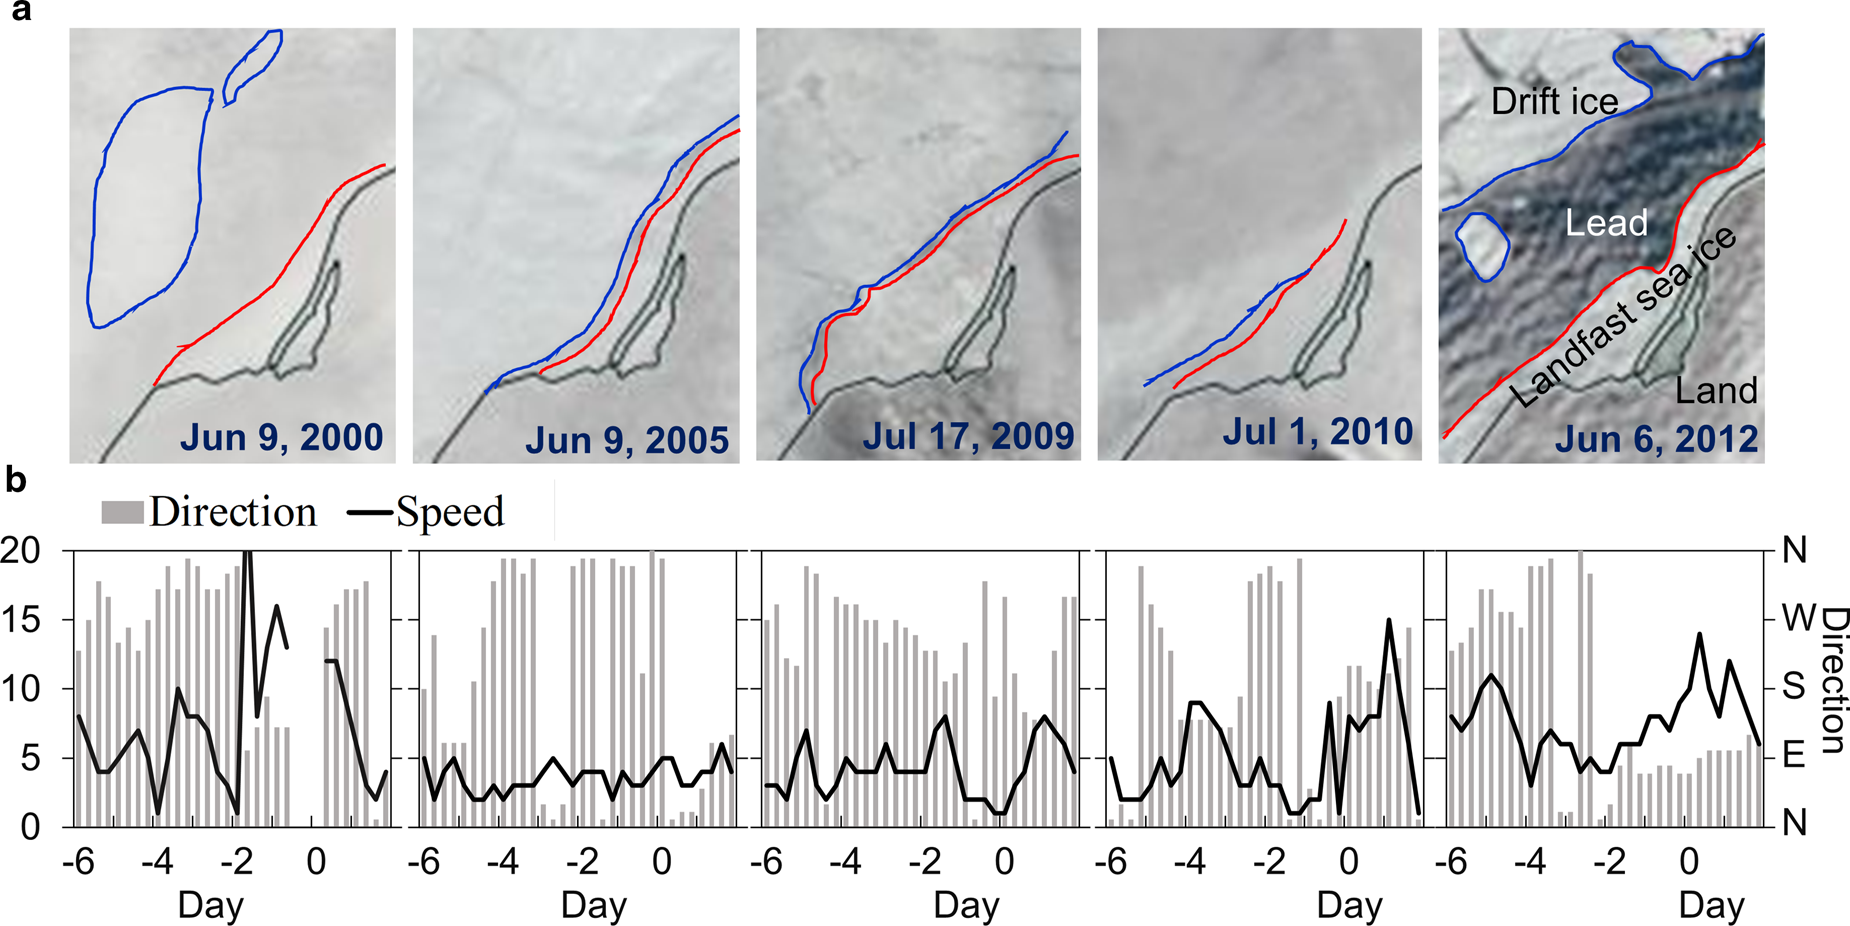
(a) Pattern of LFSI fracturing break-up in subdomain A3 illustrated using MODIS images from selected winters. Red and blue lines are the edges of LFSI and drift ice, respectively. (b) Wind speed and direction before and after acquisition of images in (a). Unit of the x-axis in panel (b) is number of days from day of image acquisition.
We combined the VIA and HIGHTSI results to quantify LFSI break-up. Sequences of MODIS images from each season were selected to identify the onset of break-up in A1, A2 and A3. We selected the clearest images to present the breakup event (Figs 6–8). Once the date of breakup onset was identified, the corresponding HIGHTSI-modeled ice thickness was recorded to determine the pattern (melting or fracturing) of break-up. As LFSI break-up occurred mostly at different times in A1, A2 and A3, different ice thicknesses were obtained for each specific subdomain. The patterns and dates of LFSI break-up are summarized in Table 3 and Figure 9. It should be noted that determination of the breakup date might sometimes be influenced by discontinuities in the remote-sensing optical images because of cloudiness. Here, the errors of breakup dates and the corresponding errors of the LFSI thicknesses were estimated, and they are listed in Table 3 together with a time window (−d1, +d2; where −d1 and +d2 mean the potential lead or lag offset of the breakup date, respectively), and the corresponding LFSI thickness ranges.
Relationship between LFSI thickness and breakup date due to melting (M) and fracturing (F) in subdomains A1, A2 and A3.

LFSI breakup patterns, onset dates identified from MODIS images and corresponding modeled sea-ice thickness (SIT) in subdomains A1, A2 and A3
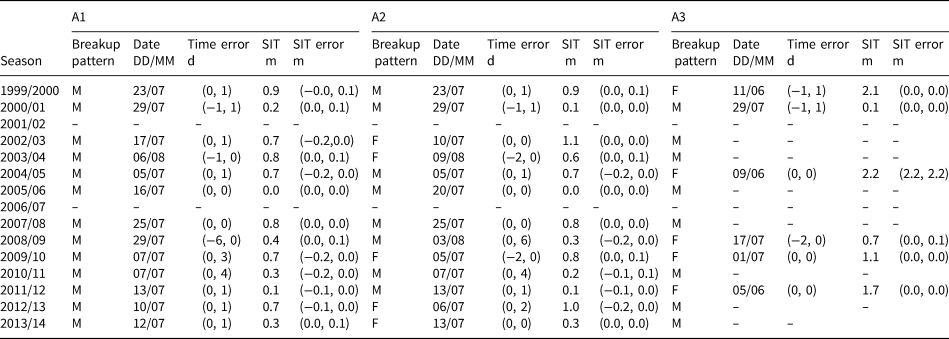
Note: Time error refers to the error in the determination of dates owing to cloud contamination of the images, and SIT error refers to the corresponding offset of modeled ice thickness introduced by time error. M represents melting breakup pattern; F represents fracturing breakup pattern.
In A1, shrinking and disintegration of LFSI occurred only until mid-July (see Table 3 and Fig. 9). In A2, LFSI was still present in July, and in 5 (8) out of the 15 years, fracturing (melting) break-up occurred. A2 acted as a barrier that prevented the LFSI in A1 from drifting away. In the ice seasons of 2003/04, 2005/06, 2008/09 and 2013/14, ice in A1 diminished earlier than in A2. Between 2000 and 2014, the modeled ice thickness at the onset of melting break-up was averaged to 0.50 and 0.39 m for A1 and A2, respectively.
The A3 subdomain was connected directly with the drift ice and/or open water. Daily MODIS images from the five winters, shown in Figure 8a, illustrate the timing of LFSI fracture in A3. Early fracture occurred at the beginning of June. The fracture onset dates varied by over 1 month from 9 June to 29 July, with the modeled ice thickness at fracture onset ranging from 0.7 m (2008/09) to 2.2 m (2004/05). The ice in A2 and A3 was still thick and consolidated before the fracturing. In the other ice seasons, the satellite images revealed continuous decrease of the LFSI area and retreat of the ice edge without major mechanical break-up in A1.
In A2, the average LFSI thickness at the onset of fracture break-up was 0.76 m; in A3, it was 1.56 m. This difference is related to local bathymetry, especially in terms of the protection of the coastline. At fracture onset, the ice close to the shore was thinner than that further away. The potential grounded ice ridges provided additional support and shelter for the ice cover. The LFSI in A1 was most difficult to fracture. We did not identify any fractures in A1 in the investigated ice seasons, and ice decay was attributable solely to melting break-up. In A2 and A3, mechanical fractures were observed between 5 June and 9 August, associated with modeled ice thicknesses of 0.3–2.2 m. Melting break-up was observed between 5 July and 6 August, associated with modeled ice thicknesses of 0–0.9 m. These results indicate that in comparison with melting break-up, fracture break-up occurred over a wide temporal window. Melting is a cumulative process limited by the available heat fluxes, while fracture can occur suddenly on random occasions in association with weakening of the ice and synoptic events.
Observed wind patterns from 6 d before until 2 d after the LFSI breakup events captured by the satellite images are presented in Figure 8b. Offshore southeasterly (2000, 2005 and 2012) and southerly (2010) winds were observed before the initial ice fracture. However, the wind speeds vary greatly (5–20 m s−1) and without any predominant direction during or before the breakup events. The offshore component (northwestward) was moderate (<8 m s−1), indicating that wind was not a major driver of ice fracture onset. The connectivity between ice and the shore allowed the LFSI to resist the wind stress and prevented the ice from drifting. In the study conducted at Barrow, Petrich and others (Reference Petrich2012) also found that breakup onset was independent of unusually strong offshore winds. Shear stress at the boundary between drift ice and LFSI is important in relation to LFSI break-up through weakening the consolidation of LFSI.
4. Discussion
4.1. Interaction with drift ice
At the boundary between LFSI and drift ice, mechanical interaction has a major impact on the location of the LFSI edge. Owing to the movement of drift ice, compressive or shear stress at the boundary might cause ridging and fracturing of the LFSI. The response of LFSI to this stress depends on the thickness and temperature of the ice. For example, the size of ridges that form under compression depends on ice thickness (Goldstein and others, Reference Goldstein, Osipenko and Leppäranta2009). Ridges are pushed further in when the ice is thin, while new support points form for LFSI when the ice is thick enough and ridges ground. Also, the greater the thickness of LFSI, the more stress is required for it to break. Thus, ice thickness is the primary factor for predicting the evolution and stability of the LFSI zone, as illustrated by the large ridges and ice rubble forming the stamukhi zone at the LFSI outer edge (Reimnitz and others, Reference Reimnitz, Dethleff and Nürnberg1994; Leppäranta, Reference Leppäranta2011). This mechanism was also reported in the Alaskan Arctic by Mahoney and others (Reference Mahoney, Eicken, Gaylord and Gens2014), who suggested that the local LFSI edge in the Chukchi Sea is controlled by the presence of recurring grounded ridges distributed along the coast.
Three cycles of advance and retreat of the LFSI edge spanning December–March are illustrated in Figure 8. It can be seen that when LFSI is thickening, the outer edge extends further outward, partly through interaction with drift ice. The ice massifs caused by shear loads can be seen as the linear features in radar images (Goldstein and others, Reference Goldstein, Osipenko and Leppäranta2009), e.g. the image of 1 February 2008 shown in Figure 10. The ice outside the LFSI zone was drifting with counterclockwise rotation under the action of wind forcing, creating stress on the LFSI.
Evolution of the LFSI edge for the ice season of 2007/08. In each row, the leftmost image presents a summary of the development of the ice edge shown in the five ASAR images to the right. The acquisition date is shown in each image. The green area is Kotelny Island, yellow-dashed line represents the LFSI edge and the colored lines in the leftmost images indicate the change of the LFSI edge in the images to the right. Ground features including ice type, leads and ridges are identified in the image from 1 February 2008.
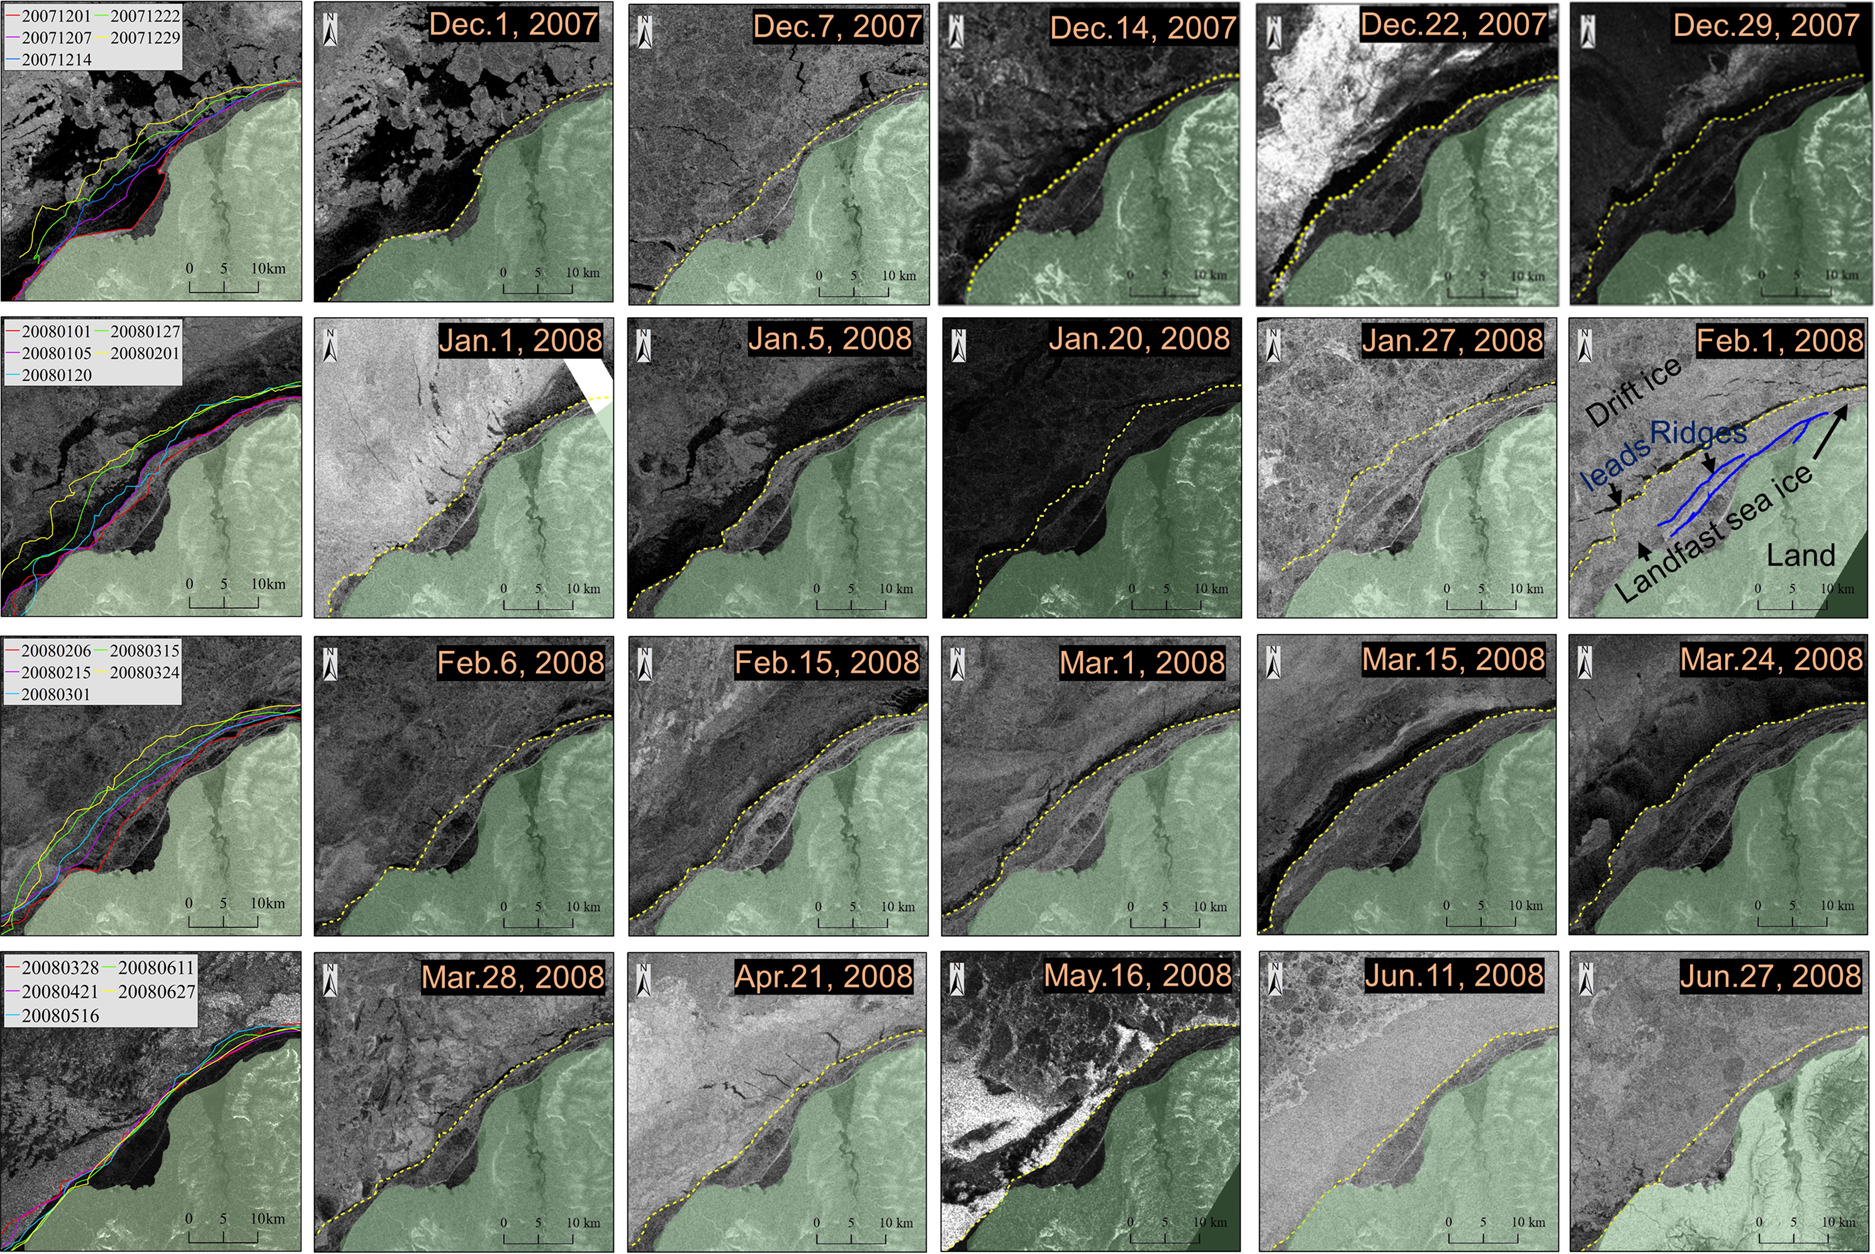
Selyuzhenok and others (Reference Selyuzhenok, Krumpen, Mahaney, Janout and Gerdes2015) found that in the southeastern Laptev Sea, the LFSI extent was close to its maximum at the end of December and continued to increase subsequently at a slower rate. This is different from the pattern of LFSI growth in our study area. Selyuzhenok and others (Reference Selyuzhenok, Krumpen, Mahaney, Janout and Gerdes2015) demonstrated that LFSI in the Laptev and East Siberian seas advanced as a result of both mechanical accumulation of pack ice during onshore drift events and attachment of young ice formed at the LFSI edge due to lead openings. The differences between ice behavior in the sea area considered in our study and that investigated by Selyuzhenok and others (Reference Selyuzhenok, Krumpen, Mahaney, Janout and Gerdes2015) can be attributed to bathymetric characteristics. The broad continental shelf of the Laptev and East Siberian seas means that the waters are shallow, the seabed is flat and the continent and islands act as protection for LFSI. This contrasts the situation in our study area at the edge of the Laptev Sea facing the Arctic Basin, which resembles the Alaskan coast where the seabed is steep and the LFSI is highly deformed.
4.2. LFSI thickness and ice season length
The maximum and average modeled ice thicknesses over the study period exhibited negative trends of 0.13 m decade−1 (P < 0.01) and 0.11 m decade−1 (P < 0.01), respectively. These are much larger than the trends reported for LFSI in the East Siberian Sea during 1936–2000 (0.01 m decade−1; Polyakov, Reference Polyakov2003), but are consistent with the trend of decrease reported by another satellite-derived study of the Laptev Sea during 2000–17 (0.14 m decade−1; Belter and others, Reference Belter2020). The study of Polyakov and others (Reference Polyakov2003) covered a period much earlier than ours and focused on an area that is geographically dissimilar, i.e. our study area comprised of a semienclosed bay. The length of the thermodynamically modeled ice season was 293 d in our study and it exhibited a negative trend (−22 d decade−1, P < 0.05). This is smaller than the trend reported for the Laptev Sea during 1999–2013 (−28 d decade−1; Selyuzhenok and others, Reference Selyuzhenok, Krumpen, Mahaney, Janout and Gerdes2015) but larger than that reported for the Laptev and East Siberian seas during 1977–2007 (−17.5 d decade−1; Yu and others, Reference Yu, Stern, Fowler, Fetterer and Maslanik2014). Contributing to the shortened ice season, the onset of ice freeze-up was delayed by 5.5 d decade−1, while the melt onset and FD occurred earlier by 8.9 and 16.4 d decade−1, respectively. This is consistent with the significant local warming in spring and fall.
Seasonal variations in oceanic heat flux under the ice were ignored in our model, which might have led to underestimation of the rate of ice melt during the warm seasons. As sea ice retreats, the oceanic heat flux under the ice increases, and the ice-albedo feedback enhances warming and ice loss. Therefore, over the long term, LFSI thickness in the Laptev Sea in spring and summer might decrease at a higher rate than that suggested by the model. In fact, in recent years, the sea-ice cover within this region has already become more fragmented (Bateson and others, Reference Bateson2020).
4.3. Impact of large-scale atmospheric circulation
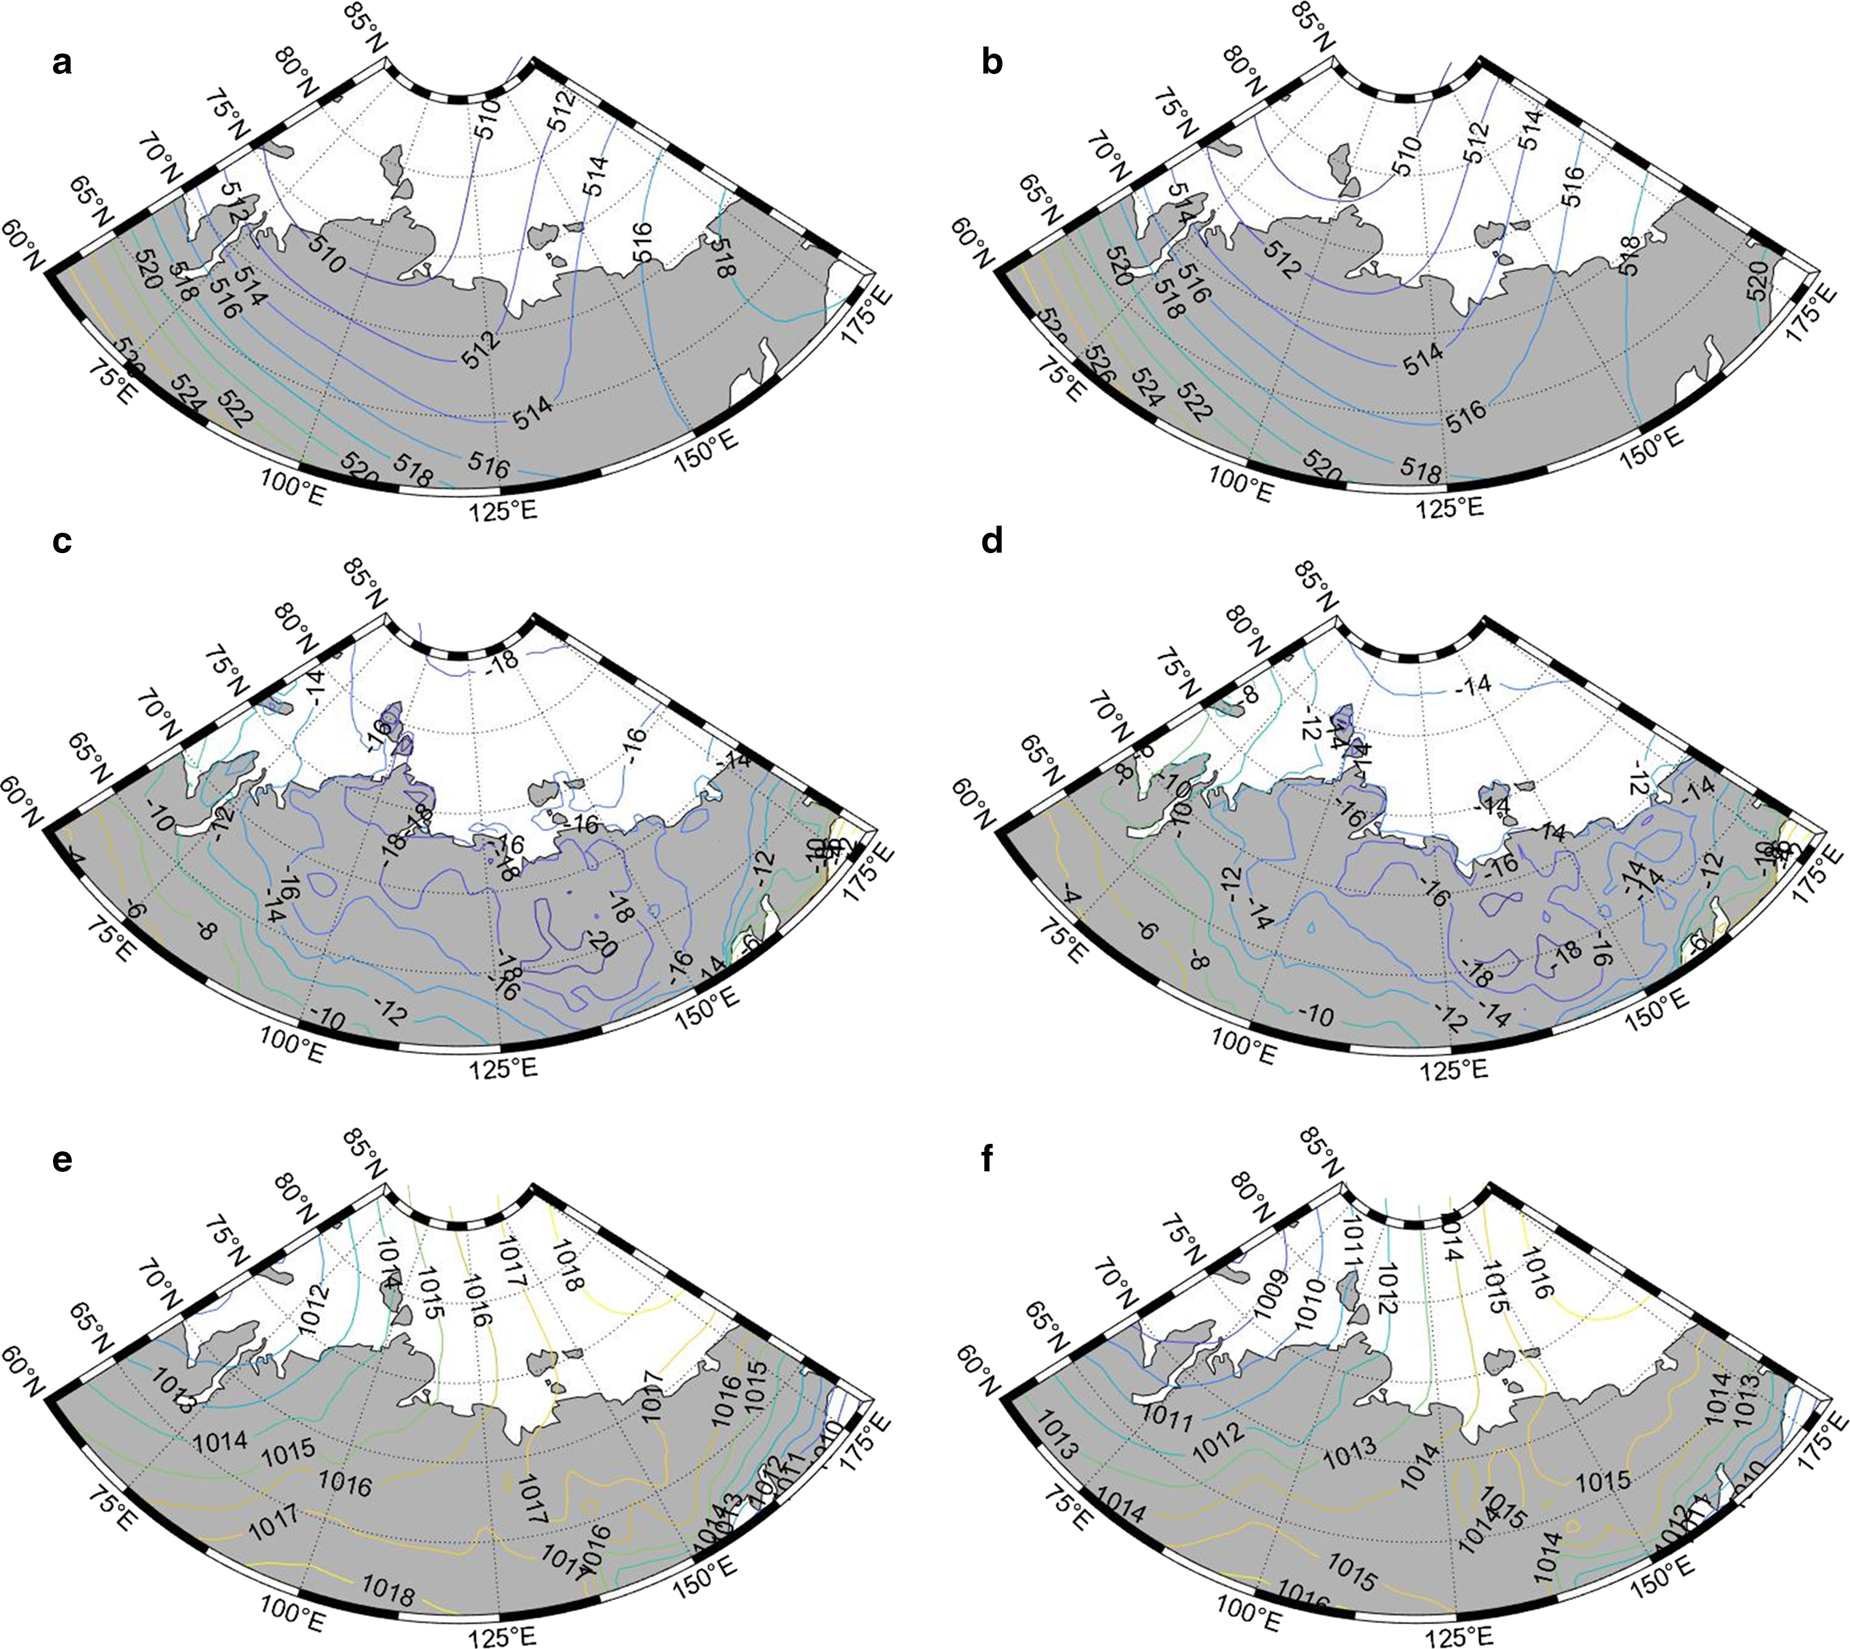
The extent of LFSI is sensitive to local air temperature and wind (Divine and others, Reference Divine, Korsnes and Makshtas2004; Divine, Reference Divine2005), both of which are influenced by the large-scale atmospheric circulation. We categorized the ice seasons as heavy or moderate using the threshold (2.05 m) of the seasonal maximum ice thickness. Heavy ice seasons were identified in 1997/98, 2001/02, 2003/04, 2004/05, 2008/09 and 2009/10, while all other ice seasons were classed as moderate. The average 500-hPa geopotential height and sea level pressure patterns for both regimes are shown in Figure 11. We found that the polar trough over the Kara and Laptev seas was deeper during heavy ice seasons, with the southeast corner of the 5100-gpm contour located at 73° N, 115° E (Fig. 11a), whereas in the moderate seasons, the southeast corner was located at 77° N, 100° E (Fig. 11b). Meanwhile, in heavy ice seasons, the mean sea level pressure (1016–1017 hPa; Fig. 11e) was higher than in moderate ice seasons (1014–1015 hPa; Fig. 11f) near our study area. The spatial patterns of 500-hPa geopotential height and sea level pressure suggest that cold air was present further to the south. This was verified by the surface air temperature, which was 2°C lower in the heavy ice seasons than in the moderate ice seasons near the New Siberian Islands (Figs 11c, d). However, the zonal gradient of sea level pressure across the study region was largely the same in all ice seasons (Figs 11e, f), indicating that wind plays a minor role in the variation of local LFSI thickness. Thus, the impact of the large-scale atmospheric circulation is largely thermodynamic rather than dynamic.
Average fields of (a) and (b) 500-hPa geopotential height (unit: 10 gpm), (c) and (d) air temperature (unit: °C) at 2 m and (e) and (f) mean sea level pressure (unit: hPa) between October and June. Panels (a), (c) and (e) represent heavy ice seasons, and panels (b), (d) and (f) represent moderate ice seasons.
5. Conclusion
This study investigated the seasonal cycle of LFSI northwest of Kotelny Island in the East Siberian Sea using MODIS and Envisat ASAR satellite images and the HIGHTSI model. Four stages of LFSI evolution were identified based on the remote-sensing observations using VIA. The modeled ice thickness was used to quantify these stages. The VIA and HIGHTSI results yielded comparable dates for the initial ice formation, i.e. the first stage in which ice thickness grew to ~0.45 m. This stage was followed by a rapid ice growth stage that accounted for ~60% of the total ice thickness growth, i.e. 1.2–1.3 m. The third, stable stage was marked by a persistent ice area and further ice growth of 0.2–0.4 m before the onset of melting. In the study area, the local LFSI break-up occurred through fracturing and melting patterns, which could be distinguished in the remote-sensing imagery.
LFSI decay is an integral process that depends on atmospheric/oceanic forcing and ice/snow conditions. The modeled results of the snowmelt onset were in good agreement with the remote-sensing observations. During the study period of 1995–2014, the annual air temperature in the study region exhibited an increased trend of 1.6°C decade−1 (P < 0.001). The warming was most pronounced in spring and fall, resulting in earlier melting and later freezing of the LFSI. The annual maximum modeled LFSI thickness was 2.02 ± 0.12 m, exhibiting a trend of −0.13 m decade−1 (P < 0.01). On average, the duration of the complete melting of the snow cover was 33 d, but the interannual variation was considerable (i.e. 8–65 d). The duration of the ice melting period was 46 ± 12 d.
Kotelny Island is located between the East Siberian and Laptev seas, which has the largest LFSI coverage off the Arctic coastal seas. It is therefore a site of great potential to monitor the effects of a warming climate on nearshore processes. In this study, we focused on a confined coastal domain where the ice mass balance could be captured adequately by a 1-D thermodynamic snow/ice model. For regional-scale coastal studies, the use of an automated approach to LFSI detection using SAR imagery has been described in other studies (e.g. Karvonen and others, Reference Karvonen2018). Such a method could produce improved delineation of the spatial distribution of LFSI evolution, which could support regional-scale modeling of LFSI (e.g. Mäkynen and others, Reference Mäkynen, Karvonen, Cheng, Hiltunen and Eriksson2020). Future studies should consider ice ridging and stabilization, accounting for LFSI dynamics, and internal ice melting and formation of melt ponds should be examined further to improve our understanding of the evolution of ice strength during LFSI decay. For large-scale sea-ice modeling, it is important to examine the LFSI in different regions along the Siberian coast. Therefore, a unified Arctic LFSI observing network and standard observation guide similar to the Antarctic Fast Ice Network (Heil and others, Reference Heil, Gerland and Granskog2011), as well as an involvement of indigenous populations would be of great help to maintain a large-scale continuous monitoring network. The documents recorded in indigenous languages are valuable historical materials for studying the long-term changes of Arctic LFSI.
Supplementary material
The supplementary material for this article can be found at https://doi.org/10.1017/jog.2021.85
Acknowledgements
This study was supported by the National Key Research and Development Program of China (2018YFA0605903, 2019YFC1509101 and 2017YFE0111700), the National Natural Science Foundation of China (41976219 and 41722605) and the Academy of Finland under contract 317999 and the European Union's Horizon 2020 research and innovation program (727890-INTAROS). We acknowledge the use of imagery from the Worldview Snapshots application (https://wvs.earthdata.nasa.gov), which is part of the Earth Observing System Data and Information System (EOSDIS). We acknowledge ESA for offering access to the Envisat ASAR archive through the GPOD service (http://eogrid.esrin.esa.int/).
Author contributions
XC and ML initiated the research, MZ processed the satellite data, performed analyses and drafted the manuscript, BC undertook modeling and drafted the manuscript, DD provided local observations, and FH, XL and RL contributed to data analysis. All authors shared responsibility for writing the manuscript.


 Open access

