

1. Introduction
With the development of new molecular technology, a large number of genetic markers have been found and used for statistical analysis in genetics, which especially play an important role in quantitative trait loci (QTLs) mapping. Generally, statistical inference for gene mapping consists of locating gene loci relative to a set of DNA markers and estimating their effects on trait values of interest.
The problem of identifying QTL has a long history, and the ability to map QTL has been greatly improved by rapid development in the construction and refinement of the genetic map as well as the development of relevant statistical methodology. The basic principle of using a genetic marker to study QTL was well established (Thoday, Reference Thoday1961; Lander & Botstein, Reference Lander and Botstein1989; Jansen, Reference Jansen1993; Zeng, Reference Zeng1993, Reference Zeng1994; Kao & Zeng Reference Kao and Zeng1997; Kao et al., Reference Kao, Zeng and Teasdale1999), and Chen (Reference Chen2005) summarized current statistical methods for QTL mapping, among which the interval mapping (IM) method proposed by Lander & Botstein (Reference Lander and Botstein1989) was thought to be a creative work to map genes by using multiple-marker information. Based on the IM, Jansen (Reference Jansen1993) and Zeng (Reference Zeng1993, Reference Zeng1994) independently proposed the idea of combining IM with multiple regression analysis to deal with multiple QTL problems; Kao et al. (Reference Kao, Zeng and Teasdale1999) developed the multiple interval mapping (MIM) method that used multiple marker intervals simultaneously to detect multiple putative QTLs in the model for QTL mapping.
Nowadays, it is considered that the genetic variance of most quantitative traits is usually controlled by several major loci with large effects and many QTLs with very small effects (Otto & Jones, Reference Otto and Janes2000), which changes the optimization problem considerably. Aiming at some quantitative traits, however, there are numerous markers available to analyse its genetic basis. Therefore, how to jointly use these marker information to map the major QTL becomes an important issue in QTL mapping. Xu (Reference Xu2003) presented a Bayesian regression method to simultaneously estimate genetic effects associated with markers of the entire genome. However, the Bayesian shrinkage method is computationally intensive especially when the QTL genotypes are introduced into the statistical model and thus has not been widely applied to QTL mapping. Another method called the empirical Bayes method was developed by Xu (Reference Xu2007) to estimate epistatic effects under a mixed model framework, which efficiently dealt with the situation in which the potential number of effect parameters may be larger than the sample size. In fact, when the markers are abundant, it is hard to include all markers in the model due to high multicolinearity among the markers. However, Yi & Banerjee (Reference Yi and Banerjee2009) developed a computationally efficient algorithm for genome-wide analysis of QTL, which can take advantage of the special correlation structure in QTL data.
In this paper, we propose a two-step method for QTL mapping based on the idea of MIM. It can deal with the situation in which the number of genetic effect parameters may be larger or much larger than the sample size, in which a critical step is to determine the candidate markers with information, and the second step is to construct marker intervals and then estimate the QTL positions and effects by simultaneous MIM. The proposed method is a marker-assisted method. In the first step, we adopted the Dantzig selector (DS) method to select candidate markers, where the theoretical foundation of which was proposed by Candes & Tao (Reference Candes and Tao2007), and we introduced it here to deal with the problem of QTL mapping in genetics. In fact, the famous Lasso method (Tibshirani, Reference Tibshirani1996; Yi & Xu, Reference Yi and Xu2008) can also be applied to select the candidate markers. However, in theory, Bickel et al. (Reference Bickel, Ritov and Tsybakov2009) exhibited an approximate equivalence between the Lasso estimator and the DS under sparsity scenario. Therefore, we would like to resort to the new method DS to search for those key markers. Of course, it is worth to explore the option of using Lasso type of approach to replace DS in the two-step method as well. In the second step, we concentrated on the tentative MIM models used in the existing literatures, and addressed the issues of statistical inference for the MIM models. Our simulation results and real data analysis show that the following MIM approach can improve the performance of the first step selection by DS, and the proposed two-step method is a fast and efficient method.
2. Theory and method
A backcross (BC) or an intercross population is usually considered in IM for experimental organisms. In order to obtain a BC or an intercross population, two parental inbred lines P 1 and P 2 with significant difference in a quantitative trait of interest are obtained first. Let loci L, with alleles L and l, and U, with alleles U and u, denote two flanking markers for an interval where a putative QTL is being tested, and the QTL is denoted by locus Q, with alleles Q and q. A cross between the two inbred lines is performed to produce an F 1 generation. Backcrossing the F 1 individuals to P 1 or P 2 will produce a BC population in which there are two possible genotypes at each locus. Intermating the F 1 individuals themselves will produce an F 2 population, and there are three possible genotypes at each locus.
In this paper, we consider the statistical inference under given tentative models, and we mainly consider the following two cases when the number of model effects is larger than the sample size in different degrees.
(i) When the number of model effects is much larger than the sample size
Let Yi for i=1, …, n be the phenotypic value of ith individual in a mapping population, where n is the sample size. Let p denote the number of markers. Since the number of marker loci is sufficiently large, we may think that the true QTLs are very near to their flanking markers and the markers will partly absorb the effects of the QTL, respectively. The linear models
for a BC or a double-haploid (DH) population and
for an F 2 population are considered, where μ is the mean effect, bj is the QTL effect associated with the jth marker, Gij denotes the genotype value of the jth marker of the ith individual and ∊ i is a random error in equation (1); and aj is the additive QTL effect, dj is the dominant QTL effect associated with the jth marker,
in eqn (2). If there are interactions among the QTL, then the models would include product terms of variables GQij . We assume that ∊1, …, ∊ n are independently and identically distributed, and follow a normal distribution with mean zero and variance σ2.
For model (1) or (2), it is usually difficult to estimate the parameters of interest in statistics because p>>n. Fortunately, in multivariate regression and from a model selection view, Candes & Tao (Reference Candes and Tao2007) proposed an effective method called DS. In detail, for linear model y=Xn ×pβ+z, where β∊Rp is a parameter vector (p>>n), X is a data matrix and z is an error vector. The DS estimator is the solution to the l 1 regularization problem
The estimator can achieve a loss within a logarithmic factor of the ideal mean – squared error, and it can well handle the situation where the number of variables or parameters is much larger than the number of observations n in a linear model. It selects the best subset of variables, by solving a very simple convex problem, which can easily be recast as a convenient linear programming problem. Strictly speaking, the DS method solved a question of importance in statistics because of its high efficiency. In fact, it can handle the genetical problem here, because the true parameter vector here is sufficiently sparse in general. Due to the above merits, we take advantage of the DS method to estimate the effect parameters in models (1) and (2). After computation using the DS method, we will obtain the estimates of QTL effects, many of which are in fact zero. Since the makers are dense, it is not necessary to further obtain the estimate of their positions. In section 3, we will utilize this method to handle a real data set for illustration purpose.
(ii) When the number of model effects is larger than the sample size but moderate
The QTLs are considered to lie within some marker intervals when the number p of the selected markers is moderate. However, it is hard for the conventional mapping method to work because p>n. Under the shrinkage estimation framework, Xu (Reference Xu2003) investigated the estimation problem of QTL effects using the Bayesian shrinkage method, and the author (2007) further considered how to estimate all the main effects and the epistatic effects of QTL using an empirical Bayes method. Based on the idea of MIM, next we will present a two-step method that can estimate QTL effects as well as their positions simultaneously, which is different from the conventional MIM.
Each marker interval is assumed to contain at most one QTL. For an interval, let the recombination fractions between the left and right marker, between the left marker and the putative QTL in the interval and between the putative QTL and the right marker be denoted, respectively, by rLU , rLQ and rQU . Throughout the paper, we assume that there is no crossover interference, and therefore, rLU =rLQ +rQU−2rLQrQU . For the case that crossover interference is present, the reader is referred to Zhou (Reference Zhou2010) . We also assume that double–recombination events within the interval are rare and can be ignored.
Firstly, we use an intercross population as an illustrative example, and the results for an intercross population can be extended easily to a BC population. In an intercross population, there are nine possible genotype combinations for the flanking markers of an interval. The marker genotype combinations, their expected frequencies and the conditional QTL genotype frequencies given marker genotype combinations can be seen in Table 1.
Conditional probabilities of the genotypes of an putative QTL given the flanking marker genotypes for an F2 population
Note: r=rLQ /rLU .
Let GLU denote the marker genotype combination. The possible values of GLU are listed in the first column of Table 1. Let GQ denote the genotype of the putative QTL in the marker interval whose possible values are QQ, Qq and qq. Note that the GQ is not observable. Next, our two-step method of mapping QTLs is illustrated as follows:
Step I: Reduce the dimension of markers.
In general, marker effect has some relationship with the effect of some QTL close to the marker and the recombination fraction between them. The marker effect will partly absorb the effect of QTL close to it. For a BC population, Broman (Reference Broman2001) pointed out that ΔM=(1−2rMQ )ΔQ, where ΔM is the effect of marker M (the difference between the phenotype averages for the two marker genotype groups) and ΔQ is the effect of QTL Q. For an F 2 population, we have obtained a similar conclusion. For simplicity, we suppose that the dominance effect d=0 (additive model). Suppose that the individuals with QTL genotype QQ, Qq and qq have average phenotypes μ QQ , μ Qq and μ qq , respectively. In detail, μ QQ =2 a, μ Qq =a and μ qq =0 (see model (3) in the following content). Consider a marker locus M which is away from the QTL with a recombination fraction rMQ . Thus, the individuals with genotype MM have average phenotype μ MM =(1−rMQ )2 μ QQ +2rMQ (1−rMQ ) μ Qq +r MQ2 μ qq . Similarly, the individuals with marker genotype Mm have average phenotype μ Mm =rMQ (1−rMQ )μ QQ +(r MQ2+(1−rMQ )2)μ Qq +rMQ (1−rMQ )μ qq . So the difference between the phenotype averages for the two marker genotype groups, i.e.,
The marker effects in the other two cases also have similar results. Therefore, from the expression we conclude that the markers that are near to some QTL relatively have larger effects when the QTL effects are fixed, and we can utilize the model in eqn (2) to find and retain the markers with larger effects by the DS method, and delete those with small effects (we will discuss how to decide the number of selected markers later).
Step II: Construct marker intervals and estimate all QTL parameters simultaneously.
After Step I, we use the selected markers with large effects as well as their neighbour markers to construct marker intervals, through which we will perform the following MIM procedure. Suppose m marker intervals are constructed. We consider the following statistical model including m intervals:
where G Qij denotes the genotype value at the jth QTL of the ith individual, for simplicity, we define
The explanations for other variables and parameters are the same as those in model (2). Model (3) implies that, given GQi
=(GQi
1, …, GQim
)′, Yi
follows a normal distribution with mean ![]() and variance σ2. At the same time, given that GLUi
=(G LUi1, …, GLUim
), G Qi1, …, GQim
are independent and follow trinomial distributions with probabilities given in Table 1. Let rLUj
, rLQj
denote the recombination fractions for interval j, and let Θ denote the totality of parameters, then the likelihood for Θ given the data can be written as
and variance σ2. At the same time, given that GLUi
=(G LUi1, …, GLUim
), G Qi1, …, GQim
are independent and follow trinomial distributions with probabilities given in Table 1. Let rLUj
, rLQj
denote the recombination fractions for interval j, and let Θ denote the totality of parameters, then the likelihood for Θ given the data can be written as
![\eqalign{ L\lpar \rmTheta \vert X\rpar \tab \equals \prod\limits_{i \equals \setnum{1}}^{n} \left[ {\mathop\sum\limits_{\lpar k_{{i\setnum{1}}} \comma \ldots \comma k_{{im}} \rpar } \prod\limits_{j \equals \setnum{1}}^{m} P\lpar G_{Q}^{ij} \equals k_{ij} \vert G_{LU}^{i} \comma r_{LQ}^{j} \rpar } \right. \cr \tab \hskip 5pt\left. { \times \phi \lpar y_{i} \comma \mu \ \lpar k_{i\setnum{1}} \comma \ldots \comma k_{im} \rpar \comma \sigma ^{\setnum{2}} \rpar } \Bigg]\comma \cr}](https://static.cambridge.org/binary/version/id/urn:cambridge.org:id:binary:20160920235900076-0410:S0016672310000650:S0016672310000650_eqn4.gif?pub-status=live)
where X denotes the observed data of n individuals taken at random from an intercross population, say X={(y i, GLUi ), i=1, …, n}; the summation term in (4) is over the set {(k i1, …, kim ): kij =0, 1, 2, j=1, …, m}, and so it is a normal mixture of 3m components (unobservable QTL genotype combinations); φ(y, μ, σ2) denotes the density function of the normal distribution with mean μ and variance σ2.
To deal with the normal mixture model (Mclachlan & Peel, Reference Mclachlan and Peel2000) and also an incomplete-data problem, we utilized the expectation–maximization (EM) algorithm (Dempster et al., Reference Dempster, Laird and Rubin1977) to estimate Θ. The EM algorithm exhibited many advantages in the mapping of QTL, and therefore many authors chose and used it in practice. However, different from general MIM strategies, we simultaneously computed the maximum-likelihood estimation (MLE) of QTL effects and positions based on the EM algorithm (Chen, Reference Chen2005).
We first augment X by the unobservable variable set {GQi =(G Qi1, …, G Qim), i=1, …, n}, and the complete data T={(yi , GLUi , GQi ), i=1, …, n} are obtained. Then, the complete data log-likelihood l(Θ|T) is given by
where y=(y 1, …, yn )′, W=(W 1, …, Wn )′, Wi =(G Qi1, …, GQim , ZQi 1, …, ZQim )′, b=(a 1, …, am , d 1, …, dm )′, and 1 be a vector of elements all 1. Next, we concretely estimate all parameters of interest using the iterative algorithm.
E-step: Given X and Θ(k), compute the conditional expectation of l(Θ|T) on the incomplete data. In fact, we need to compute E(GQij |X, Θ(k)), M 1≜E(W|X, Θ(k)), and M 2≜E(W′W|X, Θ(k)). The elements of M 1 and M 2 can be calculated based on the conditional distributions of those unobservable variables. Note that Z Qij is the function of GQij , and so E (ZQij |X, Θ(k)) can be obtained by E (GQij |X, Θ(k)) correspondingly.
M-step: Maximize the conditional expected log likelihood E (l(Θ|T)|X, Θ(k)) to obtain Θ(k+1). The iterative expressions of the (k+1)th step parameter estimates are given by
where ![]() . The derivation of r LQj(k+1) is a little complex. After some elaborate computation, we obtain that
. The derivation of r LQj(k+1) is a little complex. After some elaborate computation, we obtain that
where ![]() ,
, ![]() , s=2, 3, 4, 6, 7, 8, t=0, 1, 2 and a t(k)ij=P(GQij
=t|X, Θ(k)).
, s=2, 3, 4, 6, 7, 8, t=0, 1, 2 and a t(k)ij=P(GQij
=t|X, Θ(k)).
When the EM iteration converges, the MLEs of QTL parameters would be obtained. Note that the recombination fractions are estimated directly in our method, instead of scanning point by point on the chromosome as is usual in the IM procedure. If BC population is considered, the same two-step procedure can be performed correspondingly. The main difference lies in the expressions of the estimates of recombination fractions in Step II.
3. Example
Here we tested the feasibility of using the proposed two-step method to estimate the main and epistatic effects of QTL. The well-known barley data set from the North American Genome Mapping Project (Tinker et al., Reference Tinker, Mather, Rossnagel, Kasha and Kleinhofs1996) was used for demonstration. The DH population contained 145 lines (n=145); each was grown in a range of environments. A total of 127 mapped markers (p=127) covering about 1500 cM of the genome along seven linkage groups were used in the analysis. Seven traits were included in the data, and the phenotype of kernel weight across the environment was analysed here, which has also been investigated by Xu (Reference Xu2003, Reference Xu2007). It is noted that including μ, the main and epistatic effects, the total number of model effects is 1+127+C 1272=8129, which is typically many times larger than the sample size. Here the epistatic effects need to be added into model (1), i.e., the current model is
where bjk denotes the epistatic effect between marker j and k; the genotype of markers are recoded as 1 for genotype AjAj (one parent), and −1 for genotype BjBj (the other parent).
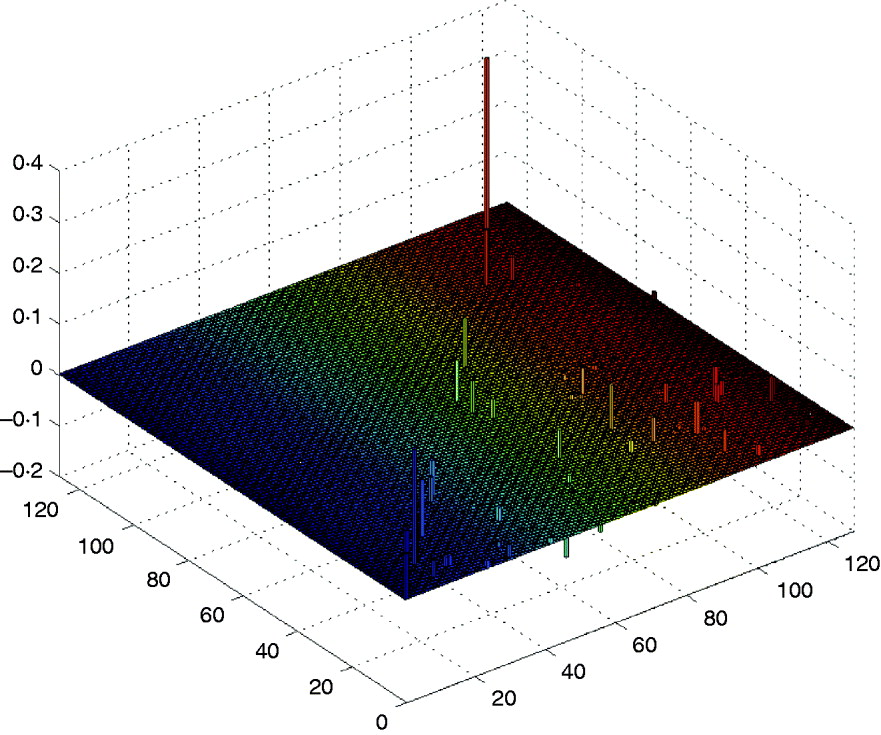
First, we performed Step I, i.e., the DS method was used to find and retain the markers with larger effects in the above model. After computation, the method detected six markers with main effects whose absolute values are greater than 0·095, and some makers have a little smaller epistatic effects. The computation took about 0·503 s on a P IV computer to detect those main effects, and it would need a little more time to detect the trivial epistatic effects. Here, we mainly listed the larger effects of the QTL in Table 2, and all the estimated QTL effects for the barley kernel weight are plotted in Fig. 1. In the 3D figure, the numbers on the two axes in the horizontal plane indicate the marker IDs (j, k=1, …, 127), and the height of each prism indicates the estimated values of QTL effects (up for positive effects and down for negative effects). When j=k the estimated value is a main effect, otherwise it is a epistatic effect.
The estimated QTL effects for the kernel weight in barley. The numbers on the two axes in the horizontal plane indicate the marker IDs (j, k=1, …, 127), and the height of each prism indicates the estimated values of QTL effects (up for positive effects and down for negative effects).
The estimated results of QTL effects for the kernel weight in barley
It can be found that the results are similar to those in Xu (Reference Xu2007) . From Table 2 and Fig. 1 we find that the main effects are the major contributors to the phenotypic variance, where the maximum main effect explains approximately 18% of the phenotypic variance; and whether a locus interacts with the other locus does not depend on whether the locus has a main effect or not.
At the same time, it is worth mentioning that the first three markers detected by the DS method are exactly consistent with the reported results in the published paper (Tinker et al., Reference Tinker, Mather, Rossnagel, Kasha and Kleinhofs1996), and the corresponding effects of the three markers were not brought by their markers of the neighbourhood. However, in Xu's paper (Reference Xu2007) the effects of markers 2, 12 and 102 were estimated from markers 1, 11 and 101, respectively.
Yi & Banerjee (Reference Yi and Banerjee2009) also analysed the data set. Their method detected some main effects, and they gave the corresponding position estimates of QTL at the same time. Here, we further performed Step II of our method, and then position estimates of the six detected QTLs are obtained, respectively: 7@6·5, 1@95·91, 1@3·15, 1@178·11, 3@25·71, 5@124·2, where the notation for positions, e.g., 7@6·5 indicates chromosome 7, position 6·5 cM. Obviously, the results are favourable complementarity for the estimates of marker effects in Step I. In addition, from the results we find that the proposed method performs comparably with the existing sophisticated methods.
4. Simulation
In this section, simulation studies are performed to illustrate and evaluate the proposed two-step method for QTL mapping, and compare it with the existing MIM method. A BC population is used for analysis.
In the simulations, we consider the situation that a trait is contributed by two QTLs located on a genome composed of 10 chromosomes, where there are totally 1000 uniformly spaced makers on the genome (100 markers on each chromosome). The sample size n=150 is chosen, and so the number of markers is timely larger than the sample size here. We consider two simulated scenarios by taking the heritability h 2=0·3 and h 2=0·5, respectively. We take 0·1 as the true values of the recombination fractions of all marker intervals in order to generate maker genotype combinations (or GLU ). Let Θ0=(r LQ10, r LQ20, σ02, μ0, b 10, b 20) denote the true value of parameter vector Θ, and the true values of the parameters are all listed in Tables 3–6. The quantitative trait values are generated from the statistical model
where ∊ i 's are independently and identically distributed normal errors with mean zero and variance σ02. Then the data {(yi , GLUi ), i=1, …, n} of n individuals are obtained. The simulated maker genotype data and the QTL phenotype data are used to map the QTL.
(i) Evaluation on detection powers
In each scenario of this simulation, we suppose that the two simulated QTLs lie within the 5th and 77th marker interval on chromosome 1, respectively, the position and effect parameters of which are provided in Table 3. The proposed two-step method was used to analyse the randomly generated data. To evaluate the detection ability of the proposed method, it was firstly employed to estimate all marker effects in Step I based on the phenotype data and all marker genotype data, and we here retained the four, five, six and ten largest-effect markers, respectively. Therefore, we can determine the most possible marker intervals (the numbers of marker intervals are 8, 10, 12 and 20, respectively, see Table 3). To show the detection efficiency, we listed the coverage rates of the marker intervals selected by the two-step method. Here the coverage rate CR(i) of the marker intervals is defined as the proportion of covering/detecting i true QTL by the selected marker intervals. Over the 1000 replicates, where i=1, 2 and the cumulative coverage rate CSUM is the proportion that the selected marker intervals can detect at least one true QTL over the 1000 replicates.
The simulated coverage rates by the proposed method
a m: the number of the retained marker intervals; bCR(i): the coverage rate that the selected marker intervals cover i QTL (i=1, 2); cCSUM: the cumulative coverage rate. The true values of parameters are μ=0, b 1=0·64, b 2=1·14, σ2=1, r 1=0·02, r 2=0·02 for h 2=0·3; and μ=0, b 1=0·90, b 2=1·78, σ2=1, r 1=0·02, r 2=0·02 for h 2=0·5.
It can be seen from the simulation results in Table 3 that the coverage rates of the marker intervals decided by the proposed method are satisfactory. Take the fourth case when h 2=0·3 in Table 3, for example, on average the two-step method detects only one QTL for 620 times, and thoroughly detects two QTLs for 230 times and thus detects at least one QTL for 850 times (cumulative coverage) over 1000 simulations. As expected, the coverage rate increases with the increase in the heritability. When h 2=0·5, the corresponding coverage rates, respectively, reach 67, 24 and 91% in the same case (see Table 3). The simulation results also show that the coverage rate increases to some degree with the number of retained markers in Step I.
To concretely evaluate the powers of detecting QTL by the new method, we also presented the true positive rates (TPRs) of detecting QTL over the 1000 simulation replicates for each scenario (see Table 4). At the same time, when h 2=0·3, the false–positive rates (FPRs) for each negative marker are all less than 0·05, except for marker 76 (FPR=0·06), that is, because the marker is very close to QTL 2 and is prone to be included in the mapping model. When h 2=0·5, the results are similar. By comparison, we find that the TPRs of our method are close to the ones obtained by the existing MIM method; however, the FPRs of the MIM method can hardly be controlled. This showed the the new method had special advantages.
The simulated true–positive rates for the proposed method
a m: see the explanation in Table 3.
In addition, if the above statistical model includes two QTLs from two different chromosomes, similar results can also be obtained based on our simulation experience.
(ii) Evaluation on estimation precisions
In this part, for each scenario of heritability above, we further evaluate the estimation precisions based on the genotype data of the selected marker intervals which we just obtained and the phenotype data. Here we also consider another case, i.e., two QTLs are located on different chromosomes, one of which lies within the fifth marker interval on chromosome 1, and the other lies within the 77th marker interval on chromosome 3. For this case, 1000 samples are generated, and we also first select those significant markers by the proposed method.
Based on the simulated genotype data of the selected marker intervals and the phenotype data we, respectively, computed the MLEs of all parameters by our proposed method and using the existing MIM method directly. We obtained the averages of MLEs and also correspondingly compute the estimated mean square error (MSEs) of each parameter. The simulation results are provided in Tables 5 and 6 for h 2=0·3 and h 2=0·5, respectively. (Since both the methods provided some false–positive intervals, we utilized those detected true intervals to map QTL and compare the corresponding precisions to ensure their comparison base.) From the results we can find that the averages of MLEs of QTL effects and positions by the proposed method are very close to the corresponding true values of parameters in each case, and in most cases the new method outperforms using the MIM directly for estimating the parameters (the estimates obtained by the new method have smaller MSE than the existing method). Only in case 2 of heritability h 2=0·3, the estimated results using the new method are a little worse for the estimation of some parameters (i.e. when the simulated QTLs are located on different chromosomes).
Simulation results by the proposed method and MIM for the BC samples of 150 individuals (h2=0·3)
a Two simulated cases (Case 1: two QTLs are located on a single chromosome; Case 2: they are located on two different chromosomes). b Mean: the average of MLEs; c the MIM method cannot provide an estimate of μ.
Simulation results by the proposed method and MIM for the BC samples of 150 individuals (h2=0·5)
Accurate MLEs of QTL effects are important in practice, because the estimated QTL effects can impact the test of the existence of QTL that contribute to some trait. And also, the estimated QTL positions by IM may provide the researchers some reference before cloning a QTL.
We also find that the estimates provided by the proposed method become more accurate with the increase in heritability (i.e. corresponding MSEs decrease for most parameters) by comparing the results listed in the two tables. Our experience also shows that the estimates will become accurate with increase in the number of observations, but the results are not very significant since the number of marker effects is still larger than the sample size.
Although we evaluate the proposed method from different aspects, the two steps of our method supplement each other. If the detection power in Step I is high, then the QTL parameters can also be inferred in reasonable intervals in Step II. At the same time, Step II also supplements the estimates of QTL effects and positions in QTL mapping, and therefore the whole mapping power of the method will be high. In fact, the true positive is consistent with the detection power in existing documents, and so it is not only an evaluation for Step I but also a measure for the whole QTL detection in a certain sense.
In addition, the computational amount of the MIM method is bigger than that of the new method, especially when the number of markers is larger, and therefore the computational speed of the former is slower than the latter. In the above simulations, the average computing time per replicate is 27·81 s for the new method, but 64·43 s for the MIM on a P IV computer. Although the number of markers increases more, the new method can also be applied to search QTL in gene mapping. Yet, the existing MIM seems infeasible for the practical reason that p>n, e.g., when h 2=0·3 and there are ten QTLs that are responsible for a trait, in general the MIM can only detect three QTLs and two of them are close to their true positions from our additive simulation.
All in all, the simulation results suggest that the proposed two-step method is an efficient mapping method. It resolves the estimation problem that the number of QTL effect parameters is (much) larger relative to the sample size, and it can give reasonable estimates of QTL positions simultaneously based on the idea of IM. Therefore, it can be used in current genome-wide QTL mapping, and can be a better alternative for MIM and the Bayesian mapping method.
5. Discussion
In this paper, we developed a two-step method for mapping QTL based on the conventional MIM. The method may deal with the situation that the number of QTL parameters is larger than the sample size in practice, and the simulation results show that the performance of the proposed method is satisfactory, i.e., it has its advantages over the existing method. When the number of QTL parameters is much larger than the sample size, we suggest directly using the DS method (Candes & Tao, Reference Candes and Tao2007) to handle the case. Through the analysis of a real data set, we found that the proposed two-step method is really an efficient method, and the DS method can be used in the marker-assisted QTL analysis. Both methods may detect the true trait loci with larger probability and therefore can be used in the genome-wide searching of QTL according to their performance.
Xu (Reference Xu2007) used the empirical Bayes method to estimate QTL main effects of all markers and all pairwise epistatic effects for the barley data set. Xu's method is also fit for the problem that the number of QTL parameters is (much) larger than the number of observations, and is computationally efficient. However, the two-step method has its own advantage, i.e., it can estimate QTL effects and positions simultaneously from relatively finite data, which may potentially improve the accuracy of parameter estimation (Chen, Reference Chen2005), and the estimates of QTL positions would be helpful to further fine mapping. Based on the obtained MLEs of QTL parameters, all pertinent hypotheses testing can also be performed further.
Yi & Banerjee (Reference Yi and Banerjee2009) developed computationally efficient algorithms for genome-wide analysis of QTL, which showed good performance, e.g., they proposed a novel model search strategy to look for the most significant markers near to the true QTL, and the computing speed is faster than the Markov Chain Monte Carlo (MCMC) method. However, our two-step method maintains some advantages of IM, and can therefore detect the true QTL within some intervals (if the markers are denser, say <10 cM, the estimated results by the proposed two-step method should be close to those by Yi & Banerjeee's method). Moreover, the new method avoids complex model search, and so its computing amount is not much and the computing speed is faster than the conventional MIM method from the results of our simulation studies.
Similar to the conclusion about BC population given by Broman (Reference Broman2001), we have proved the fact that marker effect has some relationship with the effect of some certain QTL close to it and the recombination fraction between them for an F 2 population, i.e. Δ M =(1−2rMQ )Δ Q . When the QTL effect is fixed, the marker nearer to the QTL has larger marker effect. So it is reasonable to think that marker effect may partly absorb the effect of QTL near it. The relationship is exactly the theoretical basis for the Step I of the proposed method.
One remaining question is deciding the number of selected/retained markers in Step I. In practice, Yi & Banerjee's idea (Reference Yi and Banerjee2009) can be adopted, i.e., we can set a very small threshold value t in advance and delete genetic effects satisfying ![]() from the estimates obtained in Step I, and the P-values for testing bj
=0 are further used to build a parsimonious model, which is flexible and simple to operate. Of course, our experience shows that there is no unique answer in choosing an optimal number. If there is weak linkage disequilibrium (LD) between adjacent markers, a smaller number can be taken (i.e. 4–10). If there is strong LD between adjacent markers, the optimal number should be much larger because more information is needed to separate linked QTL. If there is some prior information about the number of QTLs that can be used, the efficiency of the proposed method would be higher. In conclusion, we need further investigation on choosing the optimal number.
from the estimates obtained in Step I, and the P-values for testing bj
=0 are further used to build a parsimonious model, which is flexible and simple to operate. Of course, our experience shows that there is no unique answer in choosing an optimal number. If there is weak linkage disequilibrium (LD) between adjacent markers, a smaller number can be taken (i.e. 4–10). If there is strong LD between adjacent markers, the optimal number should be much larger because more information is needed to separate linked QTL. If there is some prior information about the number of QTLs that can be used, the efficiency of the proposed method would be higher. In conclusion, we need further investigation on choosing the optimal number.
In Step II, the markers with larger effects are used to construct candidate marker intervals for IM. In our simulation we chose four different number of markers with the largest effect to construct candidate marker intervals, and the cumulative coverage rate of the true QTL can attain 91% when the number of retained significant marker loci is 10 and h 2=0·5. Of course, if two more intervals were added to the analysis, the coverage rate of the true two QTLs would increase as expected, but choosing too much marker interval is not necessary in fact.
During the description of the proposed two-step method, we consider only the additive model. Yet, despite this, our method can also be used in other models with interaction, and therefore both the main effects and the interaction effects can be estimated simultaneously. In the analysis of the example, we did successfully estimate all main effects and all possible interaction effects for the known barley data.
The proposed method also has some shortcomings. In Step II of the proposed method, we only consider mapping QTL from the aspect of linkage information, but not thinking much of the information about the genetic structure of the population such as LD. Recent studies show that joint modelling of the linkage and LD between markers and QTL may substantially enhance the analytical power and precision compared to the pure IM (Lund et al., Reference Lund, Sorensen, Guldbrandtsen and Sorensen2003; Lou et al., Reference Lou, George, Rory, Mark and Wu2005). So substantial extensions of IM into more general situations are worth studying further in the framework of the two-step method. In addition, the proposed method is only fit for the experimental populations such as BC, DH and F 2 populations, and so one method applicable to more general population is expected to develop.
The authors also would like to thank the Joint Editor and referees for comments that greatly improved the presentation of the paper. This research was supported by the Mathematical Tianyuan Foundation of China (No. 10926174), the Overseas-Returned Scholars Foundation of Department of Education of Heilongjiang Province (1152HZ01), and the Scientific Research Foundation of Department of Education of Heilongjiang Province of China (No. 11551367).


