



INTRODUCTION
Recently, Bhatt et al. [Reference Bhatt1] estimated that there were nearly 390 million [95% credible interval (CrI) 284–528] dengue infections annually in 2010, of which up to 96 million (95% CrI 67–136) developed clinical or subclinical symptoms with different levels of severity. On the other hand, Asia bore 67 (95% CrI 47–94) million apparent infections (~70%) of this burden [Reference Bhatt1]. The high disease prevalence, lack of a registered vaccine or other prophylactic measures, and absence of specific treatment make dengue fever a great threat to public health globally [Reference Kyle and Harris2]. The viruses and their predominant mosquito vector, Aedes aegypti (yellow fever mosquito), are endemic to most of the tropical and subtropical regions of the world [Reference Descloux3].
Southern Taiwan is located in a tropical region with relatively high temperature and relative humidity (RH) year-round, forming an ideal condition for the growth of the vector of dengue fever, i.e. mosquito. Historical epidemics of dengue in Taiwan have been documented in 1902, 1915, and 1922 in Penghu Islet; in southern regions of Taiwan in 1924, 1927, and 1931; and throughout the island during 1942–1943 [Reference King4]. The most well known dengue outbreaks in Taiwan have varied since 1987 in that the prevalence has been higher in southern Taiwan [Reference King4]. In general, dengue epidemics have occurred in Taiwan annually for the past decade and the largest epidemic occurred in southern Taiwan in 2002 with 52 imported and 5336 indigenous cases that peaked around September–December [Reference Lin5, 6].
Patterns of dengue infection vary over time owing to the effects of extrinsic, e.g. climate [Reference Descloux3, Reference Lambrechts7–Reference Racloz9] and intrinsic, e.g. predictor–prey dynamics between the pathogen and the host population [Reference Racloz9–Reference Yang11], and immunity and viral factors [Reference Gubler12, Reference Luz13]. Incidence patterns reflect the complex interactions of all these factors. Wu et al. [Reference Wu14] indicated that weather variability such as monthly maximum and minimum temperatures, rainfall, and RH are identified as meaningful and significant indicators for the increasing occurrence of dengue fever in the Taiwan region. Chen et al. [Reference Chen15] indicated that warmer temperature with 3-month lag, elevated humidity with high mosquito density increased the transmission rate of dengue fever infection in southern Taiwan. Lambrechts et al. [Reference Lambrechts7] revealed that short-term temperature fluctuations had significant impact on dengue virus transmission by female A. aegypti.
The dynamics in mosquito–human dengue transmission is a complex process involving many potentially important factors. For vector-borne diseases, the vectorial capacity (V) or the basic reproduction number (R 0) is usually used to characterize the key components involved in vector–human transmission dynamics [Reference Lambrechts7, Reference Chowell16–Reference Massad18]. V captures key parameters of an insect's role in pathogen transmission, whereas R 0 characterizes the number of secondary cases generated by a primary infectious case via the vectors in an entirely susceptible population [Reference Anderson and May19]. R 0 can be determined by a range of entomological and epidemiological parameters [Reference Lambrechts7, Reference Racloz9, Reference Chowell16–Reference Massad18, Reference Barbazan20]. Moreover, R 0 is a key epidemiological determinant that provides an index of transmission intensity and establishes threshold criteria for control practices [Reference Chowell16].
The key factors used to determine V and R 0 include vector density, vector biting rate, vector survival probability, extrinsic incubation period (EIP) of the parasite within the mosquito, transmission coefficients between vector and human, and recovery rate of hosts from infection. In infinite human populations, heterogeneous biting increases R 0 because humans who are bitten most often are also most likely to become infected and then, by infecting a large number of mosquitoes, amplify transmission [Reference Smith10]. On the other hand, temperature fluctuations have important impacts on the time whenever mosquitoes become infectious and hence impact on R 0 and V [Reference Lambrechts7, Reference Barbazan20].
It is recognized that the interactions between coupled mosquito−human population dynamics and dengue transmission play an important role in the development of dengue fever. A variety of mathematical and computational models have been proposed for elucidating the nonlinear transmission dynamics and for enhancing our understanding of the within-host spread of diseases [Reference Luz13, Reference Coelho17, Reference Massad18, Reference Keeling and Rohani21–Reference Newton and Reiter24].
The incidence of dengue fever in Taiwan varies widely from year to year, showing nearly a tenfold difference between years, indicating that the presence of non-stationarity and nonlinearity exists in incidence data. Hence, the transmission and population dynamics of dengue fever in southern Taiwan are poorly understood. The purpose of this study was to develop a R 0-based probabilistic risk framework by incorporating the dynamic model of vector–human dengue transmission to predict dengue infection risk in southern Taiwan. To examine the dengue population dynamics and potential risk of infection, a well-established mathematical model of dengue transmission was adopted to study the potential impact of dengue transmission on infection risk. The implications on the dengue vector control were also discussed.
MATERIALS AND METHODS
Study data
Here we used the city of Kaohsiung, a major dengue epidemic area, located on the southwestern coast of Taiwan (22° 48′ N to 23° 47′ N, 120° 176′ E to 121° 05′ E) as a study area. Kaohsiung is the second largest metropolitan area with a typical tropical climate. Thus, Kaohsiung is a densely populated region (~2·78 million persons within a total area of 3000 km2) with very high suitability for dengue transmission and can provide adequate data for setting the model parameters.
All monthly confirmed dengue cases were provided by the Taiwan Center of Disease Control (Taiwan CDC; http://www.cdc.gov.tw) for the period 2004–2009 including indigenous and imported cases. Monthly dengue incidence rates per 100 000 population were estimated from monthly confirmed dengue cases over the specific year-end population size. The monthly maximum, mean, and minimum temperatures in Kaohsiung during 2004–2009 were used. Here the monthly minimum and maximum temperatures are defined as the monthly average of the daily minimum and maximum temperatures, respectively. The time-series temperature profiles were adopted from the Center Weather Bureau, Taiwan (http://www.cwb.gov.tw/V7/index.htm).
Dengue−mosquito−human transmission model
By studying a model of dengue−mosquito−human transmission dynamics built on past well-developed models [Reference Luz13, Reference Coelho17, Reference Massad18, Reference Burattini22–Reference Newton and Reiter24], we explored the consequences of vector–host interactions involving in two levels: (i) mosquito population dynamics and (ii) human population dynamics. The essential features of the present model are depicted in Figure 1. The system of ordinary differential equations corresponding to the model in Figure 1 is listed in Table 1 [equations (T1)–(T8)].
Mosquito–human dengue transmission model describing the interaction of (a) mosquito population and (b) human population dynamics in the present study.

Summary of governing equations for dynamic model of mosquito–human dengue transmission (Fig. 1) and basic reproduction numbers

μ h, Human mortality rate (d−1); N h, total human population; B, biting rate (d−1); β mh, transmission probability from vector to host per bite (bite−1); ν h, intrinsic incubation rate (d−1); η h, mean viraemic rate (d−1); μ b, number of eggs at each deposit per capita (d−1); K, maximal capacity of larvae; η A, average aquatic transition rate (d−1); μ A, average aquatic mortality rate (d−1); β hm, transmission probability from host to vector per bite (bite−1); μ m, average mortality rate for mosquito in adult stage (d−1); ν m, extrinsic incubation rate (d−1); S m(0), initial value of susceptible mosquitoes.
* Adopted from Dumont et al. [Reference Dumont, Chiroleu and Domerg25].
Figure 1 depicts the dengue transmission dynamics characterized specifically in terms of the biting rate of mosquitoes and the transmission probabilities following a bite. Briefly, the mosquito's life cycle is divided into an aquatic phase (A m) and adult female stages (Fig. 1 a). The immature period of the aquatic phase is divided into eggs, larvae, and pupae. Adult female mosquitoes may be (i) uninfected and susceptible (S m); (ii) exposed and carrying dengue viruses but not yet capable of transmitting dengue (E m); or (iii) carrying the viruses and fully infectious (I m).
The aquatic phase converts to the adult female stage at an average transition rate η A (d−1). Parsimoniously, we used aquatic phase (A m) to represent the immature period and assumed that aquatic phase and all adult stages suffer the average mortality rate of μ A and μ m (d−1), respectively. Moreover, it is assumed that adult female mosquitoes lay eggs at the same average rate μ b (d−1). Uninfected adult female mosquitoes acquire infection at a rate dependent on the force of infection (λ h, d−1) and the extrinsic incubation rate (ν m, d−1). The force of infection resulting from humans (λ h) depends on the biting rate of mosquitoes (B, d−1), the transmission probability from host to vector per bite (β hm, bite−1), and the infected humans (I h). Thus λ h can be expressed as Bβ hm I h/N h where N h is the total human population.
The susceptible-exposed-infectious-recovery (SEIR) model was used to simulate the demographic dynamics of the human population dengue transmission in Kaohsiung with an assumption of equal birth and mortality rate μ h (d−1) (Fig. 1 b). Susceptible individuals (S h) acquire infection at the force of infection rate (λ m, d−1), that depends on the biting rate of mosquitoes (B), the transmission probability from vector to host per bite (β mh, bite−1), and the infected mosquitoes (I m). Therefore, λ m can be written as Bβ mh I m/N m, where N m is the total mosquito population. The exposed humans (E h) acquire infection at a rate ν h (d−1) depending on the duration of the intrinsic incubation period. Most infected individuals (I h) recover at a rate η h (d−1) into a resistant compartment (R h).
Studying the force of infection rates of λ h and λ m, biting rate is seen as the most crucial parameter needing to be estimated. Barbazan et al. [Reference Barbazan20] indicated that the daily biting rate can be calculated from the duration of the gonotrophic cycle (GC) as B = 1/GC, where GC is the time spent in digesting a bloodmeal and for eggs to reach maturity between two bloodmeals. Focks et al. [Reference Focks26] used enzyme kinetics to determine the temperature-dependent gonotrophic development rate (i.e. 1/GC). Here we analogized the temperature-dependent gonotrophic rate as the biting rate based on the GC concept. In doing so, the temperature-dependent biting rate has the form as [Reference Focks26],
 $$B(T(t)) = B(298K)\displaystyle{\matrix{(T(t)/298K)\exp [({\rm \Delta} H_A /R) \cr \times(1/298K - 1/T(t))] } \over \displaystyle{\matrix{1 + \exp (({\rm \Delta} H_H /R) \cr \times (1/T_{1/2H} - 1/T(t)))}}},$$
where B(T(t)) is the biting rate per mosquito (d−1) at temperature T (K) on day t, B(298 K) is the biting rate at 298 K (d−1), T is temperature (K), T ½H is the temperature (K) when half of the enzyme is deactivated from high temperature, ΔH A and ΔH H are the thermodynamic enthalpy changes (cal mol−1), and R is the universal gas constant (1·987 cal mol−1 K−1).
R 0 estimations
R 0 in dengue−mosquito−human dynamics is the product of the number of infectious mosquitoes generated during the infectious period of a primary infectious human (R mh) and the number of infectious humans generated by the proportion of infectious mosquitoes surviving the extrinsic incubation period (R hm) as R 0 2 = R mh × R hm [Reference Massad18, Reference Dumont, Chiroleu and Domerg25, Reference Massad27]. The equations of R 0 are summarized in Table 1 [equations (T9)–(T12)]. When R 0 > 1 it implies that the epidemic is spreading within a population and incidence is increasing, whereas R 0 < 1 means the disease is dying out. An average R 0 of 1 means the disease is endemically in equilibrium within the population.
R 0-based probabilistic risk model
To develop a R 0-based risk model, a conditional probability distribution function (pdf) describing the relationship between R 0 and the increased dengue incidence rate has to be constructed. Massad et al. [Reference Massad18, Reference Massad27] developed a model that can be used to calculate the increased dengue incidence rate (λ d, wk−1) that is a function of R 0, where λ d is the rate constant describing the increase in dengue cases over 1 week under an exponential growth condition,
 $$\lambda _d = \displaystyle{{ - (\mu _m + \eta _h ) + \sqrt {(\mu _m + \eta _h )^2 + 4\mu _m \eta _h (R_0 - 1)}} \over 2},$$
where μ m is the average mosquito mortality rate (wk−1) and η h is the mean viraemic rate (wk−1).
Given the λ d estimates from equation (2) based on the probability distribution of R 0 by incorporating Kaohsiung-specific μ m and η h values, a conditional pdf of P(λ d |R 0) describing the R 0−increased dengue incidence rate profile can then be reconstructed by a four-parameter Hill equation as
 $$P(\lambda _d \vert R_0 ) = \lambda _{d,\min} + \displaystyle{{(\lambda _{d,\max} - \lambda _{d,\min} )} \over {1 + \left( {\displaystyle{{K50} \over {R_0}}} \right)^n}}, $$
where λ d,min and λ d,max are the minimum and maximum values of λ d, K50 is the R 0 at half value of λ d,max, and n is the fitted Hill coefficient.
The risk of increased dengue incidence rate can be calculated by a joint probability function describing the probability of a dengue outbreak in a susceptible population based on R 0 driven by dengue−mosquito−human interactions. This can be expressed mathematically as,
 $$R(\lambda _d ) = P(R_0 ) \times P(\lambda _d \vert R_0 )$$
where R(λ d) is the risk of an increase in dengue cases and P(R 0) is the pdf of R 0.
Sensitivity and uncertainty analyses
A sensitivity analysis was performed by Pearson correlation statistics to investigate the parameter contributions in R 0. The TableCurve 2D package (AISN Software Inc., USA) and Statistica v. 6 (Statsoft Inc., USA) were used to perform model-fitting techniques and statistical analyses. A Monte Carlo (MC) technique was implemented to quantify the uncertainty and its impact on the estimation of expected risk. A MC simulation was also performed with 10 000 iterations to generate 2·5 and 97·5 percentiles as the 95% CI for all fitted models. Crystal Ball software v. 2000.2 (Decisioneering Inc., USA) was employed to implement MC simulation. Model simulations were performed by using Berkeley Madonna v. 8.0.1. (http://www.berkeleymadonna.com)
RESULTS
Dengue transmission dynamics
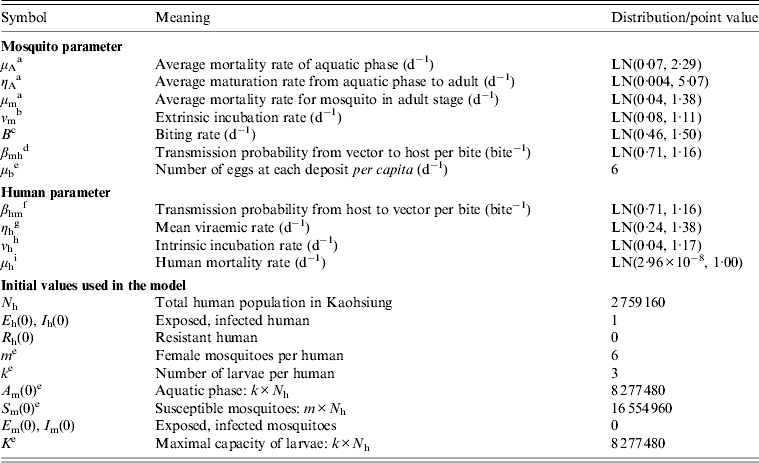
This study summed all observation values from various studies and then calculated the weighted mean and standard deviation (s.d.) of specific parameters based on different sample sizes (i.e. weights) of the respective studies. Nevertheless, the underlying distributions of these mean values were unknown. Thus we used a lognormal (LN) probability function to generate likelihood estimates performed by MC simulation. The demographic data of the human population from Kaohsiung were incorporated into the model. Model parameterization of mosquito parameters was based on published literature related to the experiments on A. aegypti. Table 2 summarizes the parameter values and initial conditions used in the present model.
Point values and probability distribution [LN(a, b) = Lognormal distribution with geometric mean a and geometric standard deviation b] of parameter values and initial values used in the model
a Estimate based on Yang et al. [Reference Yang11].
b Estimate based on Halstead [Reference Halstead28].
c Esitmate based on Pinho et al. [Reference Pinho29].
d Estimate based on Newton & Reiter [Reference Newton and Reiter24].
e Estimate based on Dumont et al. [Reference Dumont, Chiroleu and Domerg25].
f Estimate based on Rosen et al. [Reference Rosen30] and Watts et al. [Reference Watts31].
g Estimate based on Harn [Reference Harn32].
h Estimate based on Hsieh & Ma [Reference Hsieh and Ma33].
i Adopted from the Department of Statistics, Ministry of the Interior, ROC.
By examining the major factor that influences R 0, we performed the sensitivity analysis on R 0 in equation (T10) (Table 1). We found statistically significant evidence that ~63% of the biting rate effect is associated with R 0. Given that the crucial factor in R 0 is the biting rate, we estimated the biting rates [equation (1)] based on the time-series of monthly maximum (T max), mean (T mean), and minimum (T min) temperatures (Fig. 2 a). Figure 2 b shows the estimated time-series of temperature-specific biting rates for 2004–2009. The mean biting rates were 0·13 ± 0·06 (mean ± s.d., N = 72), 0·23 ± 0·07, and 0·43 ± 0·08 d−1 for T min, T mean, and T max temperature regimens, respectively (Fig. 3 a).
(a) Time-series of monthly maximum, mean, and minimum temperature, and (b) mean biting rates varied according to T min, T mean, and T max in Kaohsiung during 2004–2009.

Simulation of mosquito–human population dynamics estimated by (a) temperature regimen-specific mean biting rate. The number of human and dengue populations based on mosquito–human dengue transmission model during 90 days (b, d, f) and at equilibrium (c, e, g), respectively, at T min, T mean, and T max. (h) Relationship between the number of susceptible humans and number of susceptible mosquitoes. (i) Relationship between dengue prevalence in humans and ratio of susceptible mosquitoes to humans.

Our results indicated that a higher biting rate (e.g. T max) results in a higher R 0 and the fraction of infected mosquitoes or human individuals in the population is higher, and thus there are more secondary (or later) infections (Fig. 3 b, d, f), leading to higher dengue prevalence occurring over the timescale of nearly 6–12 months (Fig. 3 c, e, g). However, the prevalence will eventually settle towards equilibrium with most of the human population having experienced infection (Fig. 3 c, e, g).
To understand the relationship between dengue prevalence in humans and susceptible mosquitoes or humans, we considered that dengue dynamics varied with the ratio of susceptible mosquitoes to humans (S m/S h) (Fig. 3 h, i). The critical value of S m/S h was ~10, the point where an epidemic was just possible at three temperature regimens, indicating that above this point the equilibrium of dengue prevalence rapidly increased to their asymptotic values (Fig. 3 i).
The dengue incidence rates during the summer season (August–October) in 2004–2009 were validated against the model simulations (Fig. 4 a–f). This study calculated root-mean-squared errors (RMSEs) to examine the model's predictability of dengue cases. The lower RMSE values indicate higher precise predictions in comparison with observations. The results indicated that the predictions were in apparent agreement with the observed data (RMSEs were 0·22, 0·92, 2·00, 0·84, 3·63, and 2·36/100 000 populations from 2004 to 2009, respectively) (Fig. 4 g). Despite the simplicity of the model, we found a fair quantitative agreement between model predictions and observed data. Overall, the present model captures the transmission dynamics of the dengue incidence rate in Kaohsiung during the summer season during 2004–2009.
(a–f) Comparison of dengue incidence rate (per 100 000 population) during summer (August–October) for 2004–2009 by mosquito–human–dengue transmission model with 95% credible intervals. (g) Root-mean-squared error (RMSE) calculated between predictions and observed data in Kaohsiung.

Dengue infection risk estimates
The temperature-specific R 0 values due to dengue−mosquito−human dynamics were calculated based on equations (T9)–(T12) (Table 1). A LN distribution was used to generate log-likelihood estimates of 95% CIs for R 0, indicating that median R 0 estimates were 1·77 (95% CI 0·67–4·81), 3·22 (95% CI 1·44–6·99), and 6·08 (95% CI 2·81–12·65), respectively, corresponding to T min, T mean, and T max regimens.
A four-parameter Hill equation was best fitted to the data calculated from equation (2) to depict the relationship between increased dengue incidence rate and R 0 in Kaohsiung with four fitted parameters of λ d,min = 0·01 wk−1, λ d,max = 0·99 wk−1, K50 = 3·36 ± 0·07, and n = 2·55 ± 0·18 (r 2 = 0·99) (Fig. 5 a). Given the reconstructed Hill model-based conditional pdf describing the dose–response relationship of P(λ d |R 0)(Fig. 5 a) and the temperature regimen-specific R 0 distributions (Fig. 5 b–d), the exceedance risk probabilities of dengue infection at T min, T mean, and T max can then be estimated followed by equation (4) (Fig. 5 e).
(a) Reconstructed dose–response profile describing the relationship between R 0 estimates and increased dengue incidence rate (wk−1). (b–d) Temperature regimen-specific R 0 distributions described by the lognormal function of LN(geometric mean, geometric standard deviation). (e) Exceedance risk profiles of increased dengue incidence rate (wk−1) estimate based on R 0 distributions at T min, T mean, and T max.

Table 3 summarizes the estimates of increased dengue incidence rate at exceedance risks of 0·1, 0·5, and 0·9 at T min, T mean, and T max. We found that there were 90% and 10% risk probabilities for average increased dengue incidence rates exceeding 0·04 and 0·47, 0·19 and 0·76, and 0·54 and 0·93 wk−1 at T min, T mean, and T max, respectively (Table 3). Generally, our results predicted that there was a 50% risk probability for increased dengue incidence rates exceeding 0·47 and 0·81 wk−1 at T min and T max, respectively, in Kaohsiung.
Estimates of increase in number of dengue cases (wk−1) (median with 95% confidence intervals) at exceedance risk of 0·1, 0·5, and 0·9 in Kaohsiung varied according to T min , T mean , and T max

Control applications
To apply our study to vector control, we used the reduction of mosquito numbers as the parsimonious vector control measure. We defined ε as the control efficiency describing the proportional reduction in the parasite's basic reproduction number due to elimination of susceptible mosquitoes as ε = 1−R 0C /R 0, where R 0C is the basic reproduction number of the mosquitoes after vector control by eliminating susceptible mosquitoes. The results indicated that the weekly increased dengue incidence rate can be decreased to zero if the control efficiencies almost reach 0·3, 0·6, and 0·78, at T min, T mean, and T max, respectively (Fig. 6). Our vector control application also implies that R 0 is a linear function of the number of adult mosquitoes, and therefore, if the only effect of vector control is to eliminate the density of mosquitoes then ε will be equal to the proportional reduction in that density.
Relationship between weekly increased dengue incidence rate (wk−1) and the control efficiency varied according to T min, T mean, and T max.

DISCUSSION
Modelling perspectives
Our analysis reveals several features of dengue fever risk prediction in Kaohsiung. The major findings are: (i) the effect of biting rate plays a crucial role in shaping R 0 estimates, (ii) the mean biting rates (±s.d.) were 0·13 ± 0·06, 0·23 ± 0·07, and 0·43 ± 0·08 d−1 at T min, T mean, and T max, respectively, (iii) R 0 estimates were 1·77 (95% CI 0·67–4·81), 3·22 (95% CI 1·44–6·99), and 6·08 (95% CI 2·81–12·65), respectively, corresponding to T min, T mean, and T max regimens, (iv) the Hill equation can best describe the relationship between dengue cases increasing rate and R 0, and (v) there was 50% risk of increased dengue incidence rate that exceeded 0·47 wk−1 at T mean.
Generally, our average R 0 estimates during 2004–2009 are in agreement with the published data of 2·23 (95% CI 1·47–3·00) in Singapore during 2005 [Reference Hsieh and Ma33], 3·09 (95% CI 2·34–3·84) in Colima, Mexico during 2002 [Reference Chowell16], and 5·10 (95% CI 2·61–10) in Brazil during 2006–2007 [Reference Coelho17]. In view of R 0 formulation [Table 1, equation (T10)], the ratio of initial susceptible mosquitoes and the total human population is vital in determining both R 0 and the dynamics of infection. It implies that R 0 increases with the number of mosquitoes, and decreases with the number of humans. Thus for a successful spread and invasion of dengue infection, a sufficiently large ratio of mosquitoes to humans must be reached, which can be described mathematically by
 $$\eqalign{ S_m (0)/N_h \gt &[(\nu _h + \mu _h )(\eta _h + \mu _h )(\mu _m + \nu _m )\mu _m ] \cr & /[\nu _m \nu _h B^2 \beta _{hm} \beta _{mh} ].} $$
Based on the S m(0)/N h ratio, the prevalence and proportion of seropositives in the human population along with maximum disease prevalence can also be estimated [Reference Keeling and Rohani21]. Moreover, R 0 also captures key components of the role of mosquitoes in pathogen transmission, which is mainly influenced by environmental, ecological, behavioural, and molecular factors [Reference Smith10, Reference Chowell16]. Generally, the extrinsic incubation rate of many vector-borne pathogens is also known to be temperature sensitive [Reference Smith10].
Thus R 0 is influenced by environmental temperature [Reference Rogers and Randolph34]. Beserra et al. [Reference Beserra35] indicated that the favourable temperature for A. aegypti development was between 21°C and 29°C, whereas for dengue longevity and fecundity, the temperature was between 22°C and 30°C. Thus climatic conditions are important predictors of dengue amplification due to the tight relationship between mosquito development from egg to biting adult, survival rate at each life stage, and temperature-dependent feeding behaviour [Reference Yang11, Reference Barbazan20].
We usually used constant temperature-based experimental data to derive vector-borne disease parameter values [Reference Rogers and Randolph34]. Moreover, the averaged weekly/monthly temperature was also usually used in combination with constant-temperature disease parameters for constructing the relationship between climatic factors and vector-borne disease incidence for mathematical modelling purposes. In fact, temperature fluctuated throughout the day, therefore, mosquitoes and their pathogens do not simply experience mean conditions. In our study, we assessed the effect of temperature range on the potential for dengue fever transmission by female A. aegypti at T min, T mean, and T max defined by time-series dynamics of measured temperature.
Although the present model has captured the transmission dynamics of dengue incidence rate along with the risk prediction in southern Taiwan during the summer season for 2004–2009, there are potential limitations of our study that warrant discussion. Limiting data acquisition of daily or weekly confirmed dengue cases resulted in monthly dengue incidence rate estimates. Important limiting assumptions of the models are that there is no vertical transmission of dengue virus in A. aegypti. On the other hand, the mosquitoes never recover from the infection since their infective period ends with their death. Moreover, the model considered only one serotype of dengue virus. In light of the biting rate used in our study, we propose that biting rate can be converted from gonotrophic cycle (i.e. biting rate = 1/gonotrophic cycle) in that all mosquitoes are assumed to become infected at the same first bloodmeal and only bite a human during the gonotrophic cycle.
Mathematical models have long been recognized as useful tools for exploring complicated relationships that underlie infectious disease transmission [Reference Anderson and May19, Reference Keeling and Rohani21]. The accuracy of the predictions obtained from mathematical modelling depends on the accuracy of the estimated parameters used in the model. To this end, good parameter estimates are needed to understand and model the potential spread of dengue fever while the interpretation of data from experimental infection studies provides validation of mathematical model predictions for different dengue fever infection scenarios. The complexity of the model is determined by the purpose of the study and the amount of information in the dataset. On the other hand, it is not advantageous to use a more complex model when a simpler model provides an adequate fit to the data. Undoubtedly, many factors influence the relationship between mosquito and human population dynamics.
Implications on dengue vector control
Under the circumstance without existence of licensed vaccine or dedicated therapy for dengue containment, the most promising strategies to control the disease involve targeting the predominant mosquito vector, A. aegypti [Reference Massad18]. The best existing methods of control such as mosquito control with chemical sprays and treated bed nets can reduce the burden of disease substantially and can even eliminate the disease in some epidemic regions [Reference Matthews36].
The reduction in adult density depends upon the present form of the density-dependent function regulating mosquito populations [Reference Legros37]. Burattini et al. [Reference Burattini22] indicated that even a marked fall in the size of adult mosquito populations may not be sufficient to stop ongoing dengue epidemics. Yet, they showed that the mixed strategy of adulticide and larvicide methods seem to be very effective in reducing the number of cases in the first weeks after implementing control measures.
The major vector control measures may include chemical spray (e.g. pesticide), treated bed net (i.e. inducing adult mosquitoes to lay eggs on the net with water below, therefore growing and being trapped when the larvae become adult mosquitoes), and genetic modification (e.g. parasitic microbe Wolbachia endosymbiotic in the A. aegypti mosquitoes to inhibit the replications of dengue virus [Reference Abbas38]). In this study, we only provide common examples of vector control. In addition to chemical control strategies, there are many control measures that can be used to reduce dengue prevalence without much cost where only notification of public health policy is required, such as reducing human–vector contact and removing water storage containers. Specifically, removing water storage containers is the most effective way to eliminate A. aegypti since A. aegypti breed primarily in man-made containers in Asia. On the other hand, reducing contact between humans and the vector can be simply achieved by wearing long trousers and long-sleeved shirts or staying indoors with the windows closed. These control strategies can sufficiently control a dengue outbreak and produce savings on the government's budget. However, cost-effective analysis should be considered to determine the optimal control strategy in future research.
Much work will need to be done on risk assessment, community engagement, and regulatory protocols [Reference Luz13, Reference Billingsley, Foy and Rasgon39]. Moreover, potentially direct and indirect effects on the abundance of other species and on ecosystem services should be considered [Reference Lambrechts7, Reference Yang11]. Recently, Luz et al. [Reference Luz13] suggested that vector control policies of dengue may need to be reassessed based on continuous larval control only. The ability to successfully predict dengue incidence is generally believed to depend on how well we can predict vector abundance. Notably, because humans are the primary dengue host, human behaviour may be as important as vector abundance for accurate forecasts of pathogen amplification and dengue infection risk [Reference Stoddard40].
In conclusion, dengue continues to impose a substantial burden on human health. We reconstructed a well-developed dengue−mosquito−human population transmission model and re-analysed dengue epidemiology to predict the risk of an increase in dengue fever cases in the southern region of Taiwan. Given that local surveillance data of climatic factors and dengue cases were obtainable, the well-developed population transmission model could easily be used to estimate dengue prevalence in a specific city or country. We also recognize that ecology of infectious diseases in natural populations is ultimately complex [Reference Anderson and May19, Reference Matthews36]. However, we anticipate that our present parsimonious model of dengue−mosquito–human population dynamics in a homogeneous, constant environment can be used to determine what is required to eliminate Aedes mosquitoes. Most importantly, the conclusion from this study, combined with recent estimates of the critical parameters in the laboratory, is that this present approach could provide a method for estimating the risk of dengue fever and guide improvements in vector control methods or other disease control strategies.
DECLARATION OF INTEREST
None.



