


Introduction
The Tufted Puffin Fratercula cirrhata is an iconic seabird of the North Pacific Rim that appears vulnerable to warming ocean conditions (Golubova Reference Golubova2002, Gjerdrum et al. Reference Gjerdrum, Vallée, St. Clair, Bertram, Ryder and Blackburn2003, Hart et al. Reference Hart, Kelly and Pearson2018), changes in prey abundance (Baird Reference Baird1990, Hatch and Sanger Reference Hatch and Sanger1992, Hipfner et al. Reference Hipfner, Charette and Blackburn2007), and oil spills (Piatt and Ford Reference Piatt and Ford1996, Tenyo Maru Oil Spill Natural Resource Trustees et al. 2000). In the southern portions of its range, Puffins have decreased dramatically at some colonies or disappeared entirely from others in both the eastern and western Pacific (McChesney and Carter Reference McChesney and Carter2008, Kocourek et al. Reference Kocourek, Stephensen, So, Gladics and Ziegler2009, Hanson and Wiles Reference Hanson and Wiles2015, Blight and McClelland Reference Blight and McClelland2022).
In the northern portion of its range, where the largest nesting colonies occur, trends were assumed until recently to be relatively stable (Byrd et al. Reference Byrd, Renner and Renner2005). On Triangle Island, located in British Columbia at the confluence of the California and Alaska currents, Puffin burrow counts declined by 1.7% year between 1984 and 2004 (Gaston et al. Reference Gaston, Bertram, Boyne, Chardine, Davoren, Diamond, Hedd, Montevecchi, Hipfner, Lemon and Mallory2009), but numbers apparently rebounded somewhat in 2009 (Rodway and Lemon Reference Rodway and Lemon2011). At four colonies in the Gulf of Alaska, burrow density decreased by >40% following the 1989 Exxon Valdez oil spill, and a population viability analysis suggested that if the pattern is representative of the entire region, the species could be extirpated from the Gulf of Alaska in the next 100 years (Goyert et al. Reference Goyert, Garton, Drummond and Renner2017). Whether these dynamics merely constitute a range contraction or are additionally a sign of larger population decline is at present unclear.
Management responses to these patterns have differed depending on the geographic scale under jurisdiction. Given sharp regional declines locally, the Tufted Puffin was listed as ‘Endangered’ in Japan in 1993 (Osa and Watanuki Reference Osa and Watanuki2002), as a ‘Priority Species’ in the North Pacific Rainforest Bird Conservation Strategy (Environment Canada 2013), ‘Imperiled/Vulnerable’ in British Columbia (B.C. Conservation Data Centre 2018), and in the United States it was listed as ‘Endangered’ by the state of Washington (Hanson and Wiles Reference Hanson and Wiles2015, Hanson et al. Reference Hanson, Pearson, Hodum and Stinson2019), ‘Sensitive’ by Oregon (Oregon Conservation Strategy 2016), and a ‘Species of Special Concern’ by California (McChesney and Carter Reference McChesney and Carter2008). At the federal level, The U.S. Fish and Wildlife Service declined to list the species under the Endangered Species Act in 2020 because northern colonies, where most of the population is found, were considered stable (U.S. Department of the Interior Fish and Wildlife Service 2020). In Canada, the Tufted Puffin is not currently listed by COSEWIC (official federal listing) or under the Canadian Species at Risk Act (SARA). Global assessments on the IUCN Red List (IUCN 2021) and by Nature Serve (NatureServe 2022) rank the species as ‘Stable’ and ‘Secure’ respectively, presumably due to large populations and numerous colonies in Alaska.
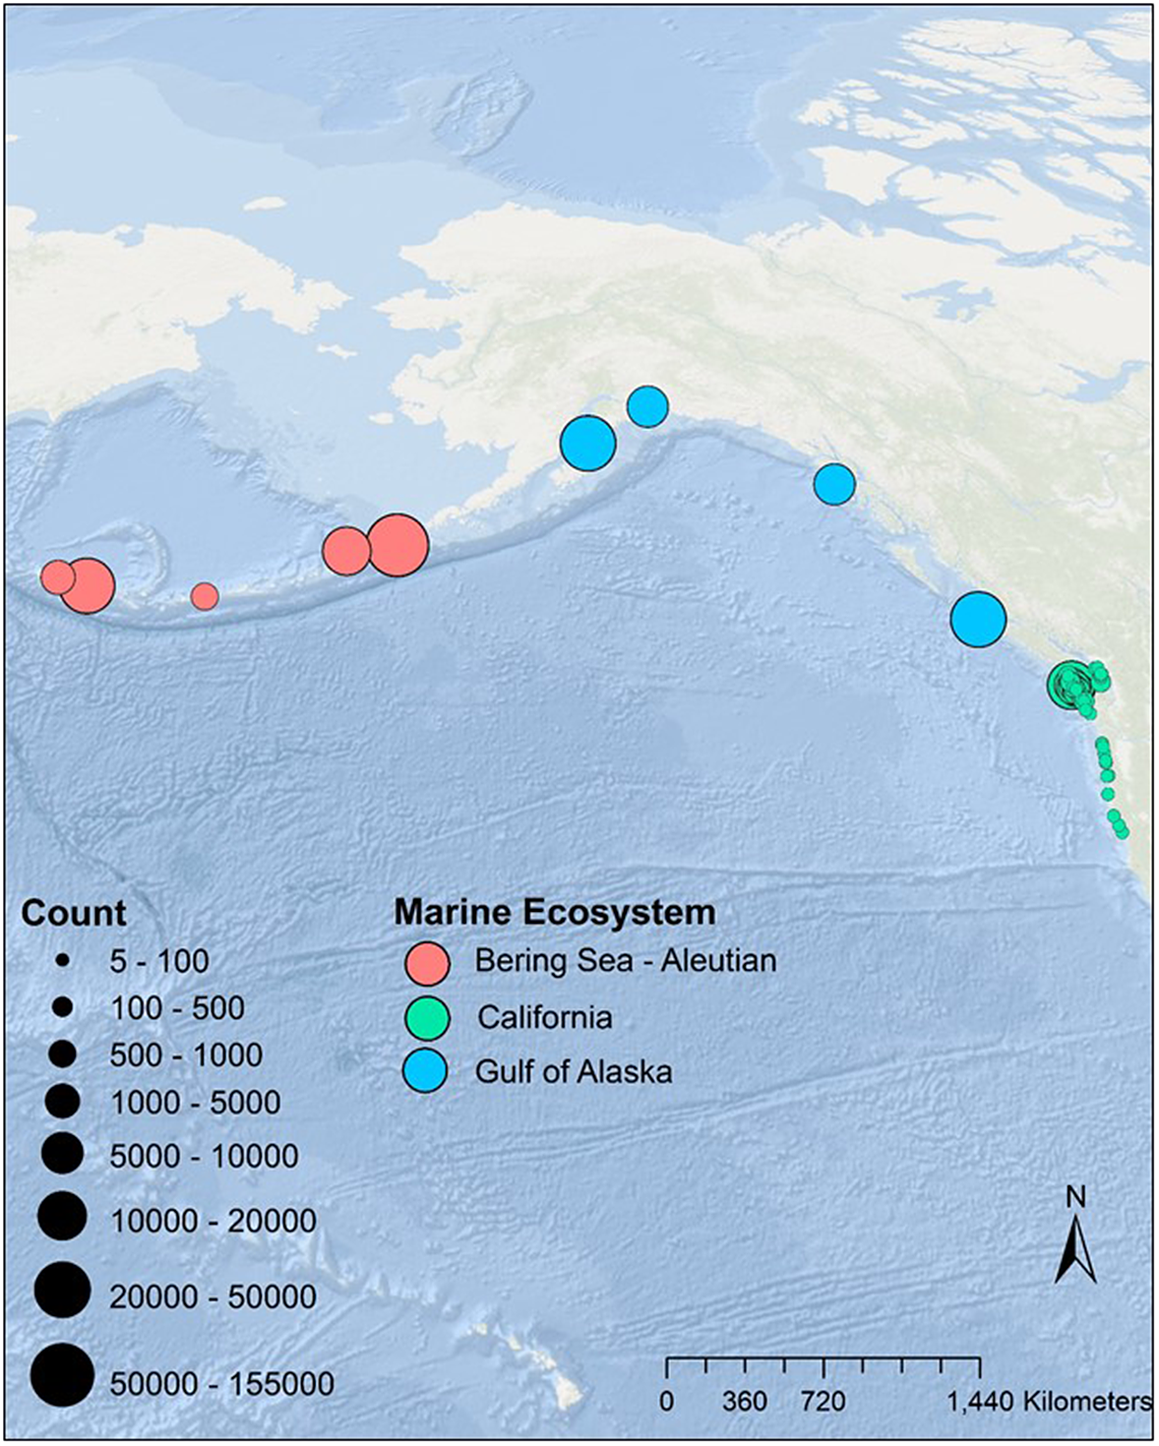
Assessing a species’ conservation priority and ultimately identifying geographically appropriate conservation strategies requires spatially explicit information on population trends and abundance. We assessed Tufted Puffin nesting-season population changes in the California Current (California, Oregon and Washington states, USA), Gulf of Alaska (British Columbia, Canada and Alaska, USA), and Bering Sea/Aleutian Islands (Alaska, USA) LMEs using at-sea and colony-based survey information (Figure 1). When assembling a collection of datasets to examine continental scale population trends in the absence of a designed sampling strategy (e.g. Pearson et al. Reference Pearson, Hodum, Good, Schrimpf and Knapp2013), sample sizes are often unbalanced and less than desirable for some portions of a species’ range and data can be temporally and spatially clustered. We intentionally highlight how we addressed these issues so that managers and policy makers are aware of these limitations.
Tufted Puffin colonies included in the analyses. We graduated the size of the colony location circles to the maximum count for each colony for the California Current or scaled to the whole colony for the Gulf of Alaska and Bering Sea/Aleutian Island systems.
Methods
Species information
Tufted Puffins are strictly pelagic from October through early May before they gather at breeding colonies in the spring and summer (Piatt and Kitaysky Reference Piatt, Kitaysky and Rodewald2002). They nest across the North Pacific Rim from California to Japan (Piatt and Kitaysky Reference Piatt, Kitaysky and Rodewald2002). Roughly 80% of Tufted Puffin colonies are in North America, mostly on Alaskan islands (Piatt and Kitaysky Reference Piatt, Kitaysky and Rodewald2002). Our analyses focused on Tufted Puffin counts and densities collected during the breeding season in the North American breeding range. We assembled 11 data sets from three LMEs that spanned 115 years (1905–2019) and ranged in latitude from the Farallon Islands (37.70°N, 123.00°W) north to Prince William Sound (60.67°N, 147.43°W), and west to Nizki Island (52.74°N, 173.972°W) (See Table S1 in the online supplementary material for a complete list of datasets and Figure 1).
Study area and data
In the absence of information on Tufted Puffin genetic structuring, we used large marine ecosystems (LMEs) to group information by ecological similarity. LMEs are relatively large regions, on the order of 200,000 km² or more, characterised by distinct bathymetry, hydrography, productivity, and species assemblages. With the exceptions described below, we use the ecosystem boundaries of Spalding et al. (Reference Spalding, Fox, Allen, Davidson, Ferdaña, Finlayson, Halpern, Jorge, Lombana, Lourie and Martin2007)
The Aleutian Islands are estimated to have just over one million breeding Tufted Puffins in 103 colonies (Byrd et al. Reference Byrd, Renner and Renner2005) and are surrounded by the East and West Bering Sea and the Aleutian LMEs. Because these islands straddle multiple systems and Puffins on these islands forage in all three ecosystems, we will refer to these colonies as occurring in the Bering Sea/Aleutian Islands ecosystem complex. According to NOAA’s LME boundaries, Aiktak is in the Gulf of Alaska LME, however it is part of the Aleutian Island Archipelago (Byrd et al. Reference Byrd, Renner and Renner2005). Given its westerly location and that it is influenced by both the Bering Sea and Pacific Ocean systems, like other Aleutian Islands, we included Aiktak in the Bering Sea/Aleutian Islands complex. Due to U.S. Fish and Wildlife Refuge focus on monitoring Puffin reproductive success and the remoteness of these islands, we only have plot-based counts of Puffin burrows from five islands located in the Aleutian Island archipelago. Byrd et al. (Reference Byrd, Renner and Renner2005) estimated numbers of breeding birds from our five sampled islands as: Nizki = 628, Adak = 728, Bogoslof = 5,000, Buldir = 20,000, and Aiktak = 102,428. These five islands span the full east-west expanse of the Aleutian Archipelago (Figure 1) and nearly the full range of Puffin colony size. However, smaller colonies are not represented in our sample, there are 32 colonies in this system with less than 500 birds (Byrd et al. Reference Byrd, Renner and Renner2005). There are only two colonies in this chain of islands with over 100,000 birds, one of which is Aiktak. No at-sea data were included for this ecosystem complex.
Several hundred thousand Tufted Puffins are thought to breed in the Gulf of Alaska ecosystem, which is comprised of islands of the northern Gulf of Alaska and British Columbia, including Haida Gwaii, Solander Island, and the Scott Islands (Campbell et al. Reference Campbell, Dawe, McTaggart-Cowan, Cooper, Kaiser and McNall1990, Piatt and Kitaysky Reference Piatt, Kitaysky and Rodewald2002, Stephensen and Irons Reference Stephensen and Irons2003). Despite the number of breeding birds and several hundred occupied colonies in this region, we only have trend data (counts of Puffin burrows in index plots) from three colonies. The estimated colony size for these three colonies is: East Amatuli = 38,498, St. Lazaria = 7,306, and Triangle = 52,000 birds (Goyert et al. Reference Goyert, Garton, Drummond and Renner2017, Rodway et al. Reference Rodway, Lemon and Summers1990). The three colonies ranged from Triangle located off Vancouver Island, British Columbia to East Amatuli near the western end of the Gulf of Alaska. We also include one at-sea data set for the Prince William Sound area which included shoreline (n = 767), mixed offshore and nearshore (n = 207) and pelagic transects (n = 86) that covered an area from Nelson Bay to SW Montague Island (approximately 160 km apart) and inland to College Fjord (117 km inland from Montague Island) and encompassed several important Tufted Puffin nesting colonies as well as Puffin foraging habitat (Kaler et al. Reference Kaler, Labunski and Kuletz2017).
Within the California Current LME, several thousand Tufted Puffins historically bred on approximately 83 colonies in Oregon and Washington and two colonies in northern California (Sowls et al. Reference Sowls, DeGange, Nelson and Lester1980, Speich and Wahl Reference Speich and Wahl1989, Naughton et al. Reference Naughton, Pitkin, Lowe, So and Strong2007). In contrast to the other ecosystems, we include data from nearly all colonies ranging from the Washington-Canada border to San Francisco Bay. These colony counts consist primarily of repeated boat counts of adult puffins associated with the colony (in the air, on the water and on the colony surface) during the nesting season. In addition, we include three at-sea survey efforts that covered the entire coasts of Washington and Oregon USA.
For the datasets described above for each ecosystem (also see Table S1), we converted all data provided to us to a common metric, counts of breeding birds, by transforming at-sea adult (juvenile birds are not encountered on these surveys) bird density estimates (line transect or Distance-derived density estimates for the Washington at-sea dataset) and encounter rates (fixed-width strip transects for Oregon at-sea and Washington Westport) to count estimates for the surveyed area (e.g. multiply the density by the surveyed area). Note that the use of line transect sampling (Washington) and strip transects (Oregon) was consistent among years within each survey effort/dataset. For on-the-water counts from Prince William Sound, we used the actual counts. For colony-based plot surveys from British Columbia and Alaska, we converted all plot densities, which were provided to us, to counts and weighted the plot estimate by the estimated colony population size (colony size * burrow count/plot area). The only data point removed from the Alaska colonies was the 1972 Prince William Sound estimate because it had high leverage (estimate = 9,596 and was 17 years and 76% higher than the next closest data point in time). The colony data from the California Current consisted of adult bird counts so no transformation was necessary.
For the California Current colony counts, we removed the following data: 1) data from dates outside the primary nesting season (June, July, August, and the first 15 days of September) because of the likely influence of date on detection and our focus on changes during the breeding season, and 2) data scored by the database creators as unreliable. Because of the apparent influence of date on detection (Menza et al. Reference Menza, Leirness, White, Winship, Kinlan, Kracker, Zamon, Ballacne, Becker, Forney and Barlow2016), we removed late season counts for the Farallon Island dataset (only conducted in more recent years) but kept the early season detections that were consistent throughout the dataset. In British Columbia and Alaska all counts were conducted during the breeding season.
Analytical approach
The data from the California Current presented two statistical challenges. First, the magnitude of change in the colony size varied considerably among colonies (Figure 2). For example, a few colonies (e.g. Jagged) had large populations historically (10,000 individuals) and now have hundreds of birds (Figure 2), while many colonies had just a few pairs historically and now have either no birds or just a few pairs (Figure 2). The second issue was the temporal clustering of monitoring, which can give a discontinuous perspective on trends and results in large leverage by early or recent estimates (Figure 2). In addition, the temporal clustering of survey effort differed between Washington and Oregon/California, probably resulting from different monitoring approaches between U.S. Fish and Wildlife Service Refuge complexes in those states (compare the two panels in Figure 2). In Washington, the data were strongly clustered temporally in four groups (Figure 2). In Oregon and Northern California, the data were clustered in two groups: 1) 1980s and 2) 2000s (Figure 2). The exceptions to this Oregon/California clustering pattern were data from the Farallon Islands, which had continuous colony-based surveys between the 1970s and recent years. At-sea surveys have also been continuous since 2000.
Maximum yearly colony count in the California Current Large Marine Ecosystem (Blue circles are scaled by the maximum annual count using the cutoffs in the legend) and presented in log scale. Colonies are organized from north to south and the left panel includes Washington State colonies while the right panel includes Oregon State colonies along with the bottom three datasets from California.

To meet distributional assumptions and to generate a common model for all colonies/ecosystems in our analysis, we decided to exclude the Oregon and California data from our quantitative analysis, but we provide qualitative results for that portion of the California Current. The almost universal and uniform pattern of Oregon and Northern California colonies going from high counts of hundreds or tens of birds in the 1980s to a few or zero birds in the 2000s needs no statistical tests to demonstrate this decline (Figure 2). To address temporal clustering in Washington State, we grouped the Washington data into the following four roughly equal time-periods: 1) 1905–1923, 2) 1939–1963, 3) 1967–1991, 4) 1992–2019. We excluded any site that did not have counts spanning >25 years (or at least two of these time-periods) and fewer than five years of data overall. We then fitted a negative binomial generalized linear mixed model (GLMM; Bolker et al. Reference Bolker, Brooks, Clark, Geange, Poulsen, Henry, Stevens and White2009, Bates et al. Reference Bates, Maechler, Bolker and Walker2015). Fixed effects included the four time-periods and, within each time-period, slope by year (interaction only). By binning the data into four time periods, we effectively created an ordered categorical variable. However, we did not expect a priori that this categorical variable would exhibit a linear trend (i.e. decline across time periods) and consequently we fitted orthogonal linear, quadratic, and cubic terms.
The data from the Gulf of Alaska and Bering Sea/Aleutian Islands systems did not present similar temporal and spatial clustering and, as a result, we did not group the data into time periods. Like our Washington analysis, we also used a negative binomial GLMM model with ecosystem (Bering Sea/Aleutian Islands and Gulf of Alaska) and year as fixed effects along with the interaction between these terms. Random effects included intercept and slope by year for every site. All data analysis was done in R-3.4.0 (R Core Team 2017).
Results
Bering Sea/Aleutian Islands Ecosystem Complex
Tufted Puffin populations in this complex increased from 1973 to 2016 (Table 1, Figure 3). Four of the five colonies monitored in this system had increasing trends (Table 1), while the fifth, and largest colony, showed no clear trend (Figure 3).
GLMM model output (on natural log scale) of fixed effects for the Alaska model, which includes both the Gulf of Alaska and Bering Sea/Aleutian large marine ecosystems. The intercepts in this model can be interpreted as the current (2019) average condition in the Gulf of Alaska. The year effect was significant (increasing trend) for the Bering Sea/Aleutian ecosystem but not for the Gulf of Alaska LME. Because these sites within the Gulf of Alaska LME did not exhibit a common trend, indicating that there was a variation among colonies, we examined site-specific trends (Figure 3) and found strong downward trends in two datasets, a less strong downward decline in a third and a fourth with no trend (Figure 3).

Trends for the (A) Bering Sea/Aleutian Island complex (Nizki, Buldir, Adak, Bogoslof, and Aiktak) and the (B) Gulf of Alaska (E. Amatuli, Prince William Sound “PWS”, and St. Lazaria and Triangle in the Scott Islands, BC). We converted all plot densities to counts and then weighted by the estimated colony population size. For on-the-water counts around Prince William Sound, we used actual counts. Note that scales of both the X- and Y-axes differ by island to allow trend comparison. Grey bands represent 95% predicted confidence intervals.

Gulf of Alaska Ecosystem
There was a slight overall decline in the Gulf of Alaska system from 1972 to 2019, but the datasets exhibited different rates of decline (Table 1, Figure 3). Because these sites did not exhibit a common trend, indicating that there was variation among colonies, we examined site-specific trends. Monitored plots at the large colony of East Amatuli and the at-sea counts from Prince William Sound region exhibited strong downward trends (Figure 3). The large Triangle Island colony also showed a downward trend, but the slope is less steep, with more interannual variability (Figure 3). The smaller St. Lazaria colony exhibited high variability from year to year with a slight negative slope but no overall trend (Figure 3). However, it should be noted that the survey plot sizes (and therefore plot configurations) for this colony differed annually and by as much as 30% between years, likely resulting in greater variation in counts between years. Consequently, assessing trend was difficult for St. Lazaria given this variation.
California Current Ecosystem
For Washington State, model results showed a linear decline between each of the four time periods (Table 2). Looking at the magnitude of decline, our model predicted a 92% decline between 1905 and current estimates (Table 3), or a change from 17,528 Tufted Puffins (95% CI = 7,156–33,104) during the 1905–1923 time period to 1,400 Puffins (95% CI = 1,025–1,877) during the 1992–2019 time period. There was an apparent stepwise decline with strong population changes between 1905 and the 1960s and again between the 1980s and recent estimates (Figure 4). Of the 41 occupied colonies in Oregon with data from both the late 1980s/early 1990s and the 2000s (≥2008), zero birds were detected on 32 of these colonies in the most recent survey years, representing a 78% decline in colony occupancy (Figure 2). A simple tally of the high counts from these 41 occupied colonies from both the 1980s/1990s and the 2000s resulted in 354 and 63 birds, respectively. Only three colonies exhibited no change between time periods (counts within a few birds of each other), and Finley Rock increased from two to 16 Puffins. Two Puffin colonies are in California and only the southernmost colony, the Farallon Islands, appears to have increased where it ranged from 54–90 birds in the 1970s to 70–156 birds (based on early-season counts used in our analyses) since 2010.
GLMM output (on a natural log scale) of the fixed effects for the Washington State data. “Period” is a centered and ordered factor (time period) with orthogonal linear, quadratic, and cubic terms constructed from ordered levels: 1905–1923 < 1939–1963 < 1967–1991 < 1992-2019. The overall linear trend was significant with strong evidence for a decline across the entire 1905–2019 period and there was no evidence for a quadratic or cubic relationship over time.

Estimated (95% CI) percent reduction in the Washington State Tufted Puffin population between time-periods. The “number of colonies” column includes the number of colonies in the first/second time period.

Estimated counts of Tufted Puffins for all Washington State, USA colonies during four time periods: 1905-1923, 1939-1963, 1967-1991, 1992-2016. Insert is the most recent estimated counts (± 95% confidence intervals) by colony (site level effect from the GLMM).

Discussion
Summary of trends and putting results in perspective
Our analysis, spanning 115 years, 11 independent datasets from two countries, 55 nesting colonies, several LMEs, and over 5,650 km of coastline, indicates several patterns: (1) long-term and nearly uniform population declines in the at-sea and colony based surveys in the California Current LME, (2) downward trends for the Prince William Sound at-sea surveys and for the two larger colonies (over 38,000 and 52,000 birds) in the Gulf of Alaska LME, with the third, smaller colony (over 7,000 birds), exhibiting no clear trend, and (3) positive trends in four of the five colonies in the Bering Sea/Aleutian Islands LME, and the fifth, by far the largest (>100,000 birds), colony exhibiting no clear trend.
In the California Current, trends from virtually every colony of significant size were included in our analysis plus at-sea estimates, resulting in a nearly complete assessment of colonies for this region. However, our analysis for Alaska and British Columbia was based on a small proportion of the region’s population and colonies. Population trend data existed for just eight out of >700 historically described colonies in Alaska and one at-sea dataset that encompassed several Puffin colonies. At each of these eight colonies, only ~5% of burrows were surveyed. Despite this limitation, the spatial coverage of the colonies/datasets spanned a significant portion of the Puffin’s Alaska geographic range and included medium sized and large colonies (Figure 1). In addition, approximately 80–90% of Canada’s Tufted Puffins breed on Triangle Island (Rodway et al. Reference Rodway, Campbell and Lemon2018), the only British Columbia colony included in our analysis.
Tufted Puffin population declines in the Gulf of Alaska and California Current LMEs are consistent with Hart et al. (Reference Hart, Kelly and Pearson2018)’s range-wide analyses modelling the effects of climate change on Tufted Puffin colony occupancy, Goyert et al. (Reference Goyert, Garton, Drummond and Renner2017)’s ecosystem-level population projection analysis accounting for density dependence, as well as a variety of local, state and provincial analyses and assessments (Gjerdrum et al. Reference Gjerdrum, Vallée, St. Clair, Bertram, Ryder and Blackburn2003, McChesney and Carter Reference McChesney and Carter2008, Shuford and Gardali Reference Shuford and Gardali2008, Gaston et al. Reference Gaston, Bertram, Boyne, Chardine, Davoren, Diamond, Hedd, Montevecchi, Hipfner, Lemon and Mallory2009, Kocourek et al. Reference Kocourek, Stephensen, So, Gladics and Ziegler2009, Carter et al. Reference Carter, Burger, Clarkson, Zharikov, Rodway, Sealy, Campbell and Hatler2012, Hanson and Wiles Reference Hanson and Wiles2015, Blight and McClelland Reference Blight and McClelland2022). Our results differ from these studies, however, in both scope and scale – we included additional colony and at-sea survey results not previously analysed, and data covering nearly the entire North American range. Our analysis also differs from Hart et al. (Reference Hart, Kelly and Pearson2018) in that we included counts and did not focus only on changes in colony occupancy status. As a result, we were able to examine the magnitude of the population change, for example the California current exhibited a 92% decline.
The data used for the Gulf of Alaska in our work differ from those of Goyert et al. (Reference Goyert, Garton, Drummond and Renner2017) because, (1) we included Aiktak Island in the Aleutian Island ecosystem and not in the Gulf of Alaska, (2) because of a mistake in the St. Lazaria data provided to H. Goyert by U.S. Fish and Wildlife Service, and (3) we include an extensive at-sea dataset for the Prince William Sound area. The corrected St. Lazaria data used in our study resulted in a change from a declining St. Lazaria trend to a trend with a slightly negative slope and high year-to-year variability (Figure 3). Annual changes in St. Lazaria plot size and configuration may have contributed to some of the Island’s interannual variability in burrow counts. Nest density and reproductive success often vary across seabird colonies (e.g. Stokes and Boersma Reference Stokes and Boersma2000, Pearson et al. Reference Pearson, Hodum, Good, Schrimpf and Knapp2013). Consequently, the way the colony density variability is sampled will influence overall estimates of density. If that variation in density is sampled differently in different years, it can result in bias and/or increase the interannual variability in counts.
Factors potentially driving trends
The factors potentially driving declines throughout the California Current and in portions of the Gulf of Alaska likely include of suite of factors that vary spatially and temporally. Documented human factors include acute events such as oil spills (Burger and Fry Reference Burger, Fry, Vermeer, Briggs, Morgan and Siegel-Causey1993) and chronic factors such as fisheries bycatch (Ainley et al. Reference Ainley, DeGange, Jones and Beach1981, Ogi Reference Ogi1984), and environmental contamination (Ohlendorf Reference Ohlendorf, Vermeer, Briggs, Morgan and Siegel-Causey1993, Good et al. Reference Good, Pearson, Hodum, Boyd, Anulacion and Ylitalo2014). Larger oil spills in the eastern North Pacific, for example, occurred primarily between the 1930s and early 1990s with the vast majority occurring in the 1980s (Burger and Fry Reference Burger, Fry, Vermeer, Briggs, Morgan and Siegel-Causey1993). During this time, several spills occurred adjacent to Puffin colonies during the breeding season and resulted in the observed and estimated mortality of many hundreds of Puffins (Rodway Reference Rodway1989, Burger Reference Burger1993a,Reference Burgerb, Tenyo Maru Oil Spill Natural Resource Trustees et al. 2000). The most significant of these events was the Exxon Valdez oil spill of 1989 which occurred at the beginning of the breeding season in Prince William Sound and the number killed may have been as high as 13,000 (Piatt and Kitaysky Reference Piatt, Kitaysky and Rodewald2002) resulting in a >40% decrease in burrow density in the Gulf of Alaska following the spill (Goyert et al. Reference Goyert, Garton, Drummond and Renner2017).
Also in the 1980s, Tufted Puffins were negatively affected by both the Japanese mothership drift net and land-based gillnet fisheries that killed many tens of thousands of Tufted Puffins (Ainley et al. Reference Ainley, DeGange, Jones and Beach1981, Ogi Reference Ogi1984, Atkins and Heneman Reference Atkins and Heneman1987, DeGange and Day 1991). For example, in 1977 an estimated 31,403 Tufted Puffins were killed in the Japanese land-based gillnet fishery (DeGange and Day Reference DeGange and Day1991). These fishery practices were banned in 1988 in the United States’ Exclusive Economic Zone and the United Nations passed a resolution halting the practice in international waters in 1990 (Tasker et al. Reference Tasker, Camphuysen, Cooper, Garthe, Montevecchi and Blaber2000, Smith and Morgan Reference Smith and Morgan2005). More recent bycatch assessments of various fisheries have not documented significant impact to Tufted Puffins (Smith and Morgan Reference Smith and Morgan2005, Bertram et al. Reference Bertram, Wilson, Charleton, Hedd, Robertson, Smith, Morgan and Song2021, Jannot et al. Reference Jannot, Wuest, Good, Somers, Tuttle, Richerson, Shama and McVeigh2021), but the monitoring of bycatch by various entities can be inconsistent depending on the fishery (National Marine Fisheries Service 2004, Moore et al. Reference Moore, Wallace, Lewsion, Zydelis, Cox and Crowder2009).
Other factors influencing Tufted Puffin population trends include the introduction of invasive species at breeding colonies (Leschner Reference Leschner1976, Ainley et al. Reference Ainley, Morrell, Boekelheide, Ainley and Boekelheide1990, Ebbert and Byrd Reference Ebbert, Byrd, Veitch and Clout2002, Gaston et al. Reference Gaston, Golumbia, Martin and Sharpe2008, Shuford and Gardali Reference Shuford and Gardali2008, Hipfner et al. Reference Hipfner, Lemon and Rodway2010). For example, between 1910 and 1940 most (n = 86) Aleutian islands were stocked with arctic foxes Vulpes lagopus (Ebbert and Byrd Reference Ebbert, Byrd, Veitch and Clout2002), which decreased seabird populations on these islands (Murie Reference Murie1959).
In addition to human-introduced species, increasing populations of native predators, like the Bald Eagle Haliaeetus leucocephalus, have unknown effects on Puffin populations, although eagles are known to eat Puffins and influence their behaviour (Addison et al. Reference Addison, Ydenberg and Smith2007, Hipfner et al. Reference Hipfner, Blight, Lowe, Wilhelm, Robertson, Barrett, Anker-Nilssen and Good2012). The impacts of eagles are likely to be greater on islands with few Puffins and many eagles such as Protection Island in Washington State, USA, with just a handful of Puffins (Figure 2) and often more than 30 Eagles (as high as 53) observed on this nearly 3-km long island on a given day during the breeding season (S.F.P. unpubl. data, Henson et al. Reference Henson, Desharnais, Funasaki, Galusha, Watson and Hayward2019).
It is becoming increasingly clear that Tufted Puffin reproduction and population trends are sensitive to warm ocean waters and weak upwelling conditions that can cause poor ocean productivity and ultimately a reduction in forage nekton populations (Sydeman et al. Reference Sydeman, Piatt, Thompson, Garcia-Reyes, Hatch, Arimitsu, Slater, Williams, Rojek, Zador and Renner2017). Under two future Intergovernmental Panel on Climate Change emission scenarios, Hart et. al. (Reference Hart, Kelly and Pearson2018) predicted that >93% of currently suitable nesting habitat in the California Current is likely to become unsuitable. They also suggested a net loss of >18% of suitable nesting colonies throughout the entire North American range, regardless of the two emission-reduction strategies used. Colony-based research on the only large Tufted Puffin colony south of Alaska, Triangle Island, indicates that reproductive performance is strongly influenced by changes in sea surface temperature and upwelling strength (Gjerdrum et al. Reference Gjerdrum, Vallée, St. Clair, Bertram, Ryder and Blackburn2003). In research farther north, Sydeman et al. (Reference Sydeman, Piatt, Thompson, Garcia-Reyes, Hatch, Arimitsu, Slater, Williams, Rojek, Zador and Renner2017) suggested that the presence of their primary forage fish prey in Alaska, Pacific sand lance Ammodytes hexapterus and capelin Mallotus villosus, is correlated with ocean temperature. The negative relationship between warm water events and Tufted Puffin diet composition, reproduction, and colony persistence does not bode well for the species given the growing evidence that global warming increases the frequency, duration, and magnitude of warm-water forcing events (Cai et al. Reference Cai, Borlace, Lengaigne, van Rensch, Collins, Vecchi, Timmermann, Santoso, McPhaden, Wu and England2014, Masson-Delmotte et al. Reference Masson-Delmotte, Zhai, Pörtner, Roberts, Skea, Shukla, Pirani, Moufouma-Okia, Péan, Pidcock and Connors2018).
These negative relationships between sea surface temperature and puffin diet, reproduction and colony occupancy may result in population-scale influences on puffins. Recent mass mortality events suggest that the alcid family (Alcidae), including murres, puffins, auklets, and murrelets, is at higher risk of warm-water-induced mortality than other major marine bird families such as larids and procellariids (Parrish et al. Reference Parrish, Litle, Dolliver, Hass, Burgess, Frost, Wright, Jones, Cigliano and Ballad2017). For example, an estimated 2,100 to 13,100 Tufted Puffins died (95% CI from Jones et al. Reference Jones, Divine, Renner, Knowles, Lefebvre, Burgess, Wright and Parrish2019) during a mass mortality event in October and November 2016 in the Pribilof Islands of Alaska. Given that roughly 7,000 Tufted Puffins breed in the Pribilofs (an area not included in our analysis), a significant portion of the local breeding population could have been lost in this event (Jones et al. Reference Jones, Divine, Renner, Knowles, Lefebvre, Burgess, Wright and Parrish2019).
Our results indicate that Tufted Puffin populations are increasing on multiple Aleutian Islands. This increase may reflect: (1) reduced depredation from introduced species and bycatch mortality; (2) high quality breeding conditions resulting in high intrinsic population growth; or (3) immigration from declining populations to the east and south. Ongoing research suggests some genetic structuring among colonies assessed in the Gulf of Alaska and Bering Sea/Aleutian Islands systems, with tests indicating that allele frequencies differ among colonies regardless of the ecosystem sampled (T. Burg pers. comm.) which would not be expected if birds were immigrating into these areas from colonies to the south. The legacy of fishing and invasive species events on and adjacent to the Aleutian Islands that we described above may still be influencing populations depending, in part, on the time since invasive species removal and cessation of the fisheries, and on the proximity of colonies to large and healthy colonies for recruitment, and the amount of suitable nesting habitat available (Buxton et al. Reference Buxton, Major, Jones and Williams2013). The removal of arctic foxes, for example, resulted in most populations of nesting seabirds increasing four- to five-fold within 10 years of removal (Byrd et al. Reference Byrd, Trapp and Zeillemaker1994, Reference Byrd, Bailey and Stahl1997, Ebbert Reference Ebbert2000, Ebbert and Byrd Reference Ebbert, Byrd, Veitch and Clout2002). Because fox removals have continued until 2018, the legacy of fox predation may still influence some colonies (Buxton et al. Reference Buxton, Major, Jones and Williams2013).
Conclusions
We found evidence for Tufted Puffin declines in two of the three LMEs evaluated, which represented approximately three quarters of the species’ North American range. This region of Puffin declines includes the Gulf of Alaska LME, an ecosystem that contains a significant portion of the species’ estimated total North American population and breeding colonies. In the Bering Sea/Aleutian Islands ecosystem, where we observed colony-level increases, the largest colony included in our analysis demonstrated no clear trend. It is important to note that this island is over five times larger than the next largest colony sampled in this ecosystem, and consequently raises questions about the overall population trend in this ecoregion. Despite data limitations, our analysis coupled with more focused and local studies indicates that the Tufted Puffin is a species of conservation concern throughout much of its geographic range and two of the three ecosystems evaluated. In addition, declines have been long-term and continue. We note that our assessment regrettably did not include data from Puffin colonies north of the Aleutian Islands (e.g. the Pribilof Islands).
The general pattern of Tufted Puffin declines across the California Current and Gulf of Alaska LMEs is likely attributable to a variety of factors influencing populations synergistically. These trends are concerning and will require a multi-faceted, long-term response to better understand the relative strength of the factors driving them and to address them meaningfully through conservation actions.
For our analysis, it was necessary to use information that was not intentionally gathered or designed for a large-scale population assessment. We thus found considerable variation in both monitoring strategies and temporal clustering of data. For the Gulf of Alaska and Bering Sea/Aleutian Islands, where the monitored colonies were few, relative to the total number of Puffin colonies, it was unclear to us how representative the samples were of overall trends. These issues are not uncommon when trying to assess the status of a relatively wide-ranging species that spans many jurisdictions. To address these statistical concerns, our analysis highlights the need to develop a designed sampling strategy that can be (1) applied at a variety of spatial scales (e.g. Pearson et al. Reference Pearson, Hodum, Good, Schrimpf and Knapp2013); (2) used to assess a variety of objectives, such as changes in breeding range, changes in colony occupancy status, population trends and abundance; and (3) used to examine the relationship between population and ecological metrics to gain insights into potential mechanisms responsible for observed changes. Components of an effective monitoring strategy include: (1) a spatially and temporally defined question or objective, (2) an unbiased and representative sampling approach, (3) monitoring methods suitable to the species and environment (including the organism’s spatial distribution) and that address detection, (4) methods that provide reasonably precise and repeatable results, (5) sample sizes sufficiently large to detect population changes with acceptable power, (6) statistics appropriate for estimating temporal and/or spatial changes, and (7) appropriate data management.
Acknowledgements
We thank Deanna Lynch and the USFWS Washington field office for their support. We thank Arthur Kettle and Aaron Christ for manuscript reviews. For contributing data, we thank US Fish and Wildlife Service (Alaska Maritime National Wildlife Refuge, Washington Maritime National Wildlife Complex, Oregon Coast National Wildlife Complex, and Migratory Birds), Environment Canada and Climate Change, Washington Department of Fish and Wildlife, Westport Seabirds, Dr. Robert Payne’s field notes for Tatoosh Island (provided by John Piatt), colony monitoring by Crescent Coastal Research and Point Blue, and the countless field teams working on Puffin colonies. We specifically thank Laurie Wilson, Bill Tweit, Robb Kaler, Gerry McChesney, Craig Strong, Deborah Jaques, and Russell Bradley for supplying data. This analysis was funded by Grant FA16AP00443 from the US Fish and Wildlife Service (USFWS) to Washington Department of Fish and Wildlife (Scott Pearson) to assess the status of the Tufted Puffin throughout its North American range.
Supplementary Materials
To view supplementary material for this article, please visit http://doi.org/10.1017/S0959270922000193.


 Open access