


1. Introduction
You are slippery on skates from the moment you touch the ice. Why should this be true? Given that two solid materials are in contact, researchers have long sought to explain low ice–skate friction based on unique properties of ice. Reynolds (Reference Reynolds1899) described a ‘eureka’ moment wherein he postulated that a thin water film formed by pressure melting could account for the slipperiness of ice. However, Bowden and Hughes (Reference Bowden and Hughes1939) published the first systematic study, and while they agreed that lubrication was likely, they suggested that frictional heating produced a self-lubricating melt layer that accounted for low sliding (kinetic) friction on both ice and snow substrates. Numerous subsequent studies produced results consistent with this hypothesis, and it remains widely accepted as the mechanism governing skate friction (Evans and others, Reference Evans, Nye and Cheeseman1976; Colbeck and others, Reference Colbeck, Najarian and Smith1997; Persson, Reference Persson2000; Kietzig and others, Reference Kietzig, Hatzikiriakos and Englezos2010; Lozowski and Szilder, Reference Lozowski and Szilder2013; Le Barre and Pomeau, Reference Le Barre and Pomeau2015; van Leeuwen, Reference van Leeuwen2017).
Self-lubrication has recent, rival hypotheses to explain why snow and ice are slippery. Lever and others (Reference Lever2018, Reference Lever, Taylor, Hoch and Daghlian2019) observed that polyethylene sliding on snow abraded and did not melt the snow–grain contacts while registering low friction. They postulated that the abraded wear particles could act as a dry lubricant to produce low friction. Canale and others (Reference Canale2019) conducted micro-scale rheology measurements on ice–slider interfaces and found that the interfacial film displayed viscoelastic behavior, with viscosity much higher than that of water. They suggested that abrasive wear could produce a slurry consisting of liquid and sub-micrometer debris to yield the observed behavior and called for an overhaul of prevailing theories of ice friction. Gagnon (Reference Gagnon2016) crushed ice against millimeter-scale rough surfaces with concurrent sliding motion and measured remarkably low friction. He suggested that the formation and extrusion of ice-rich slurries controlled the friction mechanics and that these processes could explain the friction of skate blades on ice. Observations and numerical simulations of nano-scale quasi-liquid layers (QLLs) on ice surfaces provide some evidence that the increased mobility of molecules in these thin layers accounts for low friction of smooth sliders on ice (Weber and others, Reference Weber2018; Liefferink and others, Reference Liefferink, Hsia, Weber and Bonn2021). Persson (Reference Persson2015) formulated a model that considered non-uniform heating and weakening of ice at contacting asperities, rather than bulk melting, to explain the low friction of sliders on ice. None of these recent hypotheses have been formulated into models to predict ice–skate friction, but they postulate quite different contact mechanics from self-lubrication.
Here, we present new micro-scale observations of skates gliding on ice inside an arena. Our objective was to investigate the contact mechanics during actual skating to assess the merits of the various friction hypotheses. We also summarize the main hypotheses and describe their strengths and weaknesses as applied to ice skating. Although minor variations might occur, we postulate that the same dominant mechanism governs the friction of skates on ice for speed and hockey skates, indoors and outdoors, and for all skater weights and speeds.
Our combined approach of observations and hypothesis assessment has led us to conclude that the brittle behavior of ice under compressive and shear loading plays a much stronger role in ice–skate friction mechanics than current theories consider. Importantly, our observations are not consistent with a blade-wide lubricating film of meltwater governing skate friction.
2. Contact mechanics relevant to ice–skate friction
Lever and others (Reference Lever, Asenath-Smith, Taylor and Lines2021) recently reviewed the mechanisms thought to govern ice and snow friction and highlighted the need to account for the brittle behavior of the two substrates. Here, we briefly review the contact mechanics specifically relevant to ice–skate friction.
2.1 Friction measurements
We are aware of two, high-quality datasets for ice–skate friction, one each for speed skates and hockey skates. De Koning and others (Reference de Koning, de Groot and van Ingren Schenau1992) used instrumented blade-holders to measure time-varying friction on long-track speed-skate blades during trials on artificial indoor and outdoor ice rinks. They did not specify the blade rocker (longitudinal) radius or width (usually 25 m and 1.1 mm, respectively, for long-track blades) but noted that the blades were polished with diamond polishing paper (no roughness stated). The tests used an experienced speed skater (72 kg mass) and measured friction through normal strides on straightaways and in curves. This provided remarkable detail on the variation in normal force, F n, friction force, F f and friction coefficient, μ = F f/F n, throughout the strides, as well as average values as functions of ice-surface temperature and skater speed. Average friction coefficients during four strides at 8 m s−1 were μ = 0.0046 ± 0.0004 for straightaways and 0.0059 ± 0.0004 for curves across ice-surface temperatures of −1.8 to −11°C. Minimum straightway friction was measured at −6 to −9°C, and friction increased slightly with increasing speed over the range 4.5–10 m s−1. During straightaway strides, friction varied significantly from an initial peak at blade touch-down, through lower but noisy glide values, to a final, larger spike at push-off. The authors noted that during a stride, the blade rotates around its longitudinal axis, with its outer edge initially touching down, through near-vertical contact during the glide, to its inner edge during push-off. They suggested that the noticeable grooves formed during the touch-down and push-off phases accounted for their respective friction spikes, owing to greater ice penetration.
Federolf and others (Reference Federolf, Mills and Nigg2008) measured the deceleration of a weighted sled to determine the friction of standard hockey blades and three sets of novel blades flared at their bottoms. Although the bottoms of speed-skate blades are ground flat to produce 90° corners, hockey blades are hollow ground to produce sharper corners aimed to improve performance during rapid turns, accelerations and stops common during play. Hockey blades also have smaller rocker radii than speed skates, for similar reasons. The standard blades used by Federolf and others (Reference Federolf, Mills and Nigg2008) had commonly used values of 3.35-m rocker radius and 12.7-mm hollow radius; the latter would have produced 83° corners on 3-mm-wide blades. The three sets of flared blades produced 4, 6 and 8° sharper corners while keeping the maximum height of the hollow channel to 0.08 mm. Although the authors reported no roughness values, they noted that the grinding stone was dressed (radiused) to produce the hollow channels. Hockey skates are generally not polished after this grinding step. Baseline conditions loaded each blade with 53 kg and launched the sled at 1.8 m s−1. Two test series varied mass from 32–74 kg and launch speed 1.2–2.1 m s−1 (8° blades only). Tests were conducted on an indoor, Olympic hockey rink on different days over ice-surface temperatures of −5.7 to −4.9°C. The authors noted that the ice contained no chemical additives. Friction on the standard blades averaged μ = 0.0071 ± 0.0005 and decreased slightly with increasing normal load. The 4, 6 and 8° flared blades reduced average friction by 13, 21 and 22%, respectively. Speed variations over this low-speed range had little effect.
These data confirm that both speed and hockey skates produce low friction over a range of conditions of interest, despite differences in their rocker and bottom profiles and surface finishes. Similar contact mechanics probably govern friction on both types of skates.
2.2 Self-lubrication theory
Bowden and Hughes (Reference Bowden and Hughes1939) first proposed the idea that frictional heat from sliding could melt the contacting ice and produce a hydrodynamic film that governs ice friction. This reasonable hypothesis reflects that solid-on-solid sliding can rapidly warm contacting asperities, and simple heat-budget estimates reveal that a thin hydrodynamic film can supply sufficient frictional heat to melt the ice substrate and perpetuate the film. Nevertheless, no direct confirmation exists that skates produce such a film and that it indeed governs skate friction.
Stiffler (Reference Stiffler1984) formulated a first-principles, self-lubrication model by coupling the Reynolds' equation for hydrodynamic lubrication with an energy equation, wherein the heat source was viscous shearing of a water film and the heat sinks were transient heat flow into the two bodies and latent heat needed to melt one surface. He recognized that, even for parallel surfaces, steady melting would compensate for mass-loss by squeeze flow to provide normal pressure to support the slider. The model matched surface temperatures to determine the heat flow into each surface. Applied to an ice skate (−2°C, 1 MPa normal pressure, 1 m s−1 speed), Stiffler predicted μ = 0.011 and film thickness h = 0.17 μm. Because the formulation required that h be larger than the combined peak roughness of the surfaces, he concluded that ‘A skater on typical ice would probably fail the test’. Nevertheless, the model formally included all the components of self-lubrication theory.
Expanding on this approach, Lozowski and Szilder (Reference Lozowski and Szilder2013) assembled the first comprehensive model of self-lubrication theory applied to skates, specifically speed skates. The mechanics include ice crushing to form a groove of sufficient length to support the skater's weight (assumed to be on one skate). The model calculates the crushing power dissipated, although it does not consider the role of the crushed particles along the interface and instead assumes that a hydrodynamic film develops at the front of the contact zone. The model separates the flow of this film into longitudinal Couette flow and lateral squeeze flow. Shearing in Couette flow provides the frictional resistance, dF f, and power dissipated, dP f, per unit length along the blade, dx, as well as the local friction coefficient, μ(x):


where μ w is the viscosity of water at 0°C, V is the skate velocity, w is the blade width, h(x) is the water-film thickness (with h(0) = 0 at the front of the contact zone) and σ is the normal pressure (assumed equal to the ice hardness). The squeeze flow establishes a parabolic pressure distribution under the blade, with p = 0 at the edges and a continuous outflow of water from the film. The model's heat budget balances the frictional heat generated with the transient heat flux into the ice surface and the latent heat required to melt the ice and replenish the water film. The model does not include heat flow into the blade. Formulated for a vertical blade in gliding motion, the model gave reasonable agreement with the friction measurements of de Koning and others (Reference de Koning, de Groot and van Ingren Schenau1992), underpredicting them slightly and not capturing the friction minimum near −7°C. In its second version, Lozowski and others (Reference Lozowski and Szilder2013) expanded this model to include blade tilt. The model allowed the geometry of the rut and corresponding contact zones to vary with tilt but retained the same underlying heat-budget and squeeze-flow mechanics. Averaged across tilt angles from −20 to 40° (positive inward) to mimic a skating stroke, the revised model improved agreement with the de Koning and others (Reference de Koning, de Groot and van Ingren Schenau1992) measurements. Indeed, it predicted friction variations with tilt angle that map remarkably well onto the time-varying values measured during each stride. Both the vertical and tilting-blade models predicted water-film thicknesses below ~0.5 μm for most speed-skating conditions (75 kg skater gliding on one blade).
Le Barre and Pomeau (Reference Le Barre and Pomeau2015) modeled similar self-lubrication mechanics, with their main effort devoted to solving for the pressure distribution and contact-zone geometry resulting from the balance of meltwater flux into the lubricating layer and squeeze-flow of water out of the layer. Although this relaxed the assumption of constant pressure (equal to ice hardness) to calculate the length of the contact zone, the model also neglected the mechanics of dry contact and the role of any crushed ice. Le Barre and Pomeau (Reference Le Barre and Pomeau2015) also neglected heat flow into the blade and assumed that half of the viscous frictional heat-melted ice rather than explicitly solving for the heat split. For baseline conditions of a 75 kg skater gliding at 12 m s−1 on one blade, the model predicted water-film thicknesses of ~29 and 52 μm for steeply tilted and vertical speed skates, respectively, with corresponding rut depths of 1.35 and 1.0 mm. These are substantially thicker films and deeper ruts than those predicted by the model of Lozowski and others (Reference Lozowski and Szilder2013). The model predicts friction values more than an order-of-magnitude lower than the measurements by de Koning and others (Reference de Koning, de Groot and van Ingren Schenau1992).
Van Leeuwen (Reference van Leeuwen2017) also relaxed the assumption of constant-pressure crushing under the blade, in this case by modeling the ice mechanical behavior as a Bingham solid, with viscous flow rate proportional to the pressure in excess of the ice hardness (as measured by the drop-ball tests of Poirier and others, Reference Poirier, Thompson, Lozowski and Maw2011). Although it includes no dry-contact mechanics, the model defined a ‘ploughing’ regime at the front of the contact zone where the fluid-film pressure exceeds the ice hardness. The model also assumed half of the viscous frictional heat melts ice but included analyses that suggest this is a reasonable approximation. For a 72 kg speed skater gliding on one skate at 8 m s−1, the model predicted film thickness growing from ~0.05 μm at the front to 0.2 μm near the skate centerline. The model predicted μ = 0.0016 for this baseline, with little influence of skater velocity.
A common feature of these skate models is the assumption that lubricating water films begin to form at the front of the contact zones. This captures a significant advantage of self-lubrication theory: frictional resistance and the resulting frictional heat are straightforward to calculate. Yet, despite particularly good output agreement of the model by Lozowski and others (Reference Lozowski and Szilder2013) with measured speed-skate friction, the mechanics underlying these models warrant scrutiny:
• The models do not include dry-contact mechanics at the front of the contact zone. Brittle ice failure must occur at the downward-indentation and longitudinal-shear rates imposed by skates. Self-lubrication models omit any role of the resulting crushed ice or wear particles, including whether these particles influence thermal contact or behavior of the water film.
• When included as a process influencing rut formation, the models assume ice crushing or yielding at constant pressure equal to hardness values obtained during drop-ball tests (Poirier and others, Reference Poirier, Thompson, Lozowski and Maw2011). As we shall discuss, ice-indentation pressures are not constant spatially or temporally and depend strongly on the geometry of interaction.
• The modeled hydrodynamics of the water film, including squeeze flow, assume that the blade roughness is much smaller than the water-film thickness. This may not be true for many conditions of interest. Bhushan (Reference Bhushan2013) delineated lubrication regimes as
(4a)$$\displaystyle{h \over {R_{\rm c}}} > 6\;{\rm hydrodynamic}, \;$$ (4b)$$1 < \displaystyle{h \over {R_{\rm c}}} < 5\;{\rm mixed}\hbox{-}{\rm mode}, \;$$(4c)$$\displaystyle{h \over {R_{\rm c}}} < 1\;{\rm boundary}, \;$$where the composite roughness, $R_{\rm c} = ( {\sigma_{R1}^2 + \sigma_{R2}^2 } ) ^{1/2}$, and σ 1 and σ 2 are the std dev. heights of the two surfaces (σ R ~ 1.25R a). Within the boundary regime, only molecular-thickness films exist to moderate asperity contacts, friction can increase significantly as can wear-particle generation. Within the mixed-mode regime, frequent solid–solid contacts occur, potentially producing wear particles, along with partial hydrodynamic lubrication. Within the hydrodynamic regime, a lubricating film fully separates the two surfaces. Hydrodynamic conditions may exist for polished speed skates toward the rear of the contact zone (Lozowski and others, Reference Lozowski and Szilder2013; van Leeuwen, Reference van Leeuwen2017), but boundary or mixed-mode friction are likely along much of the blade, even ignoring the presence of crushed-ice particles. The rougher grind of hockey and recreational skates could prevent formation of true hydrodynamic films. The self-lubrication models do not treat mixed-mode friction or characterize its transition to hydrodynamic lubrication.
• The models do not formally apportion heat flow into the blade and the ice. Sliding-heat-source models developed in tribology use continuity of contact temperatures to apportion the heat flow into the two bodies (Blok, Reference Blok1937; Archard, Reference Archard1959; Tian and Kennedy, Reference Tian and Kennedy1993). Neglecting heat flow into the blade is equivalent to treating it as an insulated boundary.
2.3 Ice-indentation and ice-rich slurries
Considerable research effort has sought to understand the mechanics of ice indentation to aid safe design of bridge piers, ships and offshore structures exposed to ice loads. Some tests have included concurrent sliding. Here, we review some of this research relevant to ice indentation under a skate blade. Note that with μ < 0.01 for skates, the vast majority of the applied load is compressive.
Schulson (Reference Schulson1999), Jordaan (Reference Jordaan2001), Sodhi (Reference Sodhi2001) and Kim and others (Reference Kim, Golding, Schulson, Løset and Renshaw2012) provide helpful reviews of the mechanics of ice indentation. Although still an area of active research, the main processes include formation of local high-pressure zones (HPZs), microcracking and dynamic recrystallization under the indenter, splitting, spalling and ejection of ice fragments near the edges of HPZs, and crushing and flow of the crushed ice as HPZs fail. The damaged-ice zone is substantially weaker than intact ice and can present viscoelastic rheology.
The brittle nature of ice dominates its mechanical behavior during indentation at high loading or strain rates. Even as warm as −2°C, freshwater ice at high loading rates is more brittle than rocks and ceramics, with total fracture energy of ~0.5 J m−2 or just 2.5 times higher than the surface energy required to create two new surfaces (Nixon and Schulson, Reference Nixon and Schulson1987). Brittle fracture dominates ice failure at strain rates higher than ~10−3 s−1. Schulson (Reference Schulson1999) estimated the effective strain rate in an indentation contact zone as:

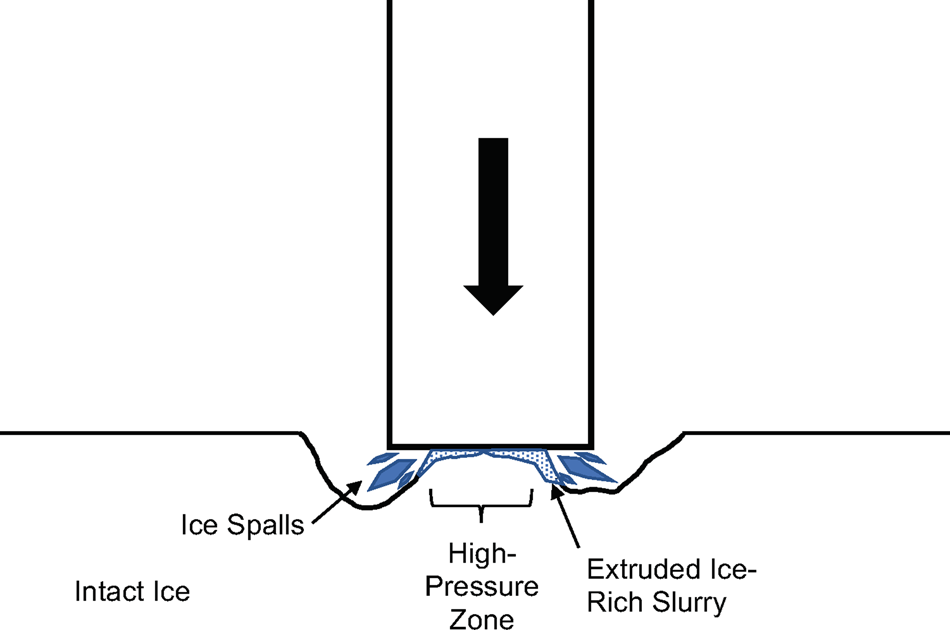
where v is the indentation velocity and w is the indenter width. Equation (5) predicts high effective strain rates under narrow indenters. Using Lozowski and Szilder (Reference Lozowski and Szilder2013) to estimate the contact geometry under a speed skate (rut depth ~30 μm, contact length ~40 mm), skate speeds greater than about 1 mm s−1 (v > 2 μm s−1) would cause brittle material behavior in the ice. Furthermore, Hertzian (elastic) stresses are unbounded at the sharp blade edges, essentially guaranteeing brittle failure under some portion of the blade. Figure 1 shows a schematic of ice-indentation processes as they might apply under a narrow skate blade, derived from similar schematics by ice-indentation researchers.
Schematic of ice-indentation processes as they might occur under a narrow skate blade, based on concepts by Gagnon and Molgaard (Reference Gagnon and Molgaard1991), Jordaan (Reference Jordaan2001) and Wells and others (Reference Wells, Jordaan, Derradji-Aouat and Taylor2011).
Average indentation pressure is equivalent to hardness. Under brittle failure, however, average ice-indentation pressure decreases with increasing contact area and varies with indenter geometry and state of confinement (Kim and Schulson, Reference Kim and Schulson2015). Consequently, ice hardness is not a uniquely defined material property. Importantly, isolated HPZs occur during ice indentation, with measured pressures approaching the pressure-melting point for the ambient ice temperature (Gagnon, Reference Gagnon1994; Wells and others, Reference Wells, Jordaan, Derradji-Aouat and Taylor2011; Kim and others, Reference Kim, Golding, Schulson, Løset and Renshaw2012; Browne and others, Reference Browne, Taylor, Jordaan and Gurtner2013).
This last point bears emphasis. Drop-ball tests by Kheisin and Cherepanov (Reference Kheisin, Cherepanov and Treshnikov1973) and Kurdyumov and Kheisin (Reference Kurdyumov and Kheisin1976) identified a layer of shattered ice particles with water present under pressure. Kurdyumov and Kheisin (Reference Kurdyumov and Kheisin1976) stated that ‘Depending on the quantity of liquid phase, the intermediate layer can be represented as a pasty or powdery substance. Such a substance may possess both viscous and plastic properties …’. Using video and strobe light, Gagnon and Molgaard (Reference Gagnon and Molgaard1991) calculated peak pressures averaging 90 MPa during rapid ice-indentation tests and identified evidence of pressure-melting and extrusion of ice-water slurries consisting of ~20% liquid. They further estimated that the extrusion process consumed at least 50% of the indentation energy. Later, Gagnon (Reference Gagnon2010) used high-speed (HS) video (30 000 frames per second (fps)) to capture the flow of ice-water jets exiting the HPZs during rapid ice-indentation tests.
These ice-indentation processes also appear to govern friction during concurrent indentation and sliding. Gagnon and Molgaard (Reference Gagnon and Mølgaard1989) measured low kinetic friction (μ ~ 0.02–0.1) with concurrent crushing of freshwater ice against a rotating steel wheel. The tests produced periodic crushing and extrusion of pulverized ice, similar to ice-indentation tests without sliding motion. Video records revealed millimeter-thick layers of pulverized ice at the contact zone along with some meltwater. Gagnon (Reference Gagnon2016) crushed ice against millimeter-scale rough surfaces with concurrent sliding motion and measured remarkably low friction (μ ~ 0.02–0.14). HS video identified ice-rich slurries separating the intact-ice zones from the contacting slider elements. Pressure across the slurries reached 55 MPa, or about half of the pressure-melting value. Gagnon suggested that the formation and extrusion of ice-rich slurries controlled the friction mechanics: ‘The squeeze-film slurry dissipates the majority of the actuator energy supplied to the system because the load is mostly borne on the hard-zone ice (~88%, Gagnon, Reference Gagnon1994), where the slurry is generated and flows’. He noted that ‘The layer may be thought of as a self-generating squeeze film that is powered by the energy supplied by the loading system that causes the ice crushing’. Gagnon noted that these processes should be considered to explain the friction on ice of skate blades, sled runners and curling stones, where ploughing or local crushing of ice asperities occurs.
Ice-indentation research suggests that skates under most conditions should produce brittle ice failure with its attendant processes: loading of HPZs, pressure-melting under the HPZs, their abrupt collapse with nearby spalls, and shear and extrusion of ice-rich slurries that consume the majority of the frictional energy. Ice-rich slurries under local HPZs could govern skate friction.
2.4 Pressure-melting
Pressure depresses the melting temperature of ice from the ice Ih-liquid-vapor triple point (0.01°C, 611.7 Pa) to the ice Ih-ice III-liquid triple point at −21.985°C and 208.6 MPa (Wagner and others, Reference Wagner, Riethmann, Feistel and Harvey2011). The effect is weak: only −0.074°C MPa−1 near 0°C. The system must also provide the change in enthalpy (latent heat) needed to melt ice, dH = dE + PdV. Work done through the volume change, PdV, reduces the required change in internal energy, dE, by <10% (Bridgman, Reference Bridgman1912); heat transfer from the surroundings must provide the remainder.
Reynolds (Reference Reynolds1899) proposed that a lubricating film of water formed by pressure-melting could account for the slipperiness of ice skates. When Bowden and Hughes (Reference Bowden and Hughes1939) conducted their experiments, they concluded that meltwater from frictional heating was the more likely source of the lubricating film. Colbeck (Reference Colbeck1995) came to a similar conclusion, but his study largely predated measurement of HPZs under high-rate indentation. Colbeck (Reference Colbeck1995) also assumed that the latent heat to melt the pressurized ice would require heat conduction to the interface from the surroundings, a relatively slow process, rather than from frictional heat at the blade–ice interface. Interestingly, skate-bottom temperature measurements by Colbeck and others (Reference Colbeck, Najarian and Smith1997) showed that temperatures remained well below 0°C during skating strides and gliding, although the thermal pulses synched with the strides, and faster skating produced higher temperatures. These measurements are consistent with frictional heating but not with a blade-wide film of liquid water at 0°C. Pressure melting could play a role in skate friction if HPZs form under the blade, as seen during ice-indentation tests.
2.5 Quasi-liquid layers
Dash and others (Reference Dash, Fu and Wettlaufer1995, Reference Dash, Rempel and Wettlaufer2006) reviewed the physics describing the presence of pre-melt or QLLs on the surface of ice. As common with solids, a melt layer on ice can reduce surface energy at a vapor or solid boundary. The layer thickness below the bulk-melting temperature represents a minimum of the system energy, balancing energy to melt the layer with the reduction in surface energy. Water molecules in the layer have properties intermediate to those of the bulk ice and liquid: unsatisfied hydrogen bonds cause the surface water molecules to be more mobile than those within the bulk ice (Neshyba and others, Reference Neshyba, Nugent, Roeselova and Jungwirth2009; Weber and others, Reference Weber2018). Measurements and modeling show large variations in the layer thickness vs temperature, but these generally vary from tens of nanometers near 0°C to a few nanometers near −40°C (Doppenschmidt and Butt, Reference Doppenschmidt and Butt2000; Pittenger and others, Reference Pittenger2001; Rosenberg, 2005; Li and Somorjai, Reference Li and Somorjai2007; Slater and Michaelides, Reference Slater and Michaelides2019).
Weber and others (Reference Weber2018) combined molecular-dynamics simulations with steel-on-ice friction tests to reveal a strong correlation of measured friction with predicted surface mobility (diffusion) of water molecules over the temperature range −10 to −100°C and sliding speeds 10−6 to 10−1 m s−1. This correlation encouraged them to conclude that the QLL accounts for the slipperiness of ice. Nagata and others (Reference Nagata2019) concurred. However, Liefferink and others (Reference Liefferink, Hsia, Weber and Bonn2021) found that friction from plowing became important as contact pressures exceeded measured hardness above ~−20°C from increased roughness of the spherical sliders. Furthermore, Bluhm and others (Reference Bluhm, Inoue and Salmeron2000) measured friction coefficients on ice of μ ~ 0.6 over the temperature range −24 to −40°C using an atomic-force microscope tip scanned at 5 μm s−1. They concluded that the tip moved sufficiently slowly to displace the quasi-liquid film and consequently measured dry friction.
The results of Liefferink and others (Reference Liefferink, Hsia, Weber and Bonn2021) agree with intuition: nanometer-scale QLLs do not prevent concentrated stress transmission by micrometer-scale slider asperities from exceeding the brittle strength of the ice substrate. At skating speeds, asperity interactions should produce brittle ice failure and wear particles, and those wear particles could play an important role despite the presence of QLLs.
2.6 Abrasion and wear
Lever and others (Reference Lever2018, Reference Lever, Taylor, Hoch and Daghlian2019) published micro-scale interface observations that contradict the self-lubrication hypothesis for polyethylene sliding on snow. Contacting snow grains abraded and did not melt, despite low friction values. Abraded ice crystals (wear particles) formed sintered deposits in the pore spaces between the contacting grains. Classical abrasion mechanics and sliding-heat-source theory adequately predicted the evolution of snow–slider contact area and temperature, respectively. Model predictions were consistent with below-melting contact temperatures measured on sleds towed over snow in Antarctica and Greenland. They hypothesized that dry-contact abrasion, and consequent dry lubrication, may cause low snow friction for systems of practical interest, such as skis and sleds. However, they did not directly observe the presence of sub-micrometer wear particles at the contacting interfaces owing to the small size and rapid post-test sintering of the particles. Thus, this dry-lubrication hypothesis remains unproven, and it is unclear whether it plays an important role in skate friction where abraded particles may be trapped at the interface and melt under further sliding rather than deposit into voids.
Canale and others (Reference Canale2019) measured the nano-rheology of ice–slider interfaces over the range 0 to −16°C and at speeds to 0.09 m s−1. The water films were much thicker than QLLs and displayed complex viscoelastic behavior, with viscosity up to two orders-of-magnitude greater than liquid water near 0°C. Higher normal loads produced greater viscosity, and extrapolation of measured viscosity to zero normal load matched the viscosity of supercooled water at the test temperature. They offered a hypothesis that abrasive wear produced a suspension of liquid and sub-micrometer debris to provide the measured viscoelastic film behavior.
These concepts of abrasion and wear from lateral motion mesh with those of ice-indentation research: a lubricating film under a slider, including a skate blade, could consist of a slurry of ice particles that result from global crushing or local abrasion. The solid/liquid proportions of the slurry would govern the film's rheology.
2.7 Flash heating and softening or melting at asperities
Tribology has long been concerned with the temperature rise generated as two surfaces slide against one another. Frictional heat generated at asperity contacts can produce high-transient ‘flash’ temperatures (Blok, Reference Blok1937; Jaeger, Reference Jaeger1942; Bowden and Tabor, Reference Bowden and Tabor1954; Archard, Reference Archard1959; Tian and Kennedy, Reference Tian and Kennedy1993). Bhushan (Reference Bhushan2013) noted that ‘… most of the frictional energy input is generally used up in plastic deformation …’, a view that flash-heating theories embed as heat transfer across flattened asperities.
An alternate hypothesis to self-lubrication is that flash heating causes softening or melting at isolated asperities, rather than contact-wide bulk melting, to produce low friction. Persson (Reference Persson2015) examined this concept, and it is conceptually similar to the flash-heating model proposed by Rice (Reference Rice2006) to account for the weakening of fault-zone rocks by slip during earthquakes. Persson's model assumed that the slider was perfectly smooth and that the average shear stress, τ m, across an ice asperity decreased as its temperature, T, increased from flash heating:

where $\tau _{\rm m}^0$ is the initial shear stress, T m is the melting temperature and β ~ 0.15. Persson specifically avoided describing the microscopic origin of the frictional shear stress but suggested that it could be related to the molecular mobility of the QLL on the ice asperity. He also noted that ‘… the properties of this (premelt) layer are very different from a Newtonian liquid’ and suggested a need to measure the rheological properties of such layers for the confined geometry involved.
Although perhaps relevant for lightly loaded smooth sliders, concerns arise when considering the Persson (Reference Persson2015) model, or conventional flash-heating concepts, for ice skates: ice crushing occurs at the front and along the blades, skate blades are not smooth relative to the ice and blade asperities must penetrate deeply into the ice for the blade to support the skater's weight.
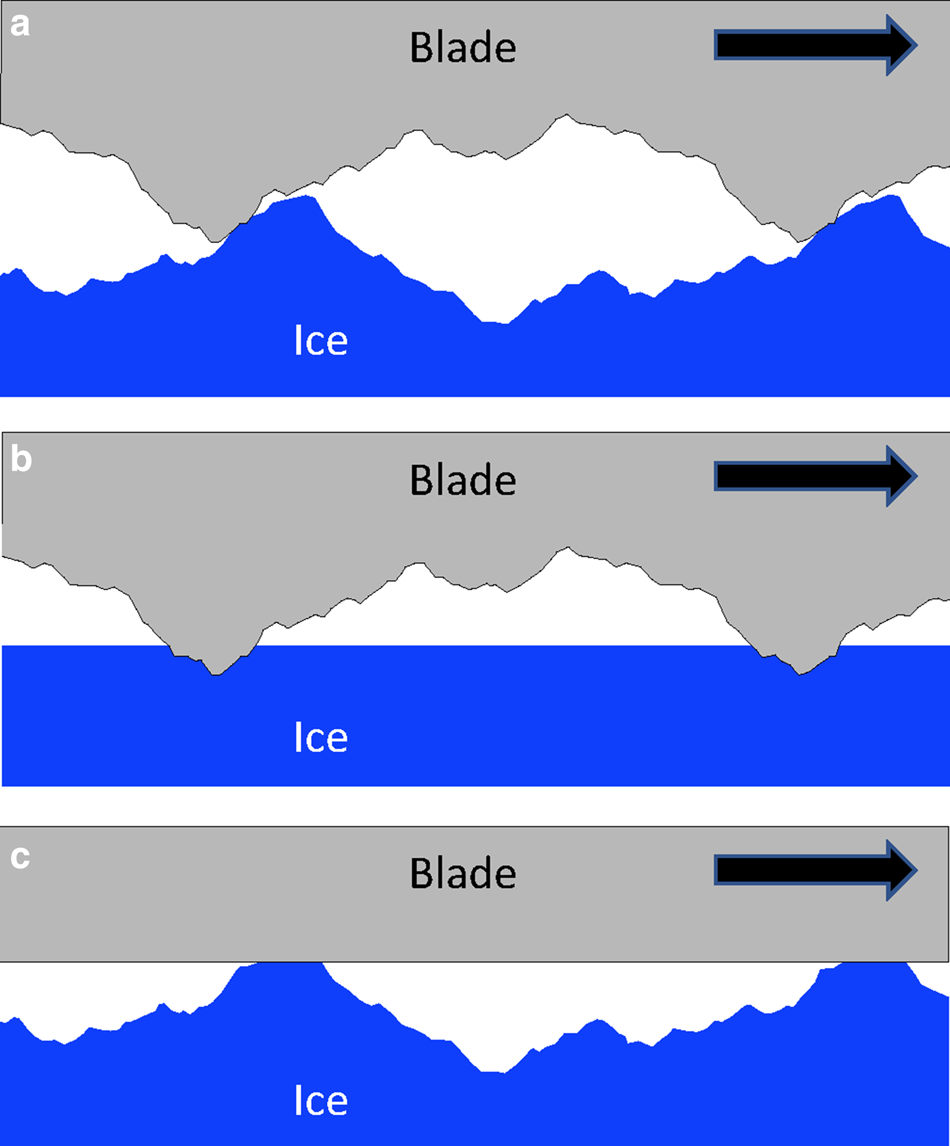
Figure 2 presents three blade–ice interaction configurations based on the relative roughness of the two surfaces. The Persson (Reference Persson2015) model envisions a smooth slider moving across ice asperities (Fig. 2c) and is probably not realistic for ice skates. Most kinetic-friction problems envision microscopic roughness on both surfaces (Fig. 2a). For ductile materials, plastic deformation occurs as the asperities slide into contact, with contact pressure equal to the hardness of the weaker material (Bowden and Tabor, Reference Bowden and Tabor1954; Persson, Reference Persson2000; Bhushan, Reference Bhushan2013). However, ice is extremely brittle, so it is difficult to envision how steel-blade asperities can compress and ride onto ice asperities without producing brittle fracture and wear particles. Furthermore, blade asperities may be interacting with crushed-ice particles rather than intact ice; these particles may rotate, translate or fracture during asperity interactions to prevent high contact temperatures.
Three idealized blade–ice contact configurations: (a) the blade and ice are both rough, (b) the blade is rough and the ice is smooth and (c) the blade is smooth and the ice is rough. Most skate blades are rough (a or b), and consequently are likely to cause brittle failure and wear at contacting asperities. Configuration (c) conceptualizes flash heating and melting at ice-asperity contacts.
If we assume that the ice is smooth (Fig. 2b), dry-contact blade–ice interactions will be similar to two-body brittle abrasion (Moore and King, Reference Moore and King1980; Zum Gahr, Reference Zum Gahr1988; Siniawaski and others, Reference Siniawaski, Harris and Wang2007) to produce conchoidal fractures and wear particles. The role of these wear particles as third-bodies then becomes important to the friction mechanics (Iordanoff and others, Reference Iordanoff, Berthier, Descartes and Heshmat2002; Fillot and others, Reference Fillot, Iordanoff and Berthier2007).
Importantly, a skate blade requires a relatively large contact area to support the skater's weight. Even if we assume that flash heating produces thin water films under blade asperities (Fig. 2b), the more deeply penetrating asperities may still fracture the ice as they move forward. Lozowski and Szilder (Reference Lozowski and Szilder2013) determined the blade–ice contact area on −5°C ice by equating skater weight to full-width contact at 17.7 MPa, the drop-ball crushing strength. Their model transfers this pressure through a hydrodynamic film to the ice surface. Pressure melting at −5°C would occur at 60 MPa, so the minimum contact area would be ~30% of this nominal contact area. That is, pressure melting constrains the contact area to be a significant fraction of the nominal area. In the absence of a full hydrodynamic film, randomly rough blade asperities must penetrate deeply into the ice for the blade to achieve the needed contact area, and the deeper asperities would likely fracture the ice as they move forward. This combination of large contact area and near-melting pressure is more consistent with a series of HPZs than with the flash-heated asperity contacts envisioned in the Persson model.
3. Experimental methods
We conducted skating trials on freshly resurfaced ice in an indoor skating rink to investigate the mechanics underlying ice–skate friction. The Lozowski and Szilder (Reference Lozowski and Szilder2013) model provides predictions (e.g. rut depths and thermal profiles) that we sought to test. Although a tribometer could provide better control over parameters, we first wanted to observe skate-friction mechanics during actual skating to understand how these processes could vary during skating and to guide future laboratory research.
Table 1 summarizes the blade and skater parameters for the trials. Both skaters were formerly competitive in their respective sports but not world-caliber athletes. A local skate shop ground the hockey skates using a standard, dressed grinding wheel. Our speed skater hand-sharpened the short-track speed-skate blades in a jig using a two-sided stone (150 and 400 grit). Although it did not include polishing, this sharpening treatment was standard technique during the skater's competitive years. We measured skate-bottom roughness using a contact profilometer and a confocal microscope. Peak-trough values are typically four times the average roughness values, R a, and thus exceeded 1 μm for both blades. Figure 3 shows microscope images and optical-profilometry-based surface topography of the hockey and speed-skate blades used. Both imaging modes reveal the longitudinal striations that resulted from skate sharpening.
Surface topography (a) and microscope image (b) of hockey-skate blade next to the corresponding images (d, c) of the speed-skate blade. The longitudinal striations from standard sharpening techniques averaged ~80 and 25 μm spacing for the hockey- and speed-skate blades, respectively.

Skater and blade parameters

a Contact profilometer (Surtronic S-100, Taylor-Hobson, UK, 5 μm tip radius, 0.8 mm cut-off length) measured along or across the blade, Ra.
b Calculated from non-contact, confocal microscope profilometry (model M1, Nanovea, Inc., USA, 1000 μm × 1000 μm scan area, 5 μm step size) average of 140 profiles measured along and across the blade, Ra*.
Most skating trials consisted of single-skate glide passes at 2–4 m s−1 through an observation area with side-viewing infrared (IR) and HS optical imaging (Fig. 4). We also conducted observations of regular skating strides. Immediately following most skate passes, we measured rut profiles using a confocal 1-D profiler and obtained optical microscope images of the rut. During the later trials, we coordinated (spatially registered) the real-time IR thermographs, rut profiles and microscope images by lightly adhering a slotted template over the rut within the IR camera's field of view. The template's alignment marks established the locations of the IR and depth profiles and the overlapping microscope images.
Arrangement of the IR camera (1) and HS camera (2) aligned to view single-skate glide passes. Note the shower of ice particles rising from the inside of the hockey skate (red oval). We later adjusted the camera angles and LED lights (3) to view the blade–ice contact as the skate passed.

The IR camera was an FLIR A6703, with spectral range of 3–5 μm and a 50-mm lens that provided 0.15–0.3 mm pixel−1 resolution on the ice, depending on viewing angle (17 or 47° from vertical). The steeper viewing angle gave finer resolution, but the skate obscured thermographs of the ice until the entire skate passed. The shallower angle allowed us to measure blade thermal profiles during each passage and provided ice-rut thermographs soon after the centerline passed by viewing under the radiused blades. The IR camera produced 640 × 512 pixel thermographs at 50 fps with 5.7 ms integration time (equivalent to shutter speed). Aperture of f4 was sufficient to provide sharp images across the fields-of-view for both viewing angles. To obtain accurate blade thermographs, we applied several coats of flat-black paint to their sides and checked the resulting IR-based temperature measurements in the lab. Both the ice and the black blades had high emissivity in the 3–5 μm spectral range of the camera, which we estimated as 0.95 (Salisbury and D'Aria, Reference Salisbury and D'Aria1994; FLIR, 2013). At the start of each day's trials, we checked the calibration of the camera by recording the freezing of a drop of water on the ice surface. The daily calibrations were consistent with the camera's lab-based calibration, obtained using a blackbody target, and provided ±0.1°C uncertainty in the resulting thermographs across the −10 to 0°C range of interest. The HS camera's light-emitting diodes (LEDs) had no influence on the IR measurements to within 0.1°C.
The HS camera was an Fastcam Mini AX200 with zoom lens, and we placed it near the IR camera for similar viewing of the skate passes. Its 1024 × 1024 pixels provided resolution of 0.27–0.38 mm. We usually set the camera for 1000 fps and 0.001 s shutter speed. Two LED flood lights allowed f22 aperture and consequently sharp focus across the field-of-view.
We used a Micro-Epsilon 2405-3 confocal probe mounted on a microscope stage to measure rut profiles after skate passes. The manufacturer specifies the probe's spot size as 9 μm, vertical resolution as 36 nm and maximum tilt as ±24° (relevant for steeply sloping faces). The microscope stage included a linear encoder with 13 nm resolution; each pulse triggered a depth measurement. We calibrated the system by measuring machined slots in an aluminum template and slots cut into smooth ice surfaces. We estimate ±2 μm vertical and ±0.1 mm horizontal uncertainties for the on-ice rut–depth profiles.
We used a Dino-Lite AM7915MZT handheld digital microscope with zoom lens mounted on a stage to obtain 5 mega-pixel optical images. At our commonly used 50× magnification, the pixel resolution was 3.0 μm, and measured distances had uncertainties of ±0.1% based on calibration with a linear scale. The microscope included its own LED lights, which we could adjust to provide side-lighting to show rut relief. We also obtained wider-scale photographs and videos of the trials using a variety of conventional cameras.
4. Observations
Table 2 summarizes the results for the main set of 18 single-skate glide passes (11 hockey, 7 speed). We used the spatial convention of ‘inside’ vs ‘outside’ of the rut relative to the skate edges. For all glide passes except for 201006, the skater was on their right skate and the cameras viewed from their right side (outside, Fig. 4). The HS and IR videos thus showed the skate passing from left to right across the fields of view, with the inside of the rut toward the top of the images.
Summary of single-skate glide passes

The dominant observations of the glide passes were common to all tests (Figs 5–9 show typical observations):
• The IR videos showed that the skates continuously scattered warm ice particles, preferentially to the side more heavily weighted by the skater. Weight bias was normally to the inside as revealed by track curvature and rut–depth profiles. The hockey skates scattered many more particles than the speed skates.
• The HS videos showed these scattered objects to be ice particles and not water droplets. The particles often had identifiable facets and bounced off or slid across the ice as they scattered.
• IR thermographs showed that rut temperatures were often highly non-uniform, both laterally across the ruts and longitudinally along the ruts. The highest temperatures were usually isolated patches of tens of pixels located within or along one side of the rut. Lateral temperature profiles had broader peaks than the skate widths, and some hockey-skate profiles had double peaks when skater weight was more vertically above the blade.
• Peak surface temperatures, even those obtained within 0.01 s after the skate centerline passed, were well below 0°C, and width-averaged temperatures were significantly lower. Temperatures along the ruts did not decay consistently with their relative durations after the blade passed, indicating uneven heating along the rut.
• Rut profiles from the hockey skate were much wider than the 3.0 mm blade width owing to the excavated volume of scattered particles. Rut profiles from the speed skate could be narrower or wider than the 1.04 mm blade width depending on blade angle.
• Both blades produced irregular, roughly triangular-shaped ruts rather than rectangular ones. The hockey skate produced some double ruts when the blade was more vertically weighted.
• Microscope images revealed striations along the slanted rut bottoms that mirrored the skate-bottom longitudinal striations (Fig. 3), indicating direct blade asperity–ice contact (i.e. enhanced blade–ice stress transmission at localized asperities).
IR and HS image pairs showing scattered ice particles after blade passage: (a, b) 201201 run 2, hockey skate; (c, d) 210112 run 1, speed skate. Thermographs (a, c) show that the scattered particles are several degrees centigrade warmer than undisturbed ice-surface temperatures. HS images (b, d) show that the particles are solid ice fragments and not water droplets. The image pairs have slightly different viewing angles and are only approximately coordinated in time. Longitudinal fields of view are ~110 mm, and average rut widths are 4.8 mm for (a, c) and 1.0 mm for (c, d).

Thermographs of skate ruts immediately after skate passage: left set – hockey, right set – speed. Trial date and run number shown above each rut. Note the variability of ruts for the same blade type and the general non-uniformity along and across the ruts. Skate motion was left-right for all thermographs.

Rut depth (irregular black lines) and temperature profiles (red lines) overlaid on microscope images of the ruts from hockey-skate glide passes: (a) 201124 run 3; (b) 201201 run 2. The dashed outline of the blade shows its approximate location. Both microscope images revealed striations in the rut left by blade roughness. The 201201 image (b) revealed arc-shaped conchoidal fractures to the left of the black reference string. No refrozen water was observed. Times (in red) are the elapsed time of the temperature profiles from the centerline of blade passage.

Rut depth (irregular black lines) and temperature profiles (red lines) overlaid on microscope images of two locations along a rut from 210112 speed-skate run 1. The dashed outline of the blade shows its approximate location. The microscope images include two black reference strings and reveal striations in the rut left by blade roughness. No refrozen water was observed. Times (in red) are the elapsed time of the temperature profiles from the centerline of blade passage.

Temperature profiles from (a) speed-skate pass 210112 run 1, and (b) hockey-skate pass on 201124 run 3. The times listed for each profile are elapsed times from the passing of the blade centerline (±0.001 s). The peak temperatures of −0.45°C at 0.001 s and −2.2°C for the speed skate and hockey skate, respectively, were at the blade–ice corners, and successive profiles revealed progressively more of the ice rut as the blades curved away from the ice.
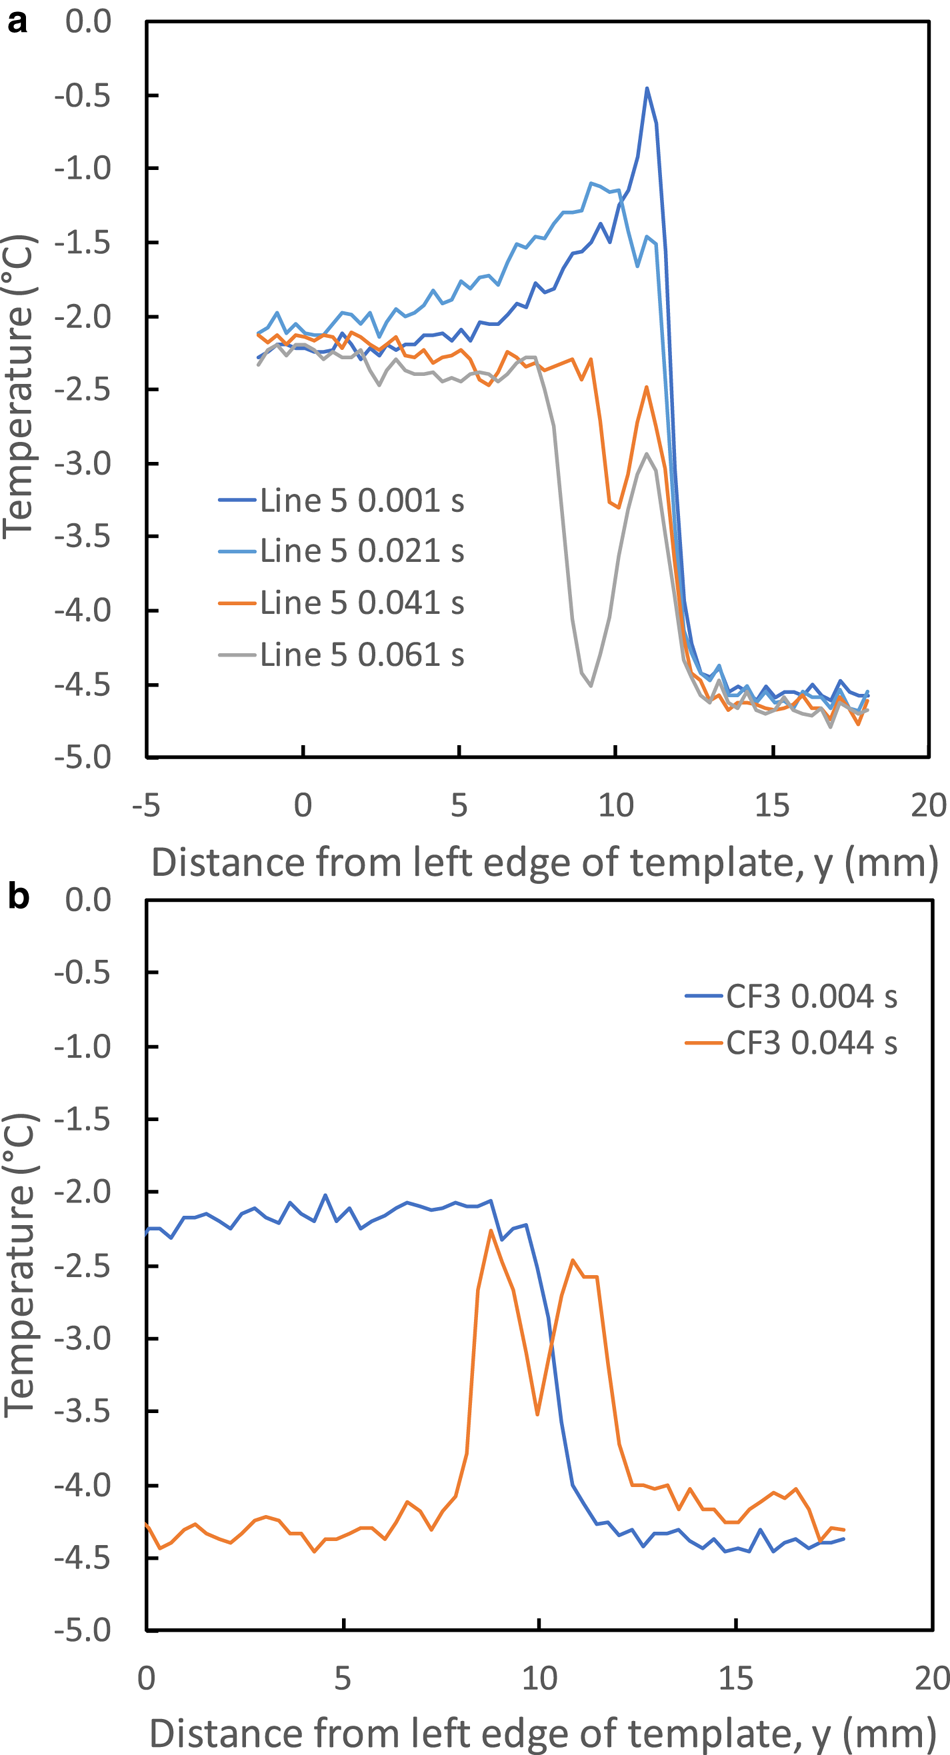
Figure 5 shows IR and HS image pairs that reveal abundant warm particles scattered by the hockey skate and fewer warm particles scattered by the speed skate. Brittle ice failure, and specifically spalling along the blade edges, lofted these warm particles. The warm particles were more obvious in IR, although they were blurred owing to slower shutter speed. Note the irregular temperature distributions along the ruts of both skates.
Figure 6 shows several thermographs for each skate, cropped to reveal variability of the rut temperatures. Even for the same skate on the same day, rut temperatures varied significantly.
Figure 7 shows coordinated rut–depth and temperature profiles superimposed on microscope images for hockey-skate runs on 201201. Figure 8 shows similar images at two locations for a speed-skate run on 210112. The slotted template used for these trials included a longitudinal string, visible in the microscope images and the rut–depth profiles, to align the profiles more accurately. We derived the temperature profiles from the 50 fps IR thermographs acquired during the runs themselves, using a still-image thermograph of the slotted template placed immediately after the run to coordinate the profile locations. Note that the rut–depth vertical scales are exaggerated (10:1) relative to the horizontal scales to reveal rut details. This distorts the appearance of the skate blades (dashed lines), which we superimposed based on our best estimates of their positions. We observed no refrozen water patches during any of the post-test microscopy, although we would not have been able to see evidence of micro-asperity-scale refrozen water.
Figures 7 and 8 show features common to all of the data acquired from the glide passes:
• The rut–depth profiles are quite irregularly shaped and do not simply conform to the shapes of the blades.
• Many ruts showed rounded, rather than sharp-edge, profiles in their deepest portions, suggesting that some rebound of the fracture ice occurred after blade passage. These rounded bottoms complicated manual alignment of the blade outlines onto the rut profiles and microscope images.
• The microscope images revealed striations left by skate-bottom roughness (Fig. 3). These striations could be along the sloped sides and bottoms of the ruts. In a few cases (e.g. Fig. 7a), the striations extended wider than the blade widths, indicating some yaw of the blade relative to the direction of travel.
• Depending on its tilt, the hockey blade could leave two separated ruts, reflecting the relief of its hollow grind (~0.09 mm).
• Microscope images from hockey-skate runs often revealed evidence of conchoidal fractures along the deeper and thus the more heavily-weighted side of the rut, which also corresponded to the side where the blade scattered the majority of warm particles observed in IR.
• The maximum rut depths for the hockey blade were usually deeper than the hollow-grind relief. This was true even when the blade produced two separated ruts, indicating that the blade excavated ice deeper than its hollow-grind alone would suggest.
• Ruts left by the speed skate were much shallower than those left by the hockey skate and could vary significantly in depth along the track, including areas where the ruts were barely measurable or visible.
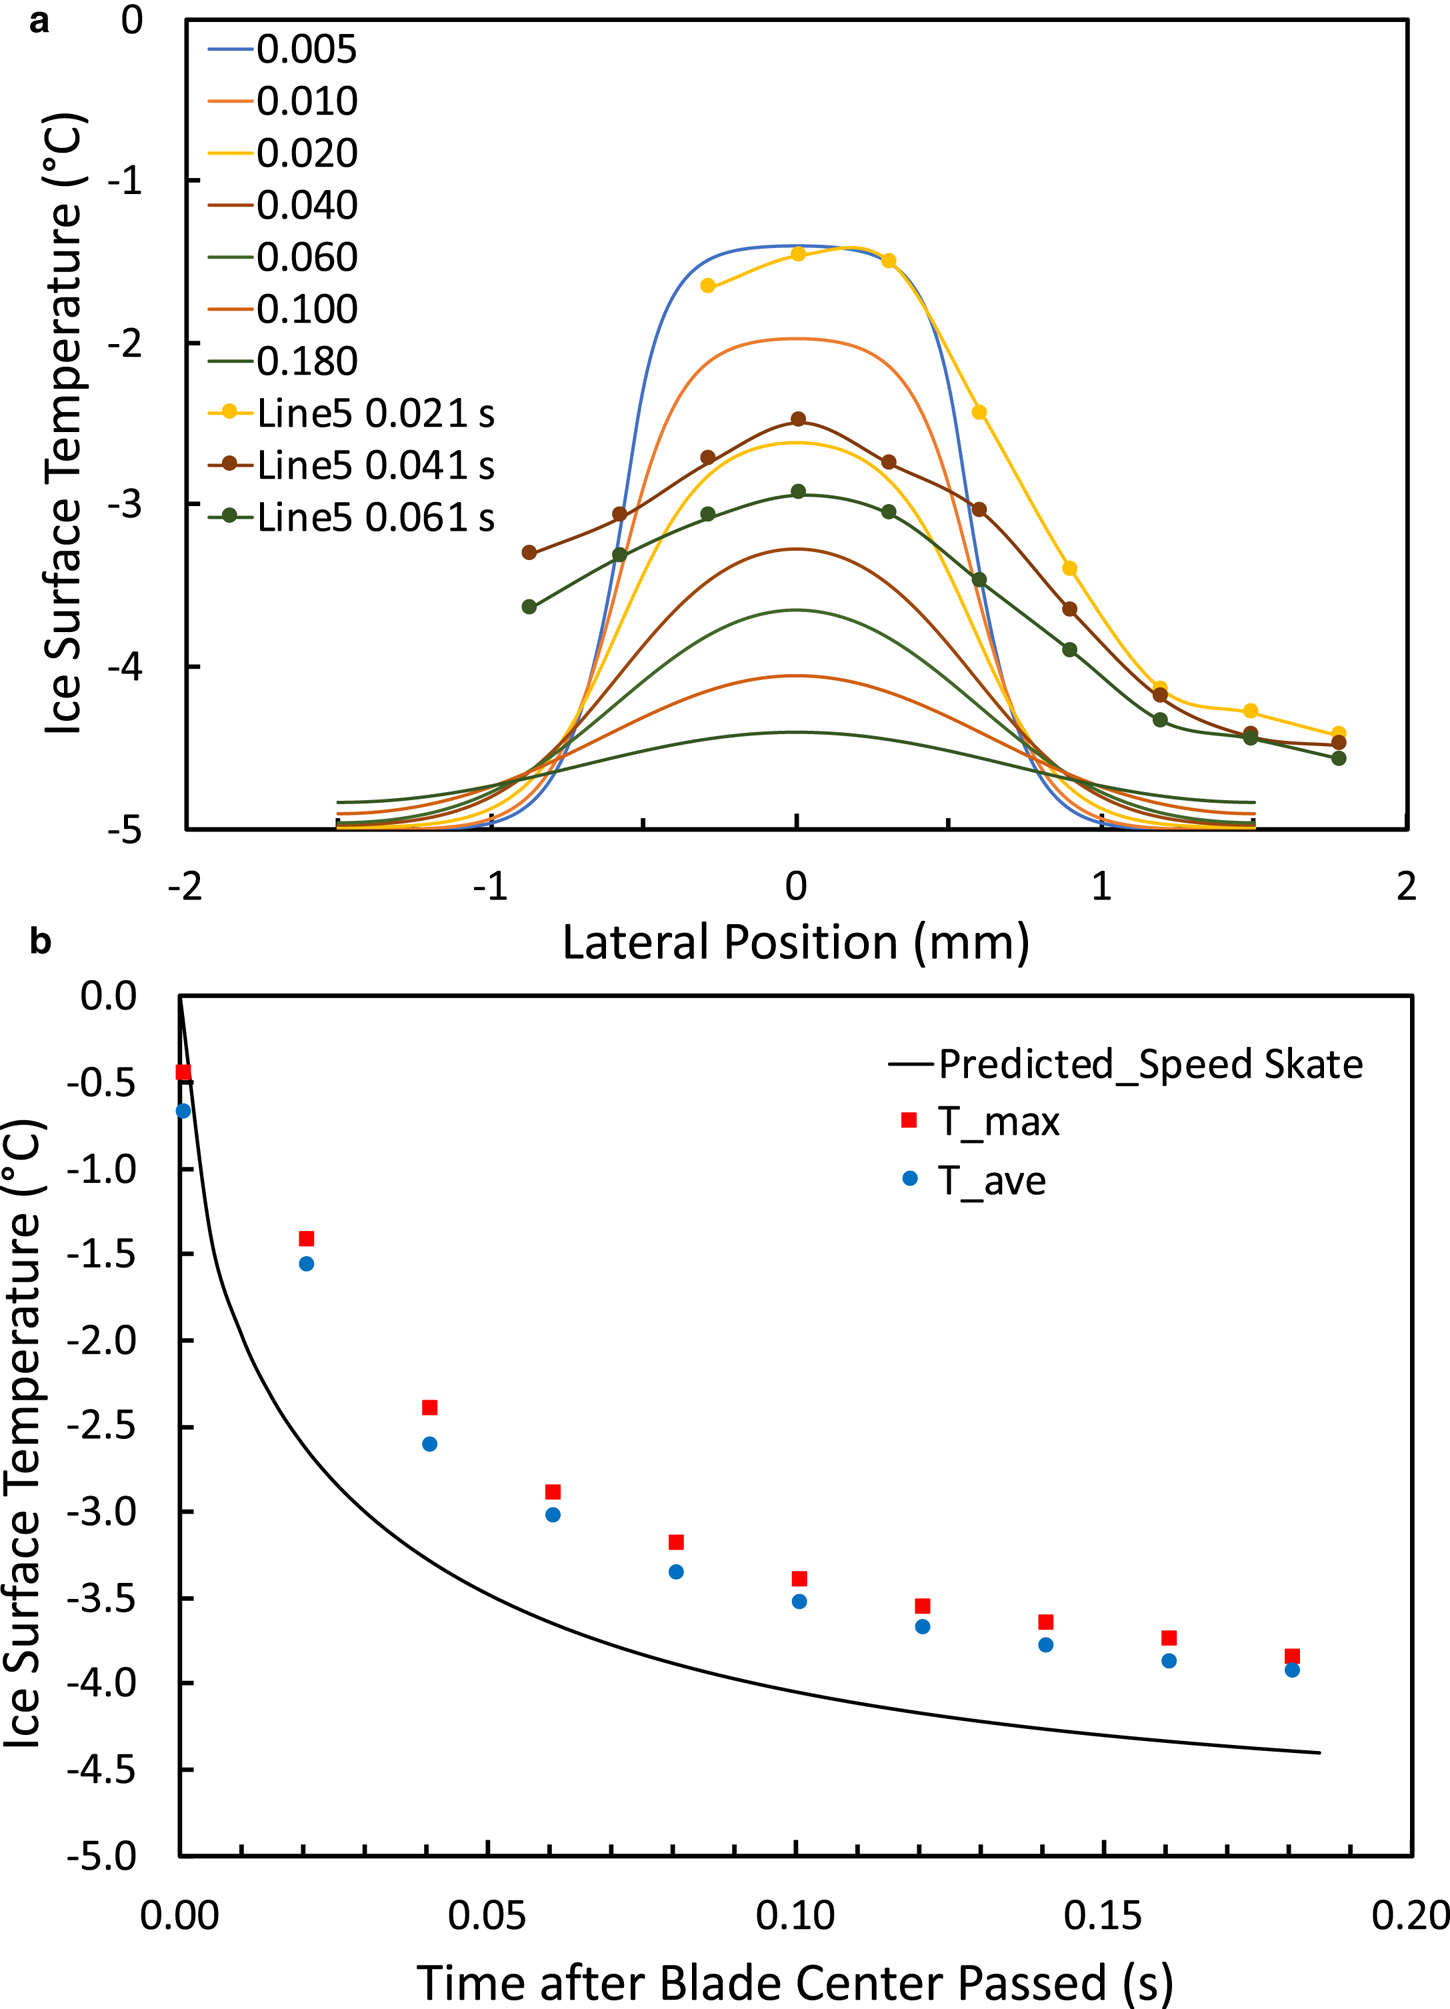
Figure 9a provides a sequence of temperature profiles from a speed-skate pass, 210112 Run 1, across a warm section of the rut near the center of the IR field-of-view (Fig. 5c). The profiles start just after the centerline of the blade passed that location (estimated elapsed time of 0.001 ± 0.001 s) and continue at 0.020 s intervals. The shallow camera angle (46°) captured the blade–ice intersection at 0.001 s, and each successive thermograph revealed the rut temperature as the blade rose away from the ice. Pixel size was 0.30 mm across the rut or up the blade, the latter coated with flat-black paint of high emissivity. At the skate speed of 2.7 m s−1, the camera integration time caused ~15 mm of horizontal blurring of the blade, so that the measured blade temperatures were averages over that length. The ice portions of the thermographs were not blurred.
This temperature-profile sequence provides helpful insight into the blade–ice thermal interaction:
• The peak temperature of −0.45°C occurred at the corner intersection of the blade with the ice. Continuity requires that this be the temperature of both the blade and the ice at that location.
• The steep rise from the background ice temperature to the blade–ice corner temperature occurred over ~5 pixels, indicating some lateral heat flow into the ice or across its surface.
• Assuming 1-D heat flow into the blade, the temperature drop of 0.47°C across 1 pixel at the blade–ice corner indicates that ~2 × 10⁴ W m−2 heat flowed upward into the blade. This represents ~10% for the frictional heat flux if we assume that μ ~ 0.005 and a blade–ice contact length of ~40 mm (per the model of Lozowski and others, Reference Lozowski and Szilder2013). Prior to entering the observation area, the skater had been striding from standstill for ~5 s and then gliding on the imaged skate for ~1.5 s; heat flux into the blade at the beginning of the glide would have been higher.
• At elapsed time 0.021 s, the IR camera imaged ~3 pixels underneath the blade. The peak temperature of −1.5°C fell off quickly with successive profiles, and the profiles showed fairly sharp peaks, although the 0.3-mm pixel size was coarse relative to blade width and could have influenced the lateral temperature roll-off.
Figure 9b shows two profiles across the rut formed by the hockey skate on 201124 run 3. This is the same skate pass shown in Figure 7a, and it produced a two-trough rut profile with weight biased slightly toward the camera. Interestingly, the profile at 0.004 s after the centerline passed shows no discernable heat flux into the blade, indicating that the bulk blade temperature was essentially the same as the blade–ice contact temperature of −2.2°C. The first IR image that viewed the rut, at 0.044 s, shows the double-peak temperature distribution that occurred because the hockey skate was nearly vertical. Peak temperatures of ~−2.5°C indicate that the ice did not cool down rapidly after blade passage, suggesting poor thermal conductivity below the rut surface through fractured ice.
In addition to single-skate glide passes, we also conducted several trials with skaters executing normal strides. It was difficult for the skaters to pass through a small observation area, so we did not capture high-resolution thermography. Nevertheless, HS video captured the shower of ice particles as a skate passed (e.g. Fig. 10), and longer-range video and still photos revealed the distribution of scattered particles along full strides.
Sequence of HS camera images of a hockey skate during the push-off phase of a stride at ~9 m s−1. The ice particles shed from the outside edge of the blade (highlighted by red ovals) slid and bounced across the ice surface toward the camera.
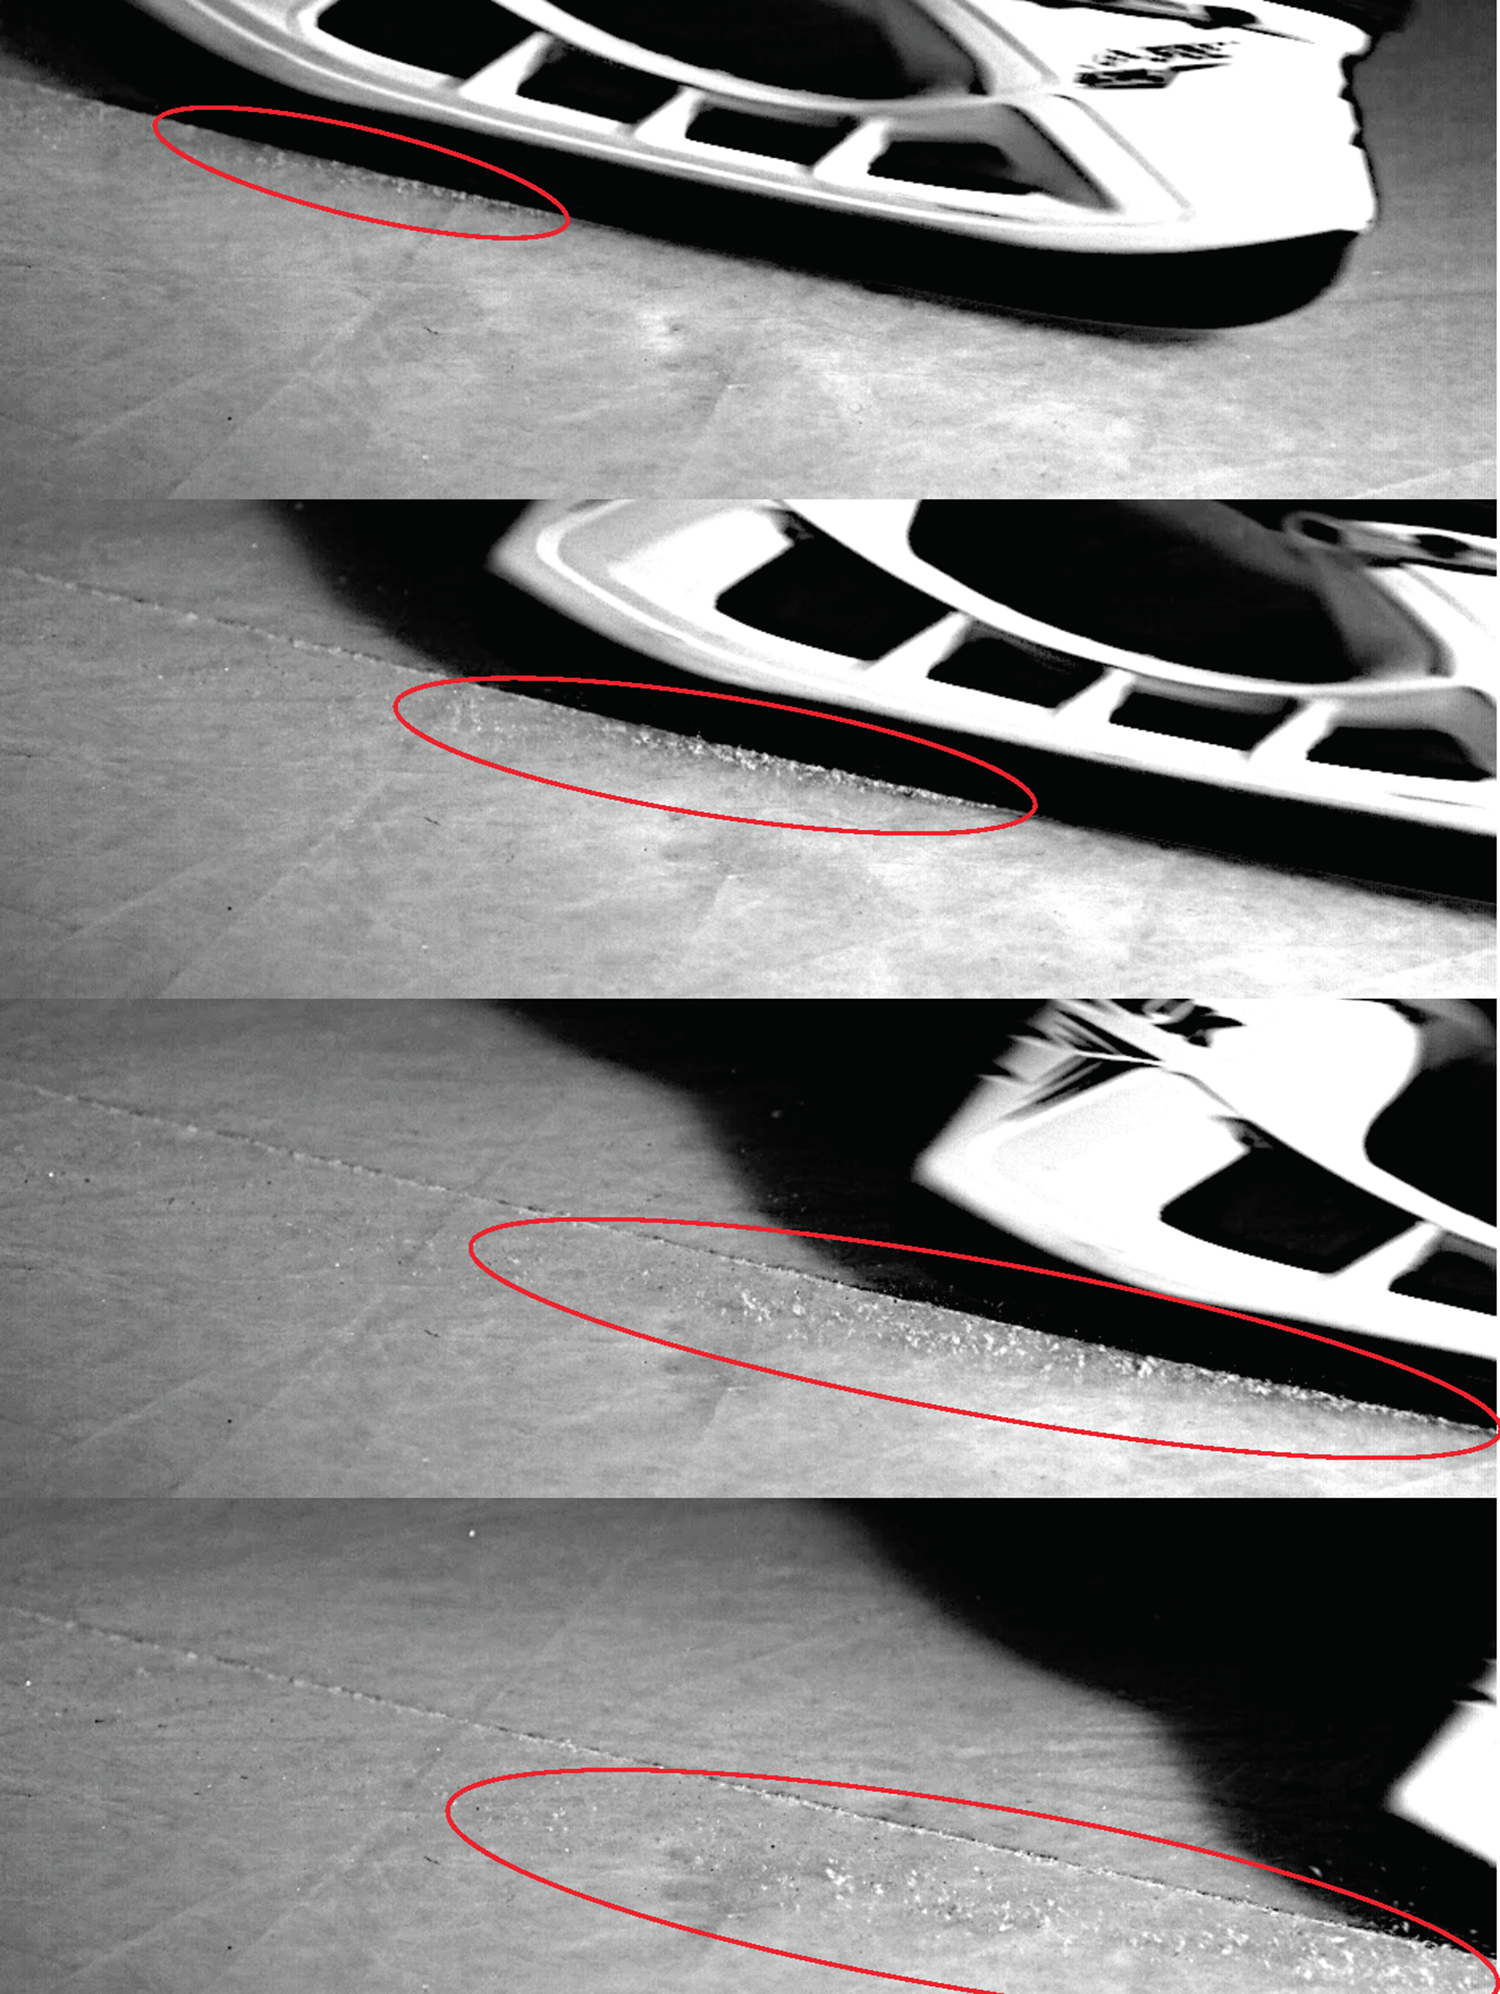
Figure 11 shows the typical distribution of particles scattered during normal skating strides. These patterns of scattered ice particles were visibly obvious for the hockey skates but were difficult to capture for the speed skates owing to the fewer scattered particles. They were, nevertheless, visible to observers at shallow viewing angles and readily captured as warm particles on thermographs.
(a) Pattern of scattered particles during strides on hockey skates; (b) close-up of particles scattered by push-off of right speed skate; (c) sketch of three strides of a skater moving toward top: blue lines are ruts, dot-patterns show scattered particles, and black lines show tilt angle of blade; (d, e) rut–depth profiles overlaid on microscope images of a hockey-skate stride (d) and a speed-skate stride (e) with both skaters on their right skate moving toward top. Weighting of the outside edge at touch-down scattered particles to the outside, roll-over of the blade during the glide scattered particles to the inside, and push-off again scattered particles to the outside. Heavily fractured ice prevented clean rut profiles.
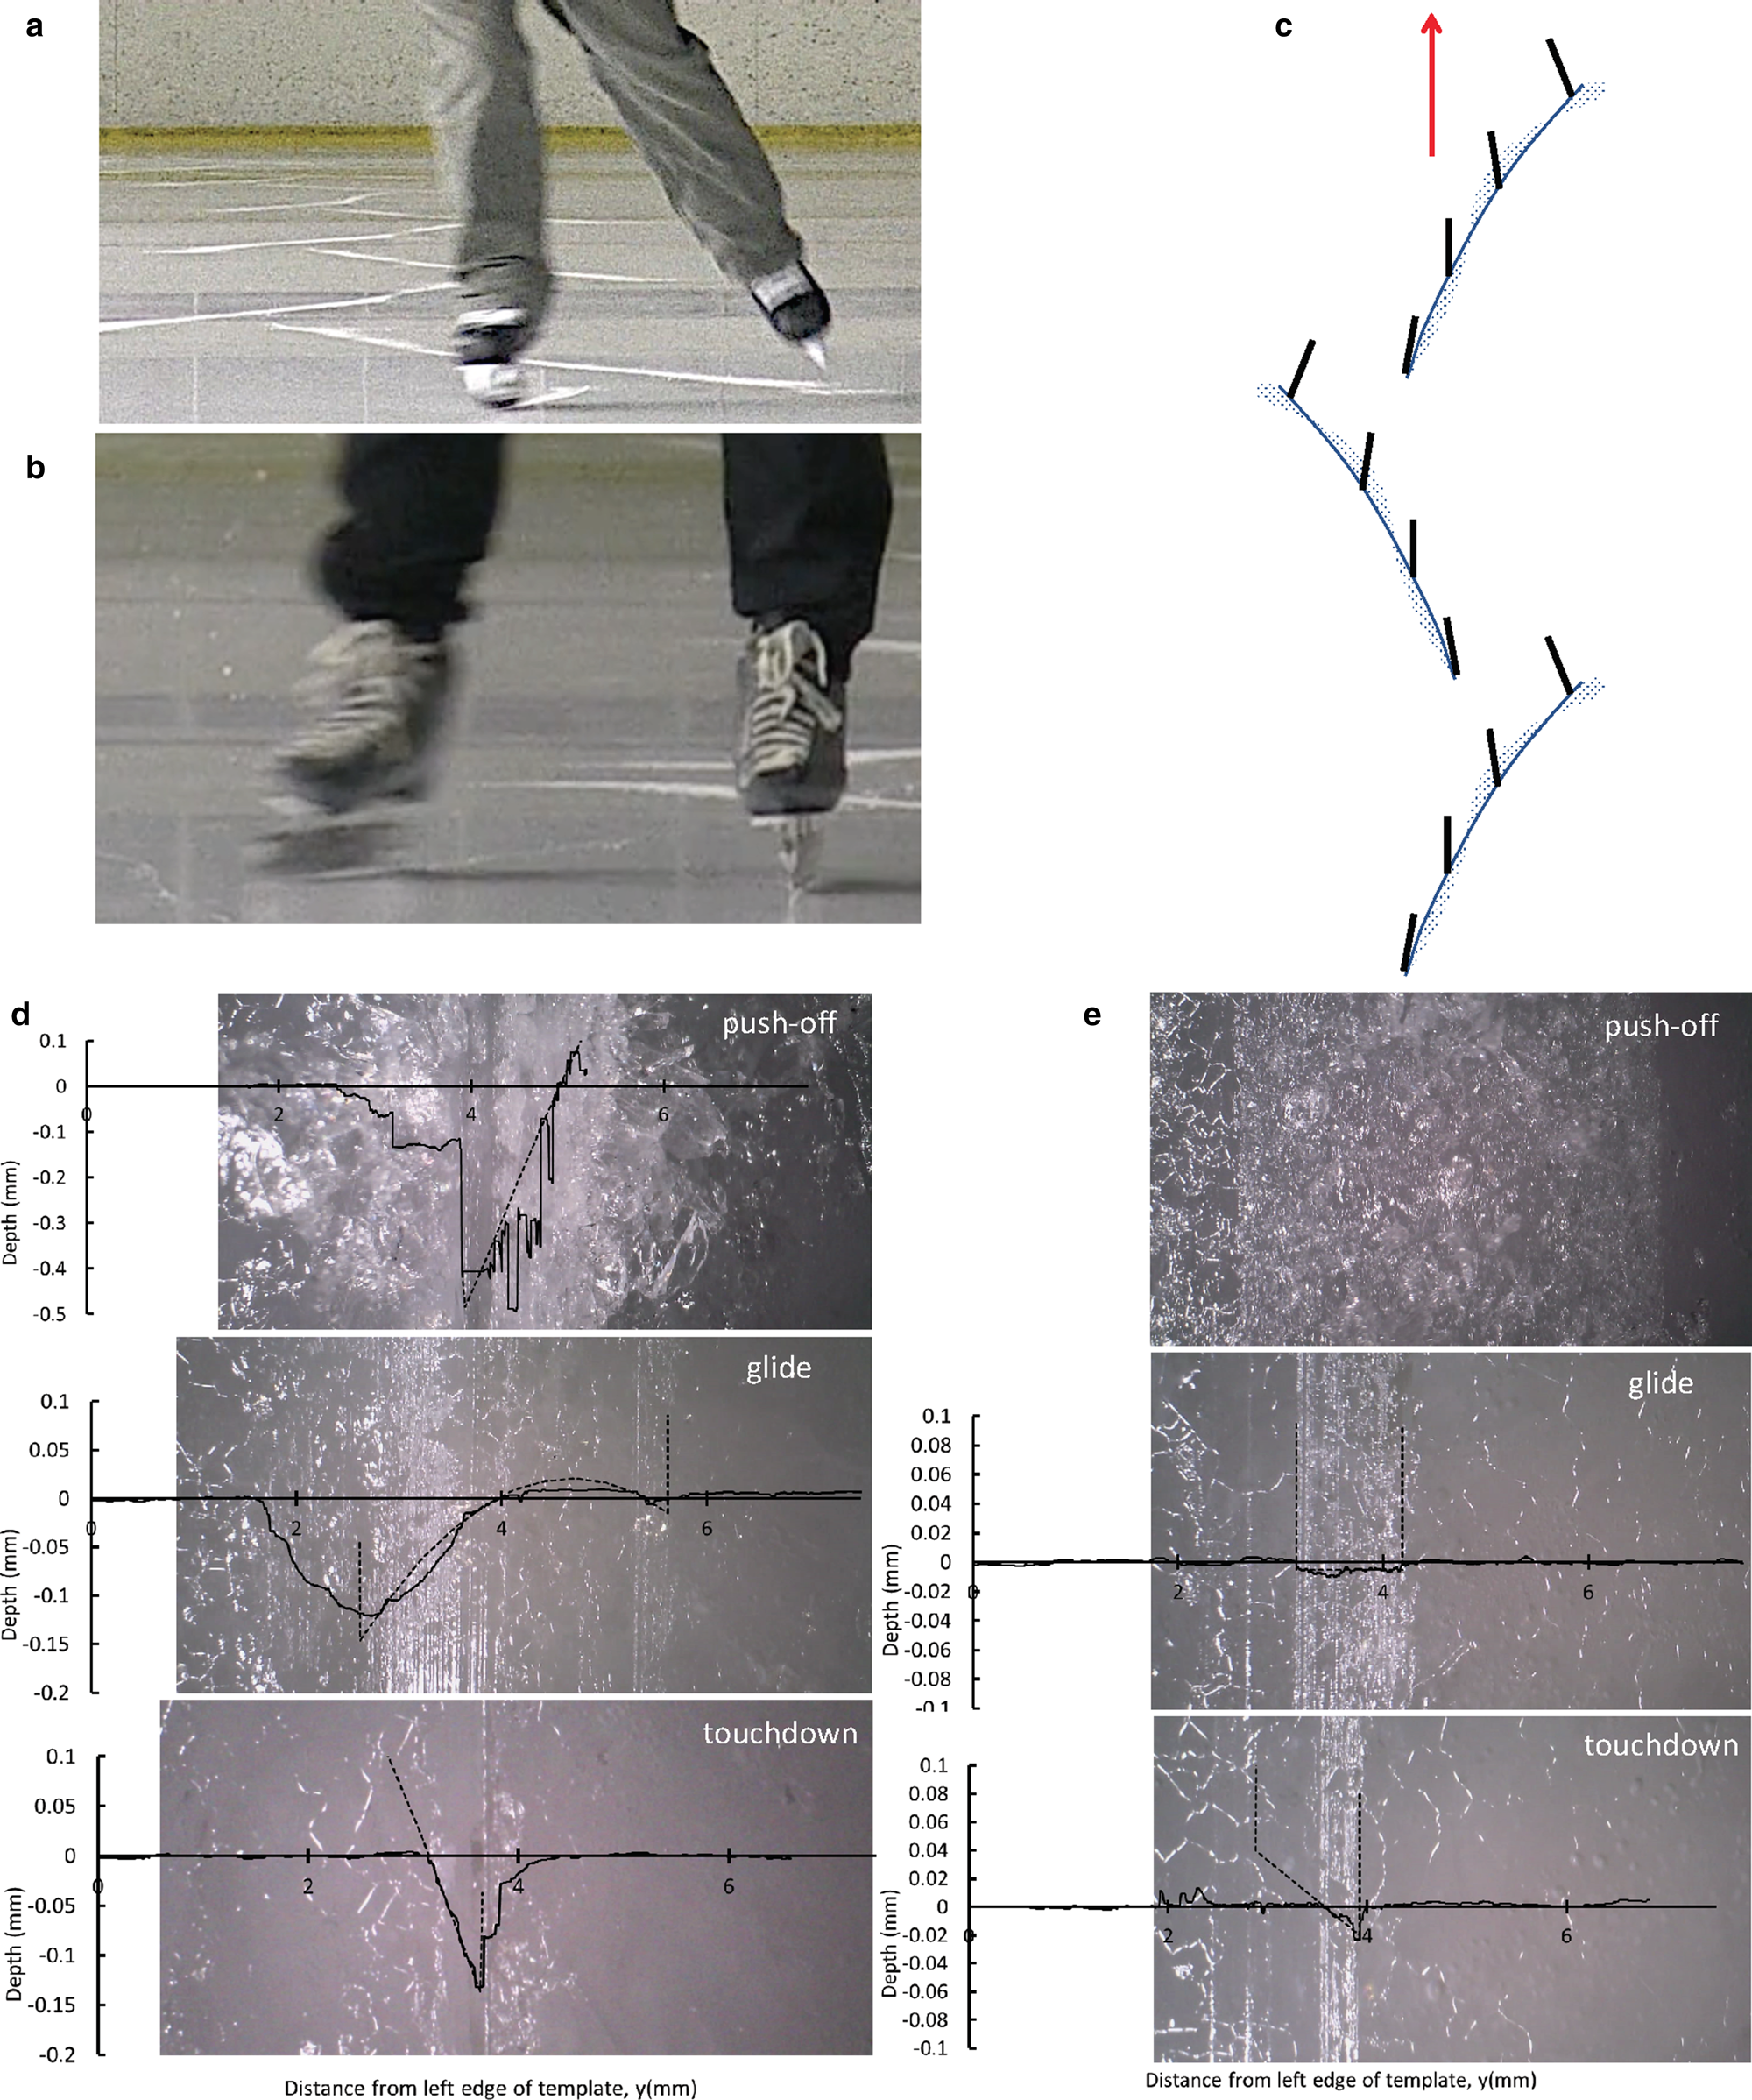
Our videos of skate vertical orientation during normal strides matched the description by de Koning and others (Reference de Koning, de Groot and van Ingren Schenau1992): a skate touches down on its outside edge, rolls over through vertical during the glide, then rolls onto its inside edge more noticeably during push-off. De Koning and others (Reference de Koning, de Groot and van Ingren Schenau1992) identified visible touch-down and push-off ruts made by speed skaters, which they attributed to peaks in their measured friction values. Our rut–depth profiles, overlaid on microscope images in Figure 11d, e, confirm this interpretation. Weighting of the outside edge at touch-down produced a deep V-shaped rut and scattered particles to the outside; roll-over during the glide produced a double-rut by a hockey skate or a flat-rut by a speed skate and changed the scatter pattern from outside to inside; push-off again scattered particles to the outside as the blade generated lateral thrust, with heavily fractured and scraped ice often preventing clean measurements by the confocal profilometer. Colbeck and others (Reference Colbeck, Najarian and Smith1997) also noted the shower of warm ejecta generated during their skating trials but were unable to discern whether these were ice particles or water droplets. We now know they are ice particles, generated through spalling and crushing by skate contact with the brittle ice.
5. Modeling
We implemented in MATLAB the vertical-skate model of Lozowski and Szilder (Reference Lozowski and Szilder2013) and adjusted the input parameters to match our typical hockey- and speed-skate glide passes. This provided model predictions for rut depths and water-film thickness to compare with our measurements. We also used skate-model output to drive a 2-D finite-element model (FEM) to quantify ice and skate-blade heat fluxes and to predict ice-surface cool-down rates. In part, we wanted to assess whether our measured ice-surface temperatures were consistent with the blades making full-width water films at 0°C. We also wanted to investigate the influence of heat flux into the blades. Table 1 shows the skater and skate-geometry parameters, and we selected −5°C as the ice-surface temperature. Table 3 summarizes model results for baseline conditions, neglecting blade heat flux. Supplementary materials provide implementation and validation details on both models.
Vertical-skate model predictions for ice-surface temperature of −5°C, neglecting blade heat transfer
Results for the baseline speed skater are identical to those by Lozowski and Szilder (Reference Lozowski and Szilder2013). The speed-skate and hockey skate predictions are for input conditions that mimic our single-skate glide passes, with the hockey skate modeled as two patches, each 0.75 mm wide, to account for its hollow grind.
Although our measured rut dimensions overlap with predicted values, they vary significantly, consistent with brittle facture of the ice under the blades. Importantly, the model predicts very thin water films for the low speeds of our glide passes, rising gradually from zero at the start of the contact zone to maximum values, h_max, of 0.13 and 0.25 μm for the speed skate and hockey skate, respectively. Even these maximum values fall within the boundary-friction regime (Eqn 4c): h/R c ~ 0.3 for the speed skate and h/R c ~ 0.2, based on their measured roughness (Table 1, $R_{\rm a}^\ast$ ). The observed striations along the ruts made by both blades are consistent with direct blade–ice contact.
We extended the vertical-skate model by including heat conduction into the blade, first using a 2-D FEM and then using the simple analytical expression for 1-D transient conduction for an imposed 0°C boundary condition (Carslaw and Jaeger, Reference Carslaw and Jaeger1959). Validation runs against the 2-D FEM results showed that the 1-D equations produced negligible errors for predicted friction coefficients and water-film thicknesses, confirming a useful simplification made by Lozowski and Szilder (Reference Lozowski and Szilder2013) for the ice heat flux. Supplementary materials provide model details. Table 4 summarizes the results for two ambient temperatures: −2.5°C to mimic the near-surface air temperature during our tests, and −10°C as a typical outdoor temperature for recreational skating. These simulations assume that the blade temperature at touch-down is uniformly at the ambient temperature, and, according to the Lozowski and Szilder (Reference Lozowski and Szilder2013) self-lubrication hypothesis, a 0°C water film forms along the full contact zone for the duration of the glide. The high heat flux at initial touch-down produces much thinner water films, and thus much higher friction coefficients, compared with neglecting blade heat flux.
Predicted friction coefficients for no blade heat flux, heat flux at initial touch-down and then after 2 s of glide

The hockey skate results are for the two-patch ice-contact geometry.
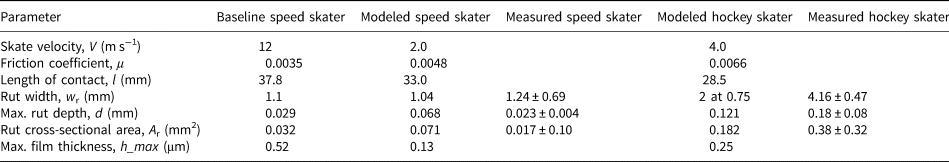
Gliding continuously warms the blade while encountering fresh ice. Consequently, the ice heat flux remains constant but the blade heat flux decreases with glide duration. Figure 12 shows the model-predicted transitions for h_max and friction coefficient as functions of glide time for ambient temperatures −2.5 to −20°C for our hockey skate. We obtained similar results modeling our speed skate. The transitions occur rapidly with glide time for the first ~0.3 s, after which heat flux into the blade becomes small (<20% of total heat flux) and h_max and μ stabilize. Predicted friction is higher at colder temperatures, and the transitions to stable conditions take longer. Given that skating strides can be <0.5 s in total duration (Marino, Reference Marino1977), it may be important to consider heat flux into the blade for accurate simulations. Within the framework of the Lozowski and Szilder (Reference Lozowski and Szilder2013) model, neglecting blade heat flux is reasonable for long-duration gliding. However, predicted water-film thickness for both blades and all temperatures and glide times were well below the thicknesses needed to produce hydrodynamic lubrication (~2–6 μm).
Transitions of hockey-skate water-film thickness, h_max, and coefficient of friction as functions of glide time and ambient temperature. Heat flux into the blade, which causes these predicted transitions, becomes negligible after ~0.3 s of glide time.
The influence of blade heat flux on predicted friction can be quite pronounced, and Lozowski and Szilder (Reference Lozowski and Szilder2013) noted that neglecting it may not be appropriate at recreational skating speeds. Also, high blade heat fluxes, and consequently higher predicted friction, just after touch-down complicates attributing the higher touch-down friction measured by de Koning and others (Reference de Koning, de Groot and van Ingren Schenau1992) to greater ploughing friction, as predicted by Lozowski and others (Reference Lozowski, Szilder and Maw2013).
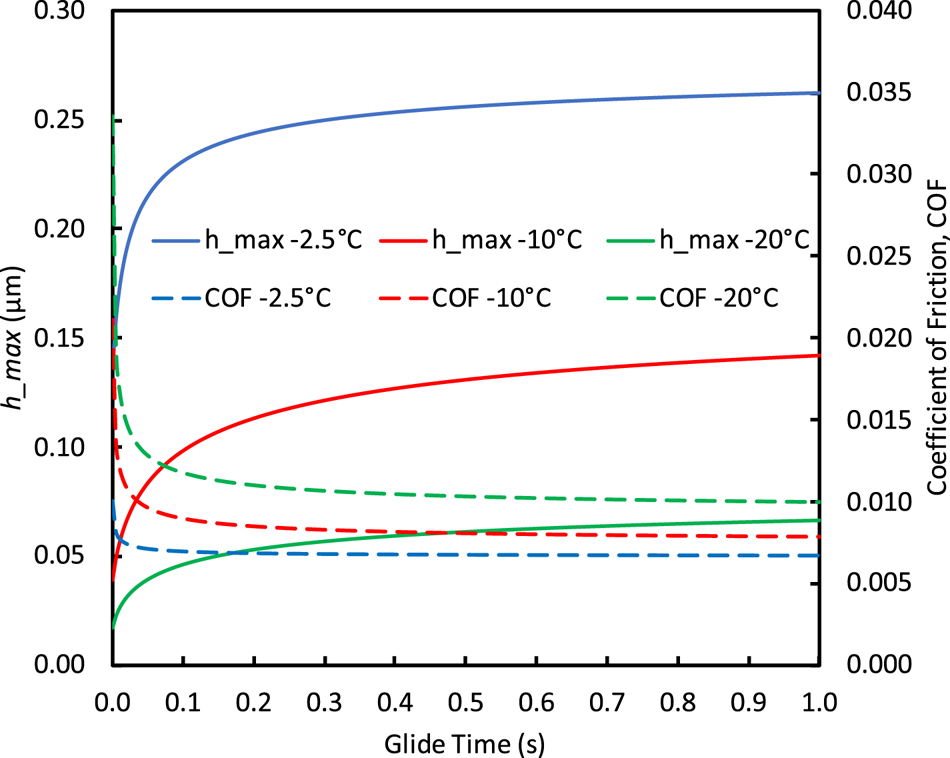
We also used our 2-D FEM to examine whether measured ice cool-down rates were consistent with full-width ruts formed at 0°C during blade passage. Figure 13 compares predicted and measured ice-surface temperatures for a speed-skate glide pass, and Figure S6 compares results for a hockey-skate glide pass, both with essentially vertical blades.
Predicted and measured ice-surface temperatures after speed-skate glide pass on 210112 run 1: (a) profiles across the rut, with elapsed time in s from blade passage, and (b) cool-down of the maximum and 3 × 3-pixel average temperature at the rut center. The IR-based measurements (symbols) were from the center of a fairly uniform, smooth rut (same location as Fig. 9a).
Measured ice-surface temperature profiles showed much broader lateral disturbances and slower cool-down rates compared with the 2-D model. The slower measured cool-down rates could result from lower thermal conductivity of ice fractured under the blades. Unfortunately, despite temperature measurements only 0.02 s after passage of the skate centerline, the measured ice cool-down curves do not confirm or exclude the possibility that the skates formed 0°C melt layers during passage.
The broader measured ice-surface temperature profiles could have resulted from squeeze-flow of water or an ice-rich slurry, or from lateral scattering of warm ice particles. These processes might account, in particular, for the high temperatures between the two ruts made by the near-vertical hockey skate (Fig. S6a). Interestingly, the double temperature peaks from the hockey skate are inboard of those predicted by the FEM, inboard of the deepest parts of the ruts and near the central intact ice (see Fig. 7a). Many of the measured speed-skate temperature profiles also peaked toward the top of the rut near the intact ice rather than at the rut bottom (e.g. Fig. 8b). These temperature-profile characteristics are inconsistent with full-width melting and are more consistent with ice failure and particle scattering near the rut bottoms and blade–ice contact along the intact ice near the top of the rut.
Supplementary materials also include an analysis of the error in measured ice-surface temperatures owing to IR emissions-mixing from colder ice below the surface during cool-down after skate passage. Lever and others (Reference Lever2018) provided a detailed description of the nature of the IR-mixing error for the same camera viewing snow grains (ice). We found that the measured IR temperatures were within −0.07°C of the ice-surface temperatures 0.007 s after skate passage, and the IR-mixing error continued to reduce with elapsed time. That is, IR mixing had negligible effect on measured rut temperatures.
6. Discussion
Self-lubrication from frictional heating is the most broadly accepted mechanism to account for low ice–skate friction. It is also the mechanism most thoroughly developed into predictive models, with the model by Lozowski and others (Reference Lozowski and Szilder2013) providing remarkably good agreement with measured speed-skate friction. Nevertheless, our review of these models and our skating-trial observations indicate that the underlying mechanics may not be correct.
The model by Lozowski and others (Reference Lozowski and Szilder2013) includes the frictional resistance from ploughing a rut though the ice, and it uses hardness values based on HS impacts that produce brittle failure. However, it omits any further role of the crushed particles between the blade and the intact ice. That is, the model does not treat the crushed particles as third bodies to affect the blade–ice contact mechanics (Iordanoff and others, Reference Iordanoff, Berthier, Descartes and Heshmat2002; Fillot and others, Reference Fillot, Iordanoff and Berthier2007), and it does not consider whether the particles partially or completely melt from continued blade movement or contribute some portion of the power expended to create them to the water-film heat budget. Collectively, these assumptions imply that all the particles generated by crushing are ejected from beneath the blade and carry away any residual heat from their formation. The model assumes that the crushed rut simply provides a smooth blade–ice contact length over which forms a full-width, self-generated water film. The self-lubrication models by Le Barre and Pomeau (Reference Le Barre and Pomeau2015) and van Leeuwen (Reference van Leeuwen2017) also do not include the mechanics of brittle fracture of the ice under the blade or the fate of the crushed particles.
Even after fully developing along the blade, water-film thicknesses predicted by the Lozowski model are an order-of-magnitude too thin to produce hydrodynamic lubrication (i.e. fully separated surfaces). Our microscope images routinely revealed striations along the ruts, clear evidence of contact between blade asperities and the ice. Consequently, for unpolished skates, the friction force and heat flux generated along the blade cannot be attributed solely to shearing of the water film (Eqns (1)–(3)) and should include contributions from the asperity–ice contacts. These contributions could be quite different from the crushing force included in the Lozowski model.
Hockey skates abundantly generated and scattered warm ice particles during all phases of skating strides during our trials. The particles were likely from spalling along the blade edges, as captured by HS video, observations of conchoidal fractures on microscope images, and large excavated areas along the more heavily weighted sides of rut–depth profiles. Speed skates also generated and scattered warm ice particles (as confirmed on IR thermographs) but less abundantly. The slightly sharper corners of hockey-skate blades (83° vs 90°) probably do not account for this difference. Both would generate very high-elastic stresses prior to brittle ice failure at the corners. Rather, the much deeper ruts created by hockey skates (0.18 ± 0.08 mm) compared to those by speed skates (0.023 ± 0.004 mm) must induce more lateral spalling. Even small blade tilt angles can produce large variations in rut profiles. Flat-bottomed profiles were rare for the speed skate especially given that the glide trajectories were fairly straight. These rut characteristics reflect brittle failure under the blades.
Several observations weigh against the presence of full-contact water films supporting the skates:
• Striations along the ruts mimic the roughness of the blade bottoms. Although these could represent the contours resulting from melting, they more likely result from abrasion by the blade asperities. Liefferink and others (Reference Liefferink, Hsia, Weber and Bonn2021) also observed striations in ice substrates from increasingly rough glass spheres and attributed them to ploughing at the asperities.
• Average roughness for both blades was similar to or greater than maximum water-film thicknesses predicted by the model of Lozowski and Szilder (Reference Lozowski and Szilder2013). This discrepancy challenges the assumption of Couette and squeeze-flow between smooth ice and blade surfaces, which requires roughness to be much smaller than film thickness everywhere along the blade (Eqn (4a)).
• The irregularly shaped rut–depth profiles do not map simply onto blade profiles, suggesting random fracture of ice beneath the blade rather than smooth melting.
• Fractured ice under the blade could provide local traps for pressurized meltwater, complicating the formation of full-width water films.
• Thermographs revealed that the ruts were not smoothly warmed along their lengths or widths for either skate. Isolated warm locations were common, and temperatures did not decay smoothly with position (time lag) relative to the blade centerline as would be expected for full-contact films.
Unfortunately, we were unable to obtain IR thermographs of rut temperatures immediately after the centerline of the blade passed the observation area (or say within 0.001 s) to minimize the effect of possible refreezing and cool-down of thin-predicted water films. This was particularly true for the relatively longer speed skate. We obtained one lucky high-resolution thermograph on 201013, which measured a maximum rut temperature of −1.8°C at 0.010 s. Our next best in terms of timing were from shallow-angle IR views (−1.5°C at 0.021 s from 210112).
We obtained the best measures of blade–ice contact temperatures from shallow-angle thermographs on 21012 (Fig. 9a – speed) and 201124 (Fig. 9b – hockey). These provided maximum blade–ice corner temperatures of −0.45 and −2.2°C, respectively. These values are outside of our expected measurement uncertainty for 0°C and suggest that any melting would have occurred under pressures of ~6 and 27 MPa, respectively. The speed-skate pressure is within the value of 17.4 MPa from drop-ball tests at the −4.5°C ice temperature (Poirier and others, Reference Poirier, Thompson, Lozowski and Maw2011), but the hockey-skate value indicates that local pressure was higher than average hardness.
Collectively, our observations are more consistent with skate friction generated at irregularly spaced HPZs under the blade. Gagnon and Molgaard (Reference Gagnon and Mølgaard1989) and Gagnon (Reference Gagnon2016) observed ice-rich slurries at isolated HPZs under crushing-friction tests, and Canale and others (Reference Canale2019) measured viscoelastic rheology of the lubricating film during friction tests and attributed it to a slurry of ice particles and water. Supporting observations include:
• Thermal signatures of ruts showed significant lateral and longitudinal variability, with localized warm patches, suggesting the presence of HPZs of contact rather than smooth, uniform pressure generated through squeeze-flow of a water film.
• Spalling along skate edges is consistent with spalling at indenter edges and along the sides of HPZs.
• Striations along the ice are consistent with abrasion by blade asperities, which is direct blade–ice contact and would generate micrometer-scale ice particles by brittle fracture to contribute to the slurries.
The power needed to create crushed-particle surface area does not consume a large fraction of the frictional power measured during indentation tests (Jordaan and Timco, Reference Jordaan and Timco1988). However, near the front of a skate–ice contact zone, the downward rate of indentation is a maximum, and crushing and flow of crushed particles probably dominates local power losses. The subsequent fate of the particles, including whether they contribute to an ice-rich slurry, warrants more attention. If present, the squeeze-flow and shearing of the slurry would likely dominate skate-friction losses as it does for ice indentation (Jordaan and Timco, Reference Jordaan and Timco1988; Gagnon, Reference Gagnon2010).
Another important role of irregular contact between the blade and the ice (either from crushed particles or isolated slurries) would be to direct more of the frictional heat upward into the blade. Lever and others (Reference Lever, Taylor, Hoch and Daghlian2019) demonstrated this effect for a slider on snow by applying the tribology model of Tian and Kennedy (Reference Tian and Kennedy1993). For small flash temperatures (likely for millimeter-scale contacts), most of the frictional heat will flow into the slider to raise its nominal temperature to that of the persistently heated ice contacts. The higher thermal conductivity of steel relative to ice enhances this effect. Heat flow into the blade should be important at low speeds and initial motion, until the blade warms appreciably. Cold ambient temperatures will enhance the role of blade heat transfer.
It is possible that nano-scale QLLs would affect the rheology of an ice-rich slurry, but we observe no direct role for QLLs to govern skate friction. Blade asperities are one to two orders-of-magnitude greater than the thickness of these surface layers. Even with the ubiquitous presence of QLLs on ice at the temperatures of interest, blade shear loads should produce brittle failure and wear at the ice surface, similar to that observed by Lever and others (Reference Lever, Taylor, Hoch and Daghlian2019), and normal loads should cause brittle crushing, similar to that observed during ice-indentation tests.
Our observations cannot exclude the possibility that localized melting under blade asperities governs skate friction, but it seems unlikely given the brittle behavior of ice. It is difficult to envision how steel-blade asperities can compress and ride onto ice asperities without producing brittle fracture and wear particles (Fig. 2a). Furthermore, blade asperities may be interacting with crushed-ice particles rather than intact ice; these particles may rotate, translate or fracture during asperity interactions to prevent high contact temperatures. Even if the ice is smooth (Fig. 2b), pressure melting constrains the contact area to be a significant fraction of the nominal area. In the absence of a full hydrodynamic film, randomly rough blade asperities must penetrate deeply into the ice for the blade to achieve the needed contact area, and the deeper asperities would likely fracture the ice as they move forward.
How could the higher viscosity of ice-rich slurries lead to similar friction as a liquid-water film? As we have noted, actual skates directly contact the underlying ice, so a proper comparison would be between boundary or mixed-mode friction and friction developed by ice-rich slurries under HPZs. Nevertheless, pure hydrodynamic friction varies as μ w/hσ (see Eqn (3)). Increasing viscosity would increase layer thickness h (via reduced squeeze flow), and the higher pressure σ at HPZs supported by ice-rich slurries would decrease friction. For example, increasing viscosity 10× in the Lozowski and Szilder model of our skates increased calculated hockey and speed friction by only 28 and 20%, respectively, with the viscosity increase nearly balanced by thicker water films. This calculation does not account for increased pressure at HPZs compare with the modeled full-contact water films.
The model of Lozowski and others (Reference Lozowski and Szilder2013) reproduces measured speed-skate friction remarkably well, and it thus must approximate the net energetics. However, it treats ice crushing separately from hydrodynamic lubrication, whereas crushing, abrasion and lubrication of the interface must be coupled and vary in influence along the blade. The mechanics observed under rapid ice indentation suggest a way to couple these processes through the creation and shearing of ice-rich slurries under spatially distinct HPZs. We are working to model this mechanics.
Our effort to investigate the mechanics of skate friction during actual skating imposed limits on our measurement techniques. Most importantly, it required a stand-off distance between the IR and HS cameras to allow the skaters to pass. This prevented us from obtaining higher-resolution observations of blade–ice interactions and the resulting rut temperatures immediately after blade passage. It was also not possible to view through the ice or the blade, per Gagnon (Reference Gagnon2010, Reference Gagnon2016), to observe the interaction processes with the HS camera to confirm the presence of HPZs and ice-rich slurries and to estimate the corresponding contact pressures. We hope to overcome these issues with a linear tribometer specifically designed to make these observations.
7. Conclusions
Somewhat surprisingly, the mechanics responsible for the low friction of skates on ice remains uncertain despite research interest for over a century. The hypothesis of self-lubrication from frictional heating remains most popular and has been most fully developed into predictive models. Nevertheless, our review of these models and our skating-trial observations indicate that the underlying mechanics may not be correct.
Other mechanisms could play important roles in ice friction (e.g. pressure-melting, quasi-liquid surface films, abrasion, ice-rich slurries and melting at asperities), and skating should induce similar brittle failure of the ice as observed during rapid indentation tests. We undertook detailed observations of skating on an indoor rink with an objective to assess the merits of these friction hypotheses. Although we may not have definitive answers, our observations did not confirm the presence of full-contact water films and are more consistent with the presence of lubricating ice-rich slurries at discontinuous HPZs.
We are persuaded by the close analogy with the processes observed during rapid ice-indentation that HPZs and the resultant ice-rich slurries likely play a strong role in skate-friction mechanics. HPZs can develop pressure sufficient to lower the melting point at the contact zone to the ice-bulk temperature (90 MPa at −5°C). The majority of the skater weight could then be supported on a few HPZs, mediated by thin layers of ice-rich slurry formed by crushing and abrasion. The energetics of this process warrants consideration as a possible explanation for low skate friction. The presence of ice-rich slurries supporting skates through HPZs merges pressure-melting, abrasion and lubricating films as a unified hypothesis for why skates are so slippery across broad ranges of speeds, temperatures and normal loads.
We could not obtain direct confirmation of the micro-mechanics acting under the blades owing to the limitations of observing actual skating strides and glide-passes. Potentially, a linear tribometer, with a HS camera viewing through transparent ice and a high-resolution IR camera viewing the rut immediately after blade passage, could obtain the necessary observations to resolve the mechanics that govern ice–skate friction. We hope to undertake such an effort.
Supplementary material
The supplementary material for this article can be found at https://doi.org/10.1017/jog.2021.97.
Acknowledgements
The authors thank Kathy Jones for her enthusiasm and patience as our short-track speed skater, and Alexis R. Lovell for her perseverance in conducting the confocal-microscope measurements of skate-bottom roughness. We also thank Dick Dodds, for his flexibility in scheduling our ice time at Campion Rink, and the Hanover Improvement Society for implementing safe pandemic-related protocols to permit its use. The authors appreciate the thoughtful handling of the manuscript by the scientific editors and the insightful comments of the reviewers, all of which helped to improve the final manuscript. We are grateful for funding provided by the US Army Engineer Research and Development Center, Military Engineering Program under the Basic Research Portfolio.


 Open access