

Introduction
Between c. ad 350 and 1200, Europe witnessed considerable movement of people, ideas, and goods, reflecting cultural, religious, economic, and political change detectable to a greater and lesser degree in the archaeological record. In this article, I consider issues of change and dynamism by studying the isotopic signatures of people buried in late Antique and early medieval cemeteries, to capture socio-environmental interactions and transitions in the first millennium ad.
Everyone must eat and drink, and hence consumption is central to understanding the socioeconomics of the past—not just what people ate, but how they obtained it, commercialized it, traded it, stored it, cooked it, and thought about it. Migrant groups often bring their foodways and other cultural traditions with them, and cross-cultural interaction can create new hybrid foods and identities (Cook, Reference Cook2008; Weller & Turkon, Reference Weller and Turkon2015).
Biomolecular archaeology gives us a unique toolkit for studying foodways, mobility, past individuals and their bodies, and the contexts in which they lived. This toolkit can be used at both individual and population scales, which makes it very versatile. Within biomolecular archaeology, isotopic analyses use the chemical memories of past events stored in the tissues of the dead to inform us about their lives, helping us to better understand resource exploitation, agriculture, the economy, foodways, and identity.
This article presents an integrated large-scale meta-analysis of collagen isotopic data for the first millennium ad in England and western Europe. It is believed to be the first of its kind at this scale: previous studies have been smaller and more focused assessments of isotopic data (e.g. O'Connell & Hull, Reference O'Connell, Hull, Hinton, Crawford and Hamerow2011; Mays & Beavan, Reference Mays and Beavan2012; Hannah et al., Reference Hannah, McLaughlin, Keaveney and Hakenbeck2018). The aim is to better identify and assess the impact of major transitional events such as changes in agricultural practice and the ‘Fish Event Horizon’. Further, the goal is to compare, contrast, and quantify regional dietary variation for the period. England is at the core of this study for two reasons: it has the most isotopic data available for any region in the period between c. ad 350 and 1200 and it has arguably been more heavily affected by the events noted above, making it an ideal case study to track dietary transitions.
Basic Principles of Stable Isotope Analysis
Stable isotope analysis in archaeology is a well-established technique. It is based on the fact that different foods vary in their isotopic compositions and that these can be quantified (Gannes et al., Reference Gannes, del Rio and Koch1998). Collagen reflects the average isotopic composition of dietary protein consumed during the period of tissue formation/turnover (Hedges et al., Reference Hedges, Clement, Thomas and O'Connell2007).
Carbon stable isotope ratios can discern between diets based on C3 plants and C4 plants and are useful in differentiating between marine and terrestrial food resources (O'Leary, Reference O'Leary1988). Nitrogen stable isotope ratios indicate the position of an organism in the food chain, and increase ~3–5‰ per level of the food chain (Bocherens & Drucker, Reference Bocherens and Drucker2003; Lucy et al., Reference Lucy, Newman, Dodwell, Hills, Dekker and O'Connell2009); δ15N can also be altered by factors such as breastfeeding, pregnancy, and periods of nutritional stress (Fuller et al., Reference Fuller, Fuller, Sage, Harris, O'Connell and Hedges2005; Beaumont et al., Reference Beaumont, Montgomery, Buckberry and Jay2015).
The carbon in enamel is derived from blood carbonate, which in turn comes from metabolism and is thought to represent whole diet (protein, fats, and carbohydrates) (Ambrose & Norr, Reference Ambrose, Norr, Lambert and Grupe1993; Tieszen & Fagre, Reference Tieszen, Fagre, Lambert and Grupe1993; Hedges, Reference Hedges2003; Zhu & Sealy, Reference Zhu and Sealy2019). Calculating the differences between enamel, bone, and dentine can therefore narrow down trophic level and dietary changes through life.
First Millennium ad Dietary Transitions
Here, I focus on how isotopic signatures record human–environment interactions, how major socio-environmental change may disrupt these patterns, and whether these transitions were widespread in western Europe. Indeed, events such as the agricultural ‘revolution’ of the eighth to thirteenth centuries ad, Christianization (in the seventh–eighth centuries in England), and the ‘Fish Event Horizon’ of c. ad 1000 represent significant socio-economic shifts that had an impact on foodways across western Europe, including England.
The re-introduction of Christianity to eastern England had political and economic implications; it may have affected diet, mainly through religious dietary laws such as those of Wihtred of Kent (c. ad 695) that imposed fines on those eating meat during fasting (Whitelock, Reference Whitelock and Whitelock1996). This allows us to investigate orthopraxy through the archaeological record (Barrett, Reference Barrett and Carver2003; Knapp, Reference Knapp2018: 290-300; Reynolds, Reference Reynolds2015).
The ‘agricultural revolution’ between the eighth and thirteenth centuries ad saw an increase in cereal production, and changes to the types and quantities of crops cultivated, alongside technological innovations like the mouldboard plough. This supported growing urban communities and facilitated changes in power structures across much of Europe, especially England (Duby, Reference Duby1997; Banham & Faith, Reference Banham, Faith, Banham and Faith2014; Dyer et al., Reference Dyer, Thoen, Williamson, Dyer, Thoen and Williamson2018; Hamerow et al., Reference Hamerow, Bogaard, Charles, Forster, Holmes and McKerracher2020).
The ‘Fish Event Horizon’ (FEH hereafter) constitutes another key dietary shift evident in the zooarchaeological record of Europe around ad 1000 (Barrett et al., Reference Barrett, Locker and Roberts2004a, Reference Barrett, Locker and Roberts2004b). It refers to a significant increase in marine fish consumption compared with earlier periods. Why there was an avoidance of marine resources before the ninth century is unclear, but it is likely a mixture of socio-environmental factors (Barrett et al., Reference Barrett, Locker and Roberts2004a, Reference Barrett, Locker and Roberts2004b, Reference Barrett, Orton, Johnstone, Harland, Van Neer and Ervynck2011; Serjeantson & Woolgar, Reference Serjeantson, Woolgar, Woolgar, Serjeantson and Waldron2006; Reynolds, Reference Reynolds2015: 230-96; Barrett, Reference Barrett, Barrett and Orton2016; Orton et al., Reference Orton, Morris and Pipe2017). Such a major shift towards marine consumption should be evident in the human isotopic data, but this has so far not been studied with a large human isotopic dataset (Reynolds, Reference Reynolds2015: 212-22, 295; Barrett, Reference Barrett, Barrett and Orton2016; Müldner, Reference Müldner, Barrett and Orton2016).
These large-scale transitions and human adaptations demand a broad-scale approach, using meta-analytical methods for compiling and analysing the data. Computational meta-analyses are highly complex and an emerging style of research in archaeology; they are ‘neither quick nor easy’ (Berman & Parker, Reference Berman and Parker2002) due to the challenges of data standardization, cross-study comparisons, and the statistical difficulties they pose (Greco et al., Reference Greco, Zangrillo, Biondi-Zoccai and Landoni2013; van Wely, Reference van Wely2014). The following section briefly summarizes the approach taken.
Materials and Methods
The dataset comprises 5334 human isotopic entries from twenty-six modern countries and 200 sites (Figure 1). It is a subset of the entire dataset described in detail in Leggett et al. (Reference Leggett, Rose, Praet and Le Roux2021), which includes further bioapatite data not analysed here. While the data used here are not comprehensive, with some geographical and chronological gaps, they do bring together the largest isotope dataset for first-millennium ad western Europe, using legacy data and newly generated isotopic data from England.
Map of sites (after Leggett et al., Reference Leggett, Rose, Praet and Le Roux2021) analysed in this article, the tissues present, and their geo-cultural regional designations.

The regional designations in Figure 1 were created to limit the use of current political boundaries and the problematic use of ethnic identifiers for past geo-political zones, while also incorporating some of the environmental and geological variation across Europe. The zonation resulted from plotting the sites to look for spatial clustering and adjusting these with δ18O and 87/86Sr isoscapes (Evans et al., Reference Evans, Montgomery, Wildman and Boulton2010, Reference Evans, Chenery and Montgomery2012, Reference Evans, Chenery, Mee, Cartwright, Lee, Marchant and Hannaford2018; Bataille et al., Reference Bataille, Crowley, Wooller and Bowen2020), as well as cultural factors such as grave good styles and linguistic aspects (for details see Leggett et al., Reference Leggett, Rose, Praet and Le Roux2021).
Statistical analyses were performed using Free and Open-Source R version 3.6.2 and RStudio version 1.2.5033 (R Development Core Team, 2017; RStudio Team, 2019). The code and data are available at https://doi.org/10.17605/OSF.IO/6B8MZ. Full data compilation and standardization details are available in Leggett et al. (Reference Leggett, Rose, Praet and Le Roux2021) and further details on statistical analyses are available in the online Supplementary Material.
Archaeological data are often subject to strong biases (e.g. large differences in sample sizes between groups), as is the case with these data. These biases would violate assumptions for common statistical approaches (e.g. ANOVA and Student's t-tests; Zuur et al., Reference Zuur, Ieno and Elphick2010). Sampling design was nested with varying levels of geographical designation (e.g. European region, region within England, environment type, site), varying numbers of sexes, genders, age groups, and funerary treatments for individuals, and date ranges across locales. Given the nested nature of the data, unsupervised machine learning (UML) in the form of hierarchical clustering was undertaken rather than using partitioning clustering methods, which require user determination of the number of clusters in the dataset (e.g. k-means). I used Ward's hierarchical agglomerative clustering method and the Ward2 algorithm (Ward, Reference Ward1963; Murtagh & Legendre, Reference Murtagh and Legendre2014; Kassambara, Reference Kassambara2017). This was cross-validated using thirty-two indices (see Supplementary Material).
Hierarchical clustering was visualized as a dendrogram showing the data structure and proximity of individuals to one another within this structure. The clusters were then used to colour scatterplots for each tissue to better highlight the isotopic niches they represent. The clusters were also visualized as stacked bar plots to show the proportion of individuals in geo-cultural regions assigned to different clusters, and vice versa the proportion of individuals assigned to clusters in different geo-cultural regions.
BEST (Bayesian Estimation Supersedes the t-test) tests were used to compare between groups, run with R package BEST (for more details see Kruschke, Reference Kruschke2013 and Supplementary Material).
Burials were assigned to chronological periods on the basis of radiocarbon dates or numismatic evidence where available and, when unavailable, grave goods (Hines & Bayliss, Reference Hines and Bayliss2013; Brownlee, Reference Brownlee2019; Leggett et al., Reference Leggett, Rose, Praet and Le Roux2021). Given the small sample sizes for most regions, chronological analyses were confined to England.
Bone and dentine data are presented separately below as few individuals have isotopic data from both tissues, and so integrated clustering would be extremely limited.
Foodways and Diet in Europe during the First Millennium ad
Isotopic characterization and comparison across and within regions of western Europe were conducted to identify broad-scale patterns in foodways and diets, recognize dietary differences and trends over the first millennium ad, investigate the impact of events such as the FEH, and determine their geographical origins and spread.
As outlined above, hierarchical cluster analyses were undertaken for both bone (n = 4139) and dentine (n = 931) collagen δ13C and δ15N values.
Bone data
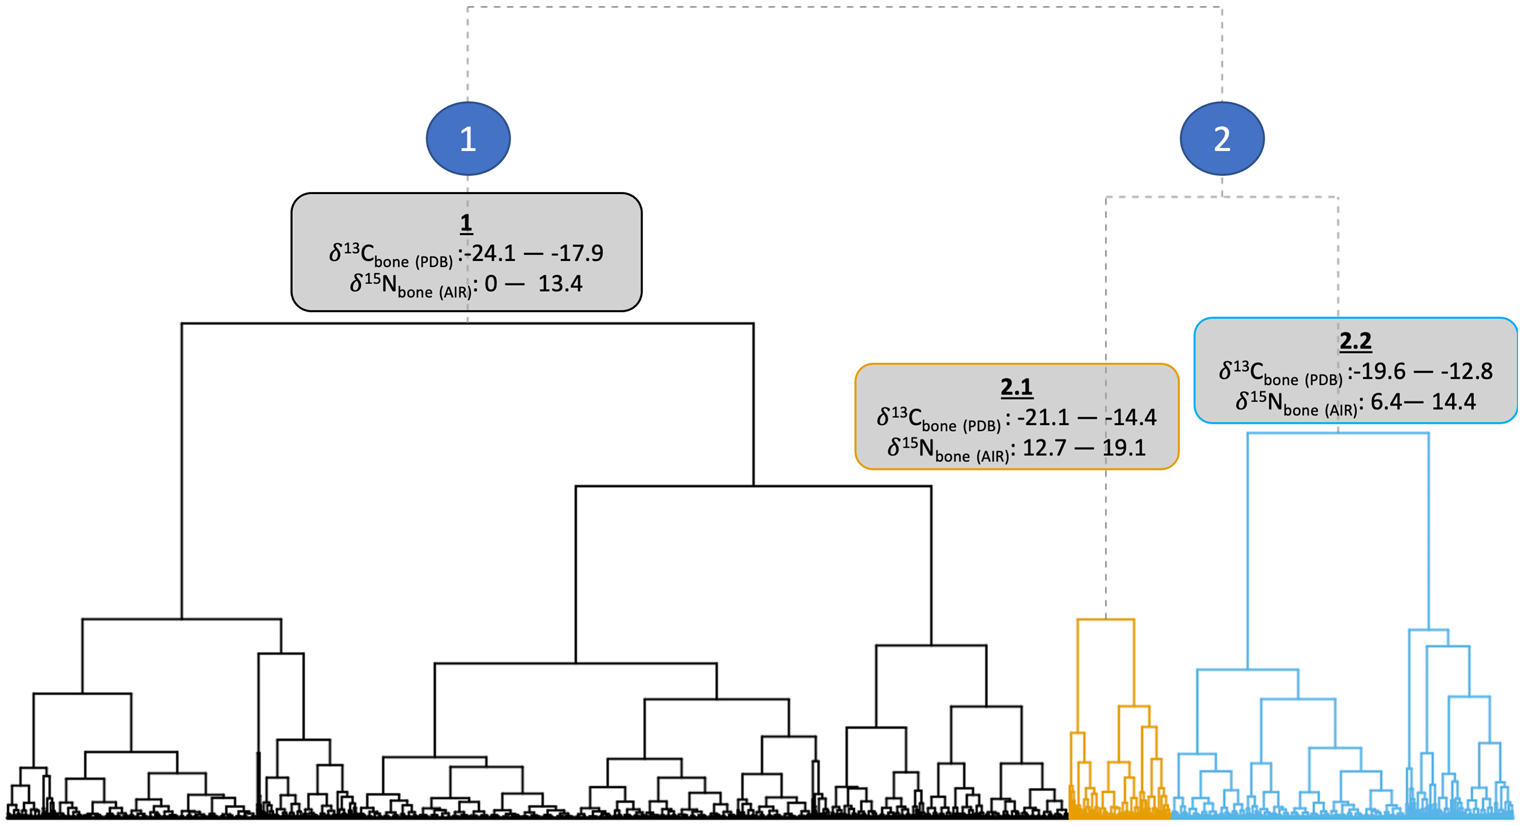
The data structure and isotopic ranges of the clusters can be seen in Figure 2. Isotopic niches of the clusters are shown in Figure 3. Cluster 1 represents C3-based diets with a range of trophic levels. Cluster 2.1 is distinguished by higher δ15Ncoll values. Bone cluster 2.2 is distinguished predominantly by its less negative δ13Ccoll values and lower δ15Ncoll values compared to cluster 2.1.
Ward's method (Reference Ward1963) hierarchical clustering dendrogram of first-millennium ad western European human bone δ13Ccoll and δ15Ncoll stable isotope values (n = 4139).
Scatterplot of δ13Ccoll and δ15Ncoll of first-millennium ad western European human bone coloured by cluster number determined by analyses illustrated in Figure 2.

A north-south trend in diets across western Europe is clear in Figures 4 and 5. The dominance of certain regions and areas within these clusters may be useful for human provenancing by foodways and suggest where some of these foodways, in particular marine food consumption, may have originated.
Proportion of individuals in each bone δ13Ccoll and δ15Ncoll cluster coloured by region.


Cluster 1 is particularly dominant in ‘Germanic’ areas of continental Europe, Ireland, and Britain (especially England, with 1899 out of 2917 samples in that cluster). The North Atlantic islands and Greece have over fifty per cent of individuals assigned to cluster 1, showing the dominance of C3 diets in these regions.
Cluster 2.1 indicates higher trophic positions (and therefore includes possible marine consumers). Figure 4 highlights that Scandinavia and the Baltic dominate this cluster, which supports a cultural genesis of the FEH in Scandinavia (Barrett et al., Reference Barrett, Locker and Roberts2004a, Reference Barrett, Barrett and Orton2016; Barrett & Richards, Reference Barrett and Richards2004). This cluster is the most dominant in Atlantic and Arctic Norway, the Baltic, Scotland, and the Scottish Islands, but not significantly present elsewhere. An absence of evidence for cluster 2.1 elsewhere is likely due to a lack of access to marine resources inland. However, many of the individuals in cluster 2.1 have bone δ13Ccoll values below -18.5‰, and are dated from the seventh century onwards. This may therefore be better interpreted as a more generalized nitrogen enrichment watershed, and not solely a marine-based transition. Cluster 2.1 with its higher δ15Ncoll bone values does not represent an ubiquitous marine-based FEH across Europe; instead, it may show an increase in meat consumption more broadly, and possibly a FEH with a greater freshwater component, as indicated by the enamel δ13Ccarb values of some individuals.
Cluster 2.2 is dominant in, and dominated by, the Mediterranean and parts of central and eastern Europe. First, this shows the regionally distinctive consumption of millet and other C4 crops introduced from the Eurasian steppe (Lightfoot et al., Reference Lightfoot, Šlaus, Rajić Šikanjić and O'Connell2015; Hakenbeck et al., Reference Hakenbeck, Evans, Chapman and Fóth2017; Amorim et al., Reference Amorim, Vai, Posth, Modi, Koncz and Hakenbeck2018; Vidal-Ronchas et al., Reference Vidal-Ronchas, Rajić Šikanjić, Premužić, Rapan Papeša and Lightfoot2019; Filipović et al., Reference Filipović, Meadows, Dal Corso, Kirleis, Alsleben and Akeret2020). Second, it indicates interactions across the Mediterranean with North Africa and the introduction of C4 plants through Iberia and the Balearic Islands, probably via late Roman and Islamic influences (López-Costas & Müldner, Reference López-Costas and Müldner2016; Guede et al., Reference Guede, Ortega, Zuluaga, Alonso-Olazabal, Murelaga and Pina2017; Alaica et al., Reference Alaica, Schalburg-Clayton, Dalton, Kranioti, Echávarri and Pickard2019; Alexander et al., Reference Alexander, Gutiérrez, Millard, Richards and Gerrard2019; Dury et al., Reference Dury, Lythe, Marquez-Grant, Garcia-Rubio, Graziani and Mari2019; García-Collado et al., Reference García-Collado, Ricci, Catalán Ramos, Altieri, Lubritto and Quirós Castillo2019; Jordana et al., Reference Jordana, Malgosa, Casté and Tornro2019). Third, it represents individuals who are exploiting lower trophic level marine resources or consuming smaller proportions of marine resources compared with those in cluster 2.1 (Bourbou & Richards, Reference Bourbou and Richards2007; Bourbou et al., Reference Bourbou, Fuller, Garvie-Lok and Richards2011; Dury et al., Reference Dury, Lythe, Marquez-Grant, Garcia-Rubio, Graziani and Mari2019).
The geographical boundaries for fifty per cent or fewer inclusion in clusters 2.1 and 2.2 are in Scotland and Central Europe, respectively. These resource or foodways boundaries match historical and archaeological evidence, which shows these regions to be key areas of contact with the Viking and Steppe groups who are credited with introducing the FEH and millet cultivation respectively (Barrett et al., Reference Barrett, Locker and Roberts2004a; Barrett & Richards, Reference Barrett and Richards2004; Richards et al., Reference Richards, Fuller and Molleson2006; Hakenbeck et al., Reference Hakenbeck, Evans, Chapman and Fóth2017; Amorim et al., Reference Amorim, Vai, Posth, Modi, Koncz and Hakenbeck2018; Vidal-Ronchas et al., Reference Vidal-Ronchas, Rajić Šikanjić, Premužić, Rapan Papeša and Lightfoot2019; Filipović et al., Reference Filipović, Meadows, Dal Corso, Kirleis, Alsleben and Akeret2020).
Some exceptions are notable. The lack of marine consumption in the North Atlantic appears to be due to more terrestrial and freshwater resources being consumed, as determined by sulphur stable isotope analysis (Sayle et al., Reference Sayle, Hamilton, Cook, Ascough, Gestsdóttir and McGovern2016). The less than forty per cent proportion of individuals in Greece in cluster 2.2 suggests that Byzantine Greek diets were hardly influenced by central Asian millet consumption; instead, they are more based on terrestrial C3 plants and low-trophic marine resources (Bourbou & Richards, Reference Bourbou and Richards2007; Bourbou et al., Reference Bourbou, Fuller, Garvie-Lok and Richards2011). Croatia is the only region to be entirely dominated by one dietary cluster (2.2). The algorithm included many of the individuals in Croatia that had signatures more consistent with C3 diets in cluster 2.2, perhaps reflecting close similarities in this and neighbouring populations or perhaps a mixing of C3 and C4 resource consumption and the limited sample size.
Hierarchical clustering of bone isotopic values in England confirms the dominance of foods from C3 ecosystems. England's cluster profile in Figure 5 most resembles the Skagerrak-Kattegat-Jutland Basin, Frisia and Saxony, and Normandy/Neustria. These regions are among England's nearest neighbours, with climatic and environmental similarities. These three neighbouring regions are areas with historically and isotopically attested migration into England during our period and have themselves seen migration from Norway, Sweden, and the Baltic. Their environmental similarities and migrant histories may thus explain these dietary profiles. Furthermore, among the individuals assigned to clusters 2.1 and 2.2 in the database, the Fennoscandian and Baltic routes attested by these minority diets are even clearer.
Cluster 2.1 individuals in England mostly date from the eighth century onwards and are buried in cemeteries with known or suspected Scandinavian migrants (e.g. St John's College Oxford, and York), or strong Christian ties (such as monasteries or churchyards, e.g. Caister-by-Yarmouth and Raunds Furnells). These individuals illustrate a dual aspect of the FEH in England; that is, introduced Scandinavian marine consumption and Christian foodways with fish and fowl taking the place of other meats.
The interpretation of individuals in cluster 2.2 in England is slightly more complex. They are predominantly from Late Roman cemeteries of the third to fifth centuries ad, and hence represent markedly different foodways compared to early medieval sites. Twenty-two of the sixty-nine individuals assigned to cluster 2.2 date to the seventh to thirteenth centuries. Most are from churchyard cemeteries in Norwich and the Viking mass grave at Repton (Bayliss et al., Reference Bayliss, Shepherd Popescu, Cook, Bronk Ramsey, Beavan-Athfield and Shepherd Popescu2009; Jarman et al., Reference Jarman, Biddle, Higham and Bronk Ramsey2018). Their chronology and context place these individuals into the category of marine consumers who occupy a lower trophic position compared to those in cluster 2.1, who may also have consumed a high proportion of C3 resources, which reflects both Scandinavian and Christian foodways.
Dentine data
The same process was applied to human dentine values to compare the signatures from childhood and earlier life diets with those obtained from bone. The dendrogram structure and isotopic ranges of clusters for dentine are very similar to those for bone, with two major branches (Figure 6). This is then visualized as a scatterplot in Figure 7.
Ward's method (Reference Ward1963) hierarchical clustering dendrogram of first-millennium ad western European human dentine δ13Ccoll and δ15Ncoll stable isotope values (n = 931).

Scatterplot of δ13Ccoll and δ15Ncoll from first-millennium ad western European human dentine coloured by cluster number determined by analyses illustrated in Figure 6.

Dentine cluster 1 is the largest, with 552 samples. It corresponds to bone cluster 1 and represents C3-based diets across several trophic levels. Dentine cluster 2.1 roughly equates with bone cluster 2.2, and likewise has the smallest sample size, with thirty-four samples. Dentine cluster 2.1 is assumed here to represent C4/marine based diets with a δ15Ncoll value range similar to that of cluster 1. Cluster 2.2 differs from the other two groups for having higher δ15Ncoll values and equates with bone cluster 2.1. As with bone, individuals in this higher trophic level group appear to be mostly C3 terrestrial or freshwater protein consumers, although a small number do have δ13Ccoll values that overlap with cluster 2.1. These individuals may have therefore been consuming a higher proportion of marine resources or animals fed on C4 plants than those in cluster 2.1, or had a mixed terrestrial/marine diet.
The regional make-up of the clusters and proportions of clusters are shown in Figures 8 and 9. Due to the reduced number of regions represented in the dentine data, regional diversity in clusters is not as high as that of bone. Nonetheless, the dentine data support the findings from bone, with a pattern running northwest-southeast across Europe in both datasets.
Proportion of individuals in each dentine δ13Ccoll and δ15Ncoll cluster coloured by region.


Dentine cluster 1, representing the C3 terrestrial/freshwater consuming cluster, is found in every region, although dominated by England. The highest proportions are found there, as well as in the Po Valley and the Skagerrak-Kattegat-Jutland Basin.
Dentine cluster 2.1 comprises almost entirely individuals buried in Croatia, with a handful of instances from the Po Valley and the Baltic. There is a clear difference between the dentine and bone from the Po Valley, which suggests a change from a more C3-based diet in childhood to consumption of more C4 resources later in life. The Baltic is the only region with all three clusters present, which mirrors its isotopic variability for bone. However, one individual assigned to dentine cluster 2.1 in the Baltic is an outlier for the region and site, Triberga on the island of Öland (Howcroft et al., Reference Howcroft, Eriksson and Lidén2012), and could represent a migrant from one of the C4 consuming regions discussed here, or further afield.
Dentine cluster 2.2 is dominated by individuals from England (255 out of 345 samples), the rest being present in Scotland and the Fennoscandian regions. The proportions of this cluster in each region mirrors the trend for bone, with higher proportions of people with 15N enrichment found in Atlantic and Artic Norway, and the Baltic. England and the Skagerrak-Kattegat-Jutland Basin again closely resemble each other. Individuals in England assigned to dentine cluster 2.2 were predominantly buried in later churchyards (e.g. Black Gate Newcastle or Raunds Furnells) or from sites with known Viking links (Ridgeway Hill). There are six earlier individuals dating to the sixth–eighth centuries ad. These burials are outliers for their cemeteries in this cluster assignment; perhaps they were migrants as they are all older adults, and bar one child from Southam (with an earlier forming tooth), post-weaning teeth were sampled.
Breastfeeding and weaning practices could play a role in these signatures (Fuller et al., Reference Fuller, Molleson, Harris, Gilmour and Hedges2006; Haydock et al., Reference Haydock, Clarke, Craig-Atkins, Howcroft and Buckberry2013), although the similarities in values and the large-scale geographical patterns presented above suggest this had a minimal impact on the overall results. For most regions, childhood and adult diets appear very similar.
Diachronic Change within England
To test the cause(s) for the isotopic variability presented above, the data for England were assessed chronologically to identify any changes in diet and align them with the first-millennium transitions outlined above.
Figure 10c shows much overlap between diets in England across all three chronological phases, but with noticeable changes in δ15N values. It is tempting to equate the change in the period c. ad 790–1066 and later as evidence for the FEH, but, if we examine changes in δ13Ccoll (Figure 10a) and δ15Ncoll (Figure 10b) values separately, this interpretation is no longer tenable.
Bone collagen δ13C and δ15N values from England through time. A) δ13Ccoll values; B) δ15Ncoll values, C) bag plots of δ13C and δ15N values; D) bag plots of Δ13Cenamel-dentine and δ13Ccarb. For plots A, B, and C, n = 187 for Roman (purple), n = 1603 for c. fourth–eighth century (teal), and n = 229 for late eighth–thirteenth century (yellow). For plot D, n = 176 and n = 34 for teal and yellow respectively.

A dietary shift from the Roman period to the Early Middle Ages is evident in both δ13Ccoll and δ15Ncoll values, with a drop in δ13Ccoll values at the end of the Roman period, possibly reflecting a range of culinary and economic changes in Britain after the end of the western Roman Empire (Rizzetto et al., Reference Rizzetto, Crabtree and Albarella2017). The high degree of overlap between the Roman and post-Roman ‘bags and loops’ illustrated in Figure 10c and d, however, supports theories that a high level of dietary continuity (in terms of isotopic signatures) existed between these periods (Banham & Faith, Reference Banham, Faith, Banham and Faith2014; Sakai, Reference Sakai2017: 10, 151-53, 310-15). This shift is backed by a BEST test, but equates to a difference in posterior predictive means of 0.73‰, which is not large. The strong peak and overall shift in distribution to more negative δ13Ccoll values nevertheless adds weight to the argument that freshwater resource consumption increased, and agricultural changes occurred during the early Middle Ages.
The differences in distribution shape and range show more variety in bone δ13Ccoll values for the later period, with a C3 diet of both terrestrial and freshwater resources and no substantial or widespread marine consumption in adulthood. The bone δ15Ncoll data in Figure 10b shows increasing means, maximum values, and more positively shifted distributions over time. BEST tests confirm that these shifts are real, albeit small, around + 1‰ in mean per period. This aligns with changes seen in zooarchaeological, isotopic, and burial data from Kent, where changing dietary practices in line with Christianization and changing worldviews on death and the afterlife have been suggested (Reynolds, Reference Reynolds2015: 189-91, 278-96; Knapp, Reference Knapp2018: 290-300; Brownlee, Reference Brownlee2021; Leggett, Reference Leggett2021). The clear spike in bone δ15Ncoll values from the eighth century onwards is not accompanied by the corresponding increase in δ13Ccoll to support a marine FEH in England close to ad 1000, as previously argued (Barrett et al., Reference Barrett, Locker and Roberts2004a, Reference Barrett, Locker and Roberts2004b; Barrett, Reference Barrett, Barrett and Orton2016; Müldner, Reference Müldner, Barrett and Orton2016; Orton et al., Reference Orton, Morris and Pipe2017). Nitrogen enrichment with stable carbon isotopic values in post-Roman England instead supports the notion that other dietary changes took place, such as an increase in the intake of freshwater/terrestrial protein, or agricultural innovations that would increase δ15N values in cereal crops, as seen in the archaeobotanical isotopic evidence from Stafford (Hamerow et al., Reference Hamerow, Bogaard, Charles, Forster, Holmes and McKerracher2020). Crop isotope data from Stafford (c. ad 800–1200) show 15N enrichment in all crops (barley, oats, wheat, and rye) through time, with wheat becoming less enriched in 13C in the eleventh to thirteenth centuries, and other crop δ13C values remaining mostly stable with some decrease in values. Alongside the weed ecology and pollen data, the investigators believe that this change is due to crop extensification and the adoption of the mouldboard plough to cultivate more nitrogen-rich soils, and not to manuring; moreover, such isotope values were likely to be passed onto consumers (Hamerow et al., Reference Hamerow, Bogaard, Charles, Forster, Holmes and McKerracher2020).
To investigate these possibilities, Δ13Cenamel-dentine values (the difference between δ13C values of enamel and dentine) were used to infer trophic level and protein source. We would expect to see values in consumer tissues increasing with decreasing dietary protein (i.e. greater in herbivores, smaller in carnivores; Clementz et al., Reference Clementz, Fox-Dobbs, Wheatley, Koch and Doak2009); Δ13Cbioapatite-collagen values below 4‰ are expected for individuals whose dietary protein was almost entirely derived from aquatic (freshwater or marine) sources given the data from ecological models and humans from Jomon, Japan (Clementz & Koch, Reference Clementz and Koch2001; Clementz et al., Reference Clementz, Koch and Beck2007, Reference Clementz, Fox-Dobbs, Wheatley, Koch and Doak2009; Kusaka et al., Reference Kusaka, Uno, Nakano, Nakatsukasa and Cerling2015). For the small proportion of individuals in the period c. ad 790–1066 and later with higher trophic levels (Δ13Cenamel-dentine values of ~4‰), Figure 10d shows that their δ13Ccarb values could indicate their trophic position is due to 13C depletion in freshwater organism lipids (Robson et al., Reference Robson, Andersen, Clarke, Craig, Gron and Jones2016; Taylor et al., Reference Taylor, Hill, Jackson, Peel and Weyl2017; Guiry, Reference Guiry2019). This would affect the δ13Ccarb values over δ13Ccoll in consumers due to differential dietary routing. This is also observed in the earlier period (c. ad 350–790), with a strong trend in both broad periods. A high degree of overlap between these two periods, with a high degree of variability in diets in the earlier period, is not as evident in Figure 10b and c, where chronological change from c. ad 790 is more apparent.
While I agree with Müldner (Reference Müldner, Barrett and Orton2016) that there is no evidence for any large-scale marine consumption in the post-Roman/pre-Viking periods, I would go further: aside from a few outlying individuals with some tenuous marine dietary signatures, there is also no evidence from multi-tissue analyses for the FEH in England up to the eleventh century. For bone, 119 out of 2023 δ13C and δ15N signatures in England are classified by UML as belonging to bone cluster 2.1 or 2.2 (marine/C4 diets); forty-nine of these are late Roman and a further twenty-three are juveniles from Raunds Furnells, and probably represent osteological paradox (physiological stress leading to untimely deaths, which is known to alter isotopic values) and breastfeeding signals rather than marine consumption (Fuller et al., Reference Fuller, Fuller, Sage, Harris, O'Connell and Hedges2005; Beaumont et al., Reference Beaumont, Montgomery, Buckberry and Jay2015; DeWitte & Stojanowski, Reference DeWitte and Stojanowski2015). Many of the remaining forty-seven examples in clusters 2.1 and 2.2 have strong Scandinavian ties and are assumed to be migrants (Ketton Quarry, Repton, St John's College, Oxford) with signatures seemingly largely extraneous to England. For the fifty individuals with bone δ13C and δ15N values confidently dated to ad 1000–1400, strong marine dietary signatures are not the norm (only five individuals from York dating to c. ad 1050–1200 are categorized as having cluster 2.1 bone signatures; see Leggett et al., Reference Leggett, Rose, Praet and Le Roux2021), but more post-ad 1000 samples are needed. The key point is that multi-isotope and multi-tissue evidence in various combinations, and the use of these to create tissue offsets and enrichment factors, can contribute to a better assessment of trophic levels and show freshwater resource consumption; and the application of UML on these large datasets can classify dietary signatures a priori.
When we use traditional biplots, bagplots, or even separate out the tissue by element, it is easy to make convincing arguments for the FEH in England; but the lack of a marked increase in bone δ13C through time, and tissue enrichment factors alongside enamel carbonate, indicates that this shift in δ15Ncoll values post- ad 790 is not in fact a marine FEH. There is clear isotopic evidence for freshwater resource consumption that matches fish bone assemblages from London, where catch per unit increases in the seventh century ad (Orton et al., Reference Orton, Morris and Pipe2017). Zooarchaeological evidence for both freshwater and marine species spikes considerably around ad 1000 in London and other parts of Britain, which is not fully supported by the human isotopic evidence here (Barrett et al., Reference Barrett, Locker and Roberts2004a; Barrett & Richards, Reference Barrett and Richards2004; Serjeantson & Woolgar, Reference Serjeantson, Woolgar, Woolgar, Serjeantson and Waldron2006; Reynolds, Reference Reynolds2015: 80-115, 212-22, 237-38; Orton et al., Reference Orton, Morris and Pipe2017).
How can we reconcile this? There is evidence for freshwater consumption, more so in c. ad 350–90, and a significant number of individuals in both parts of the (early) medieval period with low trophic enrichment factors. What could be causing the mismatch between high δ15Ncoll values (from either tissue) above ~8‰, with ‘herbivorous’ Δ13Cenamel-dentine values in some individuals? One possible explanation comes from Stafford, where extensification practices causing crop 15N enrichment and minor 13C depletion, passed onto human consumers, could cause the patterns seen here. To explore this hypothesis, further analysis of human, wild herbivore, and plant isotopes from the same site would be needed. If the increased demand for marine fish seen in the zooarchaeological evidence comprised less than twenty per cent of whole diets, the signature would be isotopically and metabolically swamped by terrestrial/freshwater signatures and hence invisible in the collagen signatures presented here. This may point to a more plant-based explanation for changes in diet over time.
Conclusions
A meta-analytical approach to categorizing human isotopic niches highlights the need for multi-tissue studies when considering diet. The outcomes from using UML methods also underline the need to reconsider how statistics are used in archaeological stable isotope studies. While some of the trends identified here may seem intuitive, UML allows isotopic data users to explore clustering a priori, removing user determination. This makes it possible to avoid biasing cluster construction and ensures more robust archaeological interpretations of cluster patterning.
The clear north-south trend in bone and dentine dietary signals across Europe indicates that more marine-based diets in Scandinavia were introduced further south through settlement, and that C4 crops and migrants with substantial C4 diets gradually came from the east. Most people in western Europe, however, had a C3-based diet in both childhood and adulthood. Nitrogen enrichment over time in England cannot be linked directly to the FEH. Instead, the diachronic change observed supports the notion that foodways changed under the influence of Christian orthopraxy and the agricultural revolution of the eighth to thirteenth centuries, reflecting changes in both the economy and in worldviews. The first millennium ad and the early centuries of the second millennium was a time when complex societies were in sustained cross-cultural contact, forming part of large sub-continental networks that influenced change in material culture, foodways, and thought.
Acknowledgements
This work was supported by the Cambridge Trust and Newnham College through an international studentship (no. 10386281); The Kathleen Hughes Memorial Fund; Cambridge Philosophical Society; and the University of Cambridge Fieldwork funding. Thanks go to my doctoral supervisors Susanne Hakenbeck and Tamsin O'Connell, to Catherine Hills, Debby Banham, and Emma Brownlee, and to everyone at the Dorothy Garrod Laboratory, Cambridge. I am grateful to the School of Archaeology, University of Oxford, for their support with a research associateship, where revisions to this article were undertaken. Finally, I would like to thank the three anonymous reviewers for their comments on this article.
Supplementary Material
To view supplementary material for this article, please visit https://doi.org/10.1017/eaa.2022.23.


 Open access