





Introduction
Computer systems generally consist of multiple hardware and software components with diverse functionalities. With the increasing number of task requirements of safety-critical systems, computer systems are widely used in safety-critical domains. The faults residing in computer systems have posed increasing threats to reliability and safety (Weichhart et al., Reference Weichhart, Molina, Chen, Whitman and Vernadat2016; Isaksson et al., Reference Isaksson, Harjunkoski and Sand2018; Jiang et al., Reference Jiang, Yin and Kaynak2018). And yet, challenges exist in assessing and migrating the risks of faults:
1) Fault properties are diverse and distinct in different domains (Avizienis et al., Reference Avizienis, Laprie and Randell2001). A typical computing system consists of hardware platforms (HW) and multiple user software applications (SW) running on various operating systems (OS). The faults of the hardware platform are related to the environmental stress and the component degradation with time of service. On the other hand, software does not degrade physically, and the faults of the operating system and user programs are related to human errors, requirements, program structure, logic, and inputs (Park et al., Reference Park, Kim, Shin and Baik2012).
2) The triggering conditions for faults are complex. System faults can be activated by multiple conditions such as the properties of components, components’ inner structures, working environments, and timing aspects. For example, buffer overflow (Foster et al., Reference Foster, Osipov, Bhalla, Heinen and Aitel2005), data race (O'Callahan and Choi, Reference O'Callahan and Choi2003), and other types of software faults (Durães and Madeira, Reference Durães and Madeira2006) may be created in an immature multitasking program and activated at a specific point in time with particular input data and hardware configurations.
3) The fault propagation paths are sophisticated, especially when the effects of the faults propagate across HW and SW domains (Shu et al., Reference Shu, Wang and Wang2016). This problem commonly exists in computer system architectures where user programs are usually assigned dynamically to unpredictable memory spaces or other physical resources.
In summary, faults in a computer system may occur under complex conditions (e.g., specific inputs and states) and pass through HW and SW components to cause functional failures of the entire system. The impacts of these potential faults on system reliability and safety are usually not fully considered and consequently lead to unexpected outages of services delivered by such systems.
An integrated approach is needed to describe the diverse features of the various faults of computer systems. Fault analysis at the design stage can effectively predict possible system failures before implementation. Fault analysis provides useful information to the system designer for establishing a fault tolerance mechanism and increasing the reliability and robustness of the system (Gao et al., Reference Gao, Li and Gao2008; Mutha et al., Reference Mutha, Jensen, Tumer and Smidts2013; Yang et al., Reference Yang, Xiao and Shah2013). However, the following challenges prevent existing methods from use at the early design stage:
1) Many of the current fault analysis methods are specific to a fault type or system type (Yang et al., Reference Yang, Zhang, Liu, Yu, Qiao and Peng2015; Diao et al., Reference Diao, Zhao, Pietrykowski, Wang, Bragg-Sitton and Smidts2018; Dibowski et al., Reference Dibowski, Holub and Rojíček2017). To achieve a wide coverage of faults encountered in computer systems, various analysis methods need to be performed, which is time-consuming for system analysis.
2) The diversities of data and models cause difficulties in managing and reusing historical data. Each domain-specific analysis method uses its own approach to model and organize the knowledge of systems and faults. More general approaches are required when analyzing faults related to multiple domains.
3) Lack of automation requires significant manual effort. Also, fault generation and injection are usually based on expert experience and as such involve subjective evaluation and lack a systematic evaluation of systems.
These challenges are addressed in this paper by proposing an Integrated System Failure Analysis using an ONtological framework (IS-FAON) to model, generate, and analyze faults in computer systems including their activation, propagation, as well as their effects on functionality. Without details on the implementation of the system under analysis (SUA), the proposed framework allows system designers to observe system responses under nominal and faulty states at an early design stage and to effectively evaluate the robustness of the system under development before its implementation. In detail, the contributions of the present research are as follows:
• Proposed an integrated ontology framework that is capable of describing the features of both software and hardware faults in computer systems. The proposed ontology framework contains theories and prototype tools for predicting potential effects of faults at the design stage.
• Developed a series of domain-specific ontologies for representing the faults and their corresponding impacts in the fields of computer architecture, operating system, and user applications that enables handling diversity in data and model in a single framework. These ontologies can effectively reuse the existing knowledge of computer systems for fault analysis at the design stage when the target system has not been implemented.
• Defined a set of fault generation rules that can be applied to the models of the SUA to generate various types of faults and to automatically inject the generated faults into the SUA. The fault generation rules can maximumly cover the potential faults based on the known information of the target system. As such, effects of one or more faults (expected or unexpected by an expert) may be simulated and analyzed systematically.
• Designed an inference-based fault propagation analysis method based on logic inference that performs qualitative fault analysis based on the proposed ontological concepts. The proposed method can automatically predict the impacts of the potential faults. As such, a wide variety of individual faults or a combination of faults may be analyzed so that system designers and developers can improve the robustness of the target system.
• Conducted a case study on a safety-critical computer system to examine the correctness and effectiveness of the proposed approach. Although limited uncertainties exist in the analysis result, the proposed fault analysis framework can effectively and correctly predict the effects of faults without detailed system implementation.
The paper is organized as follows: Section “Related work” reviews existing research devoted to fault propagation analysis and ontology. Section “Ontological framework for fault propagation analysis” introduces the ontological framework for fault propagation analysis. The ontology framework includes ontologies for system modeling, fault generation and injection, fault inference and analysis. The ontologies for system modeling are described in the section “System modeling.” The fault ontologies for fault generation are described in the section “Fault ontology and fault generation.” Section “Fault injection” focuses on injecting faults into the system models established in the section “System modeling.” Section “Fault propagation inference” focuses on the methodology related to fault inference and analysis using the system model, and faults. A case study to illustrate the application of the proposed ontological framework is described in the section “Case Study.” Furthermore, Section “Discussion” discusses the results of the case study, and finally Section “Conclusion” provides the conclusion and introduces future research.
Related work
Faults are caused by multiple factors across both HW and SW components and interactions between them. Faults derived from single components will possibly propagate through multiple types of components and may impact multiple tasks (Weichhart et al., Reference Weichhart, Molina, Chen, Whitman and Vernadat2016; Isaksson et al., Reference Isaksson, Harjunkoski and Sand2018; Jiang et al., Reference Jiang, Yin and Kaynak2018). Because of the diversity and complexity of faults in computer systems and the lack of information on a target system at the early design stage, researchers have attempted to solve the fault propagation and effect analysis problem without precise system models.
In the existing fault analysis approaches, Fault Tree Analysis (FTA; Lauer et al., Reference Lauer, German and Pollmer2011) and Failure Modes and Effects Analysis (FMEA; Hecht and Baum, Reference Hecht and Baum2019) reuse modeling information of HW and SW components and trace the propagation paths of internal faults. The Fault Propagation and Transformation Calculus (FPTC; Wallace, Reference Wallace2005) uses architecture graphs to model the structure of HW and SW components and uses predefined symbols to model the component behaviors. It infers the system responses caused by single faults derived from software components in a single-task real-time system. The Functional Failure Identification and Propagation (FFIP; Papakonstantinou and Sierla, Reference Papakonstantinou and Sierla2012) copes with faults that propagate over subsystems and cross the domain boundaries between electronics and mechanics. The improved signed directed graph (SDG) model (Yang et al., Reference Yang, Xiao and Shah2013) describes the system variables and their cause–effect relations in a continuous process. It allows to obtain the fault propagation paths using the method of graph search. The Small World Network (SWN) model (Gao et al., Reference Gao, Li and Gao2008) focuses essentially on the topological structure properties of the computer system network with several principles that are capable of assessing the safety characteristics of the network nodes. It uses the weight of the link between the nodes to define the fault propagation intensity considering the network statistical information. Subsequently, the critical nodes and the fault propagation paths with high risk are obtained through qualitative fault propagation analysis. Interface Automata (IA; Zhao et al., Reference Zhao, Thulasiraman, Ge and Niu2016) gives a formal and abstract description of the interactions between components and the environment. It extends interaction models on the system interface level with failure modes and provides automated support for failure analysis. Integrated System Failure Analysis (ISFA; Mutha et al., Reference Mutha, Jensen, Tumer and Smidts2013) uses views of functions and components to simulate the propagation of single or multiple faults in single process systems across software and hardware (mechanical) domains.
Table 1 compares the methods mentioned above with the one proposed in this paper in terms of the ability of each method to handle concurrent faults, perform multiple processes, reusability of models, handling of SW and HW behaviors, automation of analysis, and capability of fault injection and fault generation. The method proposed in this paper can generate new types of faults and infer the effects of faults for a SUA at the early design stage, which is an important contribution of this method.
Comparison of fault analysis methods for computer systems
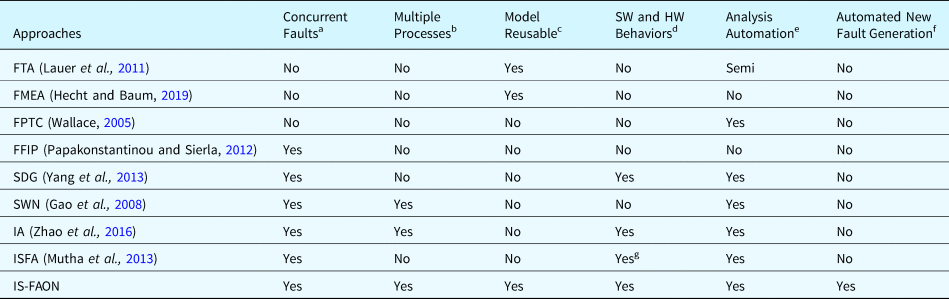
a If the method can analyze the faults that occurred concurrently.
b If the method can analyze the faults that occurred in the system with multiple processes.
c If the method can reuse the existing models established for other systems.
d If the method can model behaviors of software and hardware components.
e If the method can perform the fault analysis automatically.
f If the method provides abilities to generate new types of faults and inject faults into the target system model.
g Mechanical Hardware is supported only.
To effectively collect and manage the knowledge of faults, ontological theories have been widely applied to various industrial systems, such as to diagnosis systems (Liu et al., Reference Liu, Ding, Wu and Yao2019) for rotating machinery (Chen et al., Reference Chen, Zhou, Liu, Pham, Zhao, Yan and Wei2015) and chemical processes (Natarajan and Srinivasan, Reference Natarajan and Srinivasan2010), to the fault management of aircrafts (Zhou et al., Reference Zhou, Li and Zuo2009) and smart home services (Etzioni et al., Reference Etzioni, Keeney, Brennan and Lewis2010), as well as to the fault propagation analysis of building automation systems (Dibowski et al., Reference Dibowski, Holub and Rojíček2017) and wireless sensor networks (Benazzouz et al., Reference Benazzouz, Aktouf and Parissis2014). These studies applied the ontological theories to different specific types of systems and created concepts and notations for modeling faults in their target systems. In this paper, we employ the ontological theories to express and analyze faults in HW and SW for computer systems. The proposed theories and tools are dedicated to model and infer the creation and propagation of faults and soundly infer the consequences caused by these faults. By taking advantage of ontologies, this paper provides fundamental concepts to solve the knowledge description and integration issues involved in fault analysis. In practice, we employed the Web Ontology Language (OWL; Allen and Unicode Consortium, Reference Allen2007) as the modeling language for establishing the proposed ontologies and used the Semantic Web Rule Language (SWRL; Horrocks et al., Reference Horrocks, Patel-schneider, Boley, Tabet, Grosof and Dean2004) as a supplement for implementing related rules and constraints. We selected Protégé (Musen, Reference Musen2015) as the editor for creating and debugging the proposed ontologies.
Ontological framework for fault propagation analysis
“An ontology is an explicit specification of a conceptualization” (Gruber et al., Reference Gruber, Acquisition, Ontology and Level2012). As an effective way for information standardization and sharing, ontologies have become increasingly valuable in the fields of computer science for their utility in enabling thorough and well-defined discourse as well as for building logical models of systems. In the proposed ontological framework, we employed ontologies to standardize knowledge related to fault propagation analysis and utilize the information associated with the SUA at the early design stage to maximumly cover various types of faults and to effectively infer their effects on the SUA. This section introduces concepts of fault propagation and fault analysis as used herein, while detailed ontologies are defined and discussed in detail in the sections “System modeling” and “Fault ontology and fault generation.”
Fault propagation
Figure 1 illustrates a fault propagation path through an SUA highlighted by bold lines originating from a fault and leading up to a failure. In the figure, components are the essential HW or SW objects that constitute a computer system (located at the bottom). Each component implements one or more functions. Normally, a component will interact with other components during system operation. These interactions are modeled by flows, which represent the travel of objects through components or functions. The traveling objects can be materials, energy, or signals. The relations between the input and output flows of a component are behaviors of such a component. A component's behaviors are related to its states. The set of components, related flows, and their states is defined as a system configuration (Avizienis et al., Reference Avizienis, Laprie and Randell2004a).
A classic fault propagation path.
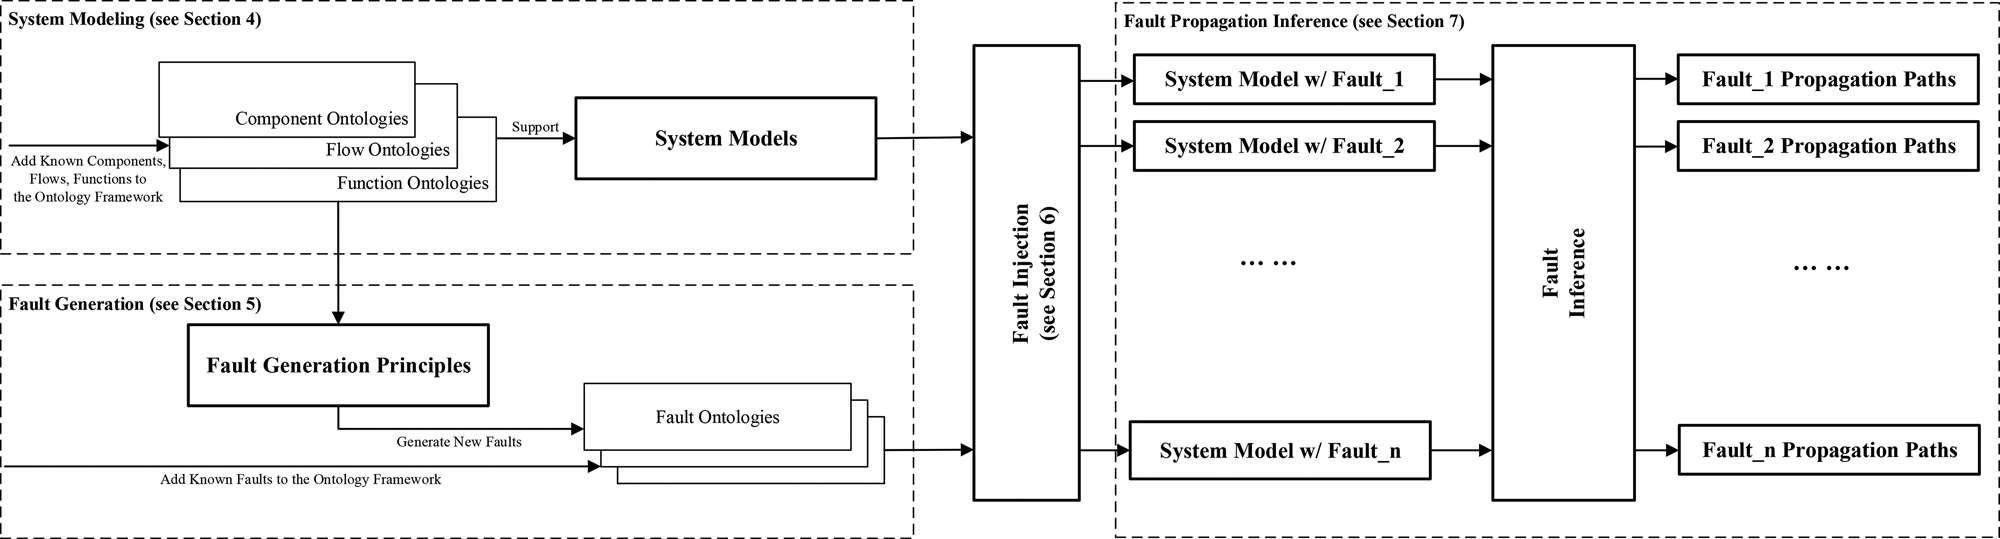
In Figure 1, a fault (in the block with bold boundaries) is the cause of an error. The error, which is the deviation of the state of the system under analysis, would probably, in turn, activate another dormant fault and hence lead to another error. Consequently, this process will possibly trigger a function's failure or degradation, which are the events that occur when the function deviates from the nominal states.
Fault analysis framework
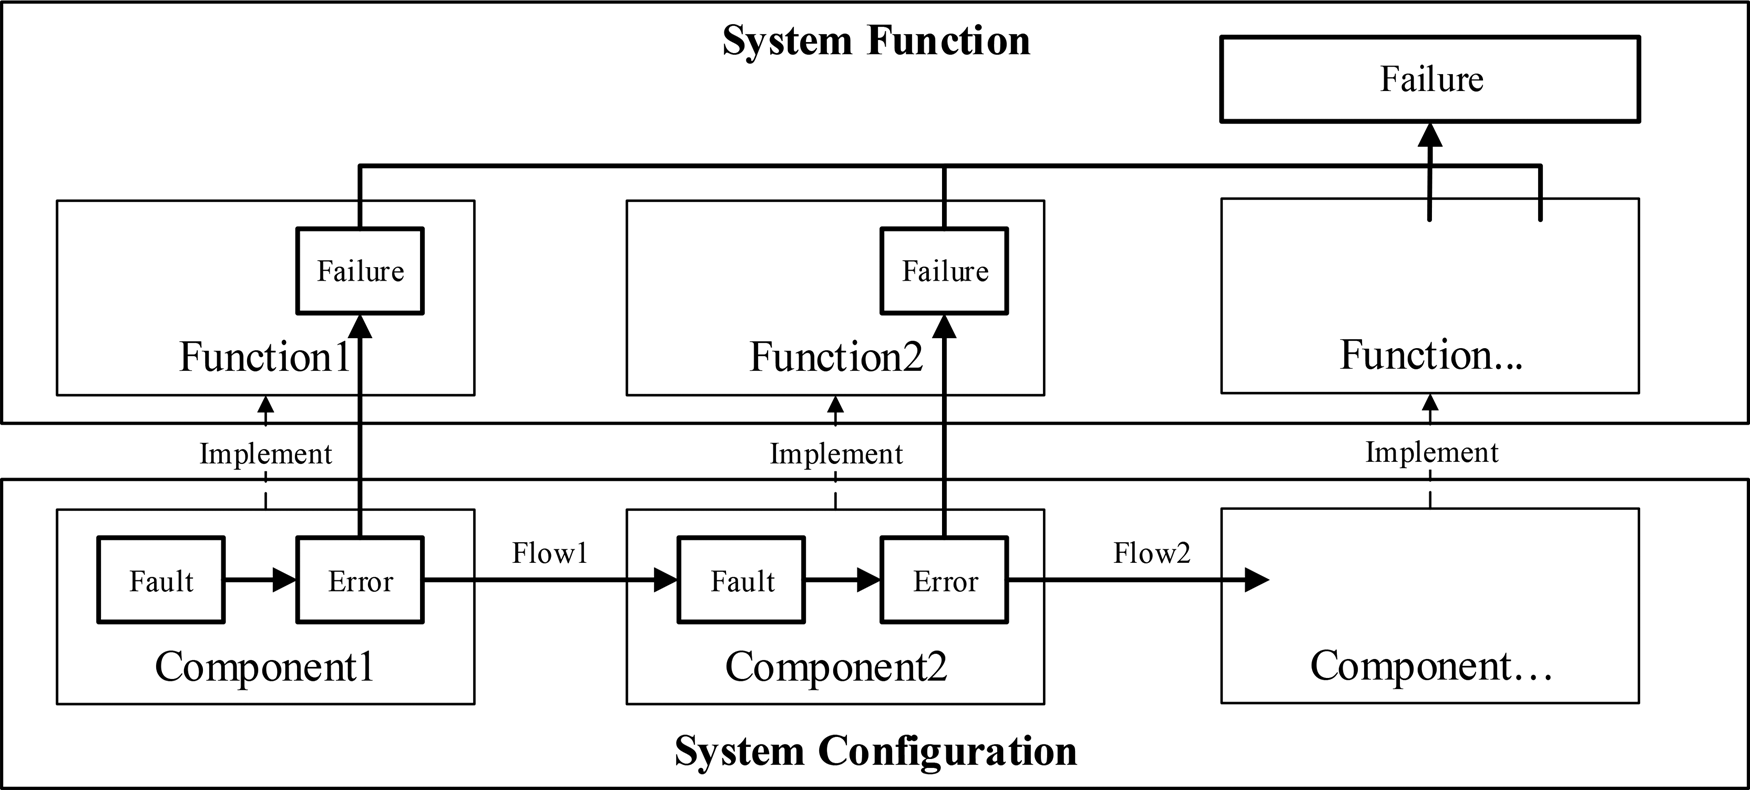
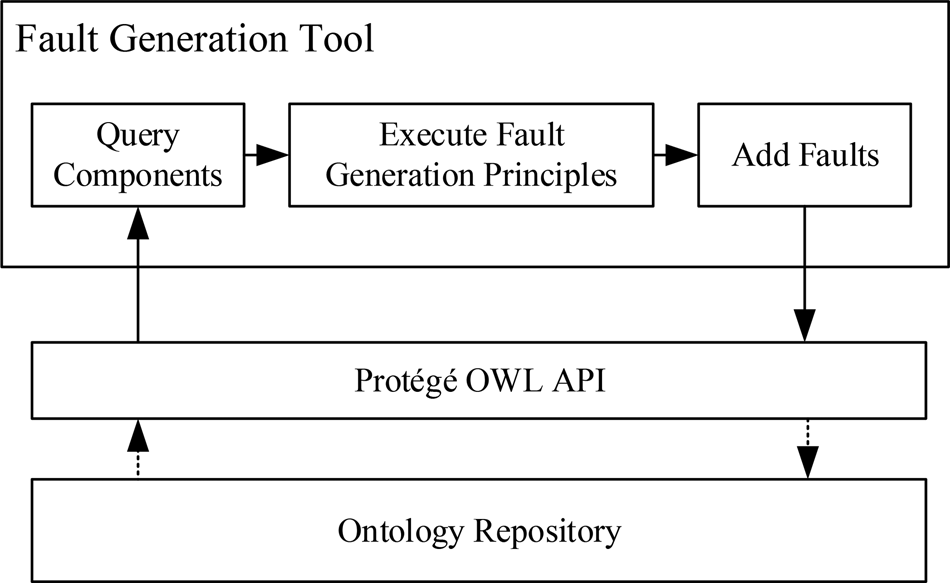
Fault analysis is a process to identify the potential faults that may occur during the development and operation of the SUA, and to infer the impacts of a fault on the SUA. Figure 2 illustrates the main process of fault propagation analysis and the roles of the proposed ontologies in the analysis process. The fault analysis process starts with the system models based on component, flow, and function ontologies (see Section “System modeling”). Faults are modeled using fault ontologies. The framework provides the fault generation principles necessary to generate faults (see Section “Fault ontology and fault generation”) based on the component, flow, and function ontologies. The fault generation methodology will effectively improve the coverage of different types of faults. Then, the framework injects faults into the system models (see Section “Fault injection”). Based on the fault-seeded system models, the framework is capable of inferring the effects of faults and generating fault propagation paths (see Section “Fault Propagation Inference”).
Fault propagation analysis methodology.
System modeling
In ontology theories, classes and their hierarchical links represent objects and their classifications, respectively. An ontology uses properties (aka predicates in description logics) to represent the attributes of an object or the relations between objects. Properties can be categorized into data properties and object properties. Data properties use numbers or descriptive strings to represent an object's attributes, such as the temperature of a computer processor. Object properties build the link between two or more objects. For example, the output of a memory unit (aka a component object) is the pressure data (aka a signal flow object) read by a sensor (aka a component object). Also, an ontology can define dependencies and constraints between classes and properties to represent natural laws or restrictions.
Ontologies for system modeling
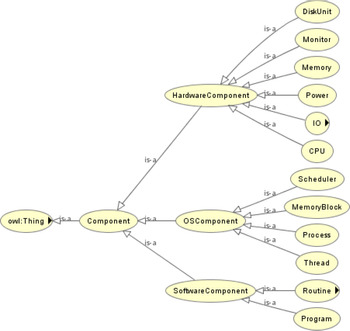
Definition 1. Component Ontology is the foundation necessary to model the components of a computer system under analysis and defines how to model a new component of a computer system. The key process of modeling components is to abstract the generic attributes of concrete components by using the ontological concepts. Figure 3 shows the hierarchy of the classes created in the component ontology. We classified the components of a computer system into “Hardware Component,” “Software Component,” and “Operating System Component.”
Hierarchy of the component ontology.
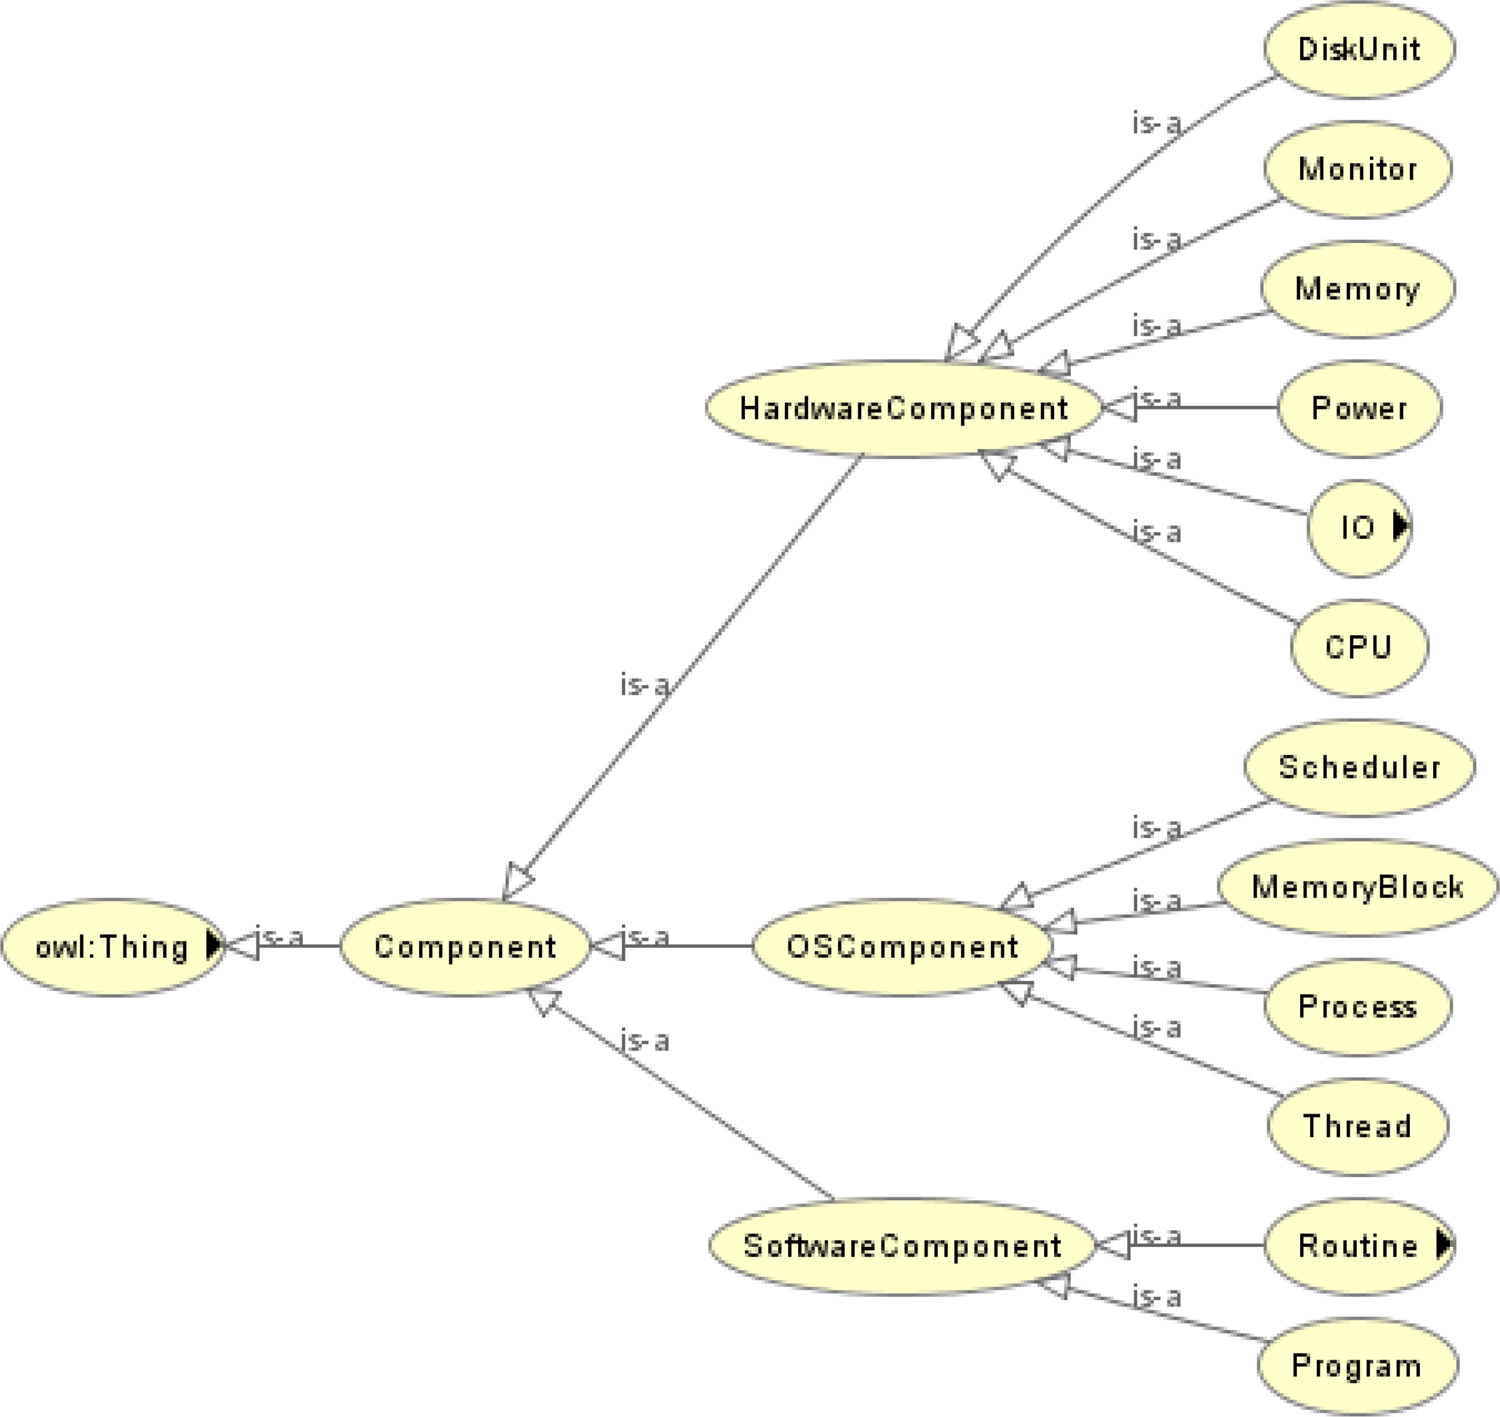
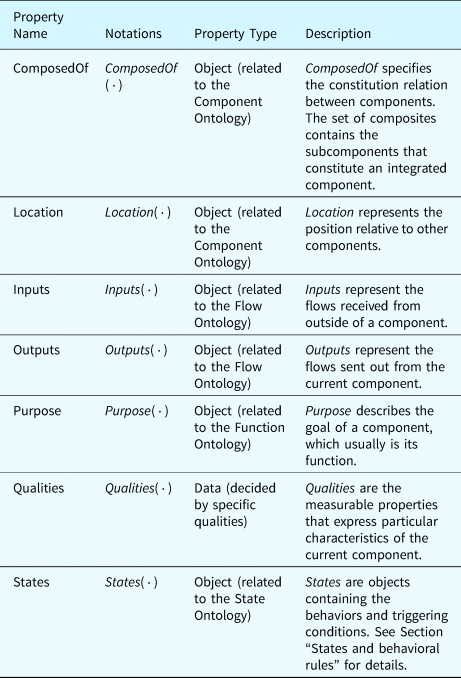
Table 2 summarizes the properties related to the classes of components. The properties “ComposedOf” and “Location” define the relations between components. These relations decide on the occurrence of some types of faults. The properties “Inputs” and “Outputs” participate in the fault inference process since the effects of faults will propagate through the input and output flows of components. The property “purpose” links components to the functions they implement whose states will be inferred during fault inference. “Qualities” are measurable properties representing the component's attributes in nominal and faulty states. Faults may be activated when these measurable properties change. At last, the property “States” organizes behaviors of components in different states. These behaviors are evidence used in inferring functional states during fault inference, detailed in the section “States and behavioral rules.”
Properties defined in the component ontology
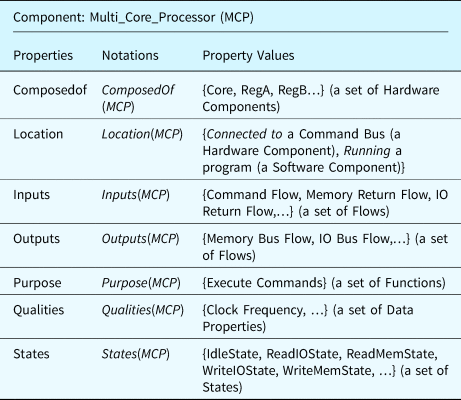
To clarify these concepts further, a multi-core processor is used as an example component and is characterized using the component ontology derived from these concepts, see Table 3.
An example multi-core processor (MCP) component defined using the component ontology
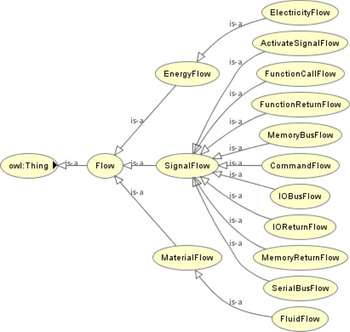
Definition 2. The Flow Ontology defines the classes related to the transition of objects between components and functions, which are involved in the propagation of the effects of a fault. The flow can track the transit of an object from its source position to its final destination as it weaves through the various components of the system. An example of flows would be the travel of a mouse click signal from a fingertip, into the universal serial bus (USB) port in the rear of the computer, into the system bus, and finally reaching the processor. Figure 4 shows the hierarchy of the flow ontology. It is worthy to note that new types of flows can be added to the flow ontology if required.
Hierarchy of the flow ontology.
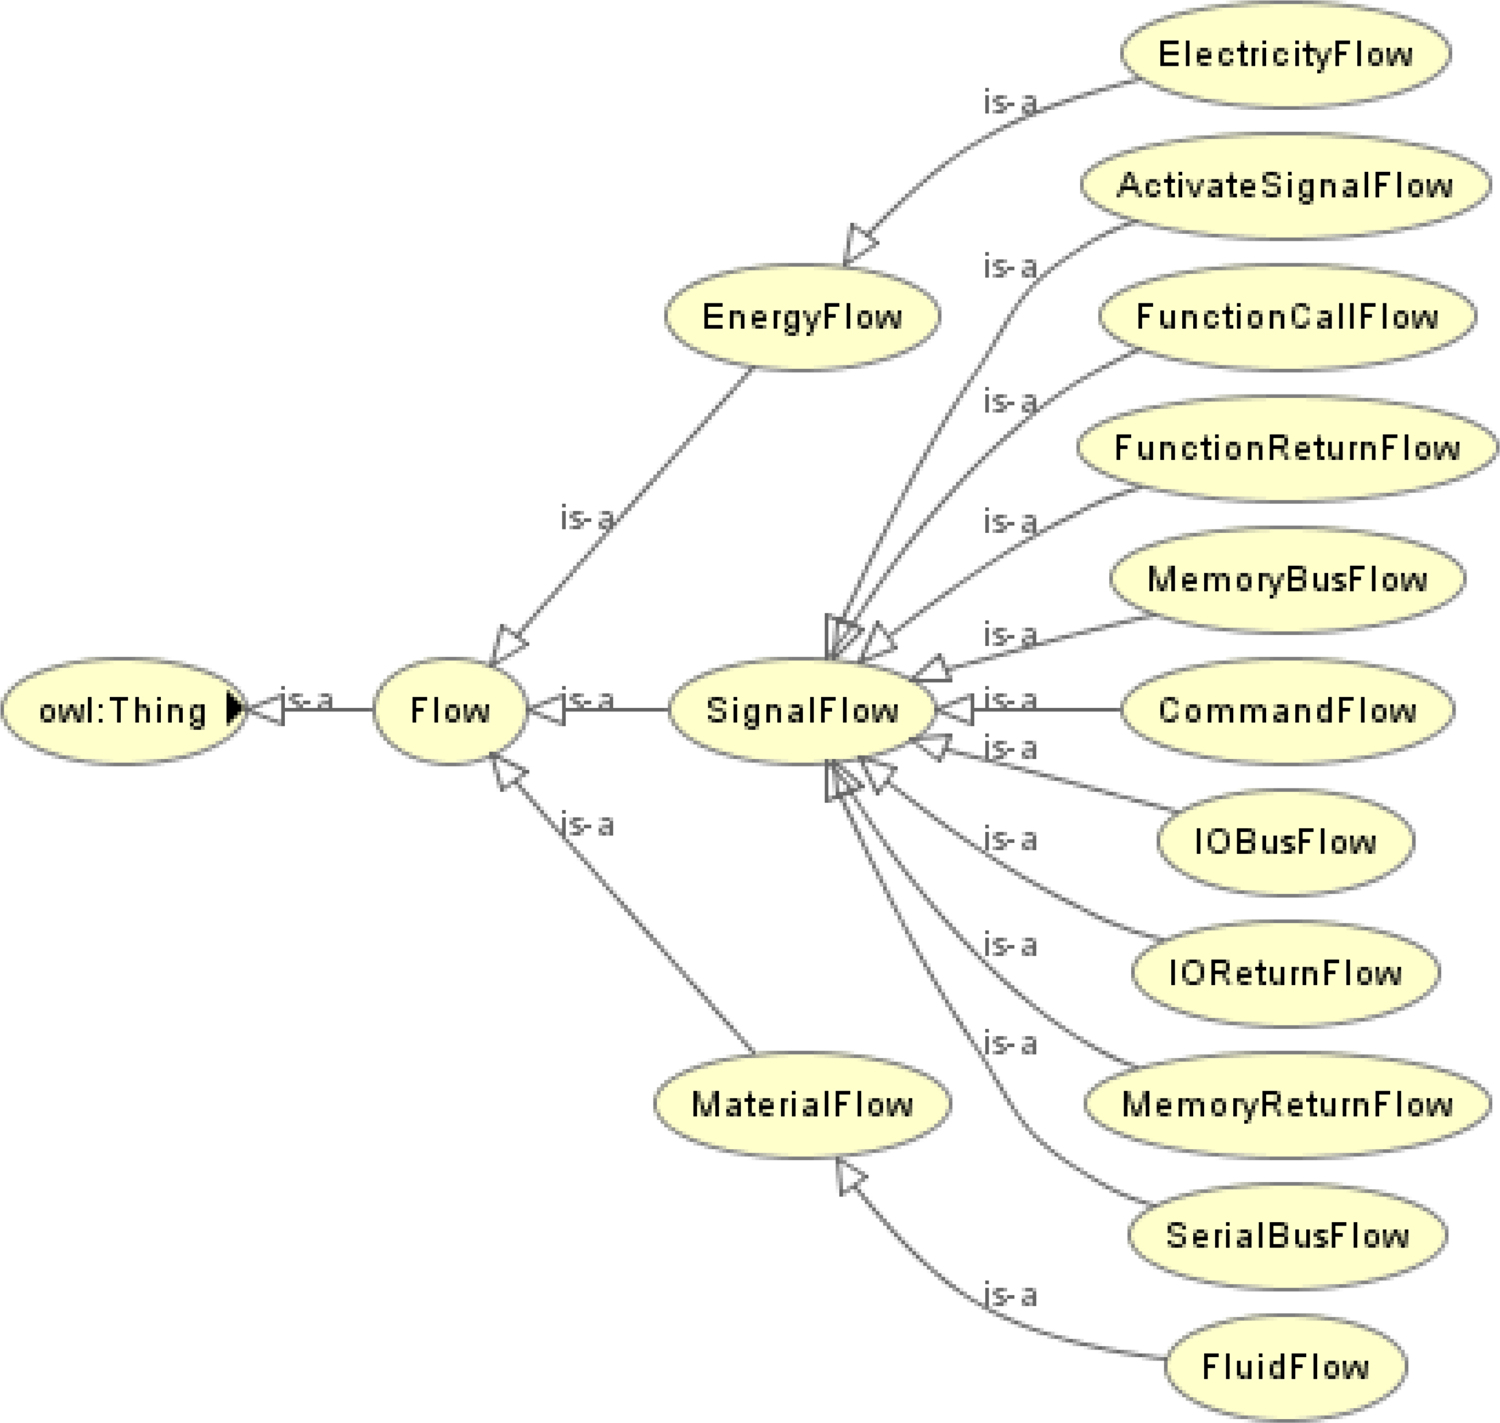
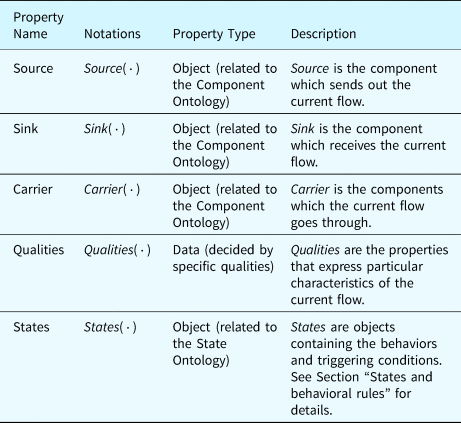
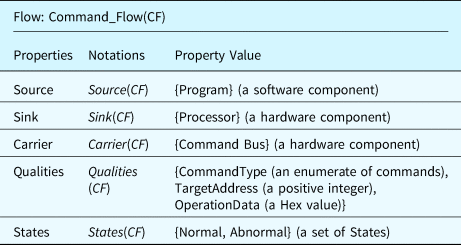
Table 4 lists the properties defined in the flow ontology. In the table, “Qualities” are the properties of a flow that will be specified as data properties with constants or dynamic values. For example, a Command Flow (CF) records the information that a processor requires from a software program to operate. A CF has three important qualities: (1) the “command type” represents what actions the processor should perform, for example, reading data from a memory unit; (2) the “target address” represents the address of the memory unit or the I/O devices; and (3) the “operation data” represents the data that corresponds to the “command.” Table 5 details the properties of the active command flow as an example.
Properties defined in the flow ontology
An example command flow defined using the flow ontology
By using component and flow ontologies, we can model the structure of the SUA and the attributes of system components and flows. Some properties of components or flows can be missing when building the system model at the early design stage. For instance, we can use the concepts of a multi-core processor without defining its speed or other specification when designing a system. Along with the evolution of system design and development, the rough system model, built at the early design stage, will be more and more concrete and detailed. With the increasing concreteness of the components and flows in the model, more precise system behaviors can be emulated and analyzed, and more types of faults can be covered and analyzed by the proposed method.
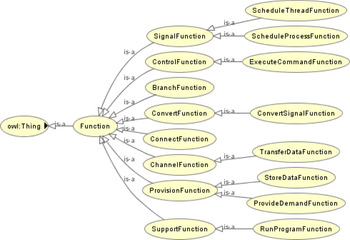
Definition 3. The Functional ontology describes functional knowledge pertaining to the corresponding components or systems. In this paper, functions are classified based on the taxonomy provided by the reference (Hirtz et al., Reference Hirtz, Stone, McAdams, Szykman and Wood2002). Figure 5 shows the hierarchy of the function ontology.
Hierarchy of the functional ontology.
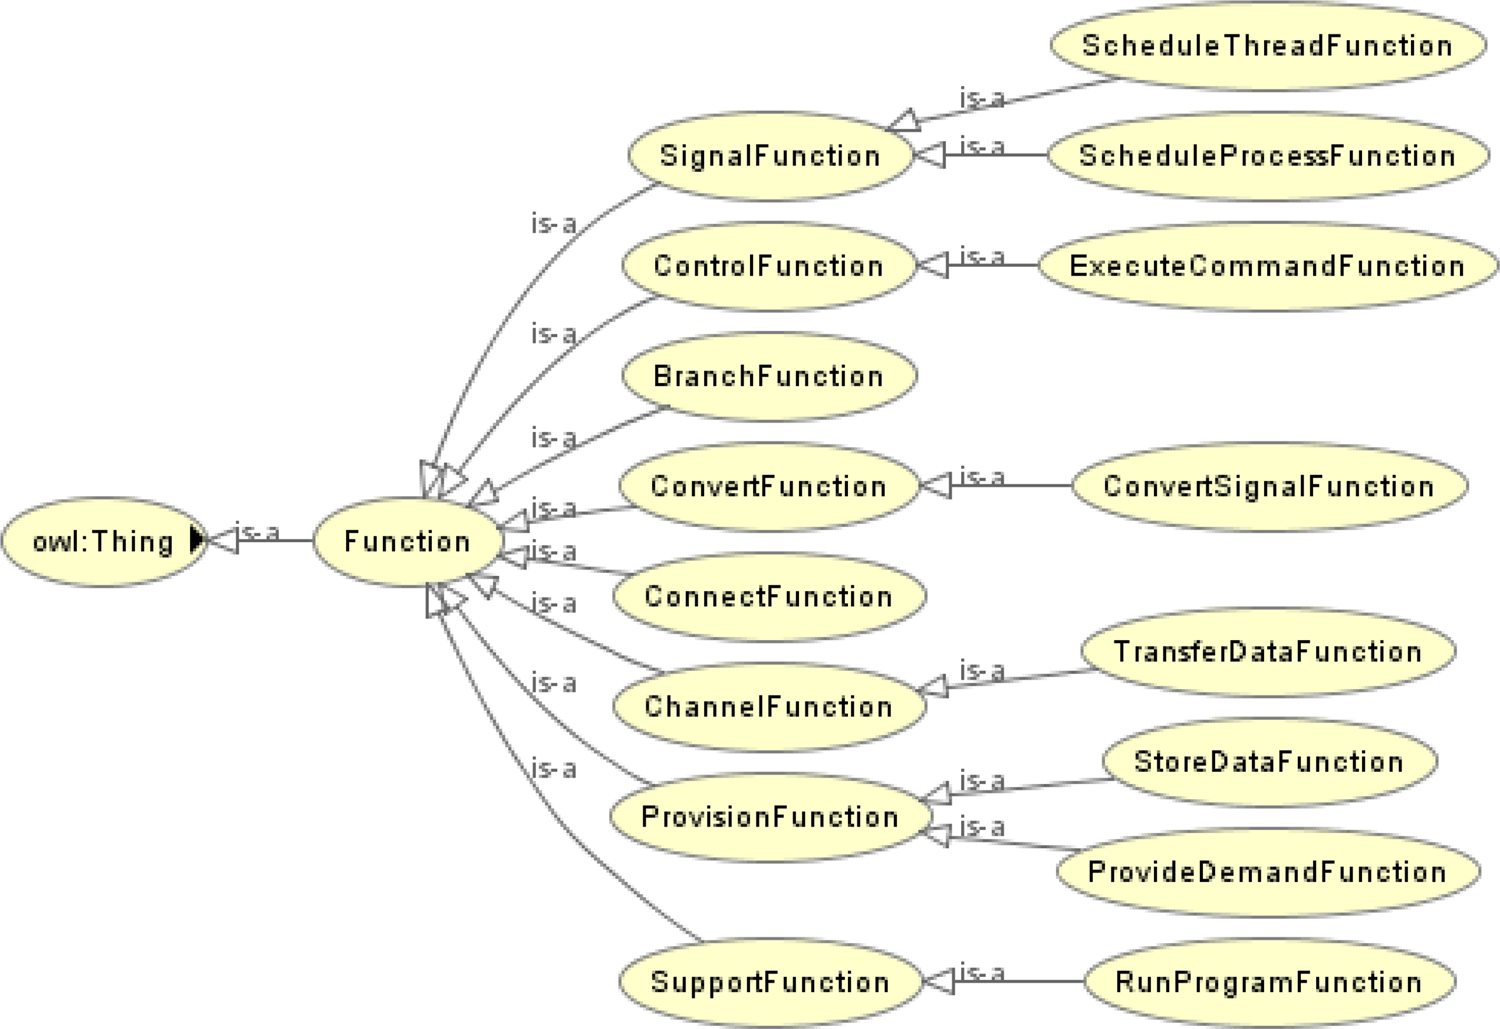
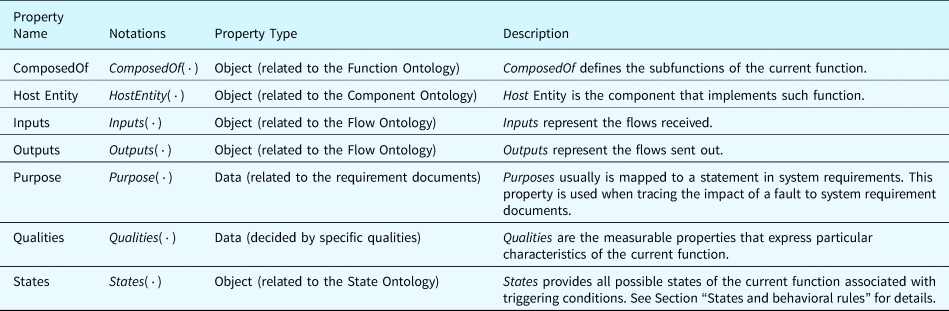
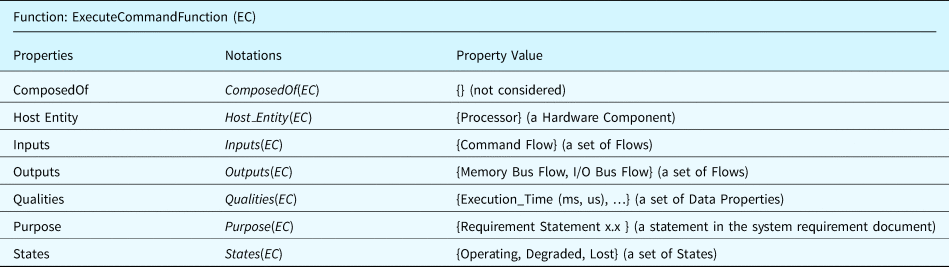
Table 6 summarizes the properties defined for the functional ontology. It is worth noting that we use the same terms in the component and function ontologies, such as the “ComposedOf” and “States.” But these terms do not represent the same object. For example, a state of a component cannot be a state of a function. Similarly, a function cannot be composed of subcomponents. As an example class of the functional ontology, Table 7 shows the “Execute Command” function defined for a processor.
Properties defined in the functional ontology
An example of execute command function defined using the function ontology
The function and flow ontologies allow system developers to model functionalities of the SUA and establish the mapping relations between components and their functions. With the functions and flows, the fault inference can predict the impact of faults on components and system functions.
Individuals and system models
A system model is a combination of individuals which are instantiated from the classes and properties defined by ontologies. For example, a class “multi-core processor” can be defined using the component ontology (see Section “Ontologies for system modeling”) with the properties of generic inputs (e.g., I/O buses), outputs, etc. When establishing a system model with this type of processor, the abstract concept (i.e., the multi-core processor class) will be instantiated as a component individual (e.g., a processor named as “CPU_0”) in the system model. As a result, a system model is a super set of individuals and their properties which are instantiated from the classes defined by the ontologies in this section.
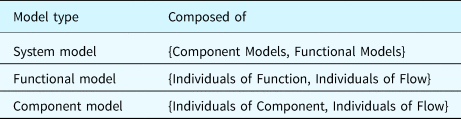
According to the type of included individuals, a system model is composed of component models and functional models. A component model is a structural model with the individuals of components and associated flow, representing system configurations. Whereas a functional model contains the individuals of functions and associated flows, representing the functions and their relations the target system needs to implement. Table 8 shows the composition of different types of models. An individual of flow in a component model may represent the same flow in the real world as the one in a functional model. An example can be the “Flow 1” and “Flow 2” in Figure 1. This implies that the functions “Function1” and “Function2” share the same relation as the one existing between the component “Component1” and “Component2.” These relations will be used when inferring the state of functions based on the behaviors of components, or vice versa. Component models and functional models can be integrated into synthetic models seamlessly through the dependencies introduced in the section “Dependencies and restrictions.”
Model composition
States and behavioral rules
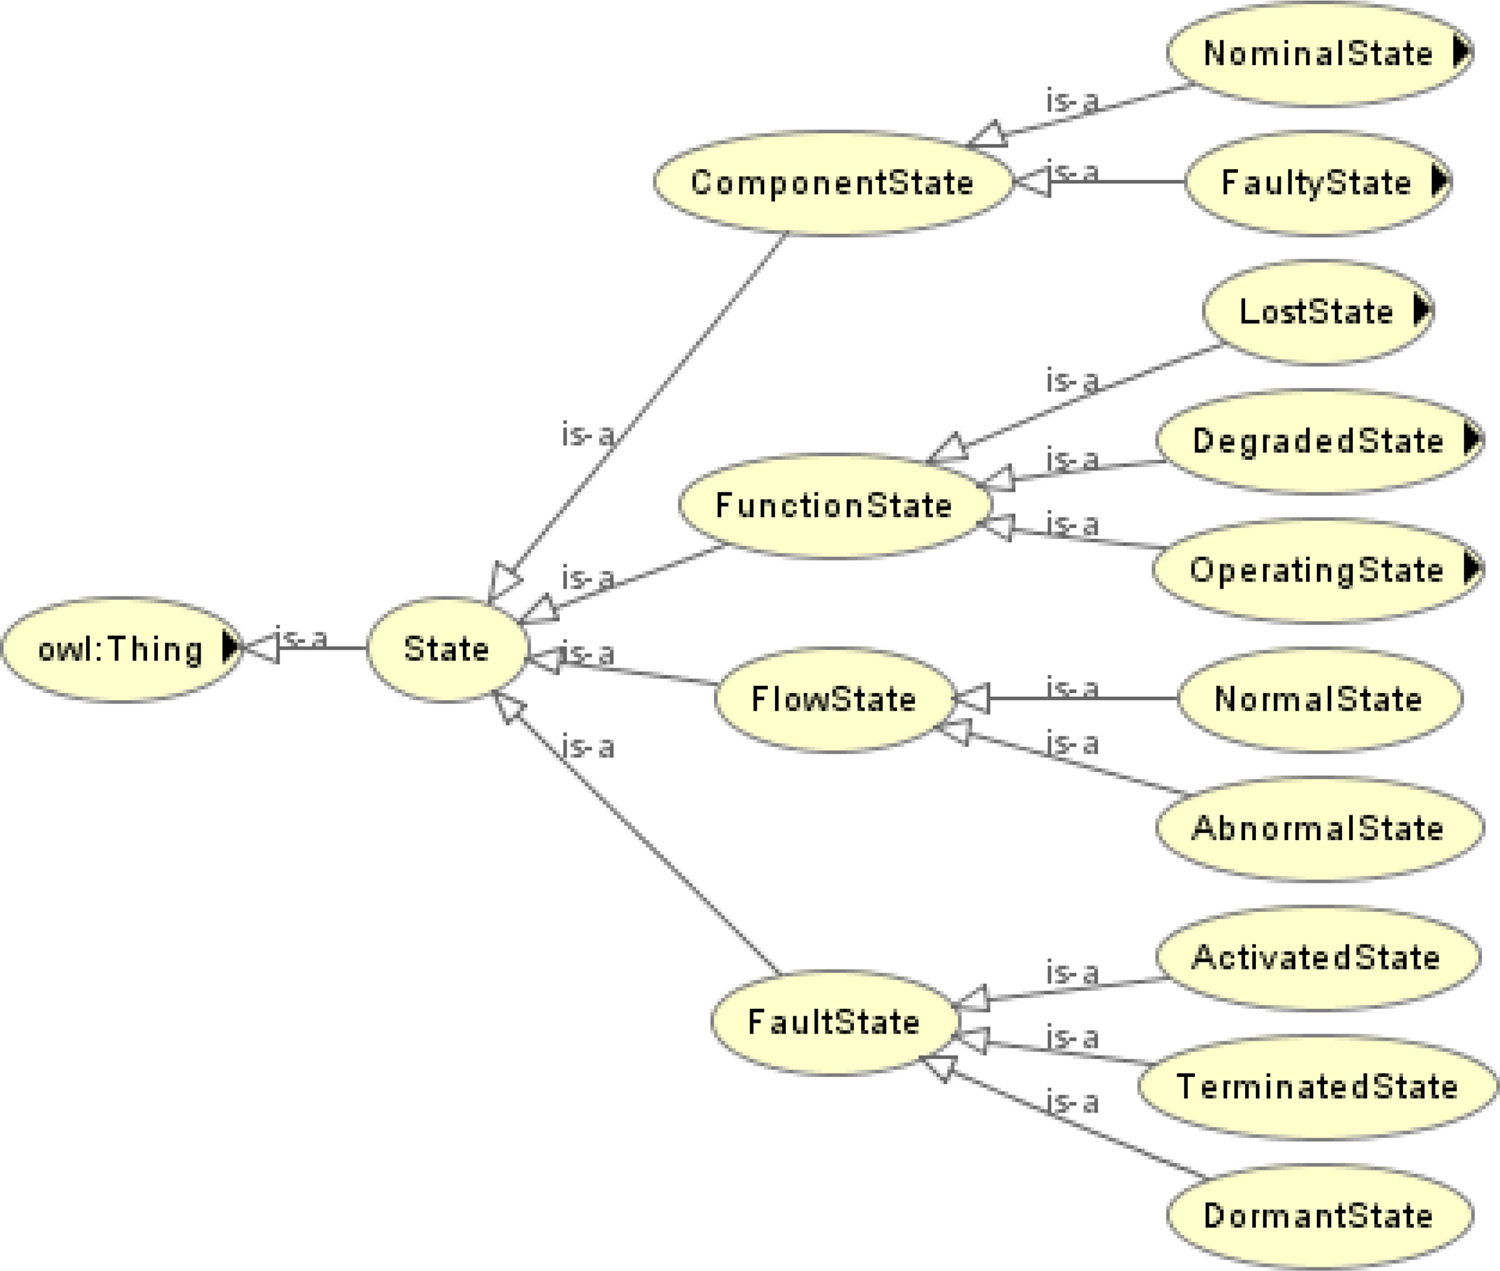
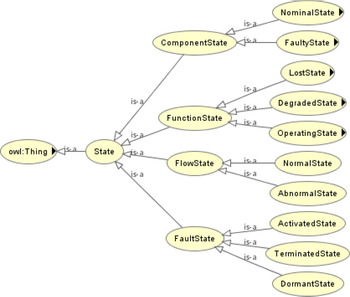
A state describes the combination of triggering conditions and behaviors of components, flows, functions, and faults. A transition of state describes the evolution of an object in terms of events or time sequence. The hierarchy of states considered in the proposed ontology is shown in Figure 6. For instance, the states of a component can be categorized into nominal states or faulty states; the states of a flow can be normal or abnormal; the states of a function can be Operating, Degraded, Lost, or Unknown. Figure 6 also classifies the states of a fault as dormant states, activated states, and terminated states. Since the host entity of a fault is designated as a component, the host component will be in a faulty state once the state of its associated fault becomes “activated.” See Section “Fault ontology” for details.
Hierarchy of the state ontology.
For different types of components, more specific states are defined to express specific behaviors under such state. Table 9 lists the properties defined for states in the ontological concepts. The content and format of these properties are detailed in the following definitions.
Properties defined for states

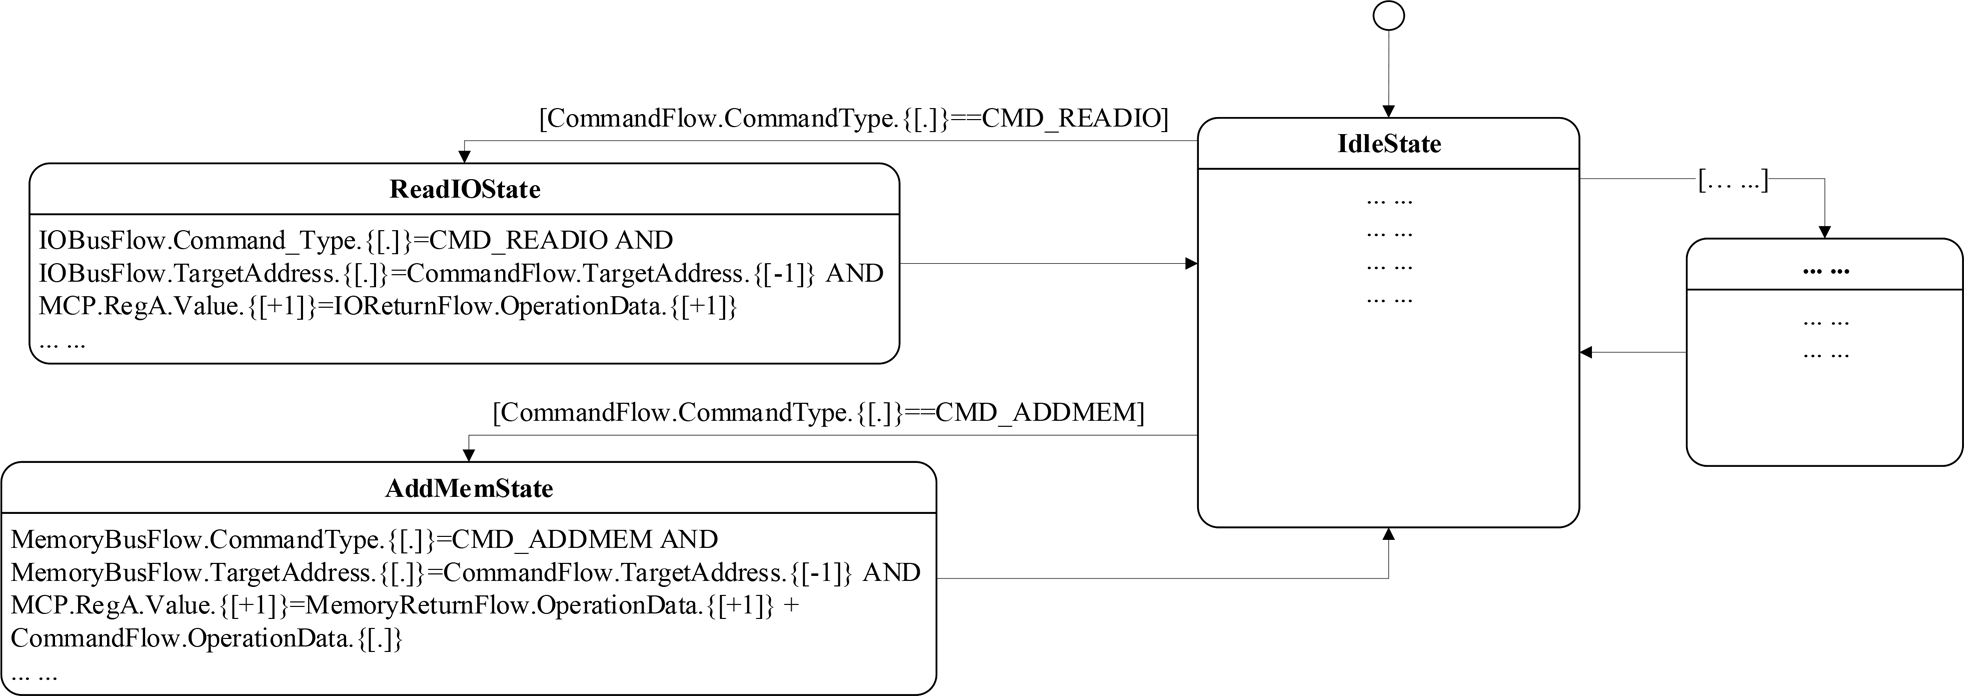
As an example, the nominal states of a processor (defined in Table 3) can be specified as Read Memory State (i.e., transferring data from a memory unit to its register), Add Memory State (i.e., performing addition on its register data and memory data and storing the result in its register), etc., as shown in Figure 7. In the middle of the figure, a state named “IdleState” is defined, which is the default state. We ignore some states because of the limitation of space. The activated state will change dynamically during fault inference. The inference uses behaviors as evidence to infer the activated state. The triggering conditions and behaviors of each state, appearing in Figure 7, will be explained in the following content.
Partial nominal states of a processor.
Definition 4. Behavioral Variables (BVs) denote the qualities involved in a behavior. The expression of a BV usually contains three sections, as shown in the following formula. Assume that the cuent state is S and the host entity of S is H = HostEntity(S), then a BV can be expressed by:
 $$[ H ].[ {Inputs( H ) \vert Outputs( H ) } ].[ {Qualities( {Inputs( H ) \vert Outputs( H ) } ) } ].$$
In the formula, the symbol [H] denotes the name of the host entity H; the second section [Inputs(H)|Outputs(H)] represents the inputs or outputs of the host entity. For example, we know that the inputs and outputs of a component are associated with the component's behaviors. Therefore, a BV of a component can be defined by using its inputs and outputs which are represented by flows. According to the definitions of these properties, this section includes the name of the flow which is an input or an output of a component. The third section [Qualities(Input(H)|Output(H))] is the name of the qualities of the flow defined in the second section. The following formula defines an example of a BV.
 $$MCP.CommandFlow.CommandType.$$
In the formula, the symbol MCP is the name of a multi-core processor defined in Table 3. The symbol CommandFlow defines the input of MCP which is a flow defined in Table 5. Then, the symbol CommandType is one of the qualities of CommandFlow.
Definition 5. Behavioral Rules (BRs) are expressions used to describe the relations between BVs. In practice, these expressions are logic expressions containing an equal symbol and/or several operators and BVs. In a behavioral expression, a variable usually appears in the following format. A BR is composed of Boolean expressions (EXP) connected by logical operators (LO). A Boolean expression is composed of terms (TRM) connected by comparison operators (CMP). Furthermore, a term is composed of BVs that are connected by algebraic operators (OP) or bit operators (BO).
 $$BR{\rm \;}: = [ {EXP} ] = [ {EXP} ] [ {LO} ] [ {EXP} ] ,$$
 $$EXP: = [ {TRM} ] [ {CMP} ] [ {TRM} ] ,$$
 $$TRM: = [ {BV} ] [ {OP} ] [ {BV} ],$$
 $$LO: = [ {AND\vert {OR} \vert NOT} ],$$
 $$CMP: = [ { > \vert < \vert = { = } \vert \le \vert \ge \vert ! = } ] ,$$
 $$OP: = [ { + \vert - \vert \times \vert \div \vert BO} ],$$
 $$BO: = [ {BIT\_AND\vert {BIT\_OR} \vert XOR} ] .$$
An example of BR is shown below. This example BR belongs to the “ReadMemoryState” of the multi-core processor class (MCP) defined in Table 3. The “Memory Bus Flow” is one of the outputs of the MCP and the “Command Flow” is one of the inputs of the MCP. Generally, the “Command Flow” is the flow that is sent from a software component to manipulate the action of a processor. The “Memory Bus Flow” is the flow that the processor sends to a memory bus to execute reading or writing operations. From Table 5, we can see that the “Command Type,” the “Target Address,” and the “Operation Data” are the qualities of a “Command Flow.” The “Memory Bus Flow,” whose definition is not explicitly provided, has the same qualities as the “Command Flow.”
 $$\eqalign{&MCP.MemoryBusFlow.CommandType \cr&\quad\quad\quad\quad\quad = CMD\_READMEM\;{\boldsymbol {AND}}\;MCP.MemoryBusFlow.\cr &\quad\quad\quad\quad\quad\quad\ TargetAddress \cr & \quad\quad\quad\quad\quad= MCP.CommandFlow.TargetAddress\;{\boldsymbol {AND}}\cr &\quad\quad\quad\quad\quad\quad\ MCP.MemoryBusFlow.OperationData \cr &\quad\quad\quad\quad\quad = MPC.CommandFlow.OperationData.}$$
According to the expression, the “Command Type” of the “Memory Bus Flow,” which is an output of the component “MCP,” is equal to a command “CMD_READMEM,” which is a predefined constant. Also, the “Target Address” of the “Memory Bus Flow” is equal to the “Target Address” of the “Command Flow.” The “Operation Data” of the “Memory Bus Flow” is equal to the “Operation Data” of the “Command Flow.” During the early phase of system design, no detailed implementation of functions, components, and flows, or mathematical models representing their behaviors will be available.
Definition 6. Behavioral Rules with Time (BRTs) are time-labeled expressions representing the relations between BRs. The time dimension is added to enable fault inference and study the evolution of the system over time. In BRTs, the time-labeled BVs will be used, which add a time label t n to the end of the BV expressions. The variable n denotes the current time step. For instance, the example BR with time labels can be defined below.
 $$\eqalign{ &MCP.MemoryBusFlow.CommandType.t2 \cr &\quad\quad\quad\quad\quad\quad = CMD\_READMEM\;{\boldsymbol {AND}}\;MCP.MemoryBusFlow.\cr &\quad\quad\quad\quad\quad\quad\quad\ TargetAddress.t2 \cr &\quad\quad\quad\quad\quad\quad = MCP.CommandFlow.TargetAddress.t1\;{\boldsymbol {AND}}\cr &\quad\quad\quad\quad\quad\quad\quad\ MCP.MemoryBusFlow.OperationData.t1 \cr &\quad\quad\quad\quad\quad\quad = MPC.CommandFlow.OperationData.t1.}$$
According to the expression, the “Command Type” of the “Memory Bus Flow” at time step 2 is equal to a type of command “CMD_READMEM.” The “Target Address” of the “Memory Bus Flow” at time step 2 is equal to the “Target Address” of the “Command Flow” at time step 1. The “Operation Data” of the “Memory Bus Flow” at time step 2 is equal to the “Operation Data” of the “Command Flow” at time step 1.
The expression above denotes the relation between two flows at a concrete time step (e.g., t1 and t2). However, we usually use BRTs to define the relation at a general level (not for a concrete time step). In that case, we define a time variation expression to represent the time relations. We use the expression {[ ± N]} for denoting the time relation. The expression {[0]} or {[ ⋅ ]} represents the current time step. The expression with a positive number, such as {[ + 1]}, means the time step after the current step with the number of steps. An expression with a negative number represents the time step that occurs before the current step with the number of steps. Hence, the example BR can be further defined as below.
 $$\eqalign{&MCP.MemoryBusFlow.CommandType.\{ {[ { + 1} ] } \} \cr &\quad\quad\quad\quad\quad = CMD\_READMEM{\rm \;}{\boldsymbol {AND}}{\rm \;}MCP.MemoryBusFlow.\cr &\quad\quad\quad\quad\quad\quad\ TargetAddress.\{ {[ { + 1} ] } \} \cr &\quad\quad\quad\quad\quad = MCP.CommandFlow.TargetAddress.\{ {[. ] } \} \;{\boldsymbol {AND}}\cr &\quad\quad\quad\quad\quad\quad\ MCP.MemoryBusFlow.OperationData.\{ {[ { + 1} ] } \} \cr &\quad\quad\quad\quad\quad = MPC.CommandFlow.OperationData.\{ {[. ] } \} .}$$
Definition 7. Triggering Conditions (TCs) are predicates that map the states and the BVs to a space of true or false. The result of these conditions is used in “if-then” rules to trigger a state transition. Similar to BRTs, the predicates of TCs are logic statements with operators and BVs, except that the TCs generally have a consequent state if the predicate is identified as True. The following formula defines an example of the TCs.
 $$\eqalign{ &{\boldsymbol {IF}}{\rm \;}MCP.CommandFlow.CommandType.\{ {[. ] } \} \cr &\quad\quad\quad\quad\quad = { = } CMD\_READMEM{\rm \;}{\boldsymbol {AND}}{\rm \;}MCP.State.\{ {[. ] } \} \cr &\quad\quad\quad\quad\quad = { = } MCP.State.IdleState{\rm \;}{\boldsymbol {THEN}}{\rm \;}MCP.State.\{ {[ { + 1} ] } \} \cr &\quad\quad\quad\quad\quad = { = } MCP.State.ReadMemState.}$$
According to the formula above, if the “Command Type” of the “Command Flow” is equal to a constant “CMD_READMEM,” and the current state of “MCP” is “Idle,” then the state of “MCP” in the next time step will be the state “ReadMemState.”
Dependencies and restrictions
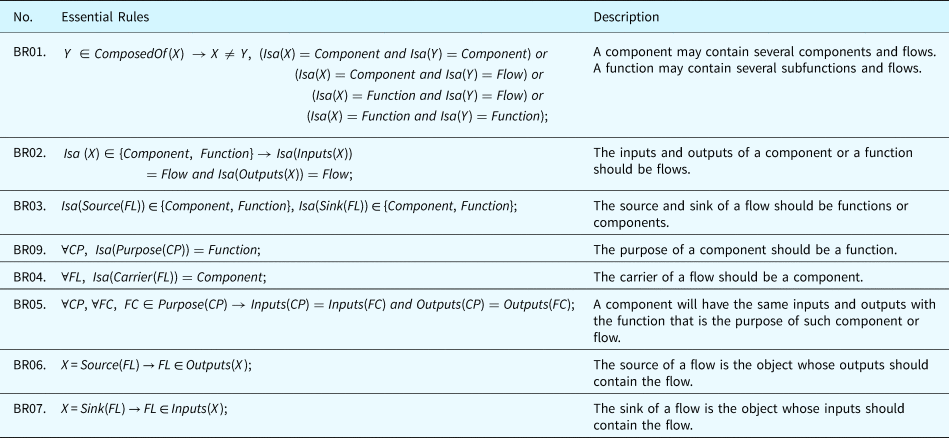
Dependencies and restrictions exist between the attributes of the proposed ontologies. These dependencies reflect the relations between the ontological concepts. The restrictions defined here allow the framework to automatically detect incorrectness in the model by using ontology solvers. Such automatic check can be important in complex systems to ensure that components are interconnected to achieve the desired system functionalities. Dependency and restriction rules and the corresponding explanations are listed in Table 11 by using the notations defined in Table 10.
Notations for dependency rules
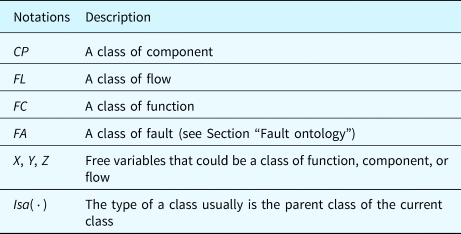
Table 11 interprets the constraints applied to the ontological concepts and the dependencies between them. Compliance to these relations guarantees the integrity of the system models. In addition, these rules will play a critical role in fault propagations which will be detailed in the section “Fault propagation inference.”
Dependencies and restrictions in ontological concepts
Modeling example
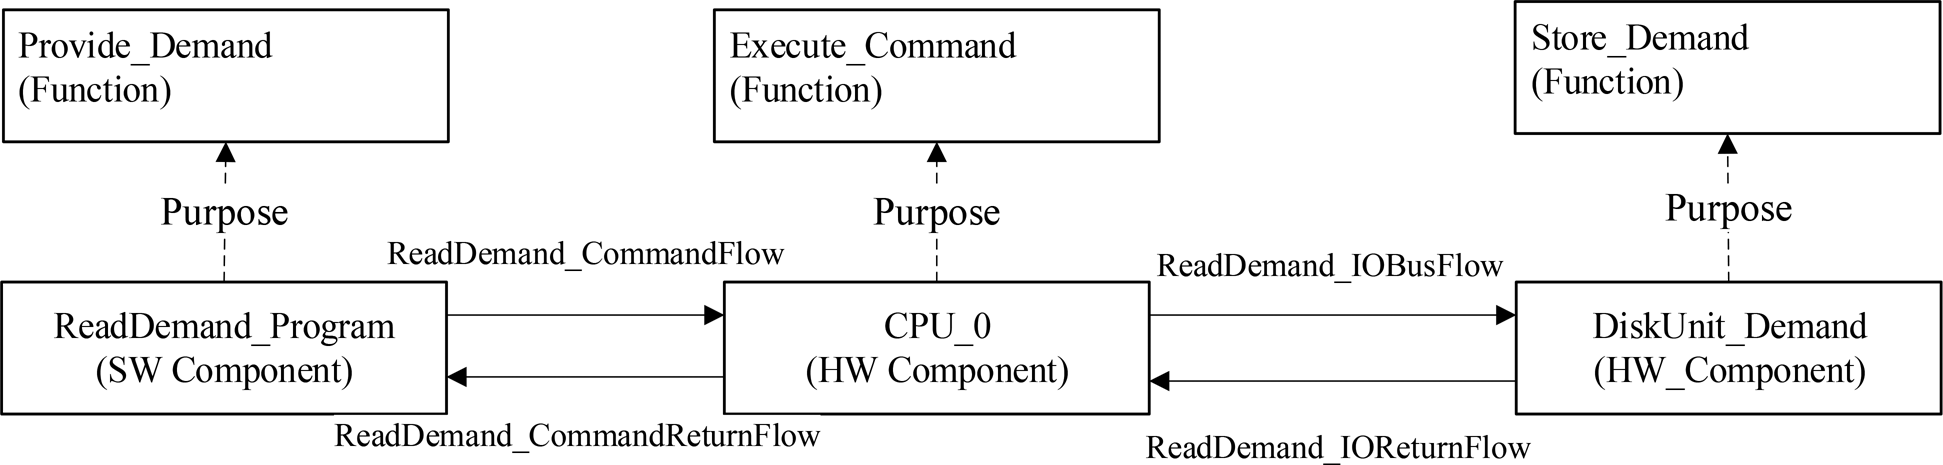
In this section, we use a simplified module of a computer system with SW and HW components as an example to illustrate the model construction using the ontological concepts. The function of the example subsystem is to provide a demand value to a control system. In this example, we created three individuals of component, four individuals of flow, and three individuals of function, as shown in Figure 8.
System model of the example system.
The specified values of the properties related to these individuals are detailed in Table 12. Individuals define concrete objects existing in the SUA, which are different from classes that are abstract concepts with constraints and rules. These individuals are subject to the predefined constraints and rules.
Property values of components and functions in the example system
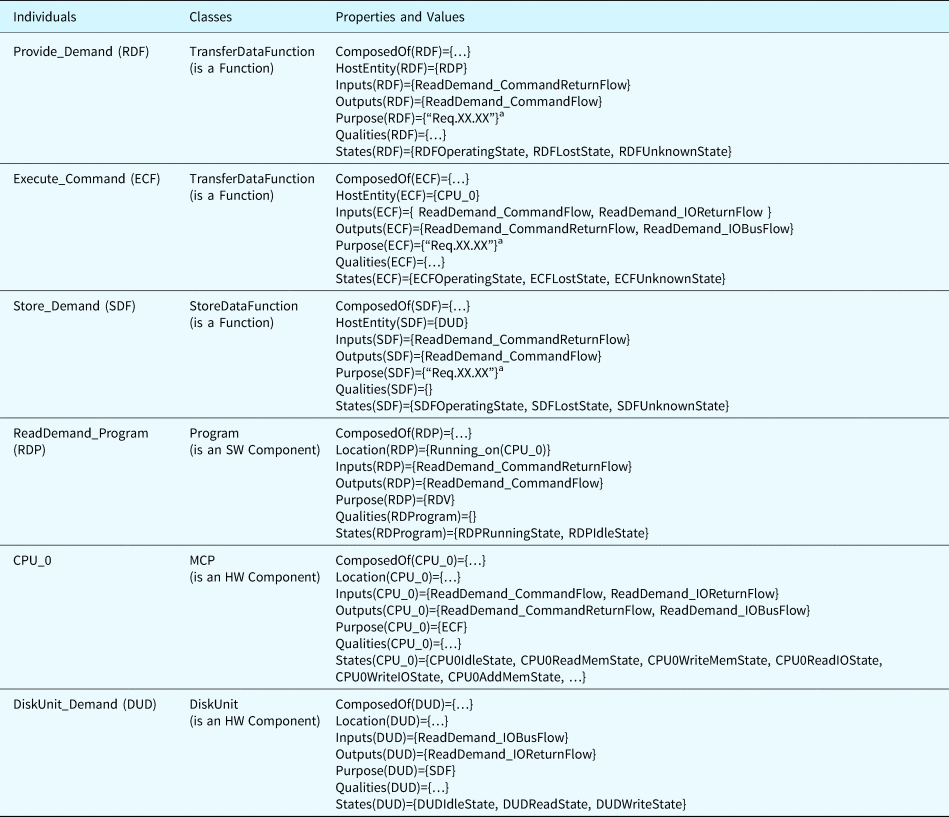
a The requirement of the function is not shown in this example.
When we have the system model with components, flows, and functions, the next step is to generate and inject faults based on the ontological concepts related to faults.
Fault ontology and fault generation
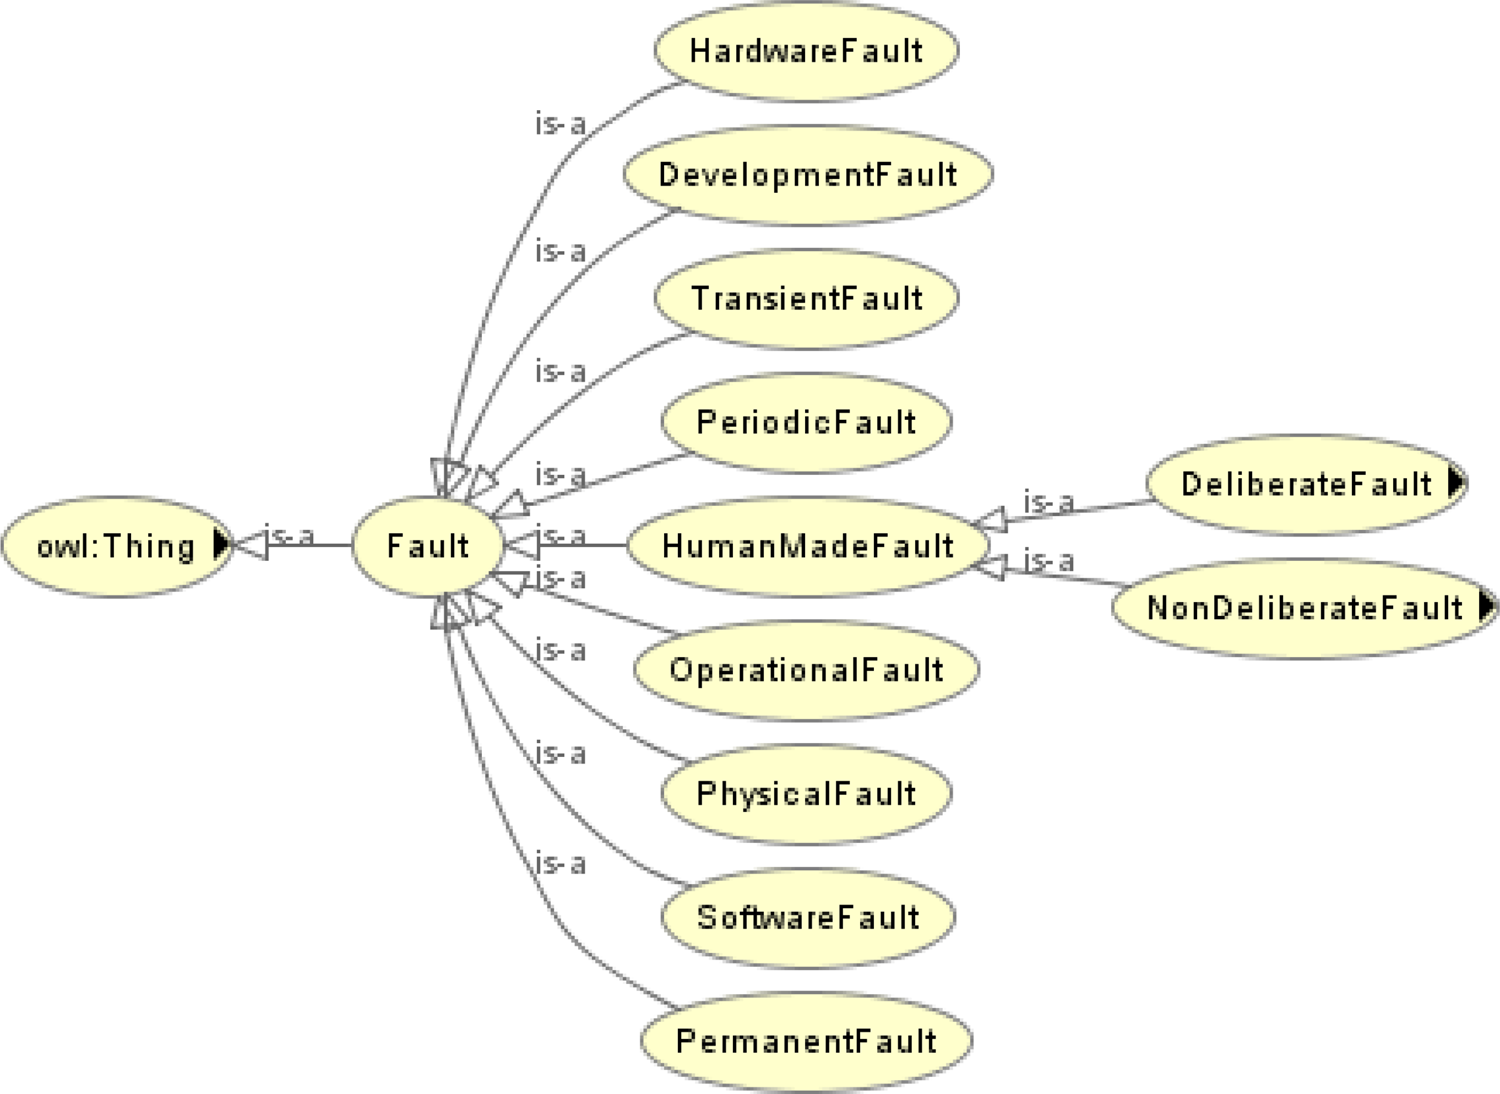
The proposed ontology framework provides fault ontologies to manage the known faults discovered in historical accidents or events and infer new types of faults that have not been discovered. The new fault inference is implemented by applying the fault generation principles introduced in the section to the properties defined by the component ontologies. This section details the concepts and properties related to fault ontologies and fault generation.
Fault ontology
Fault ontology allows the ontological framework to represent and generate various sorts of faults that may be introduced at design, development, and operation phases. In the perspective of system engineering (Avižienis et al., Reference Avižienis, Laprie, Randell and Landwehr2004b), an error is “the state of the system that deviates from the correct service state.” A fault is defined as: “An adjudged or hypothesized cause of an error.” System failure is “an event that occurs when the delivered service deviates from correct service.” A fault can arise from any phase of the life cycle of a product and can lead to erroneous states that may culminate into failures.
In prior research, faults have been classified through various perspectives, such as dependability (Avižienis et al., Reference Avizienis, Laprie and Randell2004a, Reference Avižienis, Laprie, Randell and Landwehr2004b), scientific workflow (Lackovic et al., Reference Lackovic, Talia, Tolosana-Calasanz, Bañares and Rana2010), and service-oriented architecture (Brüning et al., Reference Brüning, Weißleder and Malek2007; Hummer, Reference Hummer2012). In this paper, we synthesize the existing taxonomies for faults and establish the hierarchy of fault ontology shown in Figure 9. It is worth noting that the child nodes of the “fault” node in Figure 9 may not be defined in terms of the same perspective. For example, we defined the nodes of “software fault,” “hardware fault,” “development fault,” and “operational fault” as the children of the “fault” node, but the software and hardware faults are distinguished by domain, whereas the development and operational faults are classified by the phase during which the fault was introduced. A specific fault class will be linked to the corresponding node when building fault ontologies. For example, a “bit flip fault” of a processor register can be designated as a child node of the hardware fault and the operational fault.
Hierarchy of fault ontology.
Due to the complexity of fault causes and effects, several properties are defined to represent the factors involved in fault generation and propagation. Table 13 outlines the properties considered in the proposed method.
Properties defined in the fault ontology
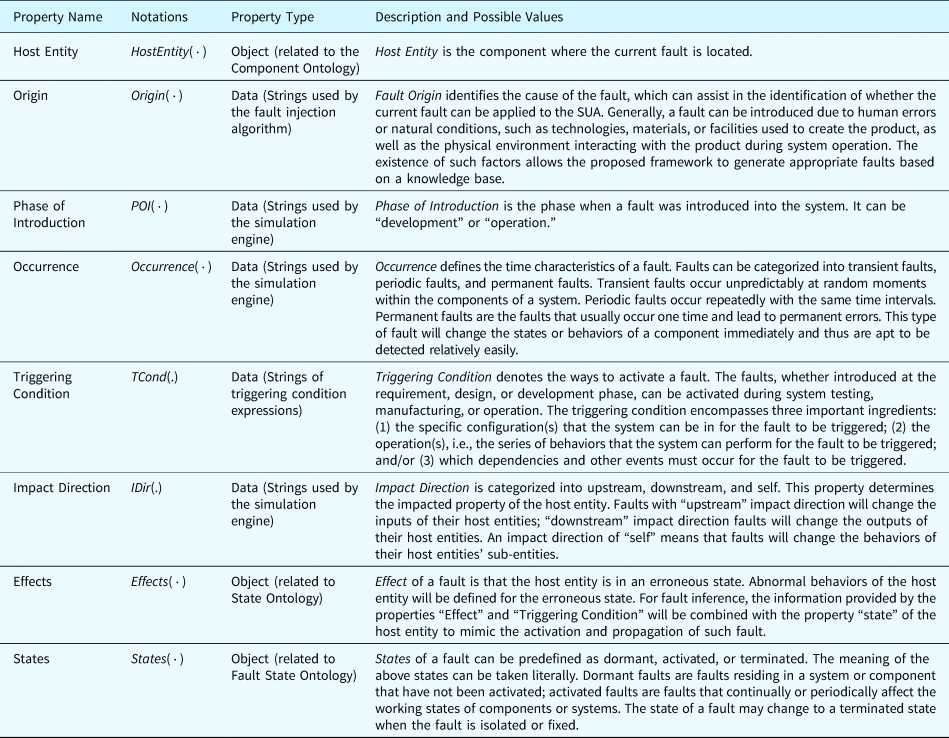
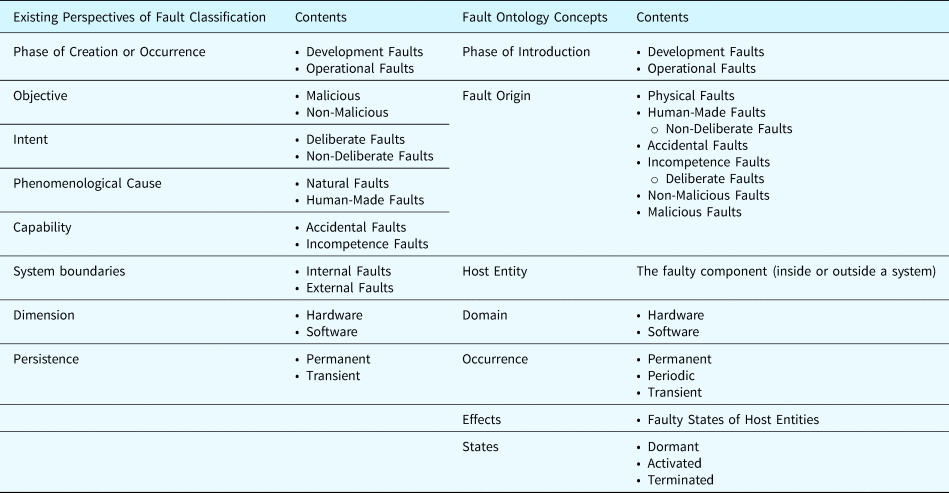
Table 14 illustrates the mapping relation between the existing fault taxonomies and the ontological concepts proposed by this research. We use (Avižienis et al., Reference Avižienis, Laprie, Randell and Landwehr2004b) as a representative research for comparison, where faults can be classified according to eight perspectives.
Mapping relation between the proposed fault taxonomy and the existing fault taxonomies
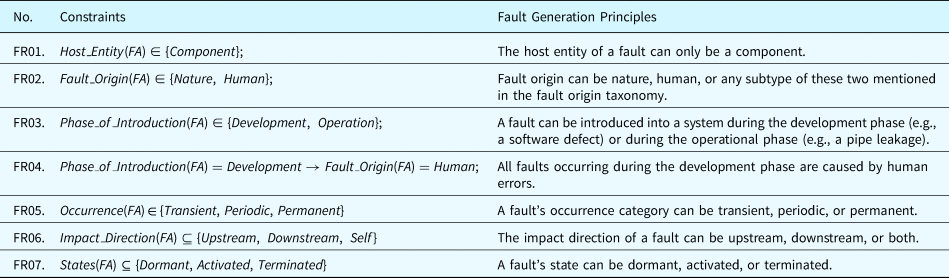
Restrictions on fault ontologies
By reusing the notations in Table 10, Table 15 shows the restrictions in the proposed fault ontologies. These restrictions are consistent with the existing research and fault taxonomies.
Restrictions in fault ontologies
Adding known faults to fault ontologies
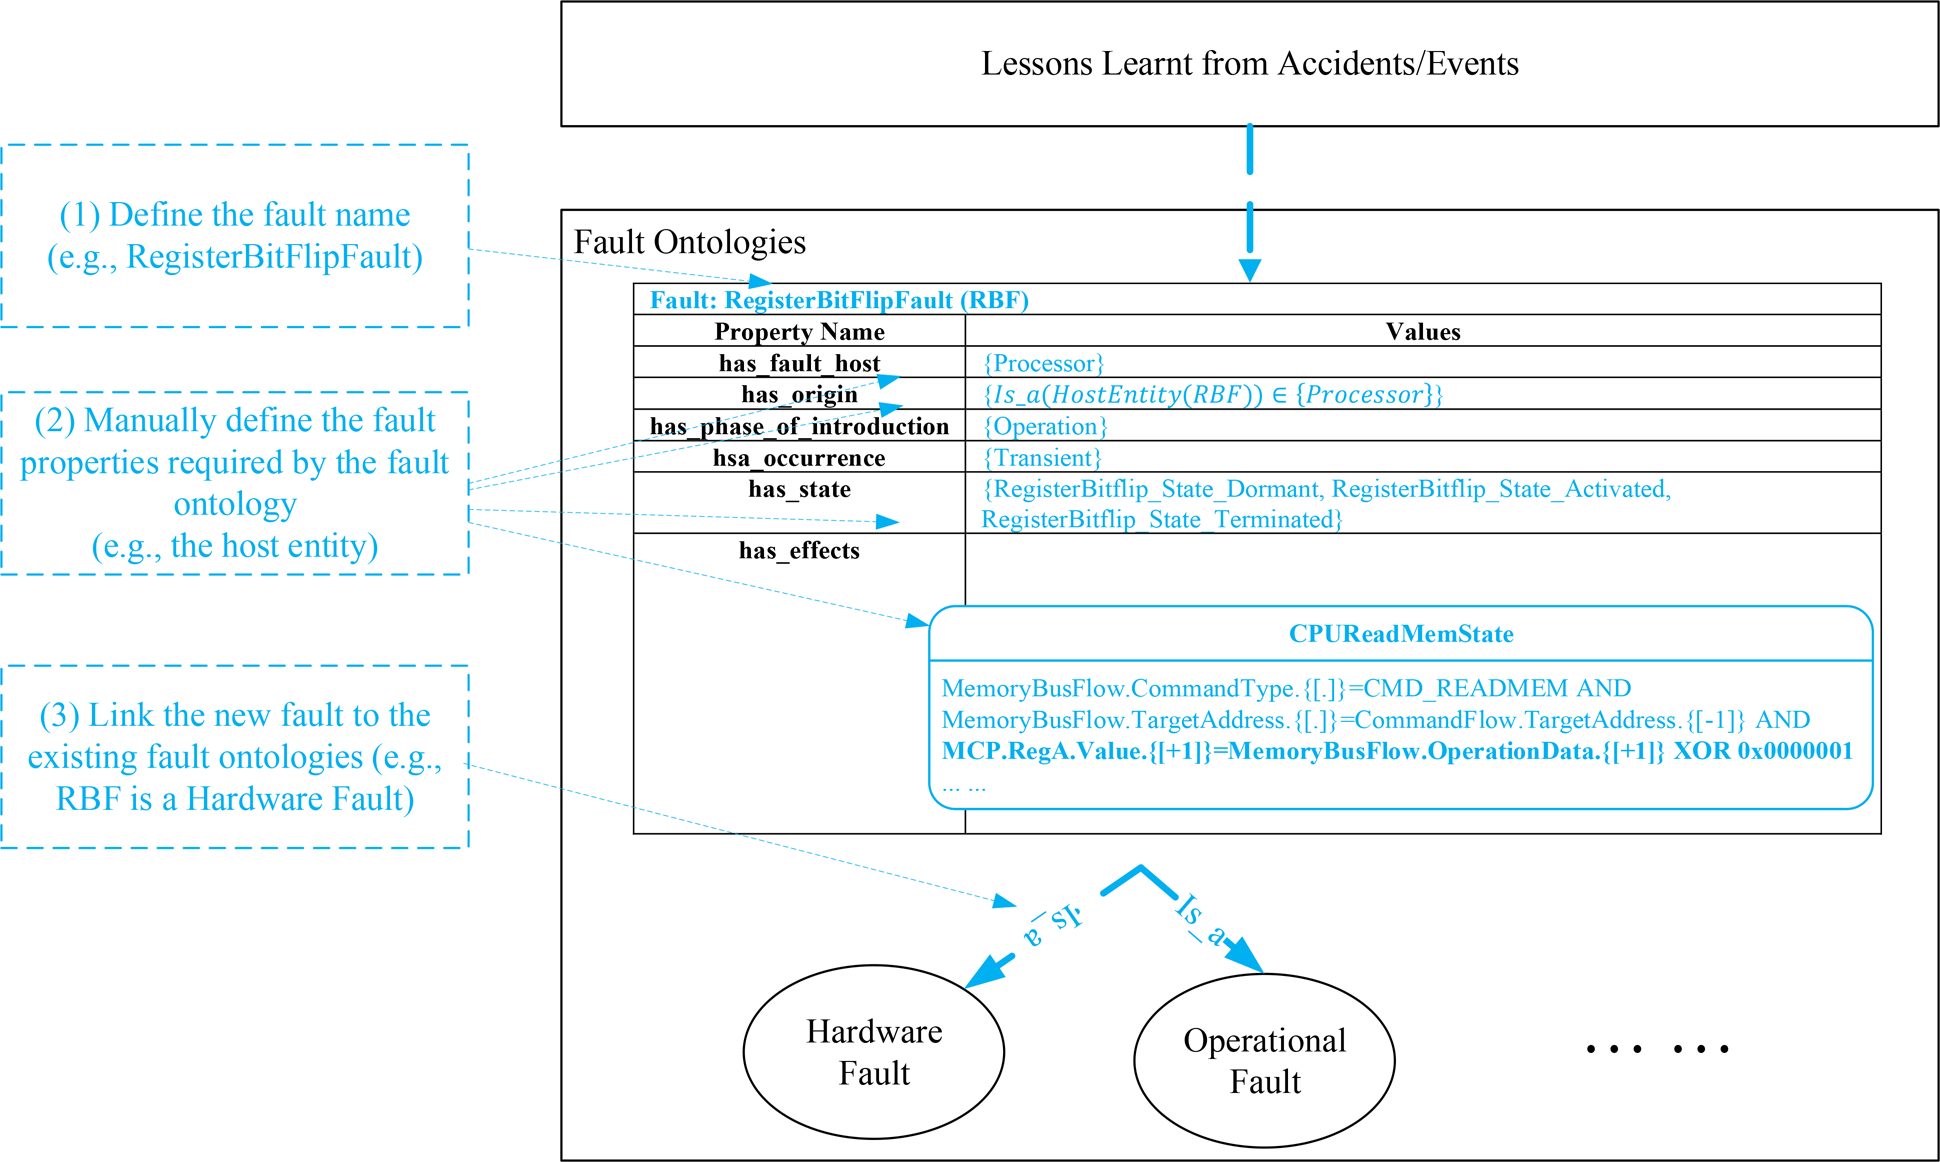
When a fault is observed in accidents or event reports, the observed fault can be recorded by the proposed fault ontology. The process of adding known faults to the fault ontologies consists of the following steps, which are displayed in Figure 10. The process is usually completed manually.
(1) Define the name of the fault object based on the event report or repository describing the fault. Figure 10 demonstrates this process by using an example fault, the bit flip fault of a register in a computer processor. In the example, a compact name “RegisterBitFlipFault” is defined to describe the characteristics of the fault.
(2) Define the properties of the added fault based on the properties provided by the fault ontology. As shown in the example, the host entity of the fault should be a processor, the phase of introduction should be defined as operation, etc.
(3) Add the new fault to the fault ontologies, linking the new fault to the ones in the fault ontologies. According to expert knowledge, a “RegisterBitFlipFault” is a hardware fault and an operational fault, as shown in Figure 10.
The process of adding a known fault to the fault ontologies.
Fault generation principles
Besides adding known faults to the fault ontologies, this paper develops a set of principles to generate new types of faults that may not have been observed historically. Since a fault is an object that may occur inside or outside a component, fault generation, in this paper, is the process of applying the fault generation principles to the properties of component ontologies and generating new faults that may affect the behaviors of HW and SW components. The fault generation principles can establish faulty states for components based on the properties defined by their ontologies. These faulty states with behavioral rules (BRs) will participate in the fault propagation inference to generate the fault propagation paths throughout the SUAs. Since the BRs are expressions containing properties and BVs, these principles can modify these elements in the BRs to deviate the behaviors of the target object from their normal states. The fault generation method expands the fault analysis scenarios beyond existing observed faults. This enables a system designer to discover unknown/unforeseen situations, or designing a system to be more robust and reliable. The fault generation principles are detailed as below by using the notations in Tables 10 and 16.
Notations for representing fault generation principles

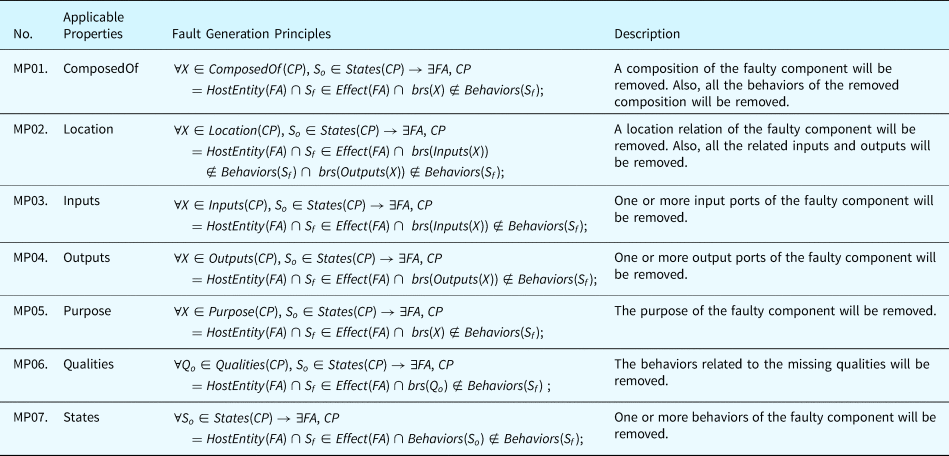
Category 1. Missing Property Principles define the rules to generate faults where a statement of a component's behavior defined by the ontological concepts is missing. For example, a routine pertaining to a software program is forgotten by the system designer. To generate this type of fault, the effect of such a fault complies with the following rules: (1) if the target behavior is an expression of behavior, the expression will be removed; (2) if the target behavior is a BV, all the expressions related to that BV will be removed. Table 17 displays the fault generation principle for missing property faults.
Fault generation principle for missing property faults
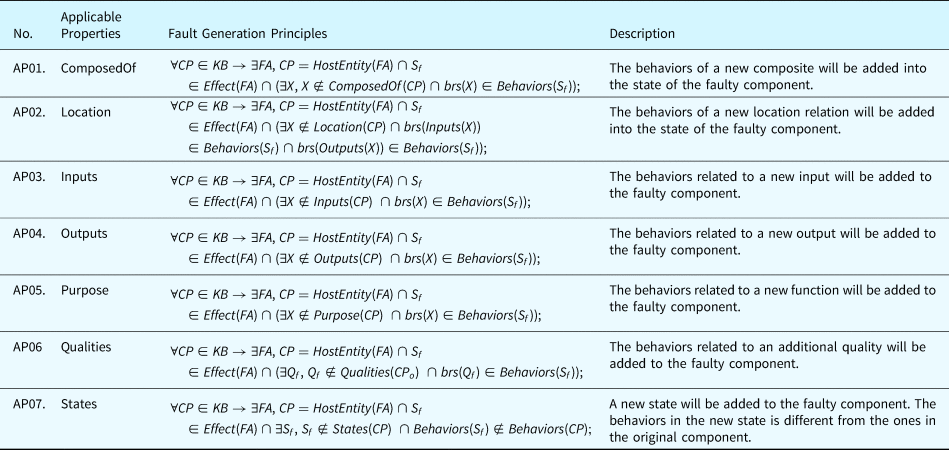
Category 2. Additional Property Principles define the rules to generate faults where an extra behavior of a component is injected into a state of that component. Several rules can be applied when adding new behaviors to a component. For example, a new disturbing BV can be added to a component and can be inserted into all the BRTs with an operator (e.g., addition). Table 18 reflects the general triggering conditions and effects related to different types of faults. The selection of the new entities added to the system depends on the configuration of the system.
Fault generation principle for additional property faults
Category 3. Incorrect Property Principles define the rules to generate faults where an existing BRT in the nominal state of a component is modified. The modification can be a change of an operator (e.g., change a “+” to a “−”). This process is like applying a mutation operator to BRs which are analogous to software source code. Table 19 displays the fault generation principles for incorrect property faults. Selecting which entities to replace depends on the configuration of the system, and, currently, human interaction is required to make this selection.
Fault generation principle for incorrect property faults
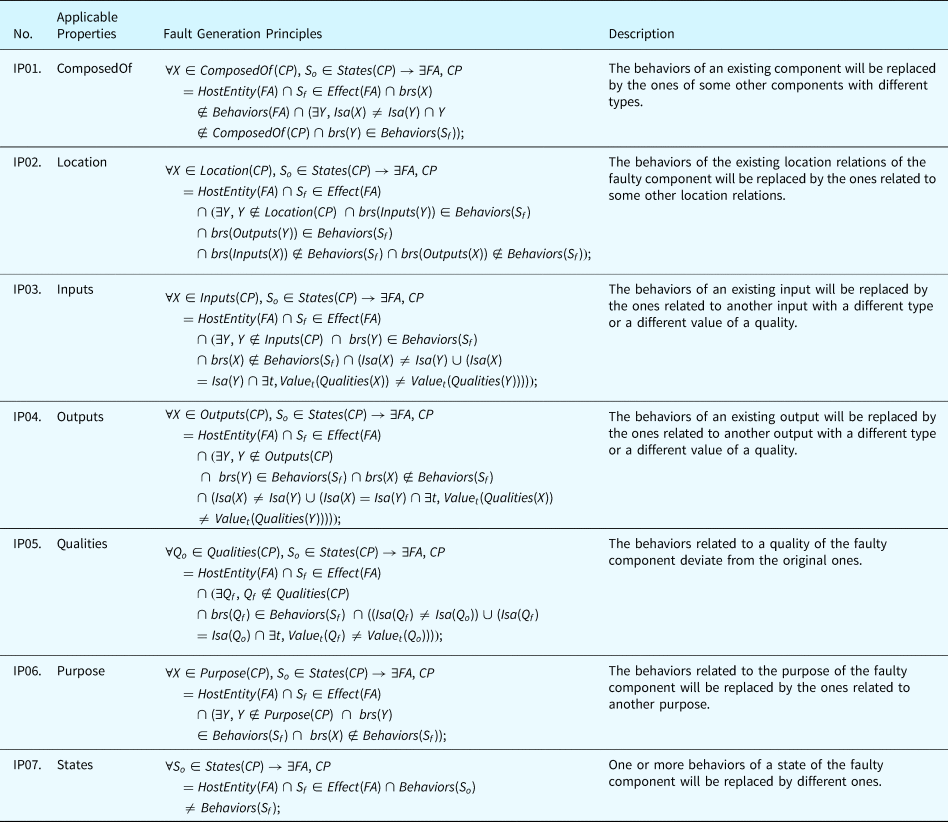
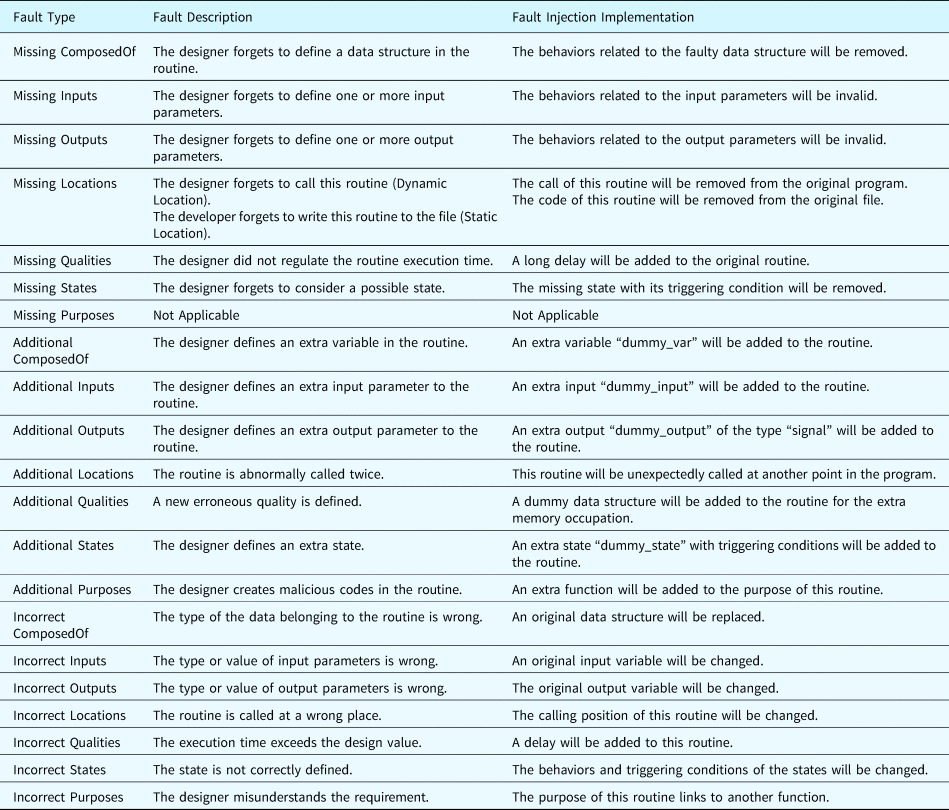
Table 20 summarizes the faults obtained when applying the fault generation principles to a software routine. In the table, generic descriptions are given to summarize the generated faults.
Fault generation for a software routine
Fault generation process
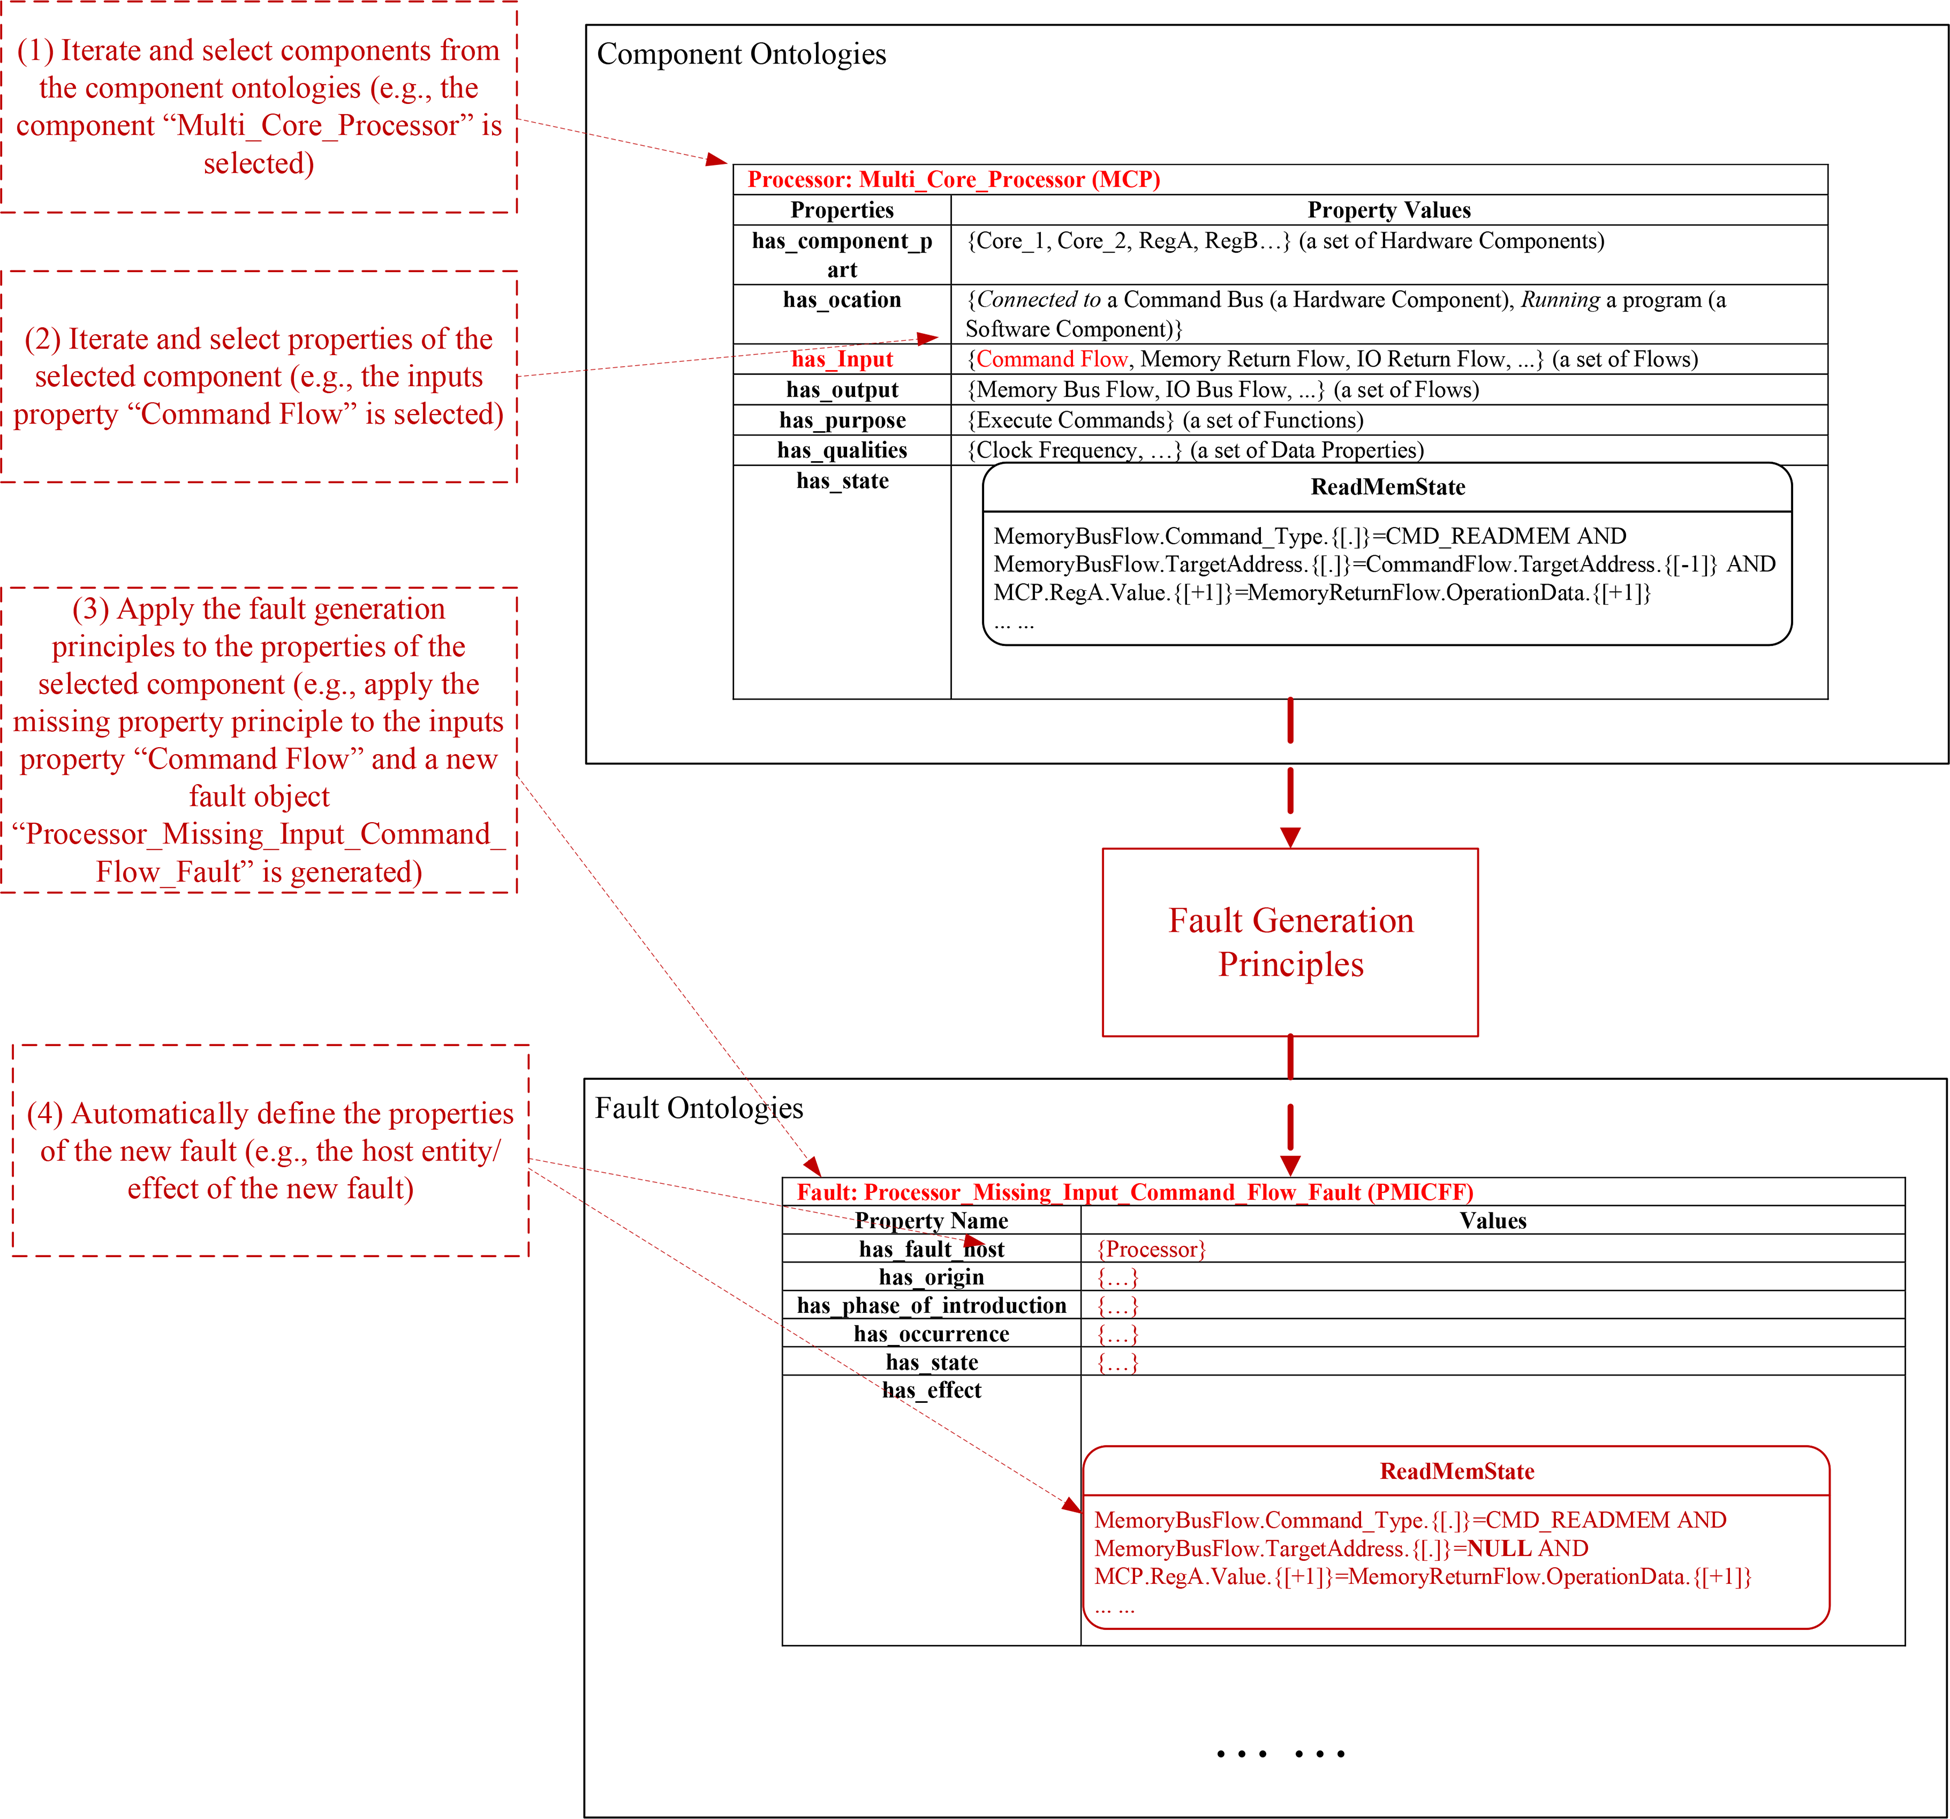
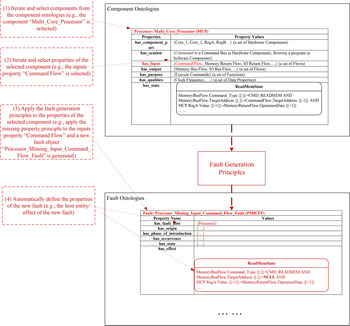
The process of fault generation is interpreted by Figure 11 which uses the multi-core processor component as an example. It is worth noting that the fault analysis framework can automatically implement the fault generation process. The process encompasses the following steps.
(1) Iterate and select components in the component ontologies. As shown in Figure 11, the component “Multi_Core_Processor” is selected, which is a “Processor.”
(2) Iterate and select properties of the component under consideration. In the figure, one of the “inputs” properties, “Command Flow,” is selected.
(3) Apply the fault generation principles to the selected properties. In this example, the missing inputs rules defined in Table 17 is applied to the “Command Flow” and correspondingly a new fault object “Processor Missing Input Command Flow Fault” is added to the fault ontology.
(4) Define the properties of the new fault object. The fault analysis framework can automatically define a portion of the new fault's properties, such as the host entity and the effects of the fault. For example, the effects of the generated “Processor Missing Input Command Flow Fault” contain the impacted state “Read Memory State” which includes an abnormal behavior “MemoryBusFlow.TargetAddress.{[.]} = NULL.” This behavior rule derives from the original rule “MemoryBusFlow.TargetAddress.{[.]} = CommandFlow.TargetAddress.{[−1]}.” Since the input “Command Flow” is selected as the missing property in this example, all the variables related to this input are assigned an invalid value “NULL.”
The process of fault generation (using the multi-core processor component as an example).
The generated faults will be introduced into the SUA in the fault injection process and their impacts on the SUA will be inferred during fault propagation analysis.
Fault injection
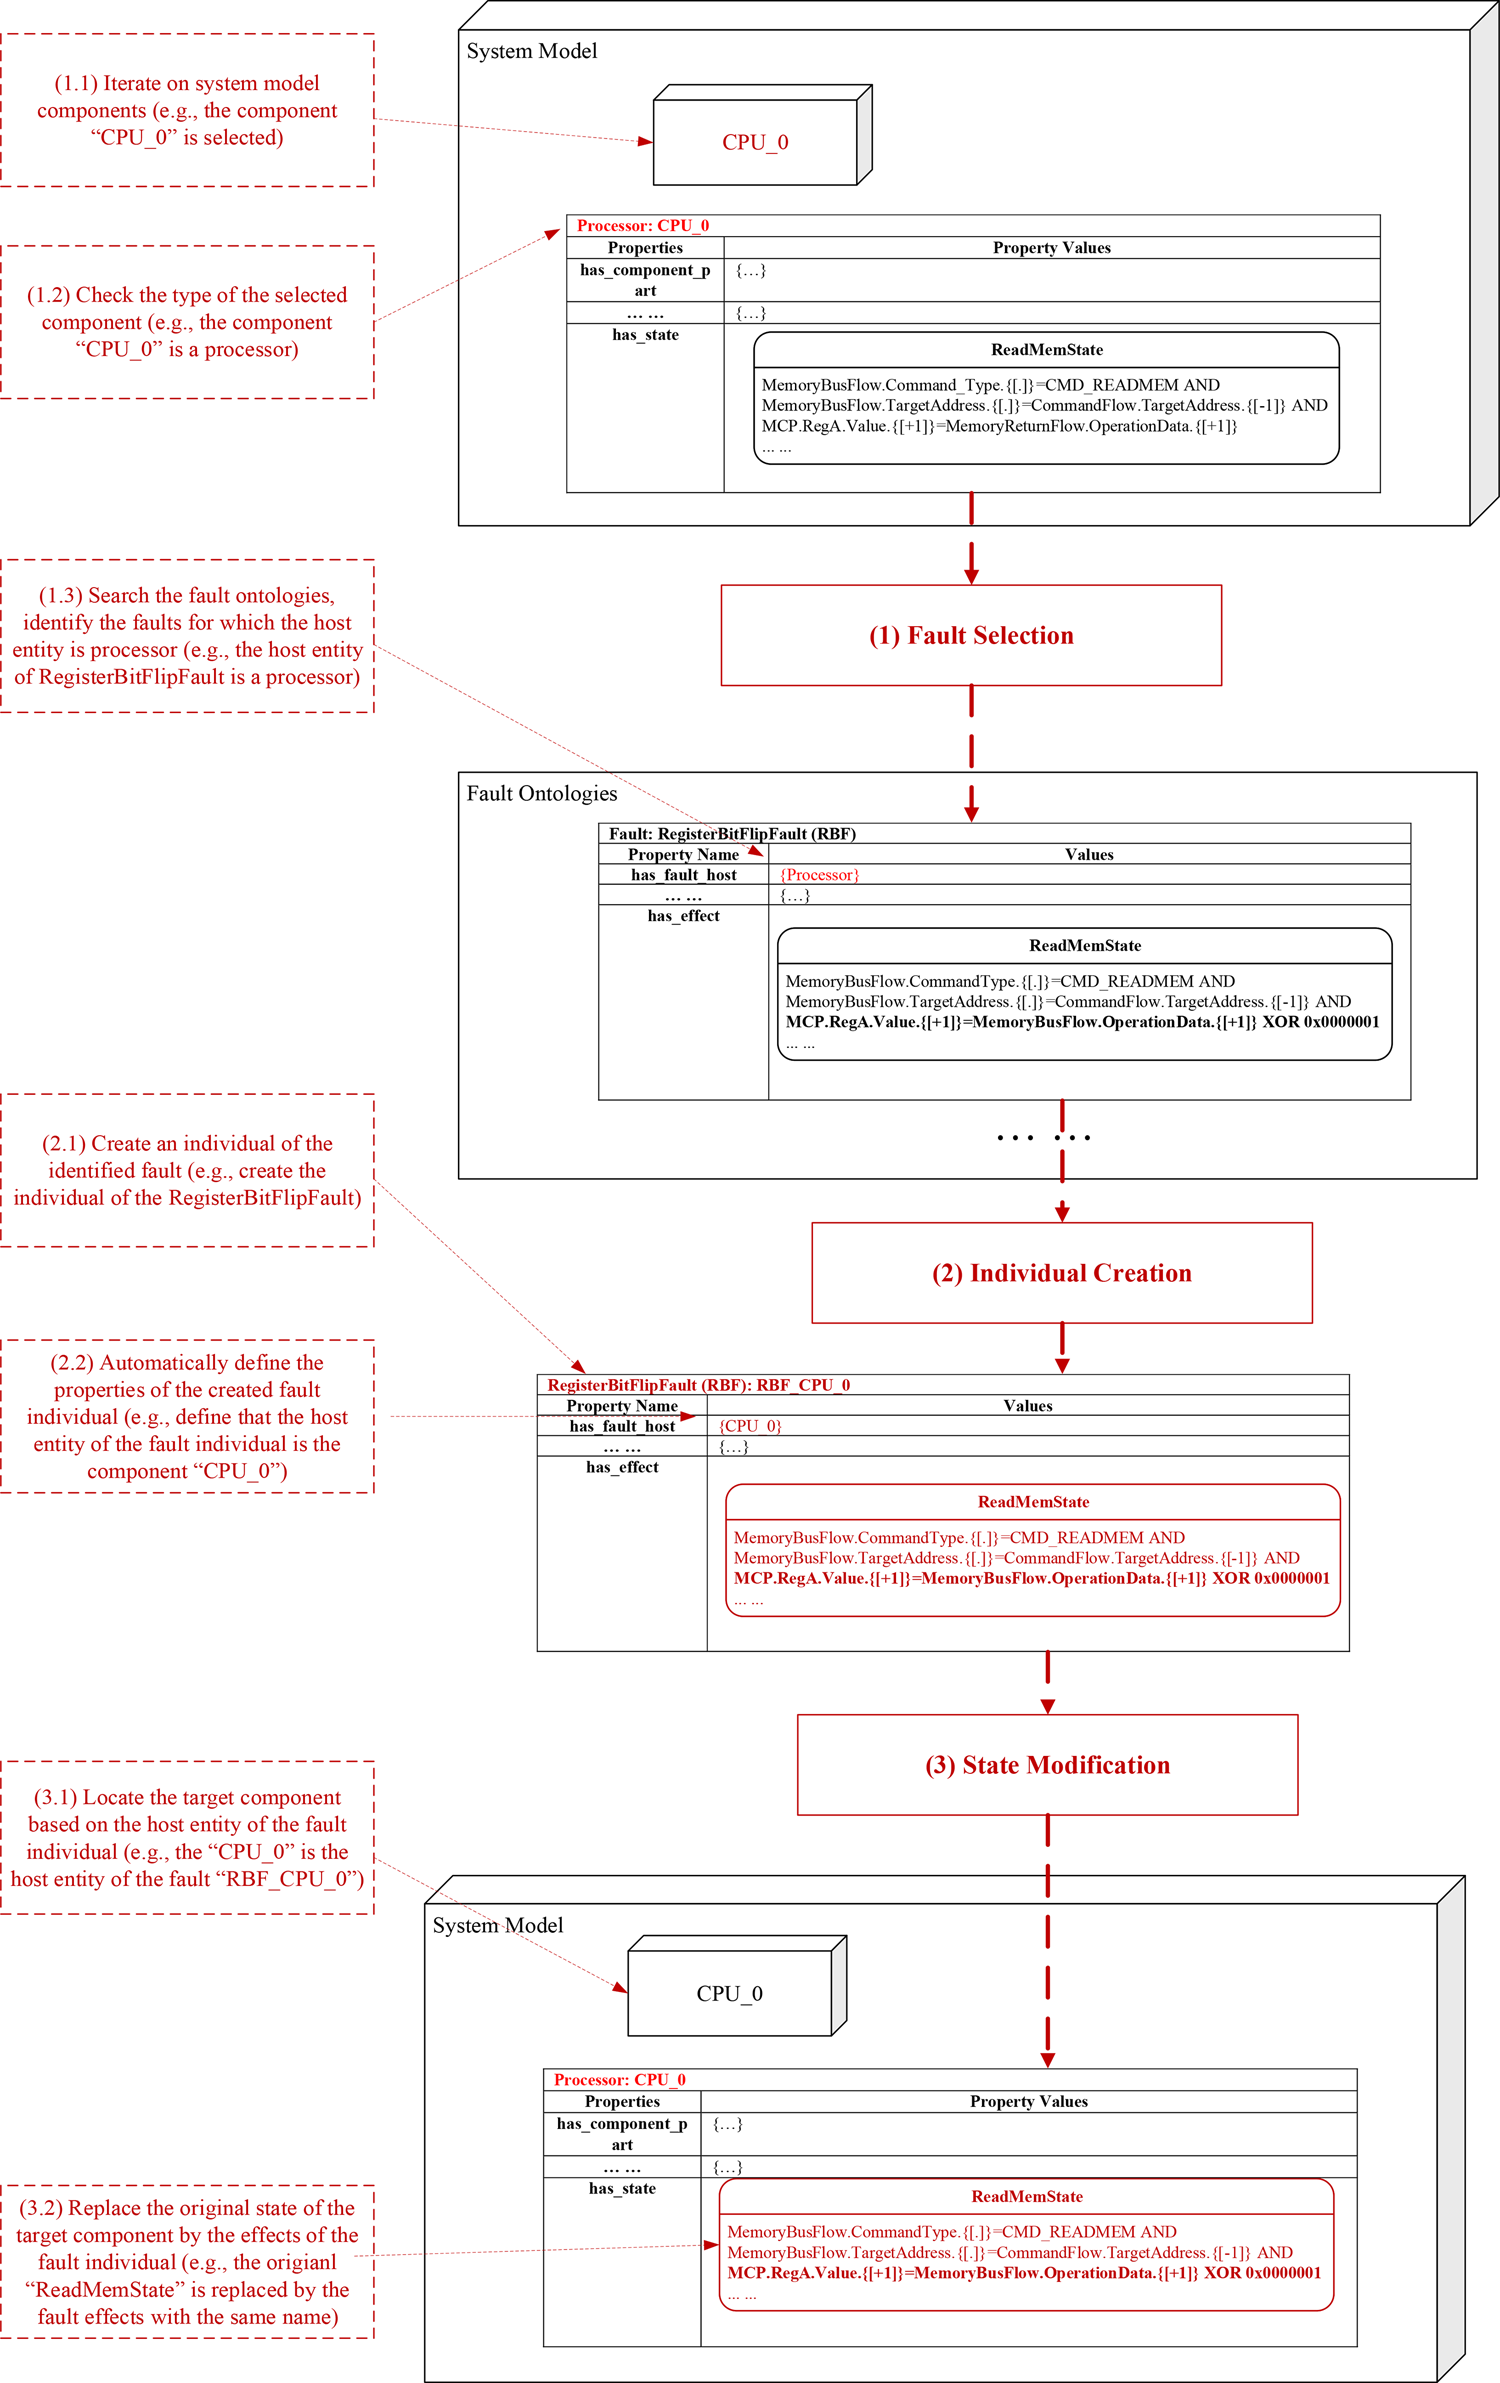
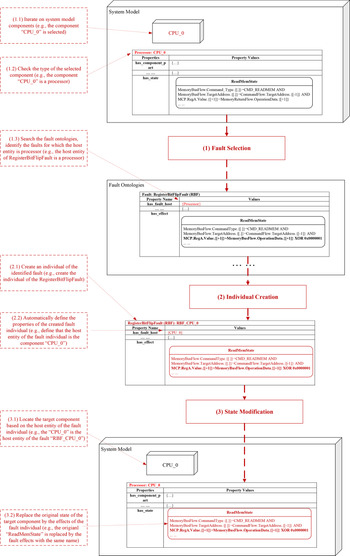
Faults are injected into the system model before fault propagation inference. Fault injection is the process that decides on the fault types and locations at which faults will occur in SUAs and injects the abnormal behaviors of these components in faulty states into the SUAs. Based on the properties of the fault ontologies introduced in this section, the fault injection process can automatically select potential faults of SUAs and inject them to the possible occurrence locations. As shown in Figure 12, the fault injection process consists of the following steps: (1) fault selection, select appropriate types of faults from the fault ontologies based on the information related to components in the SUA; (2) individual creation, create an instance of the selected type of fault and specify the properties related to the individual; and (3) state replacement, replace the states of the host entity in terms of the states defined by the effect property of the fault individual. The replaced state with the abnormal behavior will be involved in the fault propagation inference which establishes a fault propagation path. The following subsections explain these steps.
Fault injection process (using the “RegisterBitFlipFault” as an example).
Fault selection
Fault selection is the process to select appropriate types of faults from the fault ontology. In the fault ontology, the host entity is the property that assists in the identification of whether the current fault can be applied to the SUA. As an example shown in Figure 12, the first task of fault selection (task 1.1) is to iterate on the system model and select components for fault injection. The component individual “CPU_0,” which is an instance of a processor (identified in task 1.2), is selected. Then, task 1.3 searches the fault ontologies for the faults that will occur in a processor. In this case, the “RegisterBitFlipFault” (RBF) is located by the fault injection algorithm since the host entity of the RBF is a processor.
Individual creation
Once the object of the fault has been identified, the fault analysis framework creates an individual of such type of fault (task 2.1) and specifies the properties related to the fault class (task 2.2). In Figure 12, a fault individual “RBF_CPU_0” is created which effects include the “Read Memory State” with abnormal behaviors.
State modification
In this step, the original states of the target component will be replaced by the states defined in the “Effects” property of the created fault individual. By doing this, a new system model is generated which contains the components with faulty states. During the fault propagation inference, these injected faulty states will be activated and the corresponding behavioral rules will be executed. In the example shown in Figure 12, the target component of the fault individual “RBF_CPU_0” is located by referring to its host entity (CPU_0) in task 3.1 and then by replacing the original states of the original component individual “CPU_0” by the effects of the fault individual. In detail, the original state “Read Memory State” of the component “CPU_0” contains the normal behavior rule “MCP.RegA.Value.{[+1]} = MemoryReturnFlow.OperationData.{[+1]}” (shown in the system model block at the top). After the fault injection process, the original state “Read Memory State” is replaced by a faulty “Read Memory State” derived from the effects of the fault individual “RBF_CPU_0.” In the faulty state, the normal behavior mentioned above is replaced by an abnormal behavior “MCP.RegA.Value.{[+1]} = MemoryReturnFlow.OperationData.{[+1]} XOR 0 × 00000001” (shown in the system model block at the bottom).
Restrictions in fault injection
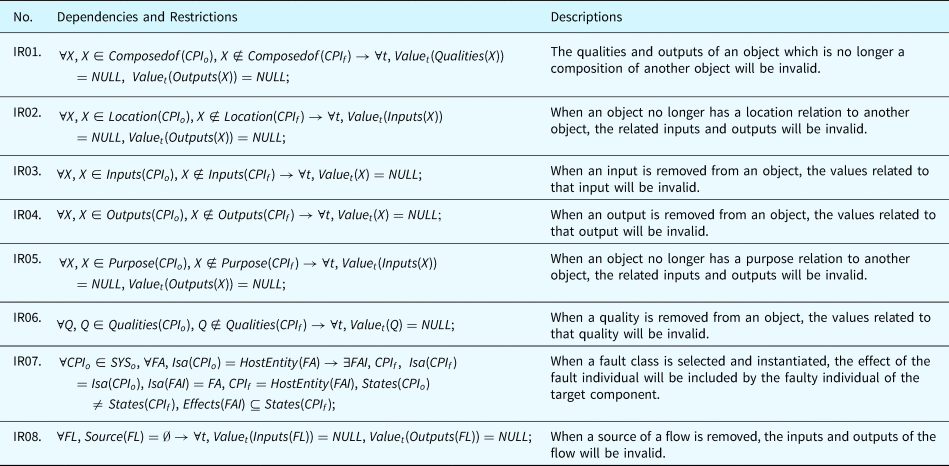
The fault analysis framework defines dependencies and restrictions for fault injection using the fault ontologies. To clearly represent the dependencies and restrictions related to the introduced ontological concepts, we extend the notations defined in Table 10 to the ones in Table 21.
New symbols used for representing fault injection restrictions
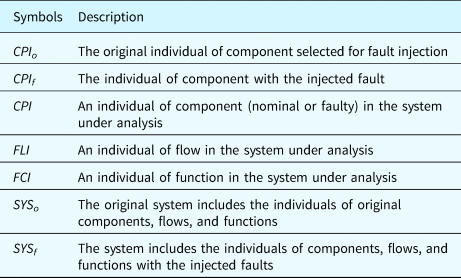
In the table, we use the suffix o to represent the entities in the original system and use the suffix f to denote the entities in the system with the injected faults. Table 22 contains the general dependencies and restrictions applicable to the fault injection.
Dependencies and restrictions for fault injection
Fault propagation inference
Fault propagation inference is the process of emulating the behaviors of components, flows, and functions chronologically and deducing their states to visualize the effects of a fault.
Inference workflow
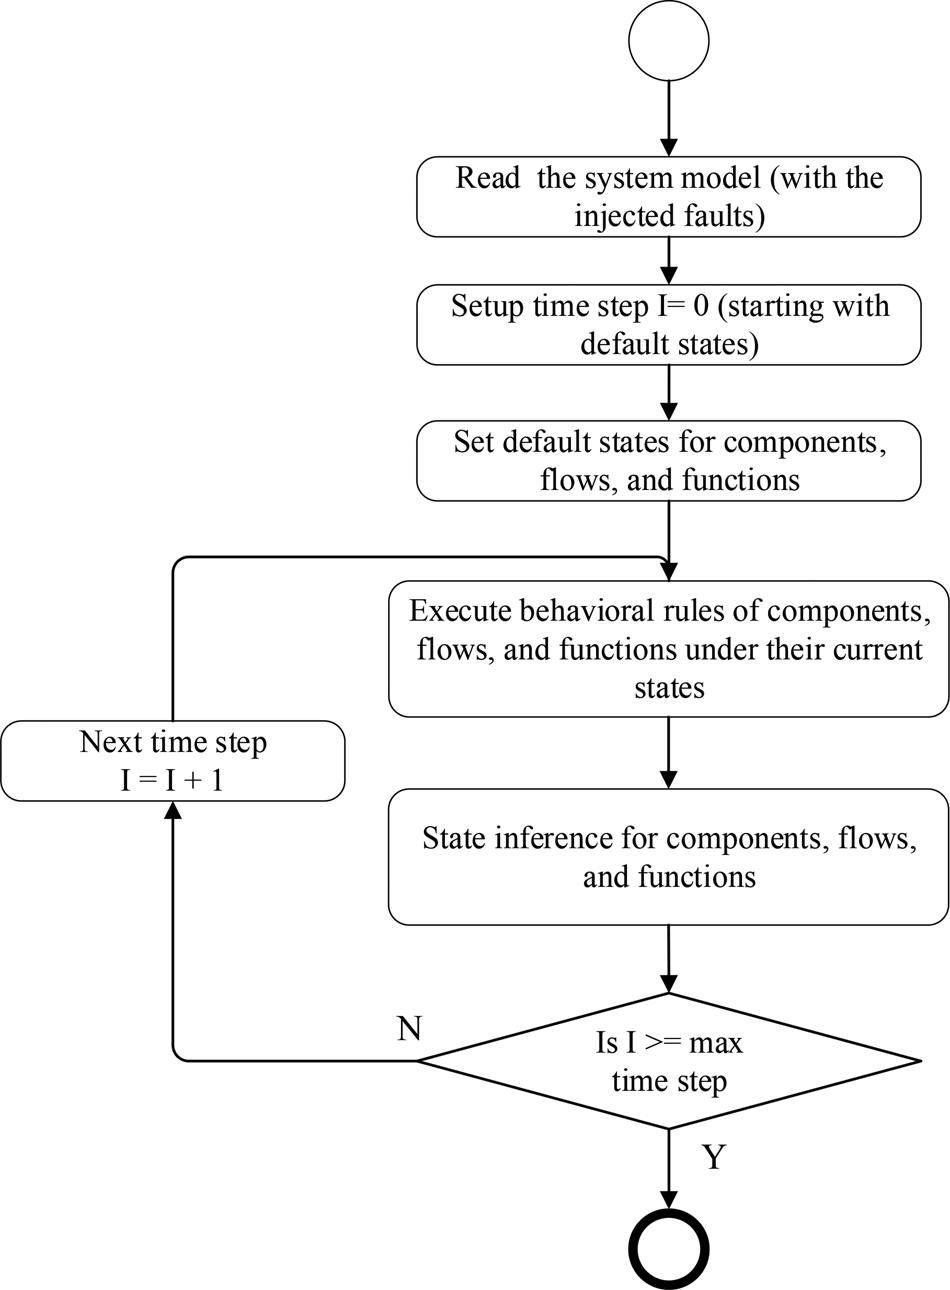
The process of fault inference is shown in Figure 13. At the beginning, the system models with the injected faults (see Section “Fault injection”) are read and parsed by the analysis framework. Then, the states of all components, flows, and functions will be set to their default states and the time step counter is set to 0. Then, the behaviors under the default states will be executed (i.e., be used as assertions, aka evidence) to determine any changes in the states caused due to fault propagation. Details of the state inference is discussed in the section “State inference.” After that, the inference process enters a loop for each time step, starting from time step 1 (I = 0 + 1). For each time step of the fault inference, the BRs of components, flows, and functions will be inserted into the evidence pool, aka a set of assertions or assumptions.
Workflow of fault propagation inference.
State inference
To infer the states of components, flows, and functions at every time step, the BRs in the evidence pool are used as proofs. During the inference, the behavioral rules with time are used as assertions that are inserted into an evidence pool, which is the set of all assertions that describe the “objective facts” of the SUA. For example, we assume that at the beginning of a simulation, the default state of a processor is “IdleState.” According to the states of a processor defined, the behaviors “MemoryBusFlow.CommandType.t0 = NULL AND … ” will be inserted into the evidence pool, which means that the “Command Type” of the “Memory Bus Flow” is invalid at time step 0.
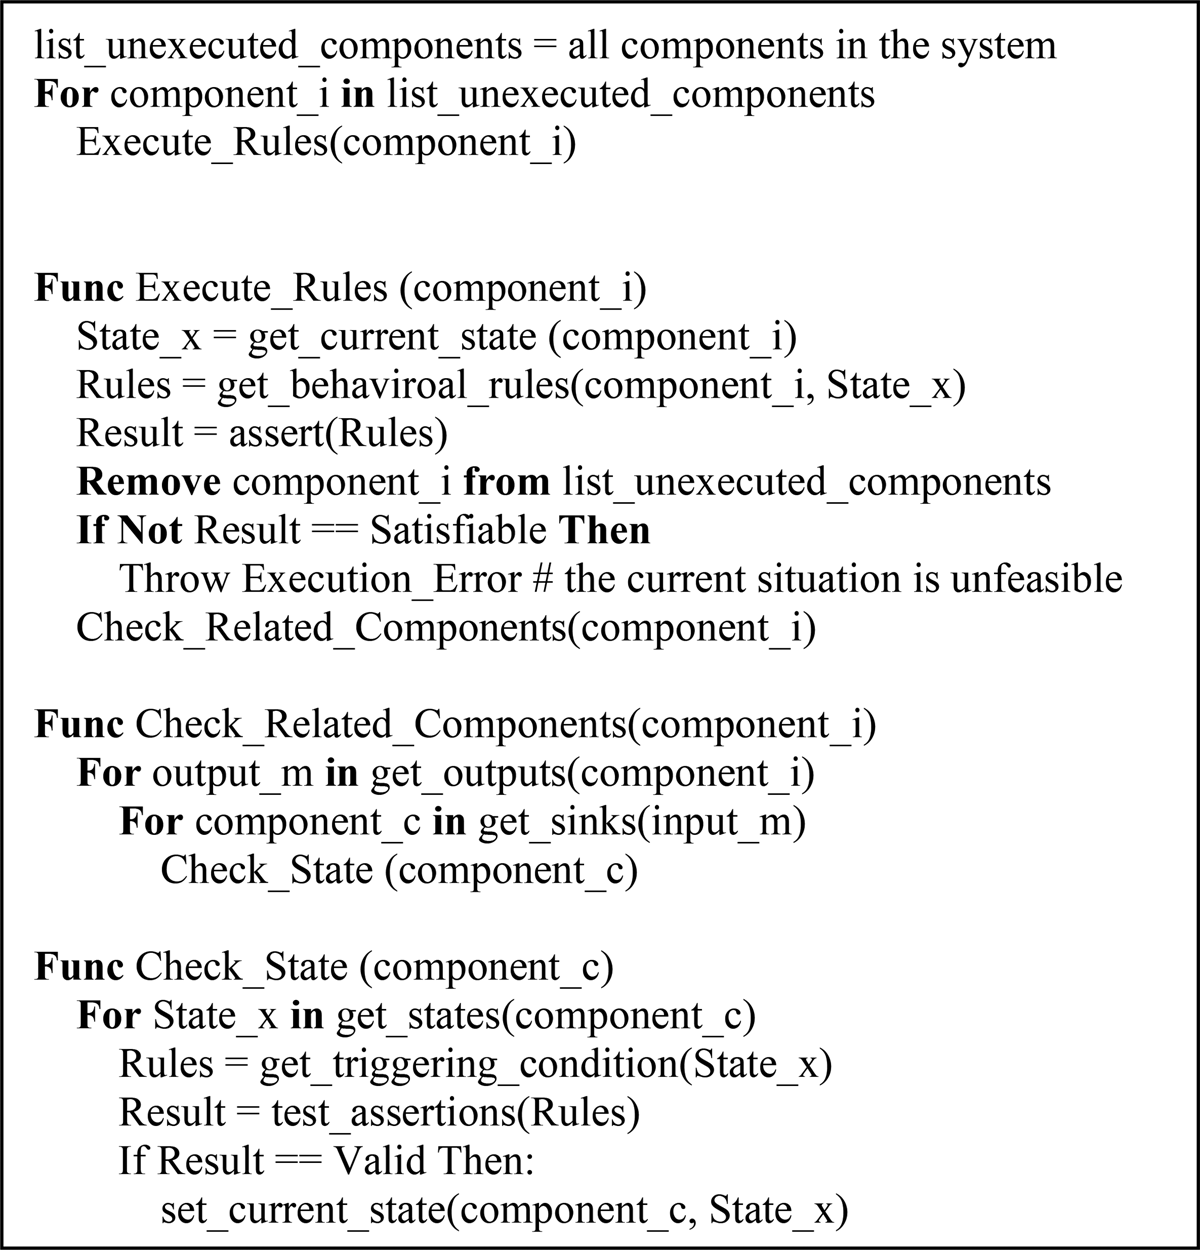
Based on the assertions contained in the evidence pool, the states of components, flows, and functions can be inferred by identifying whether the triggering conditions (TCs) of states are True or False through Satisfiability Modulo Theories (SMT; Bjorner and De Moura, Reference Bjorner and De Moura2011). For example, if we define the states of the function “Provide Demand” as shown in Figure 14, to infer its state, we need to determine whether the TC “RDP.State.{[.]} == RDP.State.RDPRunningState AND ReadDemand_CommandReturnFlow.OperationData == DEMAND_VALUE” is True or the TC “RDP.State.{[.]} == RDP.State.RDPRunningState AND ReadDemand_CommandReturnFlow.OperationData ! = DEMAND_VALUE” is True.
States of function “provide demand.”
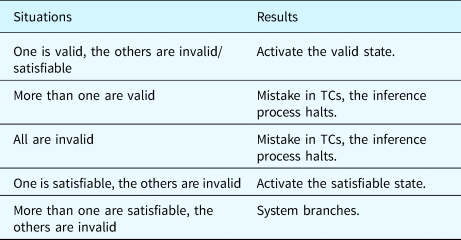
According to SMT, the status of a statement can be (1) Valid, which means that the statement is definitely True; (2) Invalid, which means that the statement is definitely False; and (3) Satisfiable, which means that the statement can be True, depending on further assertions.
When a TC is identified as a true TC, this confirms that the corresponding state should be activated. On the other hand, when a TC is identified as a false TC, this verifies that the corresponding state is inactive. However, if a TC is identified as a satisfiable statement, then further inferences are required. For example, if another TC is verified as Valid, then its state will be activated. However, if all the other TCs among the current object are identified as Invalid, then the satisfiable TC will be used as a true TC and its state will be activated. The possible situations and corresponding results are listed in Table 23. When the system branches, one satisfiable state will be activated in every branch and the inference continues.
Possible situations and results
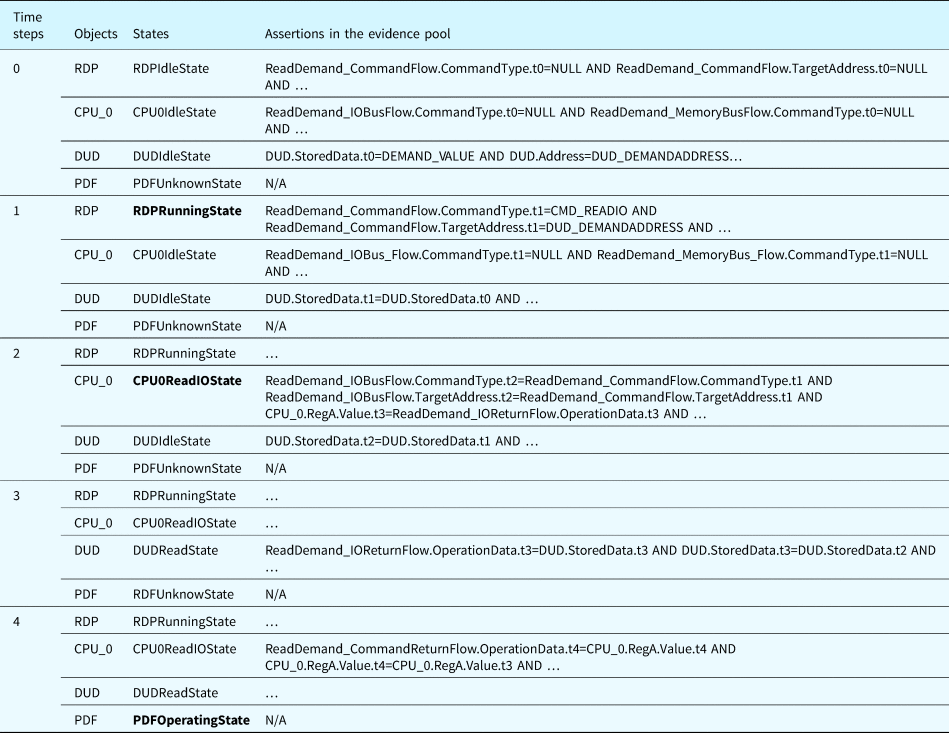
Using the system shown in Figure 8 as an example, Table 24 shows the states of selected components, flows, and functions at each time step and the assertions inserted into the evidence pool based on their BRs. Assume that at the beginning of the fault propagation inference (time step 0), the states of all the components are idle. We can infer that the state of the function “Provide Demand” (PDF) is unknown, which is the default state. Then, the software program RDP is activated and its state changes to “RDPRunningState.” In this case, the behaviors under the state “RDPRunningState” of the component “RDP” are executed (i.e., inserted into the evidence pool). As a result, the “Command Type” of “ReadDemand_CommandFlow” from “RDP” changes from an invalid value (NULL) to CMD_READIO, as shown in the table. According to Table 24, the state of “CPU_0” is changed to “CPU0ReadIOState.” Then, at time step 2, the behaviors under the state “ReadIOState” of “CPU_0” are executed. These behaviors further activate the state “DUDReadState” of “DUD.” At time step 3, the behaviors of the state “DUDReadState” are executed. Based on the assertions inserted into the evidence pool, we can infer that “RDP.State.t4 == RDP.State.RDPRunningState AND ReadDemand_CommandReturnFlow.OperationData.t4 == DEMAND_VALUE” is True. As a result, the state of the function “PDF” changes to “PDFOperatingState” at time step 4.
Example of function state inference
Flow merging and branching
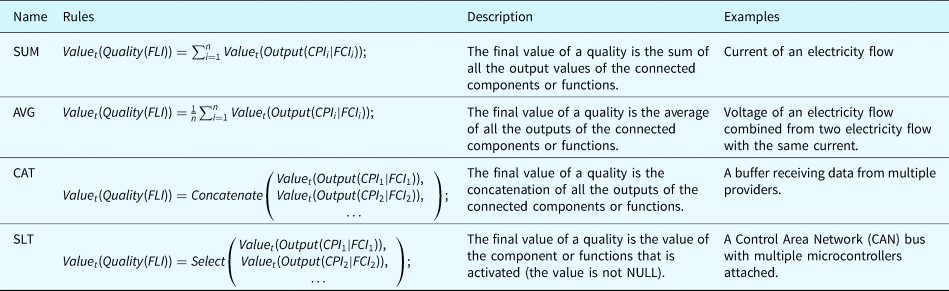
In a system model, multiple individuals of components or functions will possibly connect to the same individual of flow, for example, two data receivers are attached to one data bus. In this case, the final value of the flow's qualities will be impacted by all the connected individuals. How to calculate the final value of the qualities (e.g., a flowrate) depends on the type of such flow and the type of the quality. For example, if the flow is an electricity flow, when calculating the quality “current,” the final value should be the sum of all the output “current” of all the connected individuals. Hence, the rule “Sum” will be applied to the variable “current” of the electricity flow. Table 25 summarizes some general rules of flow merging. The selection of the rules for a specific flow's quality is usually based on physics or other related standards. In Tables 25 and 26, the notation FL represents an individual of flow, the notation CF represents an individual of component or function.
General rules for flow merging
General rules for flow branching

Correspondingly, multiple individuals of components or functions may accept objects from one individual of flow. In this case, the actual input of the connected component or function would be a portion of the flow, such as an electricity flow. Table 26 summarizes general rules for flow branching. The selection of the rules for a specific flow's quality is usually based on physics or other related standards.
Case study
In this section, the correctness and effectiveness of the proposed method are verified by using a water tank control system, a simplified cyber physical system with a computer-based controller and corresponding mechanical devices. In the case study, faults that possibly occur during system design, development, and operation are generated and their impacts on the functionality of the system are analyzed. The experiments attempt to cover all the types of faults that currently exist in the fault ontology. As a result, the proposed framework simulates the propagation and impacts of all the generated faults and generates a table containing the states of the components and functions in the system under analysis. The experiment is designed to verify the correctness of the inference results. Most of the generated faults are injected into an actual implementation of the system, and the experiment will compare the data sampled from the actual system to the inference results. The ratio of errors and the accuracy of time sequences will be used as metrics to compare the results. It should be noted that the fault propagation inference is at the design level, that is, based on design level knowledge, and contrasted with an implementation which in contrast is fully fledged with all low-level implementation details defined.
System introduction
The system under analysis is a computer-controlled feedwater system which is a simplified version of the one that can be found in a nuclear power plant. The structure of the computer system is displayed in Figure 15. The components and flows in the system are grouped into three layers, including a hardware layer, an operating system layer, and a user application layer.
Architecture of the case study system.

To implement the functionality of the case study system, several mechanical system components and their corresponding functions and flows are created. Figure 16 illustrates the mechanical components involved in the SUA.
Mechanical subsystem involved in the case study system.
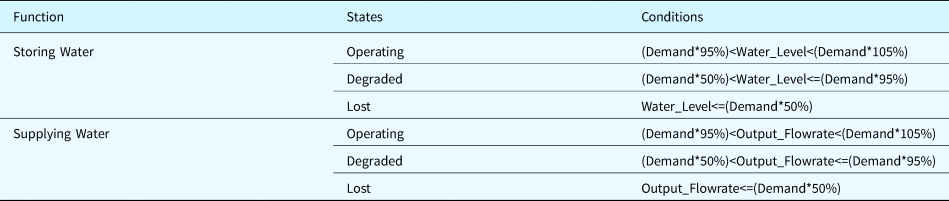
The primary functions of the SUA are summarized in Table 27. They encompass storing water and supplying water. The detailed conditions for identifying the states of each function are also shown.
Functions associated to the case study system
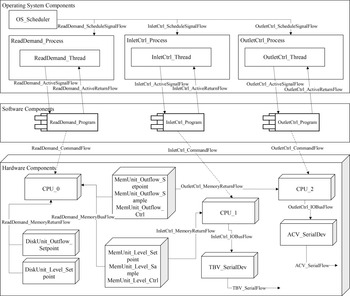
The two major functions are implemented by several software programs. Figure 17 illustrates the relations between these programs. In detail, the program “ReadDemand_Program” first reads the set point of the water level and flowrate from an existing data file. Then, the program “InletCtrl_Program” and “OutletCtrl_Program” will sample the measures provided by the pressure and flow sensors deployed in the physical system and send the samples to the corresponding memory units. The routine “Calculate_Level_Control” implements the control algorithm and calculates the control signal for the level control valve (aka TBV). Concurrently, the routine “Calculate_Outflow_Control” is in charge of calculating the control signal for the outflow control valve (aka ACV). Finally, the outcomes of “Calculate_Level_Control” and “Calculate_Outflow_Control” are used by the routines “Send_Level_Control” and “Send_Outflow_Control,” which send the actual control signals to the corresponding mechanical components through the serial ports. The system will periodically execute the aforementioned control process to maintain the water level and the output flowrate close to their set points.
Activity diagram of the case system.

Model construction and fault injection
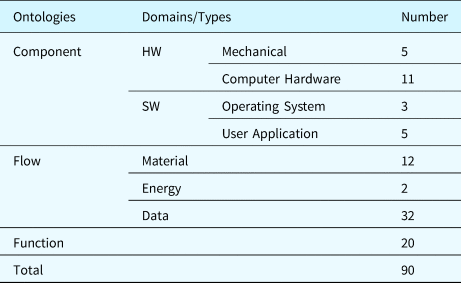
Based on the proposed ontologies, the system model with 90 individuals (i.e., instances of the ontological concepts) is built for the case study system. Table 28 provides the detailed numbers of individuals in the case study system.
Number of individuals in the system model
Various types of faults were injected into the system model, including faults collected from existing research (as shown in Table 29) and the faults generated by the proposed ontological methodology (as shown in Table 30). The faults in Table 30 are grouped by the fault generation principles applied to the system components. In summary, 1467 faults were generated.
Fault classes in the fault ontology (existing faults documented in the literature)
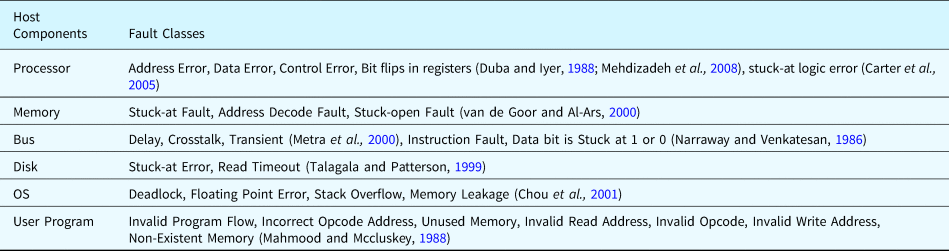
Note: The behaviors of components in bold faults can be covered by the fault generation principle introduced in this paper.
Statistics related to fault generation for the case study system (aka new faults)
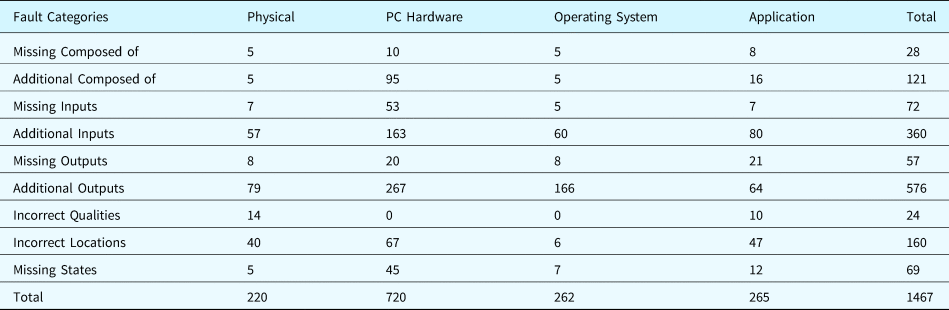
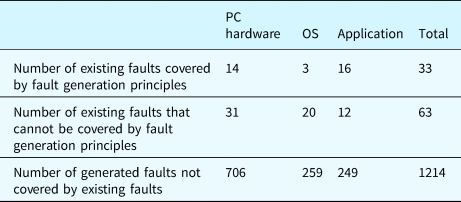
Table 31 calculates the overlap between the individuals of the existing faults and the ones of the generated faults. Since one fault class may have multiple individuals in the case study system, the number of fault individuals is usually greater than the number of fault classes. The table shows that a large number of generated faults are not covered by existing faults described in the literature.
Statistics related to individuals of the existing faults and the generated faults
Analysis results and comparisons
As one example of the results of analysis, Tables 32 and 33 describe the results obtained for the test scenario associated with the fault “Incorrect_Outputs” applied to the disk unit “MemUnit_Outflow_Setpoint” (i.e., the output of the disk unit storing the set point of the flowrate is NOT_A_NUMBER). Components are grouped by domain: “Application,” “OS,” “PC Hardware,” and “Mechanical System.” In this case, an illegal set point value was read from the control file. However, since there is a defect in the “ReadDemand_Program” application such that the validity of the data is not fully verified, the illegal value was consequently sent to the software “InletCtrl_Program” and caused the control algorithm to halt and send out an invalid control signal (NULL). The NULL signal fully closed the valve “ACV” (the default state of the valve) and finally caused a system failure. The failures (the lost state) of components’ and systems’ functions are highlighted in the table.
Component states for the example scenario
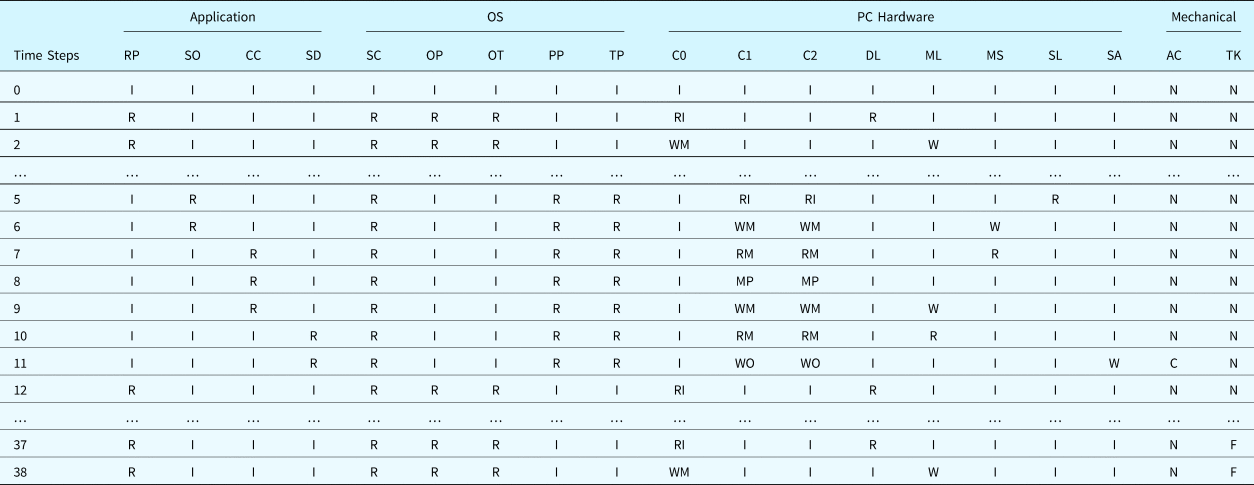
Note: I: Idle State, N: Nominal State, R: Reading/Running State, W: Writing State, RI: ReadIOState, WM: WriteMemState, WO: WriteIOState, RM: ReadMemState, MP: MultiplyMemState, C: Changing State, F: Full State.
Components: C0: CPU_0, C1: CPU_1, C2: CPU_2, DL: DiskUnit_Level_Setpoint, ML: MemUnit_Level_Setpoint, MS: MemUnit_Level_Sample, SL: Outflow_SerialDev, SA: ACV_SerialDev, SC: OS_Scheduler, OP: ReadDemand_Process, OT: ReadDemand_Thread, AC: ACV, TK: Tank, RP: ReadDemand_Program, SO: Sample_Outflow, CC: Calculate_Outflow_Control, SD: Send_Outflow_Control.
Functional states for the example scenario
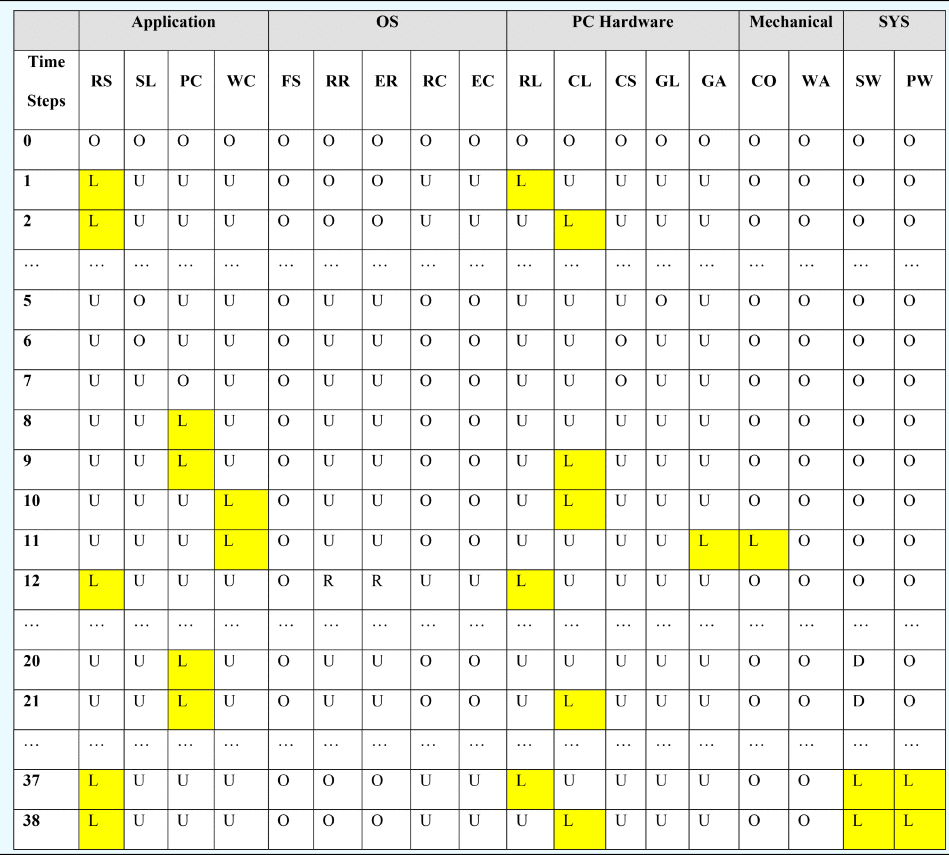
Note: O: Operating State, D: Degraded State, L: Lost State, U: Unknown State.
Functions: RS: read set point, SL: sample level, PC: PID control, WC: write control value, FS: schedule processes, RR: run read set point software, ER: execute read set point software, RC: run control software, EC: execute control software, RL: record level set point, CL: cache level set point, CS: cache level sample, GL: sample level, GA: control ACV, CO: control outlet water flow, WA: store water in tank, PW: provide water, SW: store water.
We used the actual, that is, physical/real world implementation, of the water control system to verify our framework. As an example, we manually modified the set-point file and added illegal data to the disk to mimic the faults in reading the disk during system operation. In the experiment, it is observed that the inflow setpoint is “corrupted” in the control processor at “Calculate_Level_Control” to a zero value at 300 s, shown in Figure 18. Due to the illegal value of the set point of the output flow, the “ACV” was fully closed at 300 s. This is a permanent fault. Then, the closed “ACV” led to a dramatic increase of the water level and hence led to the failure of the system function “Store_Water.” This result is consistent with the prediction of our framework.
Signals sampled from the real system.
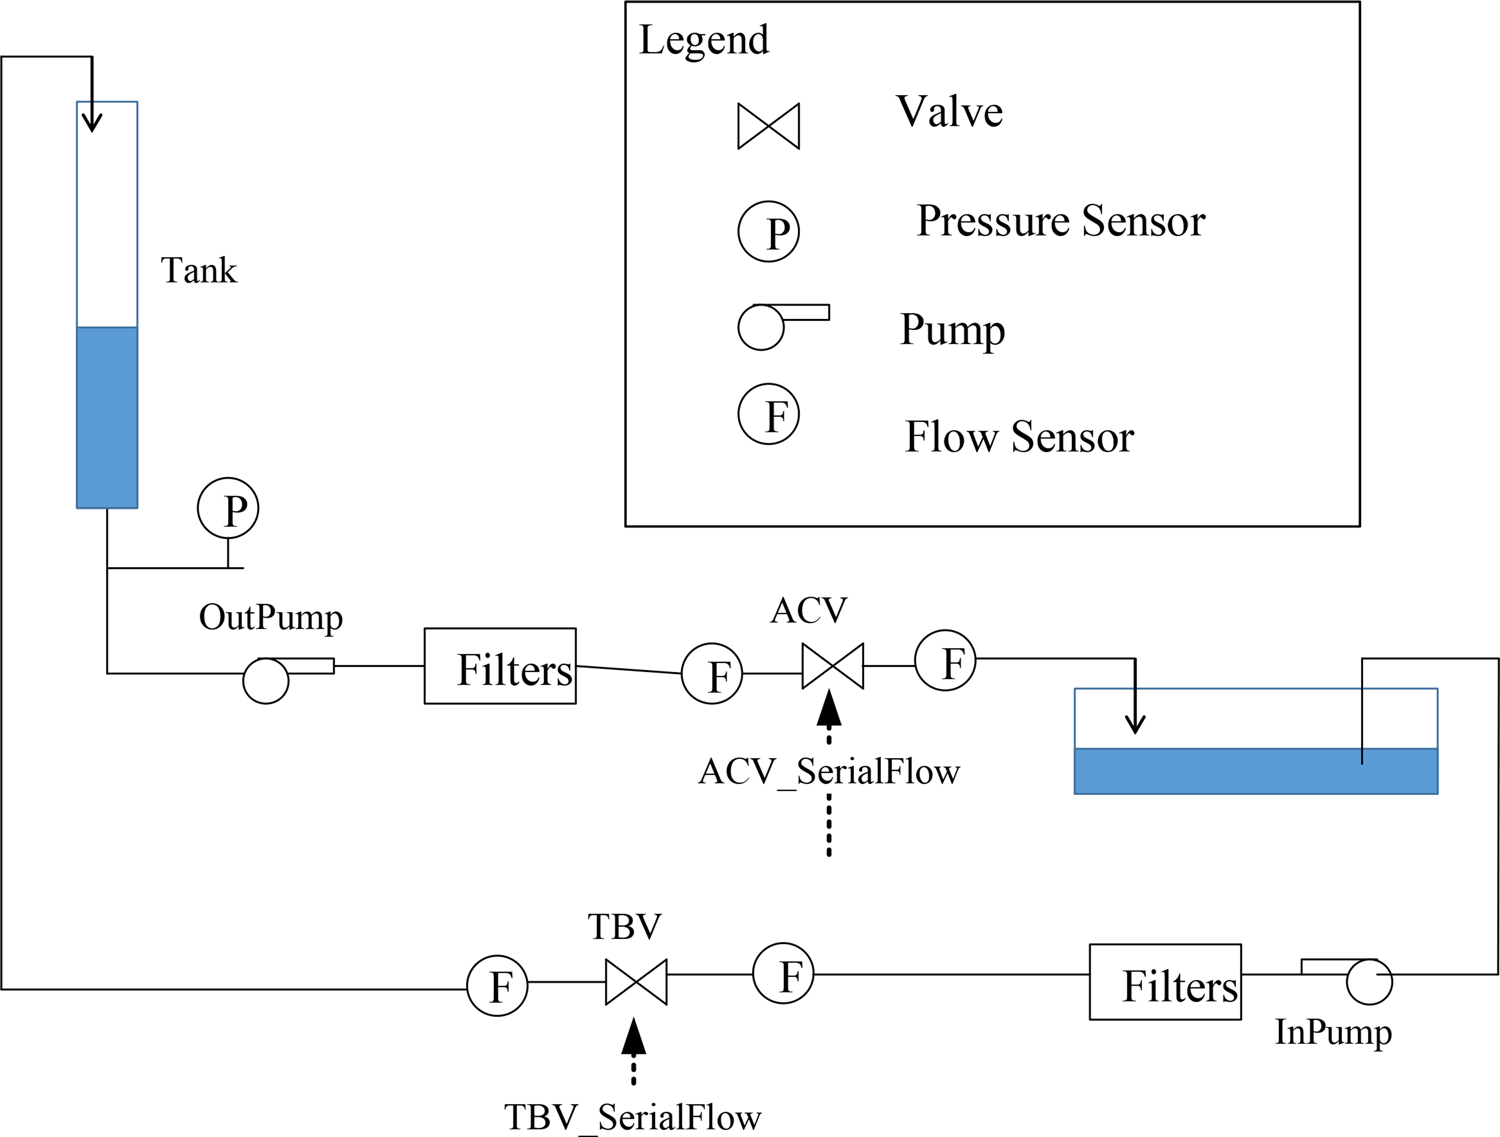
Table 34 provides statistics that allow comparison between fault inference and real system behavior under fault. Because of technical limitations, only a portion of fault types can be applied to the real hardware and software. For example, an extreme high voltage signal may damage the physical equipment (e.g., the pumps and valves). As a result, 450 test scenarios can be faithfully implemented in the real system. The results derived from the proposed framework successfully predict all of 450 real system test scenarios.
Comparison of results between fault inference and real system
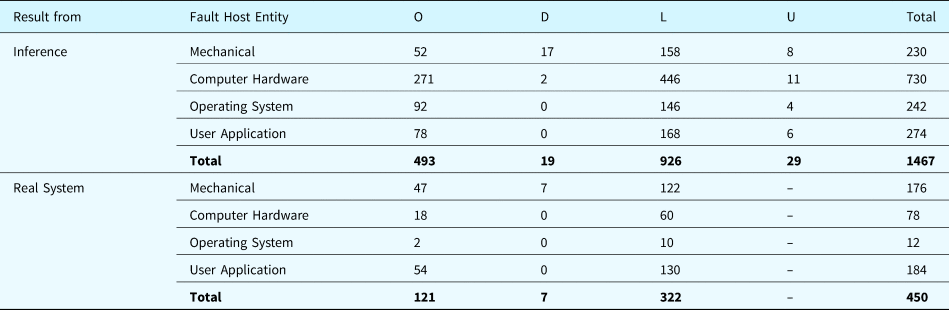
Note: O: Number of Operating Scenarios, D: Number of Degraded Scenarios, L: Number of Lost Scenarios, U: Number of Uncertain Scenarios, Total: Total Number of Scenarios.
After inspection of the results from the fault inference and the real system, we found that all results from the real system agree with the predictions of the fault inference. Since the inference is a qualitative simulation with inference but the results from the real system yield a large data set, inspecting the results consists of the following activities: (1) check the intermediate and final states of functions and components (e.g., failed or not) and (2) check the time order of the important events that occurred during the system operation (e.g., functional failures, state transitions).
Discussion
As shown by the above analysis, faults that can occur in computer systems were simulated and their effects on functional failures were analyzed. The analysis emulates the behavior of every component involved in the fault propagation. The results of this analysis visualize the fault propagation paths and explicitly show the causality between faults and functional failures. These causal relationships are useful for researching fault prediction and can assist in the design of fault tolerance and fault recovery mechanisms.
A case study using the proposed method used a model with 24 components and 46 flows to verify 20 functions and subfunctions of the system at the early design stage. The framework generated 1467 faults based on the ontological concepts. All of the faults were analyzed and 98% of faults’ impacts were clearly predicted (missing were the scenarios with “uncertain” outcomes). The result proves that the proposed method can effectively generate faults and their propagation paths at the design level, which is useful for improving the robustness of the system.
Since the specification of the system was not well defined at the early design stage, uncertainties existed in the system design. The uncertainty could be an unclear type of component, a free flow quality without constraints, or an undefined subfunction parameter. These aspects will probably lead to uncertainties in the final results. For example, without any specification of a component in the feedwater system, the function (supplying water) of the system cannot be inferred because the fault inference engine cannot confirm if the output flowrate of water is within the design range. However, this uncertainty can be reduced when we specify the maximum flowrate of the pipes and valves composing the system. Along with the development process, the concreteness of the system will finally remove the uncertainties in the results once it is built and deployed.
The fault propagation inference takes reasonable time to produce the outcomes, about 5 min to analyze one fault scenario. Theoretically, 1467 scenarios require 122 h, about 5 days. However, we can analyze the scenarios simultaneously since they are independent. By running the inference on a High-Performance Computer (HPC) with 50 cores, calculating the results only requires 2.4 h. The performance of the calculation is significantly improved.
Conclusion
This research provides a novel method (IS-FAON) for analyzing fault propagation and its effects. Starting from the ontologies of components, functions, flows, and faults, this paper constructed a scientific foundation for describing and tracking faults in a computer system across multiple domains throughout design and development. In order to construct the system and fault models, a series of fundamental concepts were introduced in the form of ontologies and their dependencies. An investigation was then performed into the faults, including their type, cause, life cycle aspects, and effect. Principles and rules were created to generate various faults based on system configurations. After the modeling process, a fault inference engine was proposed to execute actions and simulate the process of fault generation and propagation. As a result, fault paths that impact components and functions were obtained.
Gathering fault propagation paths at an early design phase significantly help to predict and improve the reliability and safety of a system. First, the paths provide intuitive evidence for fault detection and diagnosis. Second, fault prevention mechanisms and redundancy policies can be applied to the most frequently traversed nodes in order to efficiently implement fault masking and isolation. Also, the fault propagation paths are helpful for generating test cases for system verification since they provide useful information on triggering faults that are possibly hiding in the system under analysis.
Future work will be focused on how to improve the proposed method. First, the ontologies of components, flows, and functions for computer systems will be enriched. Domain-specific hardware and software components for various engineering domains (e.g., aerospace, nuclear, medical, etc.) and more specific sources of faults (e.g., electromagnetic, vibration) will be considered and added to the repositories. Also, tools for automating model construction will be studied and developed. Due to the sophistication of models specially built for complex systems, these tools should be capable of automatically reading components and flows existing in the target system. In addition, further optimization (e.g., concurrent computation) will be applied to the inference process to accelerate the fault propagation analysis.
Acknowledgments
We would like to thank Yunfei Zhao for reviewing this paper. We would also like to thank Paul Johnson and Alex Scarmuzzi, the undergraduate students who assisted in the investigation of components and behaviors of the computer architecture and operating system.
Financial support
This research was supported by the Air Force Office of Scientific Research (AFOSR) and the Advanced Research Projects Agency-Energy (ARPA-E) from the Department of Energy (DOE).
Conflict of interest
Dr. Fuqun Huang is on the Board of Institute of Interdisciplinary Scientists. The other authors declare none.
Xiaoxu Diao is a post-doctoral researcher working in the Reliability and Risk Laboratory in the Department of Mechanical and Aerospace Engineering, The Ohio State University. He received the MTech and PhD degrees in Software Reliability Engineering from the School of Reliability and System Engineering at Beihang University, Beijing, China, in 2006 and 2015, respectively. He has participated in several research and projects regarding software reliability and testing. His research interests are real-time embedded systems, software testing methods, and safety-critical systems.
Michael Pietrykowski is a PhD candidate in the Nuclear Engineering Program in the Department of Mechanical and Aerospace Engineering at The Ohio State University. He received his BS in Electrical and Computer Engineering from OSU specializing in computers and solid state devices and is an NRC Graduate Fellowship and DOE NEUP Fellowship recipient. His research is focused on investigating digital instrumentation and controls systems in nuclear power plants using hardware-in-the-loop experimental testing, and network effects on distributed control systems.
Fuqun Huang is currently a Principal Scientist and the director of the “Software Engineering & Psychology” Interdisciplinary Research Program at the Institute of Interdisciplinary Scientists. She received her PhD on Systems Engineering from Beihang University in 2013 and was a visiting scholar at Centre for Software Reliability, City University of London in 2011. Dr. Huang was a Postdoctoral Researcher (2014–2016) with The Ohio State University. Dr. Huang research interests include human errors in software engineering, reliability and safety of software systems, and software quality assurance. She is the member of IEEE Standards, Program Committee for the IEEE International Workshop on Software Certification.
Chetan Mutha has a PhD in Mechanical Engineering from The Ohio State University. His research interests include systems and software reliability assessment, integrated system design and analysis, and fault diagnosis early in the design phase, automotive systems, and artificial intelligence. He has several published journal and conference papers. He collaborates with Dr. Smidts and her Risk and Reliability Laboratory located at The Ohio State University. Currently, he is working as a technical consultant in the Patent Law and is employed by Pillsbury Law firm.
Carol Smidts is a Professor in the Department of Mechanical and Aerospace Engineering at The Ohio State University. She graduated with a BS/MS and PhD from the Université Libre de Bruxelles, Belgium, in 1986 and 1991, respectively. She was a Professor at the University of Maryland at College Park in the Reliability Engineering Program from 1994 to 2008. Her research interests are in software reliability, SW safety, SW testing, PRA, and human reliability. She is a senior member of the Institute of Electrical and Electronic Engineers and a member of the editorial board of Software Testing, Verification, and Reliability














 Open access

