


INTRODUCTION
Radiocarbon (14C) ages obtained on contemporaneous terrestrial and marine samples are not directly comparable. On average, Holocene subtropical marine samples are ca. 400 14C years older than contemporaneous terrestrial samples (Stuiver et al. Reference Stuiver, Pearson and Braziunas1986; Bard Reference Bard1988). The difference is caused by marine radiocarbon reservoir effects (MRE) that reflect the different residence time of carbon in marine versus atmospheric reservoirs. While 14C produced in the upper atmosphere is rapidly and relatively evenly incorporated throughout the atmosphere, long residence times for carbon in the deep ocean and uneven mixing of upwelling deep ocean waters cause significant spatial variability in global MRE (Mangerud Reference Mangerud1972). A range of other factors can impact local MRE, including local upwelling along with temperature, wave, wind, and current regimes influencing air-sea gas exchange (Alves et al. Reference Alves, Macario, Ascough and Bronk Ramsey2018). Local differences can be particularly marked in estuaries and lagoons where local geology, terrestrial freshwater inputs, and incomplete exchange with the open ocean can accentuate MRE (Little Reference Little1993; Ulm Reference Ulm2002; Ulm et al. Reference Ulm, Petchey and Ross2009; Petchey et al. Reference Petchey, Dabell, Clark and Parton2023).
Successive marine calibration curves (Marine04, Marine09, Marine13, Marine20) have modeled global-scale surface ocean 14C activity (Hughen et al. Reference Hughen, Baillie, Bard, Beck, Bertrand, Blackwell, Buck, Burr, Cutler and Damon2004; Reimer et al. Reference Reimer, Baillie, Bard, Bayliss, Beck, Blackwell, Bronk Ramsey, Buck, Burr and Edwards2009, Reference Reimer, Bard, Bayliss, Beck, Blackwell, Bronk Ramsey, Buck, Cheng, Edwards and Friedrich2013; Heaton et al. Reference Heaton, Köhler, Butzin, Bard, Reimer, Austin, Bronk Ramsey, Grootes, Hughen and Kromer2020). The difference between local and modeled global-scale surface ocean ages is expressed as ΔR (Stuiver et al. Reference Stuiver, Pearson and Braziunas1986). Negative ΔR values reflect lower MRE for the studied region compared with the global marine model and vice versa. Local ΔR values can be determined from a variety of approaches (the most common include 14C dating known-age marine samples; 14C dating paired contemporaneous marine/terrestrial samples; and paired 14C/U-series dating of corals) (Stuiver and Braziunas Reference Stuiver and Braziunas1993; Hua et al. Reference Hua, Ulm, Yu, Clark, Nothdurft, Leonard, Pandolfi, Jacobsen and Zhao2020). To avoid ambiguity, here we use the term ΔR when discussing local correction values in general and ΔRXX when denoting offsets to a specific calibration curve (i.e., ΔR20 when referring to a ΔR value derived from and for use with the Marine20 marine calibration curve) (see Heaton et al. Reference Heaton, Bard, Bronk Ramsey, Butzin, Hatté, Hughen, Köhler and Reimer2023). ΔR and ΔR variability are usually small in areas where surface waters are well-mixed (e.g., east coast of Australia) but can be large and highly variable in areas with strong upwelling of deep waters with long residence times (e.g., Southern California, Antarctica) (e.g., Culleton et al. Reference Culleton, Kennett, Ingram, Erlandson and Southon2006; Hall et al. Reference Hall, Henderson, Baroni and Kellogg2010).
To date, relatively few MRE studies have been undertaken in Australia compared with other areas of the globe (see Reimer and Reimer’s Reference Reimer and Reimer2001 14CHRONO Centre Marine Reservoir Correction Database, http://calib.org/marine/). This is at least partly attributable to the enduring impact of Gillespie’s (Reference Gillespie1975, Reference Gillespie1977; Gillespie and Temple Reference Gillespie and Temple1977; Gillespie and Polach Reference Gillespie, Polach, Berger and Suess1979) pioneering studies that demonstrated relatively little variability in MRE based on the dating of six marine shell specimens from four locations around the Australian coastline. Subsequent studies proposed only minor deviations based on local studies that largely supported the values proposed by Gillespie (e.g., Rhodes et al. Reference Rhodes, Polach, Thom and Wilson1980; Bowman and Harvey Reference Bowman and Harvey1983; Gill Reference Gill and Hopley1983; Head et al. Reference Head, Jones and Allen1983; Bowman Reference Bowman1985a, Reference Bowman1985b). For decades it was a common practice in Australia to adjust 14C ages on marine samples for MRE by simply subtracting 450 or 450 ± 35 14C years to make them comparable to coeval terrestrial samples. These ages were often reported as “corrected shell dates” (e.g., Godfrey Reference Godfrey1989; O’Connor Reference O’Connor1989; Bird and Frankel Reference Bird and Frankel1991; Sim Reference Sim1998). Conventional radiocarbon ages (cf. Stuiver and Polach Reference Stuiver and Polach1977) were often not listed, making the use of the published marine shell 14C ages and their calibration problematic. Despite several studies suggesting variability in MRE (e.g., Hughes and Djohadze Reference Hughes and Djohadze1980; Woodroffe et al. Reference Woodroffe, Chappell, Thom and Wallensky1986; Woodroffe and Mulrennan Reference Woodroffe and Mulrennan1993; Murray-Wallace Reference Murray-Wallace1996; Spennemann and Head Reference Spennemann and Head1996; Ulm Reference Ulm2002; Ulm et al. Reference Ulm, Petchey and Ross2009), no systematic study of Australian MRE has been undertaken (cf. Ulm Reference Ulm2006).
Studies in Australian coastal archaeology and geomorphology are highly dependent on 14C ages obtained on marine samples, particularly mollusks. Mollusk remains are the dominant component of many coastal deposits, often with limited or no representation of other material (e.g., charcoal) suitable for radiocarbon dating. Mollusks may be preferred for dating owing to their relatively short lifespan and often larger surface area, limiting movement in deposits. In contrast, charcoal samples (where available) may have potentially large in-built ages (e.g., “old-wood effect” for charcoal, see Schiffer Reference Schiffer1986), and even “short-lived” plant materials might have inbuilt age of 50–150 years (Anderson Reference Anderson1991; Allen and Wallace Reference Allen and Wallace2007). Individual small charcoal pieces can also move more readily across the matrix, distorting local chronologies.
Mollusks are represented in archaeological deposits in Australia dating from at least 42,000 cal BP (Veth et al. Reference Veth, Ward, Manne, Ulm, Ditchfield, Dortch, Hook, Petchey, Hogg and Questiaux2017), making marine mollusk samples central to the chronology-building that underpins our understanding of the human history of the continent. The SahulArch dataset (Saktura et al. Reference Saktura, Rehn, Linnenlucke, Munack, Wood, Petchey, Codilean, Jacobs, Cohen, Williams and Ulm2023) hosted on the Octopus database (Codilean et al. Reference Codilean, Munack, Saktura, Cohen, Jacobs, Ulm, Hesse, Heyman, Peters, Williams, Saktura, Rui, Chishiro-Dennelly and Panta2022) indicates that more than 23% of ages from archaeological deposits across the continent are on marine mollusk samples (26.4% of ages from Holocene archaeological deposits). Determining ΔR values and developing an understanding of ΔR variability through space and time is therefore crucial to refining chronologies in Quaternary science.
This study specifically examines spatial variability in ΔR around the Australian coastline measured in mollusks live-collected between AD 1841 and AD 1956. By providing a large-scale assessment of ΔR values and variability across the continent, this study improves the calibration of radiocarbon ages based on marine materials, which is essential for assessing the antiquity of, and changes in, Aboriginal and Torres Strait Islander social practices, cultures, and technologies through the archaeological record and the impacts of coastal change on human populations (e.g., Williams et al. Reference Williams, Ulm, Sapienza, Lewis and Turney2018). Results also have implications for geomorphology, providing new information on modeling rates and impacts of sea-level change (e.g., Sloss et al. Reference Sloss, Nothdurft, Hua, O’Connor, Moss, Rosendahl, Petherick, Nanson, Mackenzie, Sternes, Jacobsen and Ulm2018), coral reef development and evolution of reef islands (e.g., Chivas et al. Reference Chivas, Chappell, Polach, Pillans and Flood1986; Woodroffe et al. Reference Woodroffe, Samosorn, Hua and Hart2007), as well as the evolution of the Australian coastline and the impact of environmental change on coastal landscapes. The results and their application have important implications for coastal management and conservation efforts, as understanding the history of coastal environments is crucial for making informed decisions about their protection and management.
METHODS
Synthesis of Previous Studies
A systematic review was undertaken of all previously published ΔR values available from live-collected mollusks around the Australian coast using the 14CHRONO Centre Marine Reservoir Correction Database (Reimer and Reimer Reference Reimer and Reimer2001) as well as an extensive literature search to achieve comprehensive data collection (Tables S1–2). This review is restricted to mollusks, which are the most commonly 14C-dated materials in Australian coastal archaeological and geomorphological studies. There are a small number of studies of recent marine radiocarbon reservoir effects based on coral records that are not included here (Druffel and Griffin Reference Druffel and Griffin1993, Reference Druffel and Griffin1999; Squire et al. Reference Squire, Joannes-Boyau, Scheffers, Nothdurft, Hua, Collins, Scheffers and Zhao2013; Hua et al. Reference Hua, Webb, Zhao, Nothdurft, Lybolt, Price and Opdyke2015; Komugabe-Dixson et al. Reference Komugabe-Dixson, Fallon, Eggins and Thresher2016; Wu et al. Reference Wu, Fallon, Cantin and Lough2021). However, a comparison between the ΔR values based on mollusks reported here and those based on these corals within the time frame of our study is presented in Results and Discussion below.
A total of 59 ΔR values obtained on live-collected mollusks have been published prior to the current study (Table S2; Figure 1). Full details are presented in Table S1. Laboratory reports were checked, where available, and original primary publications were accessed to confirm details for legacy ages.
Map of Australia showing locations of ΔR samples discussed in this study. Black dots represent ΔR values reported in previous studies. Red dots represent new values reported in this study. (See online version for color figures. See Tables S1–3 for full details and Figures S1–18 for full-size figures.)

Identification of Samples in Museum Collections
To expand the geographical coverage of live-collected mollusk samples, all major Australian museum malacology collections were systematically evaluated for appropriate samples, including the Australian Museum, Queensland Museum, Western Australian Museum, South Australian Museum and Museums Victoria.
Evaluation of museum collections commenced with a review of mollusks identified on museum databases as live-collected in or before AD 1950. These specimens were then located in collections and visually inspected for suitability against the sample selection criteria (see below). Many of these specimens were rejected at this stage, typically because no physical or documentary evidence clearly demonstrated live-collection. Often accession or donation dates were recorded on museum databases rather than live-collection dates. Another limitation of relying on museum database searches to identify samples stems from the large proportion of materials held in museum malacology collections that are not accessioned. Furthermore, much of the critical information recorded in documentary material accompanying specimens or on hand-written museum accession registers has not been migrated to online databases.
The second stage involved a systematic visual examination of all holdings and associated documentation of taxa (especially bivalves) targeting taxa commonly selected in radiocarbon dating of archaeological deposits. Williams et al. (Reference Williams, Ulm, Smith and Reid2014) report that Anadara spp./Tegillarca spp., Ostrea spp./Saccostrea spp. and Latona spp. (syn. Donax spp., Plebidonax sp.) are the dominant marine bivalves dated in Australian archaeology. Where no suitable target taxa were identified, the evaluation was broadened to include taxa well-represented in museum collections guided by curatorial and collection management staff.
Selection Criteria
Expanding and refining the criteria outlined in O’Connor et al. (Reference O’Connor, Ulm, Fallon, Barham and Loch2010), rigorous sample protocols were developed and implemented for use in this study. Samples had to meet all these conditions to be included in subsequent analyses. The test for inclusion was applied sequentially down the list 1–9 below (i.e., a sample might be excluded on the basis of multiple criteria, but was listed as excluded on the basis of its highest-ranked criterion for exclusion).
1. Phylum: Mollusca. Class: Bivalvia: Samples must be bivalves. Mollusks are the most dated marine materials in archaeology and Quaternary studies in Australia (Williams et al. Reference Williams, Ulm, Smith and Reid2014; Saktura et al. Reference Saktura, Rehn, Linnenlucke, Munack, Wood, Petchey, Codilean, Jacobs, Cohen, Williams and Ulm2023). This study excludes values based on gastropods and non-molluscan marine exoskeletal material (e.g., coral). Gastropods have been shown to be more problematic for MRE studies as their detrital, carnivorous, herbivorous, algal grazing and/or omnivorous feeding systems provide pathways for the incorporation of non-dissolved inorganic carbon (non-DIC) sources into mollusk shell structures (Tanaka et al. Reference Tanaka, Monaghan and Rye1986). 14C activity in suspension-feeding (or filter-feeding) bivalves should reflect dissolved inorganic carbon (DIC) of the ambient waters in which they lived (Petchey et al. Reference Petchey, Ulm, David, McNiven, Asmussen, Tomkins, Dolby, Aplin, Richards, Rowe, Leavesley and Mandui2013).
2. Live-Collected: Samples must have been collected as live specimens. Many specimens in museum dry collections exhibit bleaching, edge-rounding, marine growth on inside surfaces and/or bore holes indicating a time-lag between death and collection. Only specimens with definitive evidence of live-collection, such as unambiguous documentation, the retention of the desiccated animal or the presence of residual ligament, muscle and/or periosteum were accepted for this study.
3. Live-Collected ≤AD 1950: Samples must have collection dates before or in AD 1950. Atmospheric nuclear weapon testing resulted in enriched atmospheric and oceanic 14C levels after this time. This ‘bomb effect’ has been detected in coral cores from the Pacific Ocean and Indonesian Throughflow from c.AD 1954 (e.g., Andrews et al. Reference Andrews, Asami, Iryu, Kobayashi and Camacho2016; Wu and Fallon Reference Wu and Fallon2020). Ascough et al. (Reference Ascough, Cook and Dugmore2005) recommend use of samples live-collected before AD 1890 to avoid the combined effects of atmospheric nuclear weapon tests and the Suess effect caused mainly by industrial-scale burning of fossil fuels. Unfortunately, very few live-collected specimens in Australian museum collections (and only five samples in this study) pre-date AD 1890. Although this is an important consideration for the calculation of the marine reservoir age, ΔR values are calculated from the offset with the marine calibration curve which is modeled with atmospheric 14C as input thereby including the Suess effect (Heaton et al. Reference Heaton, Köhler, Butzin, Bard, Reimer, Austin, Bronk Ramsey, Grootes, Hughen and Kromer2020).
4. Collection Date Known to Within ≤1 Year: Samples must have specified collection dates that confine their collection to a single calendar year. Many of the amateur mollusk collectors who donated to museums collected over decades and often collections were acquired by the museums many years subsequent to their collection (e.g., after the death of the collector). In some cases, the date of specimen collection can only be confidently bracketed by the active collecting years of a particular collector. For example, Bowman (Reference Bowman1985a) used samples from the Bernard Bardwell Collection whose collection dates could only be determined to be between AD 1902 and AD 1950 using biographical information.
Only specimens with a firm collection date or where collection can be constrained within a single year were accepted for this study. Although the time resolution of Marine20 is 10 years (Heaton et al. Reference Heaton, Köhler, Butzin, Bard, Reimer, Austin, Bronk Ramsey, Grootes, Hughen and Kromer2020), this criterion is designed to identify samples with ambiguous collection dates. Individual museum lots of mollusks collected over a period of more than a year have an elevated risk of containing mixed samples from different years and different locations. This criterion is designed to remove those samples.
Even where the year of collection appears unambiguous, sources of error can occur. For example, samples Wk-43560, Wk-43561, and Wk-43562 were dated on the basis that documentation accompanying the samples indicated a collection year of AD 1950. The specimens all conjoin and exhibit ligament and color suggesting live-collection. Subsequent radiocarbon dating revealed that the mollusks lived post-AD 1960s, after 14C derived from atmospheric nuclear bomb tests entered the oceans (F14C values of 1.055, 1.023, and 0.989, respectively) (Reimer et al. Reference Reimer, Brown and Reimer2004). Subsequent examination of museum records and other sources (Wilson and Stevenson Reference Wilson and Stevenson1977:98) indicated that nearly all specimens from the Broome area sourced from Anthony Kalnins were collected in the mid-to-late AD 1960s, indicating likely mislabelling of the year of collection and/or mixing of specimens in the lot.
5. Known Collection Location: Samples must have reliable provenance data (i.e., geographic location). There are many complexities that affect samples at the local level, such as upwelling, tidal flushing, terrestrial runoff effects from freshwater input, and local geology (Dye Reference Dye1994; Stuiver and Braziunas Reference Stuiver and Braziunas1993; Ulm Reference Ulm2002; Ulm et al. Reference Ulm, Petchey and Ross2009). As some species have wide tolerance levels, detailed collection provenance is essential.
6. Species Identified: Samples must be reliably identified to species. Different species, even those belonging to the same family, may exhibit differences in diets and relationships with the carbon cycle, contributing to variability in ΔR values (see Criterion #1 above) (Petchey et al. Reference Petchey, Ulm, David, McNiven, Asmussen, Tomkins, Richards, Rowe, Leavesley, Mandui and Stanisic2012, Reference Petchey, Ulm, David, McNiven, Asmussen, Tomkins, Dolby, Aplin, Richards, Rowe, Leavesley and Mandui2013). Only samples identified to species are included in this study.
7. Suspension-Feeder: Samples must be suspension-feeding species. ΔR values will vary as a result of species-specific feeding habits (i.e., carnivores, deposit feeders, algal grazers, omnivores or suspension feeders). Carnivores (e.g., Syrinx aruanus, Melo amphora), deposit feeders (e.g., Terebralia spp., Telescopium spp.) and algal grazers (e.g., Rochia spp.) are likely to have a greater uptake of carbon from the other animals, sediments and geology they feed upon (Tanaka et al. Reference Tanaka, Monaghan and Rye1986; Hogg et al. Reference Hogg, Higham and Dahm1998; Petchey et al. Reference Petchey, Ulm, David, McNiven, Asmussen, Tomkins, Richards, Rowe, Leavesley, Mandui and Stanisic2012, Reference Petchey, Ulm, David, McNiven, Asmussen, Tomkins, Dolby, Aplin, Richards, Rowe, Leavesley and Mandui2013). Some grazers with magnetite-toughened teeth remove and ingest the surface of the rock with the algae, potentially exacerbating this problem. Although most bivalves are suspension-feeders, several families including Cyrenidae and Tellinidae appear to be able to switch to other feeding pathways (Snelgrove and Butman Reference Snelgrove and Butman1994:151; Beesley et al. Reference Beesley, Ross and Wells1998:342; Twaddle et al. Reference Twaddle, Wurster, Bird and Ulm2017). These taxa are excluded from the analyses presented here.
8. Ages from Same Lot, Pair or Valve have 14 C ages that are Statistically Indistinguishable: Ages from samples assumed to be collected from the same location and same time, but not returning similar ages, are excluded. Dissimilar ages from the same lot (i.e., ages on multiple individuals) suggest confounding problems, for example, mixed mollusks in the lots (see Criterion #4 above), pointing to possible mixing of specimens within the lot, potentially from different times and locations. Dissimilar ages from the same pair (i.e., ages on both valves of a single bivalve) could indicate laboratory errors, contamination, or sampling of different years of growth. Where individual specimens of the same taxa from the same lot have more than one radiocarbon determination (e.g., both valves of a bivalve, or multiple valves sampled from the same lot), ages were subject to a chi-squared test to test if they are coeval following the procedures outlined in Ward and Wilson (Reference Ward and Wilson1978). Specimens with ages that failed the chi-squared test were excluded. For specimens and lots with two or more 14C ages, a chi-squared test was undertaken to determine whether the ages were statistically indistinguishable. For lots, pairs or valves with only two ages that failed the test, all ages were excluded from further analysis as it was not possible to determine which age accurately reflected the true age of death of the specimen. For specimens with three or more ages, the T statistic was used to identify non-contemporaneous age/s and exclude the affected samples from subsequent analyses (Ward and Wilson Reference Ward and Wilson1978). Details are presented in Table S1.
9. Only a Single Mollusk Dated: Samples are only included where a single mollusk is dated, avoiding samples comprising multiple individual mollusks with different life histories. Some studies using conventional radiocarbon dating methods (e.g., liquid scintillation counting) combined multiple mollusks, sometimes from different taxa, to reach minimum sample sizes (e.g., Bowman Reference Bowman1985a).
Physical Collection of Samples
After photographing each specimen, an 8–10 mm-long and ∼4–5 mm-wide sample was taken parallel to the margin of each shell using a Dremel® 3000 Rotary Tool fitted with a diamond wheel. This sample size is designed to achieve adequate quantities for 14C, 18O, and 13C analyses, minimise damage to samples, avoid seasonal variation and give an average value approximating the 14C age of death of the mollusk (Culleton et al. Reference Culleton, Kennett, Ingram, Erlandson and Southon2006; Petchey et al. Reference Petchey, Atholl, Zondervan, Ulm and Hogg2008).
Radiocarbon Dating
Accelerator mass spectrometry (AMS) 14C age determinations were undertaken at the University of Waikato Radiocarbon Dating Laboratory and the Australian Nuclear Science and Technology Organisation (ANSTO).
Waikato samples were pre-treated following standard AMS protocols (UCI KCCAMS Facility 2011a, 2011b). Shell (<3 mm fragments, 35–45 mg) were etched in 0.1M HCl at 80ºC to remove ∼45% of the surface, then dried. Cleaned shells were then tested for recrystallization by Feigl staining (Friedman Reference Friedman1959) to ensure either aragonite, or a natural aragonite/calcite distribution was present in the shell. CO2 was collected from shells by reaction with 85% H3PO4 under vacuum at 70ºC for 30 min. Cryogenically separated CO2 was reduced to graphite with H2 at 550°C using an iron catalyst. δ13C was measured on a LGR Isotope analyser CCIA-46EP. Pressed graphite was analysed at the Keck Radiocarbon Dating Laboratory, University of California on a NEC 0.5MV 1.5SDH-2 AMS system (Beverly et al. Reference Beverly, Beaumont, Tauz, Ormsby, von Reden, Santos and Southon2010).
At ANSTO, after visual inspection for the presence of any powdery, potentially extraneous calcite deposition, shell surfaces were physically cleaned by abrasion with a Dremel® rotary tool. 20–100 mg of shell was cut from the shell and the surface etched using 0.5M HCl for 3–5 min under sonication at room temperature, removing ∼10–50% of the surface (Hua et al. Reference Hua, Jacobsen, Zoppi, Lawson, Williams, Smith and McGann2001). The Feigl staining test (Friedman Reference Friedman1959) was undertaken on cleaned aragonite shells (OZM111–OZM116) to confirm removal of calcite. Hydrolysis was performed with 85% H3PO4 at 60ºC overnight and the resulting CO2 was collected and purified cryogenically. The purified CO2 was reduced to graphite using H2 over an Fe catalyst at 600ºC (Hua et al. Reference Hua, Jacobsen, Zoppi, Lawson, Williams, Smith and McGann2001) and measured for 14C on the STAR 2MV HVEE Tandetron (AMS) at ANSTO (Fink et al. Reference Fink, Hotchkis, Hua, Jacobsen, Smith, Zoppi, Child, Mifsud, van der Gaast, Williams and Williams2004). 14C measurements were normalised to NBS Oxalic Acid I (HOxI) as primary standard and corrected for process blanks using IAEA C-1 marble (Rozanski Reference Rozanski1991) and δ13C isotopic fractionation which was determined on residual graphite targets using an elemental analyser Elementar vario MICRO cube coupled to a Micromass Isoprime IRMS.
The removal of 10–50% of the sample surface by physical cleaning and/or acid etch removed any surficial contaminants. 14C ages are reported without rounding, following the recommendations of Russell et al. (Reference Russell, Cook, Ascough, Scott and Dugmore2011). F14C is calculated according to Reimer et al. (Reference Reimer, Brown and Reimer2004).
Calculation of ΔR
ΔR20 was calculated using Reimer and Reimer’s (Reference Reimer and Reimer2017) online deltar program (http://calib.org/deltar/), where the collection year of each shell sample (i.e., year of death) was converted to an equivalent global marine modeled 14C age using the Marine20 calibration dataset and then this age was subtracted from the mean of the measured 14C age of the sample. Uncertainty of each ΔR value is the uncertainty of the sample 14C measurement, without including the uncertainty associated with the equivalent marine modeled 14C age. This practice aims to avoid the inclusion of this uncertainty twice in the final calibrated ages (first in the determination of ΔR and second during age calibration using Marine20 and the estimated ΔR value). Reimer and Reimer’s (Reference Reimer and Reimer2017) online deltar calculation tool only returns values on calendar ages up to AD 1949. For samples collected ≥AD 1950, an equivalent global marine modeled 14C age was derived from the Marine20 calibration curve data and subtracted from the measured 14C age. Note that any updates of the marine calibration curve beyond Marine20 (Heaton et al. Reference Heaton, Köhler, Butzin, Bard, Reimer, Austin, Bronk Ramsey, Grootes, Hughen and Kromer2020) would require recalculation of the ΔR values presented here using the primary data presented in Table S1.
Stable Isotope Analyses
δ13C and δ18O values were measured on solid shell samples or CO2 gas prepared on AMS vacuum lines using a CO2 isotope analyser (CRDS) (Los Gatos Research model CCIA-46). Phosphoric acid (102%) was added to each ground shell sample (0.42–0.5 mg) to evolve CO2. Samples were heated (72ºC, ≥1 hr) to promote hydrolysis before analysis of the δ18O and δ13C values. International Atomic Energy Agency (IAEA) standards NBS-18 (calcite) and NBS-19 (limestone) were used to construct a two-point isotope calibration curve (δ13C = –5.014‰, δ18O = –23.2‰ and δ13C = 1.95‰, δ18O = –2.20‰ respectively) and further evaluated using BDH (δ13C = –24.95‰, δ18O = –13.99‰) and Sigma (δ13C = –14.18‰, δ18O = –20.07‰) synthetic CaCO3 standards (Beinlich et al. Reference Beinlich, Barker, Dipple, Gupta and Baer2017). A drift correction was made after every two samples using 1500 ppm CO2 reference gas. δ13C and δ18O values are reported as ‰ V-PDB. Routine precision of 0.3‰ or better is typical, as determined using sample reproducibility of duplicate measurements.
Modeling ΔR Variability around the Australian Coast
To model spatial variability of ΔR values around the coast of Australia, 182 records of ΔR measurements that met the inclusion criteria were processed. Kriging, a Gaussian process regression, was used to interpolate ΔR20 values around the Australian coast at unsampled locations, using Python tools from the SciKit GStat package (Mälicke et al. Reference Mälicke, Möller, Schneider and Müller2021). Different models were fit against the variogram data, with the spherical variogram returning the lowest error chosen (Figure S19). A semi-variogram was produced plotting the semi-variance against lag for the point pairs in the data set. The spherical model was applied to the kriging function and kriging was performed for all pixels with a size of 10 km within a rectangular region bounding the Australian mainland and Tasmania. The Australian Equal Albers projection EPSG:3577 was adopted to minimise distortion. Results were masked to a 300 km border around the coast. The outputs resulted in two raster images, one representing the kriged ΔR values, and the other the Error Variance, of which the square root represents the standard error of the interpolation process. To account for both the standard errors of the original ΔR measurements, and those of the interpolation process, a further interpolation of measurement standard errors was performed, creating a measurement standard error surface. The two error surfaces were combined by taking the square root of the sum of their squares to produce an overall standard error surface.
RESULTS AND DISCUSSION
The 292 samples in this study, including 59 previously published values, were live-collected between AD 1841 and AD 1956 (a single legacy sample collected in AD 1956 from Key Island, Tasmania, by Gill Reference Gill and Hopley1983, is the only sample in the dataset post-dating AD 1950). The samples derive from 114 unique locations around the Australian coastline, spanning from Mer (Murray Island) in the north (10ºS) to Hobart (lutruwita) in the south (43ºS), and from Shark Bay (Gutharraguda) in the west (113°E) to North Stradbroke Island (Minjerribah) in the east (153°E) (Tables S1–3; Figure 1). Full details are presented in Table S1 and all data points are plotted by laboratory number in Figures S1–9. Specimens from the Veneridae and Arcidae families comprise almost half (47%, n=136) of the dataset (Table 1).
Mollusk families represented in the dataset.

Primary reason samples were excluded from analysis, following the inclusion criteria hierarchy.

In total, 110 samples did not meet the selection criteria and were excluded from the analysis (Table 2). Fifty-nine percent of ΔR values obtained prior to this study were excluded. Most values in the full dataset (see Table S1) were excluded as they were not bivalves (n=52; Criterion #1); because 14C ages from shells in the same lot failed the chi-squared test (n=21; Criterion #8); or because the period of collection could not be confidently limited to ≤1 year (n=20; Criterion #4). Smaller numbers of samples were rejected where determined F14C values showed that mollusks were live-collected after AD 1950 (n=7; Criterion #3), where samples were not live-collected or where there was uncertainty about live-collection status (n=5; Criterion #2), where the sample was a bivalve but not a suspension feeder (n=3; Criterion #7), where the collection location was unknown or where there was uncertainty about the collection location (n=1; Criterion #5), and where the mollusk species was not identified or where there was uncertainty over species identification (n=1; Criterion #6).
Statistically different ages derived from shells in the same museum lot may have several possible explanations. Culleton et al. (Reference Culleton, Kennett, Ingram, Erlandson and Southon2006) and Jones et al. (Reference Jones, Hodgins, Dettman, Andrus, Nelson and Etayo-Cadavid2007) have documented significant intrashell 14C variability. These impacts are usually associated with areas of near-shore upwelling. However, other short-term impacts may influence 14C in individual growth bands, such as heightened storm activity resulting in higher rates of mixing of atmospheric carbon into marine waters (Goodfriend and Flessa Reference Goodfriend and Flessa1997). This could be a particular problem for older legacy marine reservoir values obtained on whole mollusk valves, potentially averaging different 14C abundances across the growth of the mollusk. The precise provenance of samples could also explain some variability/unexpected values. The level of museum documentation available for most specimens was not specific enough to determine whether collection occurred from enclosed or semi-enclosed water bodies (e.g., estuary or bay versus adjacent open coasts). Specimens living in enclosed water bodies with incomplete exchange with the open ocean could return ΔR values at variance with adjacent well-mixed surface ocean values (e.g., Ulm Reference Ulm2002).
The remaining 182 accepted ΔR20 values range from 68 ± 24 14C years at Port Hedland (Marapikurrinya) in Western Australia to –337 ± 46 14C years at Mornington Island (Gununa) in the southern Gulf of Carpentaria in Queensland (see ΔR20 Atlas in Figures S10–18). Most sets of local values are internally consistent, reflecting the dominant influence of regional oceanography. Most Australian coasts are adjacent to broad and shallow areas of the continental shelf (<75 m deep), with only a few localities like Cape Range in Western Australia <10 km from the edge of the crustal continental shelf.
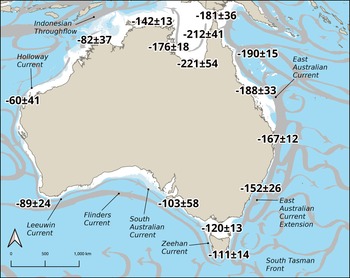
Mean ΔR values for major regions in Australia are shown in Figure 2 and Table S4. There are three areas where published coral 14C data are available in the current study time frame (AD 1841–1950) including southeast Queensland, Bass Strait, and southeast Tasmania. For the first region, a mean ΔR value of –166 ± 27 14C years (see Table S5) was derived from 116 coral data points from Heron Island and Abraham Reef (Druffel and Griffin Reference Druffel and Griffin1993, Reference Druffel and Griffin1999), Masthead Island (Wu et al. Reference Wu, Fallon, Cantin and Lough2021) and Heron Reef (Hua et al. Reference Hua, Webb, Zhao, Nothdurft, Lybolt, Price and Opdyke2015). This value agrees well with our mean ΔR value of –167 ± 12 14C years for this region (Figure 2). The mean ΔR value for the Bass Strait based on U-Th dated deep-sea corals (n=9 from AD 1865–1946; Komugabe-Dixson et al. Reference Komugabe-Dixson, Fallon, Eggins and Thresher2016) of –128 ± 33 14C years (see Table S6) also agrees well with our value for this area of –120 ± 13 14C years (Figure 2). For southeast Tasmania, there is a coral datum for North Sister at AD 1856 indicating a ΔR value of –117 ± 41 14C years (Komugabe-Dixson et al. Reference Komugabe-Dixson, Fallon, Eggins and Thresher2016; see Table S6), which overlaps with our value for this region of –111 ± 14 14C years within 1σ uncertainties (Figure 2). The strong concordance between our shell-based and published coral-derived ΔR values gives us confidence in our mollusk-derived ΔR values.
Map of Australia, showing determined pooled ΔR values and major surface ocean currents (after Wijeratne et al. Reference Wijeratne, Pattiaratchi and Proctor2018). Individual ΔR values selected for pooling were all accepted values within a contiguous area, with pooled ΔR value groupings separated by large lengths of coastline with no values, but within a dominant marine surface current. Average ΔR values are used here to broadly characterize ΔR variability around the Australian coastline. We recommend researchers use a location specific ΔR value calculated using the Australian ΔR Calculator, available at: https://delta-r-calc.jcu.io/ (see below). See Table S4 for pooled ΔR methods and statistics.

There is a notable depletion in ΔR values southwards along the eastern Australian coastline coincident with the East Australian Current (EAC) (Figure 2). Although not a major difference (∼40 14C years from –190 years in northern Queensland to –152 years for southern New South Wales), it is significant and somewhat surprising given the well-equilibrated nature of waters of the EAC along the length of the eastern Australian seaboard. In terms of simple oceanographic conditions, we would expect very similar ΔR values along the entire east coast south to southern New South Wales where the Tasman Front breaks off (Wijeratne et al. Reference Wijeratne, Pattiaratchi and Proctor2018). It is possible that the enriched ΔR values reported here for areas of northeast Australia impacted by the EAC result from the extended period of atmospheric-ocean surface exchange during transport along the northeast seaboard with limited mixing with older subsurface waters. Enriched ΔR values have been associated with 14C enrichment of ocean waters in shallow marine environments subject to active wave and wind action (Forman and Polyak Reference Forman and Polyak1997). In contrast, much of the southeast Australian coastline is impacted by intermittent upwelling when northerly winds and eddies from the EAC bring water from offshore into near-shore waters (CSIRO 2012).
The ΔR values along the west coast of Australia are substantially depleted compared with the values for the east and north coast of Australia (Figure 2). There is a confluence of source waters on the west coast: in the north the Holloway Current is fed by the Indonesian Throughflow and Eastern Gyral Current whereas the South Indian Counter Current feeds the Leeuwin Current on the mid-Western Australian coast and the southwest coast is impacted by the South Indian Counter Current from the west as well as the Leeuwin Current from the north (Wijeratne et al. Reference Wijeratne, Pattiaratchi and Proctor2018). The northeast coast area is also subject to upwelling where tidal motions bring deeper nutrient-rich waters to the surface (CSIRO 2012). Although the west coast is fed by different water sources, their average ΔR values are very similar, overlapping with each other within 1σ (see Figure 2).
The variability in ΔR noted above for the east and west coasts of Australia is at odds with Ulm’s (Reference Ulm2006) previous assumption, based on fewer data points, that ΔR values were very similar along both coastlines. Ulm (Reference Ulm2006) also suggested that ΔR values in southeast Australia (extending from southern New South Wales, Victoria and to around Tasmania), would be very difficult to predict owing to localised variation in currents and local upwelling. However, the data reported here (albeit with limited data available for Tasmania) indicate that the general magnitude of marine reservoir variability is similar across this region.
These new data suggest general uniformity in the magnitude of ΔR across the Torres Strait and northern Cape York Peninsula, with more negative values in the southern Gulf of Carpentaria. The enriched ΔR values documented here are associated with the shallow waters of Torres Strait and the Gulf of Carpentaria where there are high rates of atmospheric-ocean surface 14C exchange and less mixing with older subsurface waters (cf. Petchey Reference Petchey, Fairbairn, O’Connor and Marwick2009; Ulm et al. Reference Ulm, Petchey and Ross2009). As noted previously, such 14C enrichment of ocean waters may occur in shallow marine environments subject to active wave and wind action (Forman and Polyak Reference Forman and Polyak1997), exacerbated in this region by input of monsoon runoff combined with the less open circulation of the Gulf.
The new values broadly spanning most of the Australian coastline provide more confidence in characterisation of regional MRE, with high-resolution values derived from a wider range and larger number of samples, and from a range of geographic contexts. The large error estimates associated with previous ΔR values may have masked our appreciation of variability in the MRE around Australia.
Australian ΔR Calculator
The interpolated kriged ΔR surface is shown in Figure 3 and the overall standard error surface in Figure 4 (combining both the standard errors of the original ΔR measurements, and those of the interpolation process). Figure 5 shows modeled predictions at selected locations around the coast of Australia.
Interpolated kriged ΔR (14C years) surface. Color scale shows range of ΔR values from enriched in red to depleted in dark blue. The kriging layer extends 300 km offshore from the closest mainland point.

Overall standard error (14C years) surface (combining both the standard errors of the original ΔR measurements, and those of the interpolation process). Color scale shows range of ΔR standard errors from small in blue with large in red. The kriging layer extends 300 km offshore from the closest mainland point.

Australian ΔR (14C years) Calculator modeled predictions at selected locations around the coast of Australia. Kriging was performed for all pixels with a size of 10 km. The kriging layer extends 300 km offshore from the closest mainland point. Color scale shows range of ΔR values from enriched in dark blue to depleted in red.

ΔR values and the overall standard errors for any location around the Australian coastline can be calculated using the online Australian ΔR Calculator available at: https://delta-r-calc.jcu.io/. ΔR values produced by the calculator can be used with the Marine20 calibration dataset (Heaton et al. Reference Heaton, Köhler, Butzin, Bard, Reimer, Austin, Bronk Ramsey, Grootes, Hughen and Kromer2020) and common radiocarbon calibration programs including OxCal (Bronk Ramsey Reference Bronk Ramsey1995) and CALIB (Stuiver and Reimer Reference Stuiver and Reimer1993) for age calibration of radiocarbon ages on Australian marine samples.
Future Research Directions
This study aimed to provide a robust understanding of the marine radiocarbon reservoir effects in Australia and improve the accuracy of radiocarbon dating of marine materials. A more complete understanding of ΔR variability would benefit from broadening this study to include more locations and more suspension-feeding mollusk species, particularly a broader range of species than currently represented in 14C age datasets. Species-specific ΔR predictions can be further refined with larger numbers of samples representing robust stratification of species (e.g., Petchey et al. Reference Petchey, Ulm, David, McNiven, Asmussen, Tomkins, Richards, Rowe, Leavesley, Mandui and Stanisic2012, Reference Petchey, Ulm, David, McNiven, Asmussen, Tomkins, Dolby, Aplin, Richards, Rowe, Leavesley and Mandui2013), to further refine knowledge and application of ΔR variability. Live-collected mollusks held in museums outside Australia and in private collections are important potential additional sampling sources. Additional specimens may be identified in Australian collections as they are progressively electronically databased.
Samples used in this study represent the majority of Australian coastlines, with notable concentrations around population centres where late nineteenth and early twentieth century shell collecting was focussed. Some stretches of coastline are poorly represented in the accepted ΔR dataset, such as the Great Australian Bight between Spencer Gulf and Esperance (ca. 1650 km of coastline), between Esperance and Perth in southwest Australia (ca. 950 km), between Melbourne and Adelaide (ca. 750 km), between the Mitchell Plateau and Darwin (ca. 750 km), and between Perth and Shark Bay in central Western Australia (ca. 700 km). Other locations with documented concentrations of archaeological shell deposits also have no local ΔR values, such as the north coast of New South Wales and the north and west coasts of Tasmania.
The values recommended in this study should only be considered reliable for the recent past, with samples collected in the nineteenth and early twentieth centuries. ΔR fluctuates through time, responding to 14C activity in source waters. Hua et al.’s (Reference Hua, Webb, Zhao, Nothdurft, Lybolt, Price and Opdyke2015, Reference Hua, Ulm, Yu, Clark, Nothdurft, Leonard, Pandolfi, Jacobsen and Zhao2020) study of corals from the Great Barrier Reef demonstrates large ΔR variations of ca. 490 14C years between 5500 and 7000 cal BP, while ΔR has been relatively stable in this region over the past ca. 5500 years (see also Komugabe-Dixson et al. Reference Komugabe-Dixson, Fallon, Eggins and Thresher2016; cf. Petchey Reference Petchey2020; Petchey et al. Reference Petchey, Dabell, Clark and Parton2023). Further studies of temporal variability are needed to characterize the magnitude and spatial variability of MRE in the past. Even more substantial changes in ΔR are likely during periods of sea-level change associated with glaciation/deglaciation (Heaton et al. Reference Heaton, Bard, Bronk Ramsey, Butzin, Hatté, Hughen, Köhler and Reimer2023). Dating of shell/charcoal paired samples from archaeological sites in Australia has often yielded ambiguous results, largely attributable to the low degree of confidence in the temporal association of many paired samples (Gillespie and Temple Reference Gillespie and Temple1977; Hughes and Djohadze Reference Hughes and Djohadze1980; Ulm Reference Ulm2002). One way to address this challenge is to develop local marine calibration curves by expanding regional sample sizes to examine ΔR through time in particular localities (e.g., Petchey and Schmid Reference Petchey and Schmid2020). Large-scale U-Th dating programs of long-lived and fossil corals are likely to provide some of the most robust records using current techniques. Another way is to ensure that paired shell/charcoal samples are obtained from high-integrity contexts of well-stratified sites employing fine-grained excavation methods and ensuring that the charcoal (or unburnt plant matter) is from short-lived plant parts such as seeds or leaves (Petchey et al. Reference Petchey, Ulm, David, McNiven, Asmussen, Tomkins, Richards, Rowe, Leavesley, Mandui and Stanisic2012, Reference Petchey, Ulm, David, McNiven, Asmussen, Tomkins, Dolby, Aplin, Richards, Rowe, Leavesley and Mandui2013).
Future studies could also shed further light on short-term variability in ΔR through implementing intrashell dating programs paired with sclerochronological analysis (Culleton et al. Reference Culleton, Kennett, Ingram, Erlandson and Southon2006). Similarly, stable isotope analysis may help shed light on intraspecies ΔR variability in the same taxa living in different environments.
CONCLUSION
This study represents the largest regional assessment of ΔR variability in the world. Although equatorial, tropical, and subtropical waters exhibit low reservoir ages, this study demonstrates significant variability around the Australian landmass that is closely related to regional hydrological conditions. These data suggest relative geographical uniformity in open ocean marine carbon reservoir variability across east, southeast, south, west, northwest, and north Australia, in the late nineteenth and early twentieth centuries. The new values provide more confidence than previous studies, with the more precise values derived from a wider range of species and from a wider range of geographic contexts. Systematic evaluation of legacy MRE studies using strict sampling criteria highlights systemic problems with sample selection and provenance as well as species identification. Legacy marine reservoir data points should only be used with caution and following appropriate evaluation. There is a need to broaden the study to include more locations and marine materials and expand regional sample sizes to examine ΔR through time in particular localities, to address challenges in developing local marine calibration curves. Understanding ΔR through time is significant because accurate marine reservoir corrections for mollusks and other marine taxa are central to debates concerning changes in Aboriginal and Torres Strait Islander societies, cultures, and technologies through the archaeological record, refining sea-level curves and the geomorphological development of coastal environments. The results reported here will support research in many fields by providing a more secure characterisation of local marine reservoir conditions.
ACKNOWLEDGMENTS
We respectfully acknowledge the First Nations Traditional Owners and custodians of the lands, seas, and skies where this study took place. SU is the recipient of an Australian Research Council Future Fellowship (project number FT120100656). This project was supported by the Australian Institute of Nuclear Sciences and Engineering funding scheme (AINGRA06181, AINGRA07150, AINGRA08063, AINGRA09025) and ARC Centre of Excellence for Australian Biodiversity and Heritage (CE170100015). For assistance and support in accessing and sampling malacological collections, we thank Val Attenbrow, Ian Loch, Mandy Reid, and Alison Miller (Australian Museum), Lisa Kirkendale and Corey Whisson (Western Australian Museum), Thierry Laperousaz and Peter Hunt (South Australian Museum), John Healy and Darryl Potter (Queensland Museum), and Chris Rowley (Museums Victoria). Robin Twaddle and Katherine Woo also assisted with locating specimens. For advice on previous samples, we thank Jamie Shulmeister (University of Canterbury).
SUPPLEMENTARY MATERIAL
To view supplementary material for this article, please visit https://doi.org/10.1017/RDC.2023.95


 Open access