


1. Introduction
The Norwegian seafood industry is the second largest export industry in Norway, and exported goods for about 16 billion euros in 2024. The catch comes from sea-going fishing vessels as well as aquaculture, and processing could take place either onboard fishing vessels or at land-based fish processing plants (FPP). The design of fish production lines is largely based on experience. The production lines are designed, built and tested in a static horizontal workshop environment. After several design iterations, often together with the customer, the production lines are tested on a fishing vessel on a test trip, and finally put into operation at sea. However, it sometimes could take 3-4 years for the production line to reach its full capacity (Reference Hansen, Kleppe, Karlsen, Mork, Giske, Thunem, Kaurin, Scarpa, Cavalieri, Serrano and De VitaHansen et al., 2025). One reason is that fish species and size vary throughout the year, providing a range of shapes, sizes, frictions and stiffnesses. This variation causes unforeseen challenges to arise unexpectedly and at any stage of the fish-processing chain, particularly during the first years of operation. Another reason is that because fishing vessels are out fishing 4-6 weeks at a time, there could be a long time before technical and operational problems can be improved. This incurs operational and financial risks for fishing boat owners, as well as challenging design projects for equipment suppliers.
Industry 4.0 involves the use of intelligent technologies such as real-time data streams, robotics, digital twins and artificial intelligence (AI) to enable smart factories. In the context of marine processing, the use of factory simulations in the design process for front-loading project knowledge is gaining attention as it could enable faster design iterations and reduce the risk of re-work. Further, such high-fidelity simulation environments is an important stepping stone for generating synthetic data for training embodied AI-agents, thus facilitating the development of ‘physical AI’ in Industry 4.0. Physical AI, or embodied AI, refers to implementation of AI-agents in mechatronic systems with physical components (Reference Liu, Chen, Bai, Liang, Li, Gao and LinLiu et al., 2025).
Recent advances in GPU computing have enabled near real-time simulation of large scale factory environments, as well as soft tissue deformable objects, such as in biomechanics simulation (Reference KainovaKainova, 2023). While previous studies have looked into using articulated rigid bodies for modelling fish in processing environments, these fails to capture the complex contact behavior soft-tissue interacting with automated processing equipment (Reference Giske, Kleppe, Rezaei, Glomsrud, Mork and HansenGiske et al., 2023; Reference Kleppe, Giske, Mork, Hansen, Vicario, Bandinelli, Fani and MastroianniKleppe et al., 2023). Further, the use of finite-element based simulation of fish species in digital environments such as NVIDIA Omniverse has been pointed out as a promising path for shortening the design iterations for seafood processing plants (Reference Hansen, Mork, Kleppe, Grzonka, Rylko, Suchacka and MityushevHansen et al., 2024), and early efforts on design simulations have been described (Reference Kleppe, Karlsen, Lersveen, Giske, Scarpa, Cavalieri, Serrano and De VitaKleppe et al., 2025).
For establishing meaningful design simulations of factory environments with wild fish, seasonal variations of biomechanical properties need to be captured. As such, the first research question (RQ1) of this paper is: what data are needed for simulation models of system level seafood processing for use in design tools? By system level, we refer to the fidelity of the simulation. This sits between a full factory simulation (high volume, low level of detail) and single specimen interaction simulation (one or two specimens, high detail level). An example of a simulation environment where this data is needed is shown in Figure 1. We limit ourselves to data necessary for use in the NVIDIA Omniverse simulation environment, from now referred to as the simulation environment, and to whole round fish at the initial stages of the processing chain. Filleting and downstream processing are not considered at this stage.
For sea-going fishing vessels with onboard processing plants, a particular design constraint is that measurements need to be taken at sea in a highly dynamic maritime environment. As the catch undergo continuous biological changes after harvest, transitioning from pre-rigor to rigor mortis and subsequently to post-rigor softening, the biomechanical behavior is time-dependent and should be measured shortly after harvest. Therefore, the design requirements for the data-collection equipment needs to reflect maritime operation personnel and conditions. As such, the second research question (RQ2) of this paper is: How must data collection jigs be designed for use in sea-going fishing vessels? To investigate this, we employ a human-centred design approach by performing interviews with key-stakeholders in a focus group, and gather learnings from iterative prototyping.
The contributions of paper can be summarized as follows. First, we present initial requirements for data in design simulations of marine seafood processing based on previous efforts (Reference Giske, Kleppe, Rezaei, Glomsrud, Mork and HansenGiske et al., 2023; Reference Hansen, Kleppe, Karlsen, Mork, Giske, Thunem, Kaurin, Scarpa, Cavalieri, Serrano and De VitaHansen et al., 2025; Reference Kleppe, Karlsen, Lersveen, Giske, Scarpa, Cavalieri, Serrano and De VitaKleppe et al., 2025). Next, we establish a set of design requirements for collecting this data in sea-going fishing vessels, and describe the iterative design process leading into three data collection jigs with preliminary validation. The novel contributions of this paper are thus (i) to develop and validate data collection equipment for seafood factory-design simulations, and (ii) summarizing the role of prototypes for shaping dynamic requirements in an industrial context.
2. Method
2.1. Focus group interviews
To learn about user needs, generate initial requirements, and adjust requirements from prototype learnings, we conducted interviews with a focus group consisting of several stakeholders from marine processing industry. The focus group was composed by representatives from major stakeholders in the value chain, including (i) representatives from two major fishing fleet owners (operations knowledge - companies A and B), (ii) representatives from two different onshore fish processing facilities (user knowledge - companies C and D), (iii) sales- and engineering representatives from two different fish processing designers and integrators (technical equipment knowledge - companies E and F), and (iv) a representative from a seafood company (product knowledge - company G). Four focus group meetings were held at project start, after initial prototyping, during equipment detail design, and after verification tests. The project team presented physical prototypes to the focus group, and received formative feedback for each design iteration. Focus group meetings were held digitally, and feedback was written down in a minute of meeting report. The feedback was then evaluated within the project group and used for (re-)planning prototyping activities.
2.2. Iterative prototyping of critical functionality
For exploring what parameters to measure (RQ1) and how jigs must be designed to accommodate use in sea-going fishing vessels (RQ2), we iteratively prototyped critical functionality following principles outlined in a previous study (Reference Kriesi, Blindheim, Bjelland and SteinertKriesi et al., 2016). This method embrace that product requirements are dynamic and subject to change throughout the design process, and has its origin in fuzzy-front-end low-technology-readiness-level projects (Reference Gerstenberg, Sjöman, Reime, Abrahamsson, Steinert, Chorianopoulos, Divitini, Baalsrud Hauge, Jaccheri and MalakaGerstenberg et al., 2015; Reference Steinert and LeiferSteinert & Leifer, 2012). We follow the prototype definition from (Reference Ulrich and EppingerUlrich & Eppinger, 2012) where a prototype is defined as “An approximation of the product along one or more dimensions of interest”. A prototype can therefore take a physical or non-physical form, such as sketches, mathematical models, simulations, tests components, and functional pre-production versions (Reference Elverum and WeloElverum & Welo, 2015). Furthermore, the fidelity of prototypes is kept low in the beginning of the process to iterate quickly, and increased throughout the project as dynamic requirements slowly consolidate. Data resulting from physical prototypes were continuously verified and tested in the simulation environment following each iteration. Evaluation criteria involved data quality, operation time and industrial robustness.
3. Initial design requirements
3.1. Factory design simulations
Left: Initial simulation tests varying young’s modulus; Right: Comparison of conveyor simulation versus full scale tests with 31 fish specimens. Simulation details are described by (Reference Kleppe, Karlsen, Lersveen, Giske, Scarpa, Cavalieri, Serrano and De VitaKleppe et al., 2025), and the figure is adapted from this paper

Figure 1 Long description
The image consists of one illustration, one photo, and one diagram. The illustration and diagram are side-by-side on the left, and the photo is on the right. The purpose of combining these images is to compare simulation tests with full-scale tests. The main subject is the conveyor system for fish processing. The illustration and diagram highlight the simulation tests with varying young's modulus values. The photo shows the full-scale tests with fish specimens. Panel A: The illustration shows simulation tests with two different young's modulus values, 1.1 MPa and 13 MPa. The conveyor system is depicted with a gray base and a blue top, showing the deformation under different modulus values. Panel B: The diagram shows the same simulation tests with a more detailed view of the conveyor system's deformation. Panel C: The photo shows the full-scale tests of the conveyor system with 31 fish specimens. The conveyor system is blue and white, and the fish are placed on the conveyor belt. The photo captures the actual setup and the physical interaction of the fish with the conveyor system.
NVIDIA Omniverse is a simulation environment optimized for rigid-body kinematics and dynamics, targeting simulation of robotic and automation systems. Recently, soft-tissue simulation using the co-rotational finite element method (CFEM) has been added CFEM handles large deformations typical of biomechanical tissues while retaining a linear-elastic material model. Although this reduces fidelity by neglecting non-linear and anisotropic behavior, it improves simulation speed and stability (Reference Bjelland, Rasheed, Schaathun, Pedersen, Steinert, Hellevik and ByeBjelland et al., 2022). The CFEM uses three models: (i) a visual model (surface mesh), (ii) a collision model for contact detection, and (iii) a computation model for internal force calculation. These models are mapped together, allowing different mesh densities to optimize computation speed, and are critical for near real-time simulation of 50 fish or more.
The fidelity of the finite element model should reflect the intended outcome of the simulation. While sophisticated FE models exist in CAE software, Omniverse currently supports only homogeneous isotropic materials. Thus, Young’s modulus and Poisson’s ratio sufficiently describe material behavior, influencing tensile, compressive, indentation, shear, and bending stiffness. Depending on the biomechanical test type, a range of Young’s modulus values may result. For simulating soft fish models in a factory environment, preliminary results from (Reference Kleppe, Karlsen, Lersveen, Giske, Scarpa, Cavalieri, Serrano and De VitaKleppe et al., 2025) indicate that bending stiffness dominates macro-level behavior, as manufacturing flow results from collision and bending among specimens on the line (see Figure 1).
The frictional parameters between the fish and various materials in the process line would affect the macro-level behavior and needs to be quantified. We hypothesize that these will vary according to the relative velocity between the fish shell direction and the conveyor or other manufacturing line materials, as well as with time from death as the fish dries during processing. The design simulation is here intended for replicating the operational conditions of a processing plant in a sea-going fishing vessel, the frictional parameters should reflect this and be measured as fresh as possible.
Initial requirements of physical parameters for digital models of fish specimens

3.2. Data collection equipment in sea-going fishing vessels
To measure the geometric shape, stiffness- and frictional parameters needed for a sufficiently realistic factory-design simulation, physical experiments need to be conducted. While low fidelity prototypes can be used in the beginning of the product development process, the focus group advised that the operating conditions of sea-going fishing vessels imposes several constraints that must be taken into consideration.
Although it is not necessary to measure fish during the roughest operations (e.g. high waves and rough seas), the equipment will be placed within a fish processing facility at sea. Consequently, it needs to tolerate the environment it shall operate in. All electrical equipment and connections should have an IP-rating of 67, and preferred material choices are AISI 304. Plastics should withstand humidity, temperature changes, and strong chemicals used for cleaning, and suitable materials could be PEHD500 or PE. Design principles on hygienic design should be followed (Reference Løvdal, Giske, Bjørlykhaug, Eri and MorkLøvdal et al., 2017).
An aim for the equipment is that it can be sent out to sea with minimal researcher involvement, and it should therefore also be easy to operate and be robust. The users are fishermen, who in addition to managing the catch in a hectic, moist, cold and at time chaotic environment, need to operate the data-collection equipment. The reason for this simply being that it may be the only way to get enough data, and capture enough variation of the data (seasonal, geographical variations). The level of automation should therefore be sufficient to reduce the workload to a minimum, but without compromising data quality.
4. Prototyping
4.1. Exploring techniques for 3D scanning
Prototypes A-E for exploring 3D scanning solutions (upper row), and example of resulting 3D model (lower row)

A variety of 3D-scanning technologies for Industry 4.0 applications are available today and are commonly based on structured light, laser triangulation, photogrammetry or coordinate measuring machines (CMM) (Reference Haleem, Javaid, Singh, Rab, Suman, Kumar and KhanHaleem et al., 2022). CMM uses a gantry-style grounded manipulator arm to accurately measure coordinate points. Although this has potential for high accuracy, the scanning speed is considered too slow for the large number of specimens that must be scanned in this context. The starting point was a commercial 3D-scanner (Einscan HX, Shining 3D, China) that uses a hybrid laser and LED light source (prototype A). Initial tests quickly revealed that the reflective surface of fish shells was problematic, and that the resulting 3D models did not provide satisfactory results. Manually attaching fiducial markers to improve accuracy was also deemed impractical given the operational constraints. As such, the focus was shifted towards exploring photogrammetry, and a new design cycle was initiated.
Photogrammetry has the added benefit that photorealistic textures can be seamlessly integrated in the 3D-model. The first iteration (prototype B) used a Realsense D435 camera (Realsense, USA) mounted on a rotating arm, and was based on an open photogrammetry project (SanderBoelen, 2025). However, the level of detail on the 3D object was not satisfactory and no texture was provided. In the next iteration (prototype C), the commercial RealityCapture photogrammetry software (Epic Games, USA) was used in combination with low resolution USB cameras (FIT0892, DFRobot), as well as higher resolution cameras (FIT0729, DFRobot). The low resolution camera model was quickly omitted due to insufficient detail. Several of the high-res USB cameras were distributed in a barrel configuration (see Figure 2), and several tests were conducted. First, six pictures with 60 degree offset was tested, but no 3D object was reconstructed. Next, 24 pictures with 15 degree offset resulted in a partly reconstructed object. Further, by removing the background before photogrammetry, the entire object could be reconstructed, but had issues in merging two halves of the object. The next tests consisted of distributing cameras over three different heights with offset angle between ‘layers’. Here, 18 pictures were taken (six per layer). However, the 3D reconstruction was not successful, showing that overlap between images was too low. From here, it was apparent that more images were needed for better quality. Another test therefore rotated the entire barrel by 22.5 degrees per sample, resulting in a total of 96 images per layer. With removing the background, this strategy yielded better results. Further, by instead rotating the fish and capturing a video stream at 15 frames per second, a total of 190 images were obtained and a 3D model with sufficient quality was created.
Because of the initial requirement of reducing operating workload in sea-going vessels, and previous learnings that several images were needed for satisfactory results, a photogrammetry-based design with automatic actuation was prototyped (prototype D). The design involved attaching the fish to a hook that rotates in 10-degree increments by means of a stepper motor. An array of eight cameras (FIT0729, DFRobot) were installed inside a container, and the fish was lowered into the container to ensure consistent lighting conditions. The inside of the container was painted pink to easily remove the background. Photogrammetry was processed using the RealityCapture photogrammetry software (Epic Games, USA), and the prototype is shown in Figure 2. Except from minor background color disturbances, this approach provided about 800 images with sufficient overlap which resulted in high quality 3D models with good texture.
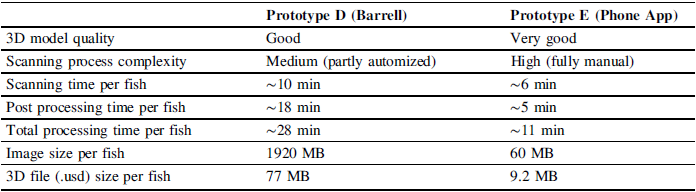
Comparison of critical functionality of prototypes D and E

After working with prototype D for a while, the scanning time and post-processing times were identified as critical functionalities, as the available time for model scanning at sea is scarce, and prolonged post-processing times makes model verification difficult. In essence, the more photos used for photogrammetry, the longer the actual scanning takes, and likewise the post-processing time. To provide a benchmark of prototype D, a photogrammetry-based smartphone application (MagiScan, AR Generation, Poland) was tested (prototype E). Lab tests quickly showed that the application could provide better quality even with fewer images. This substantially reduced scanning time, post-processing time and 3D model quality (no foreign objects in model). To verify field use, it was tested in a fish processing factory with variable light conditions. A comparison between prototypes D and E are shown in Table 2.
4.2. Stiffness measurement jig
Prototypes F-K for developing a jig for measuring fish bending stiffness

Figure 3 Long description
The image contains six photos of different prototypes labeled F to K. Panel A shows Prototype F, where a person is handling a fish with a device. Panel B shows Prototype G, a fish mounted on a red background with a measuring device attached. Panel C shows Prototype H, a fish on a table with diagrams of different fish shapes and measurements. Panel D shows Prototype I, a complex setup with a fish and various mechanical components. Panel E shows Prototype J, a person adjusting a fish on a mechanical setup. Panel F shows Prototype K, a fish on a mechanical frame with various components.
The purpose of stiffness measurements is to approximate a Young’s modulus that will sufficiently describe the biomechanical behavior of fish in a processing facility. To start off, low-fidelity initial probing experiments were conducted by manually measuring the tensile stiffness using a hand-held tensile load cell (prototype F, Figure 3). Resulting stiffness values were converted to Young’s modulus and tested in the simulation environment. The resulting moduli did not appear realistic. Next, a set of experiments registering the deflection of the tail from gravity were conducted (prototype G). This attempted to measure bending stiffness, but was more suited for determining passive range-of-motion. To tune the Young’s modulus, a set of drop tests were performed and used in a visual comparison with simulation models (prototype H). However, to establish reliable stiffness parameters describing the behavior of fish in processing, it was concluded that robust force-displacement curves for bending stiffness were needed.
In traditional mechanics, the quasi-static bending stiffness is measured in a three- or four point bending test, or in a cantilever bending test. Because of the highly irregular and variable shape of marine species, these classic methods are not suitable. The focus group made the team aware that some work has focused on measuring rigor mortis stiffness in marine species, and these are largely based on the cantilever bending test (Reference Kiessling, Helge Stien, Torslett, Suontama and SlindeKiessling et al., 2006; Reference Korhonen, Lanier and GiesbrechtKorhonen et al., 1990). While the stiffness in biomechanics tissue is dependent on load speed due to the high water content, and as such could be considered a dynamic variable, a quasi-static approach was selected due to implementation limitations in the simulation environment. To measure this, a cantilever-style bending jig was prototyped (prototype I). This prototype consisted of an aluminium profile frame, a linear sliding carriage for attaching the fish head, and a linear actuator with a load cell for tail attachment. The linear actuator consisted of an industrial grade servo motor (R88M, Omron, Japan) with position sensing through an integrated rotary incremental encoder. The rotary motion was transferred to linear motion through a lead screw (ACME TRX8). The sequence was controlled and measurements were registered using an industrial programmable logic controller (PLC) (N1XP2, Omron, Japan).
For the first iteration of testing, the specimen was attached to the linear carriage using a hook in the gills, and the tail was attached to the load cell using a static rope. Specimens were farmed cod. While this iteration demonstrated a proof-of-concept, several issues were uncovered. First, the attachment to the carriage did not sufficiently prevent rotation of the specimen, thereby compromising bending stiffness measurements. Second, the linear rails of the carriage quickly corroded, causing a non-smooth motion. A rebuild was therefore conducted (prototype J), replacing the carriage with a 3D printed cradle design, and the linear rails with high-quality stainless-steel components. The tail attachment was kept. For the next round of testing, farmed cod from company G was sourced. Tests quickly revealed that the stock size variations were larger than anticipated, and that the cradle and rails had to become larger. As such, a third rebuild was initiated (prototype K). Until this point, requirements had not defined limitations in size and weight, and the test protocol was ambiguous. A maximum length of 900 mm was set as a length limit and the cradle and linear rail redesign accounted for these new requirements. After several iterations, the test was ultimately run until 200 N force or 300 mm displacement.
4.3. Friction measurement jig
Prototype iterations (L-P) for the friction measurement jig

For measuring static and dynamic friction the classic inclined plane sliding experiment, well known from high-school physics, formed the basis. To develop a jig for this purpose, the general requirements of minimizing manual labor, handling the harsh environment, hygienic requirements, as well as providing the flexibility of quickly interchanging materials from the factory environment. This exploration also started with low-fidelity probing experiments. An MDF-style plate with a door-hinge (prototype L, Figure 4) allowed for quick testing of frictional coefficients of fish on four different materials: stainless steel (AISI 304), plastic (PEHD), conveyor belt (polyoxymethylene) and textured/rigidized stainless steel plate (5WL). The purpose of this prototype was to initiate development of a test protocol. The plate was gradually inclined until a sliding movement was detected, giving the static coefficient of friction. After sliding had initiated, the time between two fixed spots, combined with the inclination angle, provided information for the dynamic coefficient of friction. Tests quickly revealed that the slimy surface of the fish influenced the friction. Specifically, when exposed to fresh air, the slimy surface dried out, substantially increasing friction. To overcome this, fish specimens were kept submerged in salt water before and after tests to ensure similar conditions for all specimens. Also, the sliding surface was moisturized with salt water. Another important learning was that the difference in friction with head first versus tail first, verifying the assumption of directional variability.
To reduce manual labor and minimize human error, a semi-automated jig was prototyped (prototype M). This used a NEMA 30 stepper motor with scissor lift gearing for automatically inclining the plane, a laser sensor (E3Z, Omron, Japan) for detection sliding motion, and a camera (Hero8, GoPro, USA) with a software (EventMeasure, SeaGIS Pty) for measuring time between two fixed points. Inclination measurements were manual, and the maximum inclination was 25 degrees. Two important learnings were gathered (i) the inclination angle was not sufficient to provide sliding on conveyor material, and (ii) manual inclination measurements were too imprecise. Moreover, limitations in the jig related to time spent on data logging as well as jagged motion were noted. This triggered a new design iteration with an optical encoder for automatic inclination measurement, and a new servo motor (1S, Omron, Japan) with a static rope and two gas springs for motion support (prototype N). The improved accuracy allowed for verifying the assumption of constant acceleration for dynamic friction coefficients.
To overcome issues with static rope wear and range of motion, the servo motor was replaced by two 300 mm stroke linear actuators (RS Pro micro, RS, UK) with 500 N capacity each (prototype O). Data collection and actuation control was handled by a PLC (N1XP2, Omron, Japan). Initial verifications experiments yielded reliable results. However, during tests with farmed cod, the unforeseen size of the fish specimens challenged the load capacity of the jig in the start phase. A maximum weight of 10 kg was set as an upper limit. Moreover, it was hypothesized that not only head first or tail first would influence friction, but also sideways, as this is a common scenario in processing factories. As such, a new prototype (prototype P) was built with a wider base, accommodating sideways friction measurements, elevated base for better start motion power, and a new and stronger linear actuator (ESBF, Festo, Germany). In addition, encoders were replaced with IP68 grade photoelectric sensors (Sick, Germany), and a laser sensor for slip detection (Omron, Japan). The camera was kept for redundancy, and a black anodized aluminium plate with grid laser engraving was added for reference.
5. Preliminary validation results
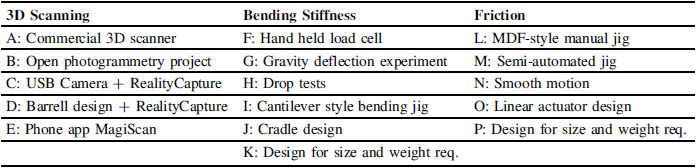
A total of 16 prototypes were made in less than 12 months for iterating on requirements on 3D scanning, stiffness measurements and friction measurements. The prototypes are summarized in Table 3. The final iteration of the jigs (prototypes E, K, and P) were verified in a data collection experiment in a fish factory environment. A team of five users operated the jigs, following a predefined protocol. 80 wild fish were measured over a course of four days, with a cycle time of 10-12 minutes per fish. The data quality was satisfactory. No equipment malfunction or robustness issues were reported. The resulting 3D models and frictional parameters have been verified in digital prototypes of the simulation environment (Figure 1). During controlled comparison tests, industry experts observed that the simulated fish behavior in the digital environment closely matched the behavior of real fish under identical physical conditions. This qualitative validation confirmed that the deformation and contact responses captured in the simulation environment were realistic enough and meaningful for industrial use. The bending stiffness measurements await verification.
Summary of physical prototypes; A refers to ‘prototype A’ B to ‘prototype B’, etc

6. Discussion
This paper explored what data is needed for design simulations in marine seafood processing factories (RQ1), and methods to obtain these through iterative industrial prototyping (RQ2). Dynamic requirements were shaped throughout the product development process through prototyping and interviews with a focus group consisting of key stakeholders.
Testing of data collection equipment was initially done with farmed cod, which are relatively similar in size, shape and color. This gave good control over how well technology worked, as well as the quality of the data collected. Qualitative validation from industry experts confirmed that simulated fish behavior aligned well with observations from physical tests. An example simulation adapted from (Reference Kleppe, Karlsen, Lersveen, Giske, Scarpa, Cavalieri, Serrano and De VitaKleppe et al., 2025) is shown in Figure 1. One industrial partner (company E) also used the models in proof-of-concept evaluations of new designs. The partner applied these simulation results in early-stage equipment evaluation and planning and expressed confidence in the value of the digital outcomes. This early industrial adoption indicates practical relevance and supports the potential of the approach for real-world implementation.
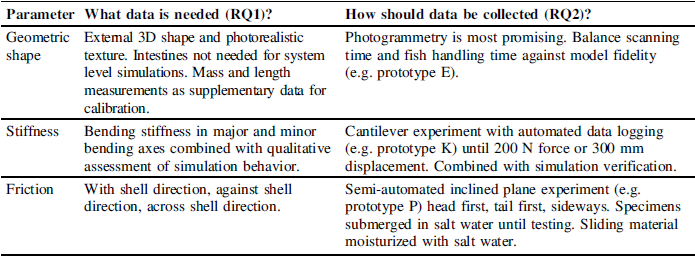
As the initial requirements (Table 1) evolved throughout the design process, we have summarized the current state of requirements in Table 4 - addressing RQ1 and RQ2. It shall be noted that bending stiffness requirements is currently based on simple simulation verification (Figure 1), and that more rigorous data analysis is needed.
The active involvement of key stakeholders in combination with a high number of physical prototypes was essential for enabling quick cycles of design-build-test. In the beginning, prototypes were kept at low fidelity and used for exploration and communication - focusing on the ‘what’ (RQ1). Later, fidelity increased, and the prototypes were used for refinement and active learning - focusing more on the ‘how’ (RQ2). While a more comprehensive literature review could have prevented ‘dead ends‘, e.g. for exploration of 3D-scanning technologies, there was a double benefit from active learning on fish specimens and stakeholder engagement during initial prototyping rounds which would otherwise have been missed. Further, the industrial context and constraints affected the prototypes, especially in the final iterations. While materials and components (sensors, actuators, controllers) were industrial grade, fabrication methods and components were selected with iteration speed in mind. The first rounds of prototyping were made in a campus setting (biology lab and maker spaces), but the jigs were quickly moved to an industry partner (company E) and testing was conducted in a fish processing facility (company C). This gave valuable insights into use of jigs, and shaping requirements.
State of requirements after 16 prototypes

The contrast between the overarching goal of developing a simulation tool for factory designers and the prototype-intensive design process used in this study sparks the discussion on best-practice design methods: when should designers simulate, and when should they prototype? Our findings support that the essential factor is rapid cycles of design–prototype–test–reflection. This is a central component in agile design philosophies for low technology-readiness-level, but is sometimes met with scepticism in industry because of a higher short-term project risk. While simulations can address targeted questions and accelerate iteration, they cannot currently match the richness and unpredictability of insights gained from physical prototypes. However, we anticipate that simulation will become increasingly central in “Design for Physical AI,” where large, structured datasets are required to train models. In this context, simulation may complement physical prototyping by enabling data generation and faster exploration of design alternatives.
7. Conclusion
This paper identified dynamic data requirements for simulating seafood-processing factories and demonstrated methods for obtaining them: 3D shape from photogrammetry, bending stiffness from cantilever experiments, and frictional parameters from inclined-plane tests. Our results show that iterative prototyping with active stakeholder involvement is crucial for discovering and shaping these evolving requirements.
Acknowledgement
The authors would like to acknowledge project contributors Tina H. Urang, Andrea Kaurin, Sara Gholamshahi, Malin Haaheim-Meistad, Ida Arnøy, Ådne Thunem, Oskar Kvamme, Patrick Solheim, Kadir Sirin, Henry Piehl and Iben Støylen. They would also like to acknowledge FHF - Norwegian Seafood Research Fund for funding the project (project 901991 SIM-FISHPROCESSING).






 Open access

