





Introduction
In 2022, lowbush blueberry, Vaccinium angustifolium Aiton (Ericaceae), was Canada’s most significant fruit crop (Agriculture and Agri-Food Canada 2023). Canada is the world’s leading producer of lowbush blueberries, with the majority of the crop grown in Quebec (Ministère de l’Agriculture, des Pêcheries et de l’Alimentation du Québec 2022; International Blueberry Organization 2023). Lowbush blueberry has limited self-pollination capability due to its floral characteristics (Bell et al. Reference Bell, Rowland, Zhang and Drummond2009; Gagnon et al. Reference Gagnon, Chagnon, Chiasson, Desjardins and Tremblay2011). Therefore, entomophilous pollination is essential, accounting for approximately 91% of fruit set (Gagnon et al. Reference Gagnon, Chagnon, Chiasson, Desjardins and Tremblay2011; Drummond Reference Drummond2019).
Recent years have seen lowbush blueberry production increasingly rely on managed pollinators, particularly honey bees, Apis mellifera Linnaeus (Hymenoptera: Apidae) (Bushmann and Drummond Reference Bushmann and Drummond2020). Introducing honey bee colonies can enhance fruit set by 70% to nearly 100% (Dufour et al. Reference Dufour, Fournier and Giovenazzo2020a). This rise in fruit set, along with the decline of wild bees and growers’ desire to maximise yields, has led to higher colony densities. Increased honey bee densities improve yield parameters in both highbush, Vaccinium corymbosum Linnaeus (Ericaceae), and lowbush blueberries (Aras et al. Reference Aras, De Oliveira and Savoie1996; Eaton and Nams Reference Eaton and Nams2012; McCallum et al. Reference McCallum, Menzies, Glasgow and Olmstead2017; Arrington and DeVetter Reference Arrington and DeVetter2018).
However, some studies have demonstrated the negative impacts of blueberry pollination on honey bee colony health (Colwell et al. Reference Colwell, Williams, Evans and Shutler2017; Dufour et al. Reference Dufour, Fournier and Giovenazzo2020a). As polylectic pollinators, honey bees rely on diverse floral resources and are adversely affected by monotonous diets prevalent in lowbush blueberry fields (Dufour et al. Reference Dufour, Fournier and Giovenazzo2020b). The protein of floral resources in these fields (9.8–13%) is below the required level for colony development, which is approximately 20% protein (Huber Reference Huber2016; Colwell et al. Reference Colwell, Williams, Evans and Shutler2017; Dufour et al. Reference Dufour, Fournier and Giovenazzo2020b). Insufficient protein leads to reduced brood production following the blueberry pollination period and slows the overall growth and recovery of the colony (Dufour et al. Reference Dufour, Fournier and Giovenazzo2020a).
An increase in colony density is associated with a heightened risk of disease transmission, notably the spread of multiple viral infections, as well as increased transmission of Varroa destructor Anderson and Trueman (Mesostigmata: Varroidae) mites and brood diseases (Forfert et al. Reference Forfert, Natsopoulou, Paxton and Moritz2016; Brosi et al. Reference Brosi, Delaplane, Boots and de Roode2017; Gisder and Genersch Reference Gisder and Genersch2017; Pfeiffer and Crowder Reference Pfeiffer and Crowder2022). Pathogens, parasites, and their related diseases pose significant challenges in beekeeping, with varroosis being the primary health concern for beekeepers in North America (Currie et al. Reference Currie, Pernal and Guzmán-Novoa2010; Claing Reference Claing2019; Ferland et al. Reference Ferland, Kempers, Kennedy, Kozak, Lafrenière and Maund2022). Other diseases such as Vairimorpha spp. Tokarev et al. (Nosematidae), formerly Nosema spp., American foulbrood caused by Paenibacillus larvae (White) Ash et al. (Paenibacillaceae), and European foulbrood caused by Melissococcus plutonius (White) Bailey and Collins (Enterococcaceae), along with various viruses, lead to considerable losses in Canada (Claing Reference Claing2019). For example, a higher presence of V. ceranae was noted following pollination of lowbush blueberries (Dufour et al. Reference Dufour, Fournier and Giovenazzo2020a). Limited research assesses how increased colony densities may affect bee health in lowbush blueberry fields. Furthermore, little is known about the carryover impacts of lowbush blueberry pollination on colony health.
In the present study, we compared colonies dedicated solely to honey production and kept outside blueberry fields (OB; controls) with two colony densities for pollinating lowbush blueberry fields – a recommended-density treatment (RD; 2.5 colonies/ha; Chiasson and Argall Reference Chiasson and Argall1996; Financière agricole du Quebec 2024) and a high-density treatment (HD; 5 colonies/ha). This study investigates the effects of lowbush blueberry pollination on various colony health parameters during and after the pollination period, as well as the impact of increased colony density on overall colony health. We hypothesised that lowbush blueberry pollination would reduce colony strength and increase pathogen and parasite loads, with more pronounced effects at higher densities. We also hypothesised that lowbush blueberry pollination would increase pesticide exposure.
Materials and methods
Study site
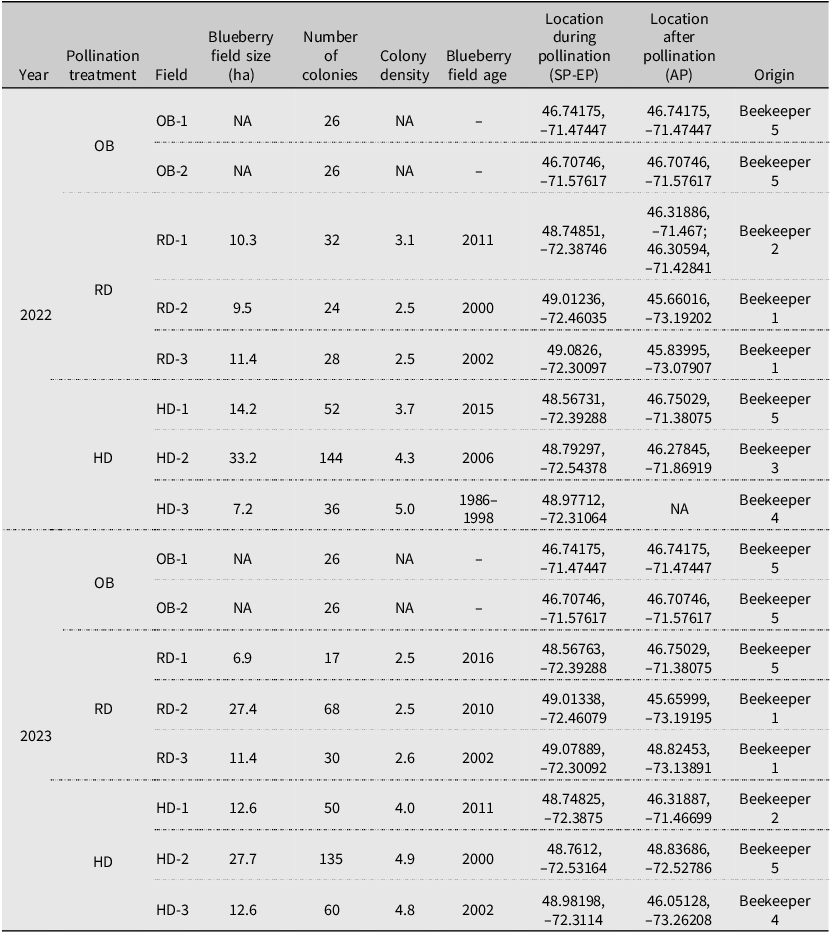
The present study was conducted during the summers of 2022 and 2023. The experimental design was divided into two main categories of pollination treatments: colonies placed in blueberry fields (beekeepers 1, 2, 3, and 4) and control colonies placed outside blueberry fields (beekeeper 5; Table 1).
Principal characteristics of lowbush blueberry fields and colony locations. OB, colonies outside blueberry fields (controls); RD, recommended-density treatment (2.5 colonies/ha); HD, high-density treatment (5 colonies/ha); SP, start of pollination; EP, end of pollination; AP, after pollination; NA, not applicable (colonies in field HD-3 in 2022 were excluded from evaluations because of mismanagement). The age of a lowbush blueberry field indicates how long it has been producing blueberries.
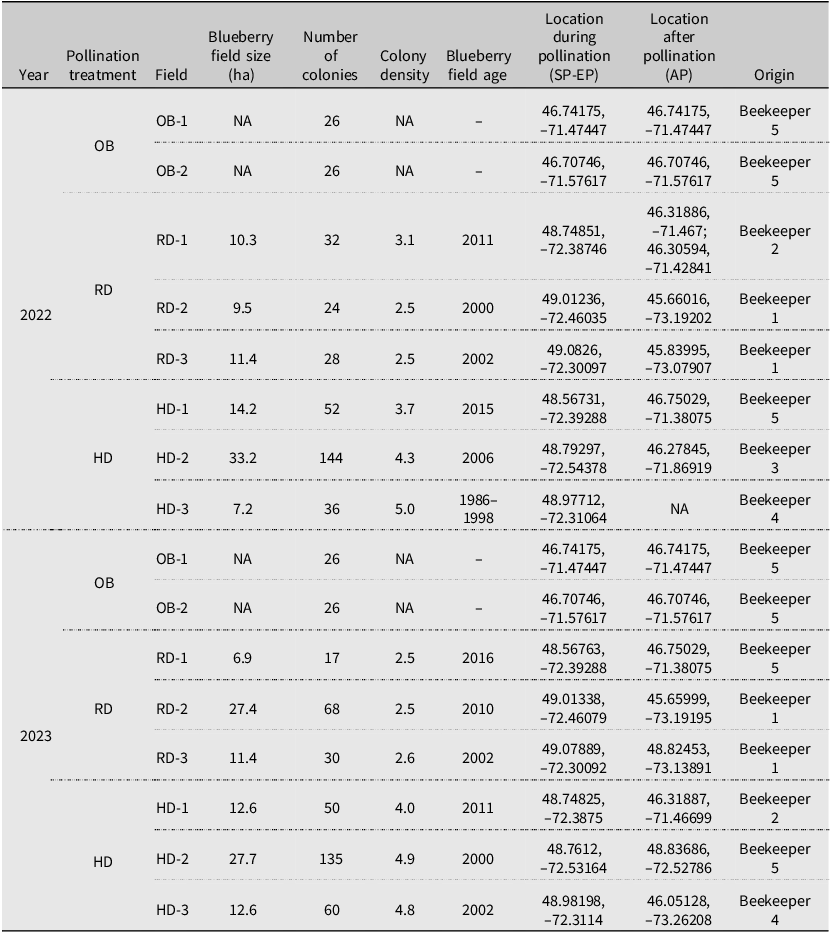
Table 1. Long description
The table presents data on pollination treatments, field characteristics, and colony locations for lowbush blueberry fields during the summers of 2022 and 2023. It includes columns for year, pollination treatment, field, blueberry field size in hectares, number of colonies, and colony density. The table has 22 rows and 6 columns. The pollination treatments are categorized into colonies placed in blueberry fields and control colonies placed outside blueberry fields. The fields are identified by unique codes, and the blueberry field size is measured in hectares. The number of colonies is listed with their origin and colony density. Notable trends include variations in field size, number of colonies, and colony density across different beekeepers and years. The data highlights the differences in pollination treatments and their impact on colony locations.
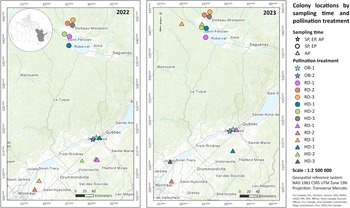
The colonies involved in blueberry pollination were located each year in six typical lowbush blueberry fields in the Saguenay–Lac-Saint-Jean region, Quebec, Canada. Because blueberry production is biannual, we used six different fields in 2022 and another set of six fields in 2023 (Fig. 1). All fields used conventional farming practices. Fields were spaced at a distance of at least 5 km from each other.
Colony locations by time point and pollination treatment in 2022 and 2023. Stars = control colonies that remained in the same field during throughout all three time points. Circles = blueberry field colonies at the start (SP) and end (EP) of the pollination period. Triangles = colonies after the pollination period (AP) at various beekeeper sites. OB, colonies outside blueberry fields (controls); RD, recommended-density treatment (2.5 colonies/ha); HD, high-density treatment (5 colonies/ha); SP, start of pollination; EP, end of pollination; AP, after pollination.
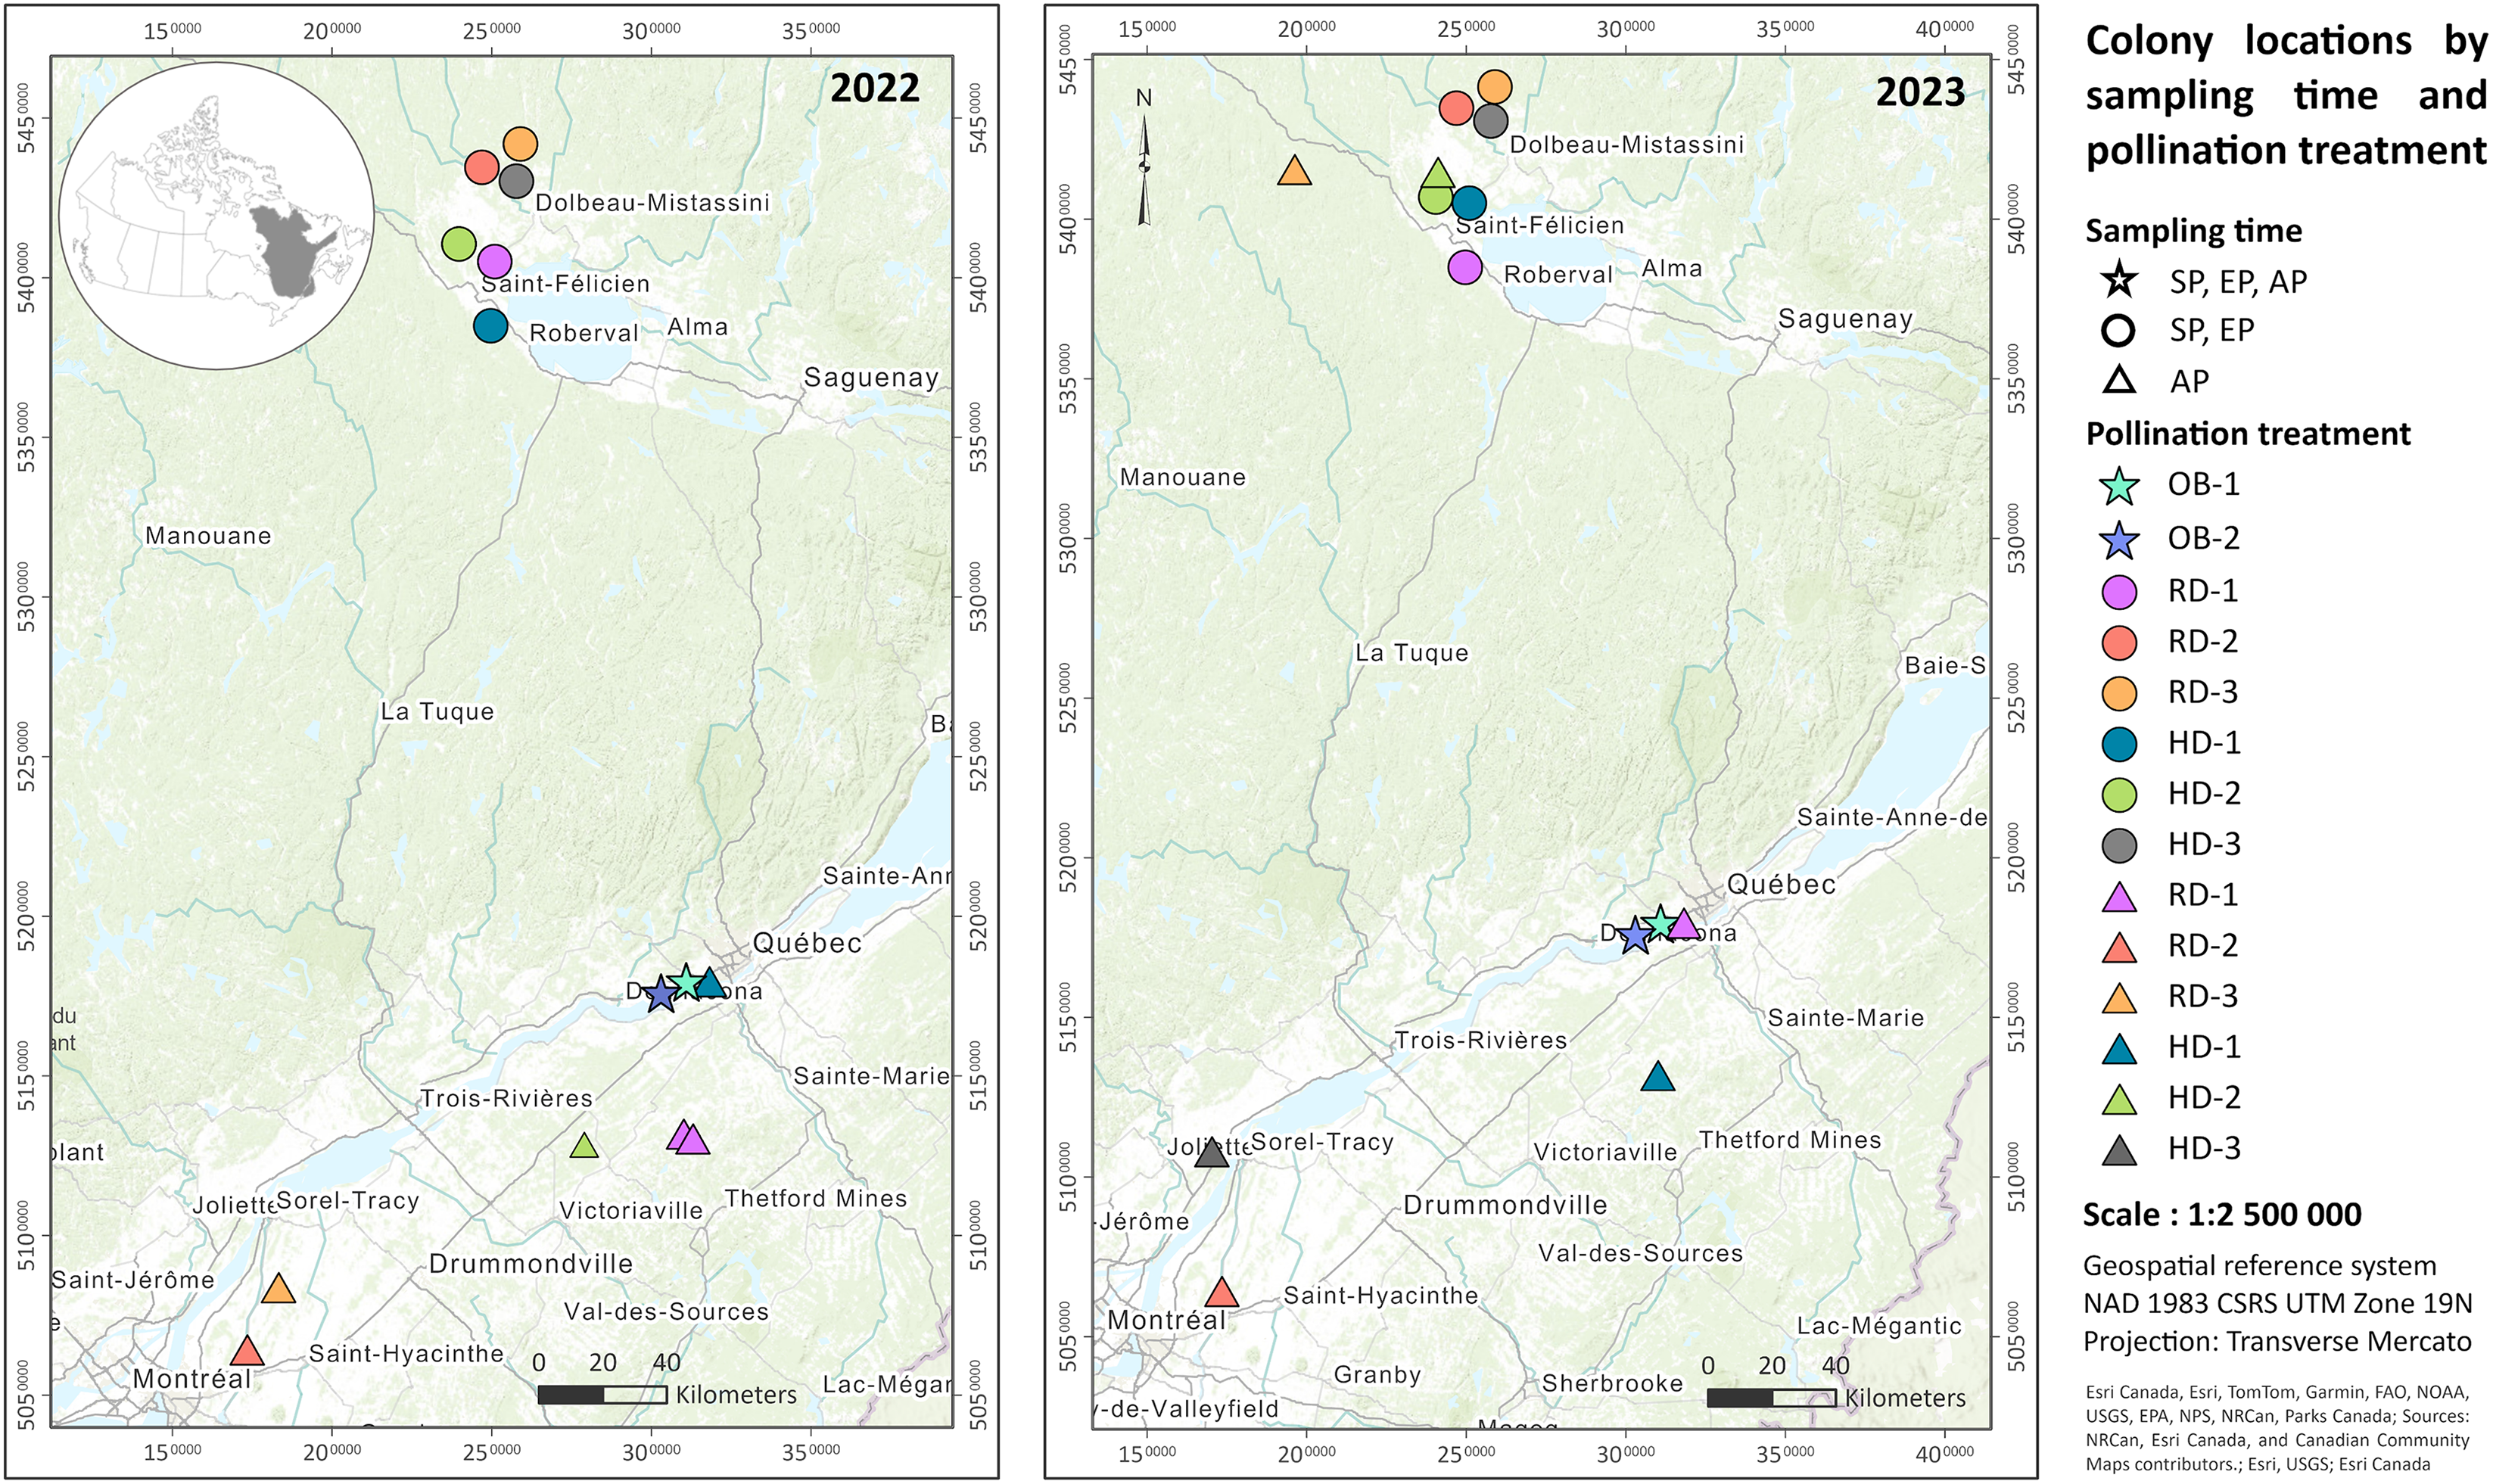
Figure 1. Long description
The map displays colony locations by sampling time and pollination treatment in 2022 and 2023. It includes various regions such as Dolbeau-Mistassini, Saint-Félicien, Roberval, Alma, Saguenay, La Tuque, Manouane, Québec, Trois-Rivières, Sainte-Marie, Victoriaville, Thetford Mines, Joliette, Sorel-Tracy, Drummondville, Val-des-Sources, Saint-Hyacinthe, Montréal, Saint-Jérôme, Granby, Sherbrooke, Lac-Mégantic, and Val-d’Or. Different symbols and colors represent sampling times and pollination treatments, with stars, circles, and triangles indicating different time points and colors representing different treatments.
Control colonies were placed outside blueberry fields at two replicate locations in typical regional farmland and were managed exclusively for honey production. The number of replicates was limited by logistical constraints in identifying suitable apiaries. To ensure consistency, we prioritised well-characterised apiaries that could be monitored consistently across both study years (2022 and 2023).
Preparation and management of colonies
Two theoretical honey bee stocking densities for pollination were evaluated: a recommended colony density of 2.5 colonies/ha (RD; Chiasson and Argall Reference Chiasson and Argall1996; Financière agricole du Quebec 2024) and a high colony density of 5 colonies/ha (HD). The actual colony densities are presented in Table 1, ranging from 2.5 to 3.1 colonies/ha for the RD treatment and from 3.7 to 5.0 colonies/ha for the HD treatment. Colonies within the blueberry fields were stocked at either the RD or the HD, with each field randomly assigned a single treatment density. Each treatment was replicated three times, for a total of six apiaries used each year. Each apiary was placed in a different blueberry field (Table 1). In accordance with regional pollinator introduction practices (Bernier et al. Reference Bernier, Chagnon and Beaudoin2023), the colonies were placed in predetermined enclosures within the fields, as designated by producers and beekeepers (Fulton et al. Reference Fulton, Jesson, Bobiwash and Schoen2015). Colonies were introduced when 10–20% of the blueberry flowers had bloomed, which marked the start of the pollination period. The colonies remained in place until petal fall, which marks the end of this phase (Drummond Reference Drummond2002; Chagnon et al. Reference Chagnon, Pettigrew, De Oliveira and Marceau2015; Arrington and DeVetter Reference Arrington and DeVetter2018). This timing resulted in a total pollination duration of approximately three weeks in both years (from late May to mid-June) and increased the likelihood that bees forage primarily on blueberry flowers rather than on alternative flora (Olmstead and McCallum Reference Olmstead and McCallum2019).
Colonies were managed according to each participating beekeeper’s standard practices and received no supplemental feeding or vitamin supplements. No Varroa treatments were applied, except in 2022 at site HD-3, where colonies were treated with amitraz during the sampling periods at the start of pollination (SP) and at the end of pollination (EP).
Health monitoring of honey bee colonies was conducted annually on 10 colonies per apiary. Each year, a total of 20 OB colonies, 30 RD colonies, and 30 HD colonies were evaluated. Colony health assessments were conducted at three time points each year: at the start of pollination (SP), at the end of pollination (EP), and after the pollination period (AP). The initial evaluation (SP) was conducted upon receipt of the hives to assess their baseline condition, occurring 1–2 days after arrival, depending on the field. A second assessment (EP) was conducted at the end of the pollination period, just before hive removal from blueberry fields, to evaluate the short-term impact of pollination. One month after pollination (AP), all colonies were relocated to honey production apiaries (Fig. 1), similar to the control colonies kept outside blueberry fields. A third evaluation was then conducted at the respective beekeepers’ locations (Fig. 1) to assess potential carryover effects of pollination (AP). Control colonies were also evaluated at each of these three time points.
Colony health parameters evaluated
The number of samples collected for each parameter varied depending on the time point (Supplementary material, Table S1). Sample sizes were also affected by colony mortality and swarming events. In some cases, beekeepers redirected their colonies to cranberry pollination after blueberry pollination, rather than to honey production apiaries as originally planned. These colonies were excluded from the analysis. All health parameters were assessed by the same team in both years to ensure consistency, particularly for evaluation of qualitative measures such as colony strength and clinical signs. Colonies from all treatments and time points were evaluated over two days due to the long distances between fields. All frames from all supers of the selected colonies were evaluated. Honey bee colony health was assessed using the following parameters.
Honey bee colony strength
Colony strength was monitored each year at the three time points in the 60 colonies placed in blueberries and the 20 OB colonies. This parameter was assessed by counting the number of frames covered by bees on each side viewed from above in the total supers (Delaplane et al. Reference Delaplane, Van Der Steen and Guzman-Novoa2013).
Clinical health status
A veterinary form was completed at the beginning of each evaluation, conducted at three time points. The form included the geographical location of the apiary, a description of the colonies (including the age of the queen and the material of the hive), management practice details (such as Varroa control), and a checklist of observed clinical signs related to the presence or absence of pathogens such as chalkbrood, Ascosphaera apis (Maasen ex. Claussen) L.S. Olive and Spiltoir (Ascosphaeraceae), foulbrood (Paenibacillaceae and Enterococcaceae), and others, indicating each colony’s health status.
Pathogen and parasite infestation
Varroa destructor – The infestation rate was measured with the alcohol-washing method (Dietemann et al. Reference Dietemann, Nazzi, Martin, Anderson, Locke and Delaplane2013). Approximately 300 nurse bees were collected from the brood frames of each colony and preserved in containers with 70% alcohol. In the lab, the containers were placed on a rotating orbital shaker at a speed of 130 rpm for 5 minutes to facilitate the detachment of the Varroa from the bees. The contents of each sample container were then shaken onto a mesh screen (grid: 10 × 10 squares per inch) and placed above another container to collect the ethanol. Varroa present in the liquid were counted. If Varroa were present, the shaking process was repeated (up to a maximum of three cycles). The colony infestation rate was estimated from a standardised subsample of 50 bees. In addition, Varroa presence was reported as a binary measure (presence–absence) and expressed as the proportion of colonies infested within each treatment and time point.
Vairimorpha spp. – Approximately 100 foraging bees per colony were sampled. Foraging bees were collected from honey frames without brood (Claing Reference Claing2019). The bees were placed in a container on dry ice and transported the same day to the lab, where they were stored at –20 °C until analysis. Analyses were conducted at the National Bee Diagnostic Centre (Beaverlodge, Alberta, Canada). Vairimorpha ceranae and V. apis were differentiated, with just one sample identified as V. apis each year. Only the results of V. ceranae are presented. Vairimorpha ceranae load was evaluated based on the number of spores per bee.
Virology – 100 foraging bees were collected from each colony from honey frames without brood. The bees were placed in a container on dry ice and transported the same day to the lab where they were stored at –80 °C until analysis (De Miranda et al. Reference De Miranda, Bailey, Ball, Blanchard, Budge and Chejanovsky2013). Viral analyses were conducted at the National Bee Diagnostic Centre. Molecular detection of viruses was performed using reverse transcription–polymerase chain reaction. Six viruses were evaluated in 2022: deformed wing viruses A and B (Iflaviridae), acute bee paralysis virus (Dicistroviridae), Israeli acute paralysis virus (Dicistroviridae), Kashmir bee virus (Dicistroviridae), and chronic bee paralysis virus (Dicistroviridae). In 2023, three viruses were analysed: black queen cell virus (Dicistroviridae) and the deformed wing viruses A and B. Viral load was measured as the number of virus copies per bee.
Paenibacillus larvae (American foulbrood) and Melissococcus plutonius (European foulbrood) – These bacterial pathogens were monitored by visualising clinical signs in all brood frames (Claing Reference Claing2019). When signs were present, a dry sterile swab was used to collect samples directly from the cells of diseased larvae. The same swab was used to collect samples from multiple cells in the same hive. One swab per hive showing clinical signs was collected. The swabs were stored at –20 °C until analysis. Analyses were conducted at the National Bee Diagnostic Centre. All collected swabs were submitted for culturing to identify the presence or absence of American foulbrood (P. larvae) and European foulbrood (M. plutonius).
Ascosphaera apis (chalkbrood) – This pathogen was monitored by visualising clinical signs in all brood frames (Claing Reference Claing2019). The clinical signs considered included white (chalky) and fuzzy mould in brood cells and white (chalky), grey, and black mummies at the hive entrance or inside the hive (on the bottom board or in capped brood cells). A colony was considered positive when these clinical signs were present.
Pesticide analyses in bee bread and nectar
In 2022, pesticides were analysed only at EP. In 2023, samples were collected at SP and at EP. Approximately 3 g of fresh nectar and 4 g of fresh bee bread were collected separately from uncapped cells. Using a syringe (for nectar) or a small spatula (for bee bread), from each colony. We used nectar to capture a representative snapshot of the pesticides to which bees are exposed in the field at a specific moment. Fresh bee bread was identified by its bright colour, slightly moist texture, and ease of removal from the cell.
Nectar and bee bread samples were collected from 10 colonies per field and subsequently pooled to produce a single composite sample per blueberry field for analysis. The same procedure was followed for the control colonies, which were located outside blueberry fields. In total, seven pooled bee bread samples and seven pooled nectar samples were collected for analysis in 2022, representing six blueberry fields and one control colony. In 2023, eight pooled bee bread samples and eight pooled nectar samples were collected for analysis, representing six blueberry fields and two control apiaries. All samples were stored at –20 °C. The analyses were performed at the University of Guelph’s ISO/IEC 17025–accredited Laboratory Service Division (Guelph, Ontario, Canada).
The concentrations of pesticide residues in nectar and bee bread were used to assess pesticide risk, which was calculated by two methods. First, we calculated contact hazard quotients (Tsvetkov et al. Reference Tsvetkov, Samson-Robert, Sood, Patel, Malena and Gajiwala2017; Drummond et al. Reference Drummond, Lund and Eitzer2021). To estimate contact hazard quotients, we divided the concentration of each detected active ingredient (in parts per billion) by its respective contact lethal dose 50% (LD50) value (also in parts per billion). Lethal dose 50% values originally expressed in µg/bee were converted to parts per billion using a factor of 10 000, based on the assumption that a bee weighs 0.1 g (Drummond et al. Reference Drummond, Lund and Eitzer2021).
A hazard quotient value greater than 1 indicates that the concentration of the active ingredient found in the samples exceeds its LD50, meaning it surpasses the threshold at which 50% of the exposed bee population is expected to die (Drummond et al. Reference Drummond, Lund and Eitzer2021). Hazard quotients were calculated individually for each active ingredient, and then all hazard quotients within the same blueberry field were summed (Cappellari et al. Reference Cappellari, Malagnini, Fontana, Zanotelli, Tonidandel and Angeli2024) without distinguishing between nectar and bee bread matrices. This approach provided an estimate of the overall pesticide risk to bee health (total hazard quotient) across different matrices. Finally, the total hazard quotients were averaged across control colonies and across colonies in blueberry fields.
Although hazard quotients are useful for evaluating multi-residue contamination, this method only assesses contact-related risks and does not account for the actual amount of nectar or bee bread that bees ingest. We used the pollen consumption as an estimate of bee bread consumption. Therefore, we applied a second approach, the acute (Tier 1) risk quotient, following the United States Environmental Protection Agency (2012) BeeREX protocol. In this method, the total dose of each compound ingested per bee was estimated by multiplying the pesticide concentration detected in nectar or bee bread (mg/g) by the average daily consumption of these matrices (mg/day) for honey bees. Separate calculations were performed for nectar and bee bread because most residues were found in bee bread, and consumption rates differ substantially between matrices.
Because our objective was not to compare among bee castes, we used the highest reported consumption rates: 292 mg/day of nectar for nectar-foraging workers (Cutler et al. Reference Cutler, Purdy, Giesy and Solomon2014; United States Environmental Protection Agency 2012) and 9.5 mg/day of pollen for nurse workers (Szolderits and Crailsheim Reference Szolderits and Crailsheim1993; United States Environmental Protection Agency 2012). The Tier 1 risk quotient was then obtained by dividing the estimated daily oral dose per bee by the oral LD50 of the compound. An acute risk quotient value greater than 0.4 exceeds the level of concern and indicates a high toxicity risk for honey bees. In both the hazard quotient and risk quotient analyses, pesticide concentrations below the minimum quantification or detection limits were considered to be 0.
Statistical analyses
Statistical analyses were performed using SAS OnDemand for Academics, version 9.4_M7 (https://www.sas.com/en_us/home.html), and R, version 4.4.1 (gplot2 for plotting; https://cran.r-project.org/bin/windows/base/old/). Data from 2022 and 2023 were combined for colony strength and the proportions of colonies infested with Varroa destructor and with foulbrood and chalkbrood. The year was considered a random effect in these models. Vairimorpha spp. and virology analyses could not be combined across years due to missing data at many time points.
Continuous variables (strength, V. ceranae load, viral loads) were analysed with repeated-measures analysis of variance (proc mixed). Due to the presence of many 0 values, some variables (V. destructor infestation, V. ceranae load, viral loads) were converted to dichotomous presence–absence variables (proportion of infected colonies) and analysed using repeated-measures logistic regression (proc glimmix, binomial logit). Full documentation on proc mixed and proc glimmix procedures is available at https://documentation.sas.com/. Most viruses could not be statistically analysed; instead, mean proportions of infected colonies were calculated.
In both continuous and dichotomous variables, fixed effects included pollination treatment, time point, and their interaction. Random effects included year (when applicable), apiary × pollination treatment, and year × apiary × pollination treatment × colony. The covariance structure used to model the time dependence varied, depending on the parameter. The best-fitting covariance structure was selected using the lower Akaike information criterion and Bayesian information criterion values.
We validated data residuals for normality of distribution and variance for homogeneity. Box–Cox + 1 or log + 1 transformations were applied when necessary to meet model assumptions; V. ceranae and viral loads were transformed accordingly. Due to multiple 0 values in the V. destructor infestation rate, no transformation improved normality or homogeneity. Therefore, the average infestation rate was calculated without statistical analysis, and only the proportion of infested colonies was reported.
Results were validated with a significance level of 0.05. Bonferroni-adjusted pairwise comparisons were used for dichotomic variables and for single-factor effects (time or pollination treatment) in continuous variables. However, when significant differences were observed in the interaction between time and pollination treatment in continuous variables, contrasts were performed instead. Because most of the colonies in the present study came from different beekeepers, controlling their health status upon arrival for blueberry pollination or honey production was challenging. Using contrast allows for tracking the progression of colony strength and pathogens over time.
Contrasts were calculated using coefficients and were applied to variables such as colony strength, Box–Cox + 1 V. ceranae, log + 1 deformed wing virus A, and log + 1 deformed wing virus B in 2023. Contrasts were used to evaluate temporal changes and pollination treatment effects. Temporal contrasts assessed the carryover effects of pollination (AP – SP), changes during pollination (EP – SP), and effects after pollination (AP – EP). These were combined with pollination treatment contrasts to evaluate the effect of using RDs for pollination (RD – OB), high colony densities (HD – OB), and the effect of doubling RDs (HD – RD).
For pesticide analyses, RD and HD were combined (‘in blueberries’) and compared with OB control colonies to determine if blueberry pollination causes pesticide contamination. In 2022, pesticides were assessed only at the end of pollination and in one apiary outside blueberry fields (OB); therefore, no statistical models were created. Analysis was done separately for nectar and bee bread samples in 2023 using the mixed models for continuous variables described above.
Results
Colony strength
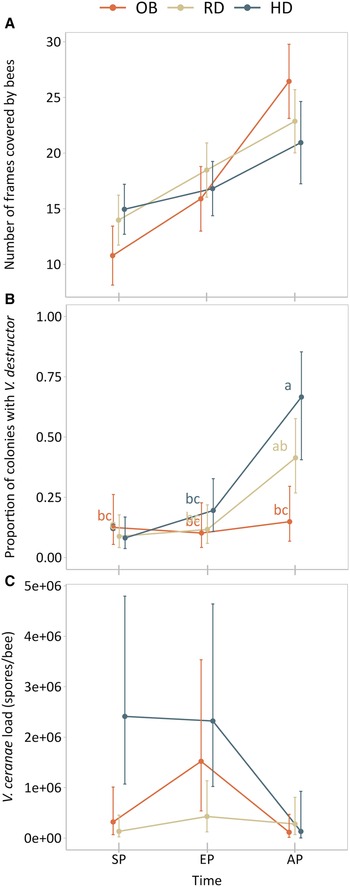
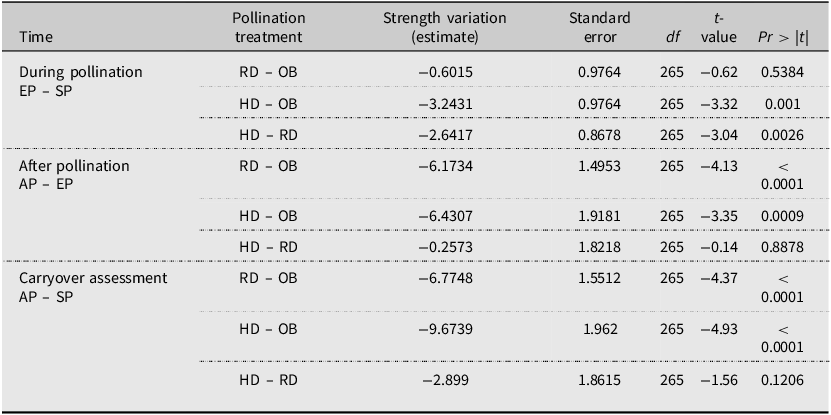
The variation in colony strength showed a significant interaction between pollination treatment and time point on colony strength (F = 9.96, P < 0.0001). Colonies used for lowbush blueberry pollination (RD and HD) had significantly lower growth of colony strength than those managed for honey production (OB; controls; Fig. 2A). In addition, a progressive growth in colony strength over time was observed for all treatments (Fig. 2A). Carryover assessment (AP – SP) showed a lower development of RD colonies (RD – OB = –6.8 frames, t = –4.37, P < 0.0001) and HD colonies compared to in control colonies (HD – OB = –9.7 frames, t = –4.93, P < 0.0001). For RD colonies, the most significant loss in strength growth occurred after the pollination period ended (AP – EP), with 6.2 fewer frames per colony than in OB colonies (t = –4.13, P < 0.0001). For HD colonies, the most significant loss in strength growth occurred in AP – EP, with 6.4 fewer frames per colony than in OB colonies (t = –3.35, P = 0.0009) and during the pollination period (EP – SP), with 3.2 fewer frames per colony than in control colonies (t = –3.32, P = 0.001).
Variation in honey bee health parameters across pollination treatments over time: A, honey bee colony strength, measured as the number of frames covered by bees (pooled data from 2022 and 2023); B, proportion of colonies infected with Varroa destructor (pooled data from 2022 and 2023); C, variation in Vairimorpha ceranae loads in 2023 (back-transformed data are shown to retain the original scale after the Box–Cox + 1 transformation). The model estimated the mean and 95% confidence interval. OB, colonies outside blueberry fields (controls); RD, recommended-density treatment (2.5 colonies/ha); HD, high-density treatment (5 colonies/ha); SP, start of pollination; EP, end of pollination; AP, after pollination. Statistical differences were assessed by contrasts for A and C (Tables 2 and 3) and by pairwise comparisons for B, where different letters indicate significant differences (P ≤ 0.05).
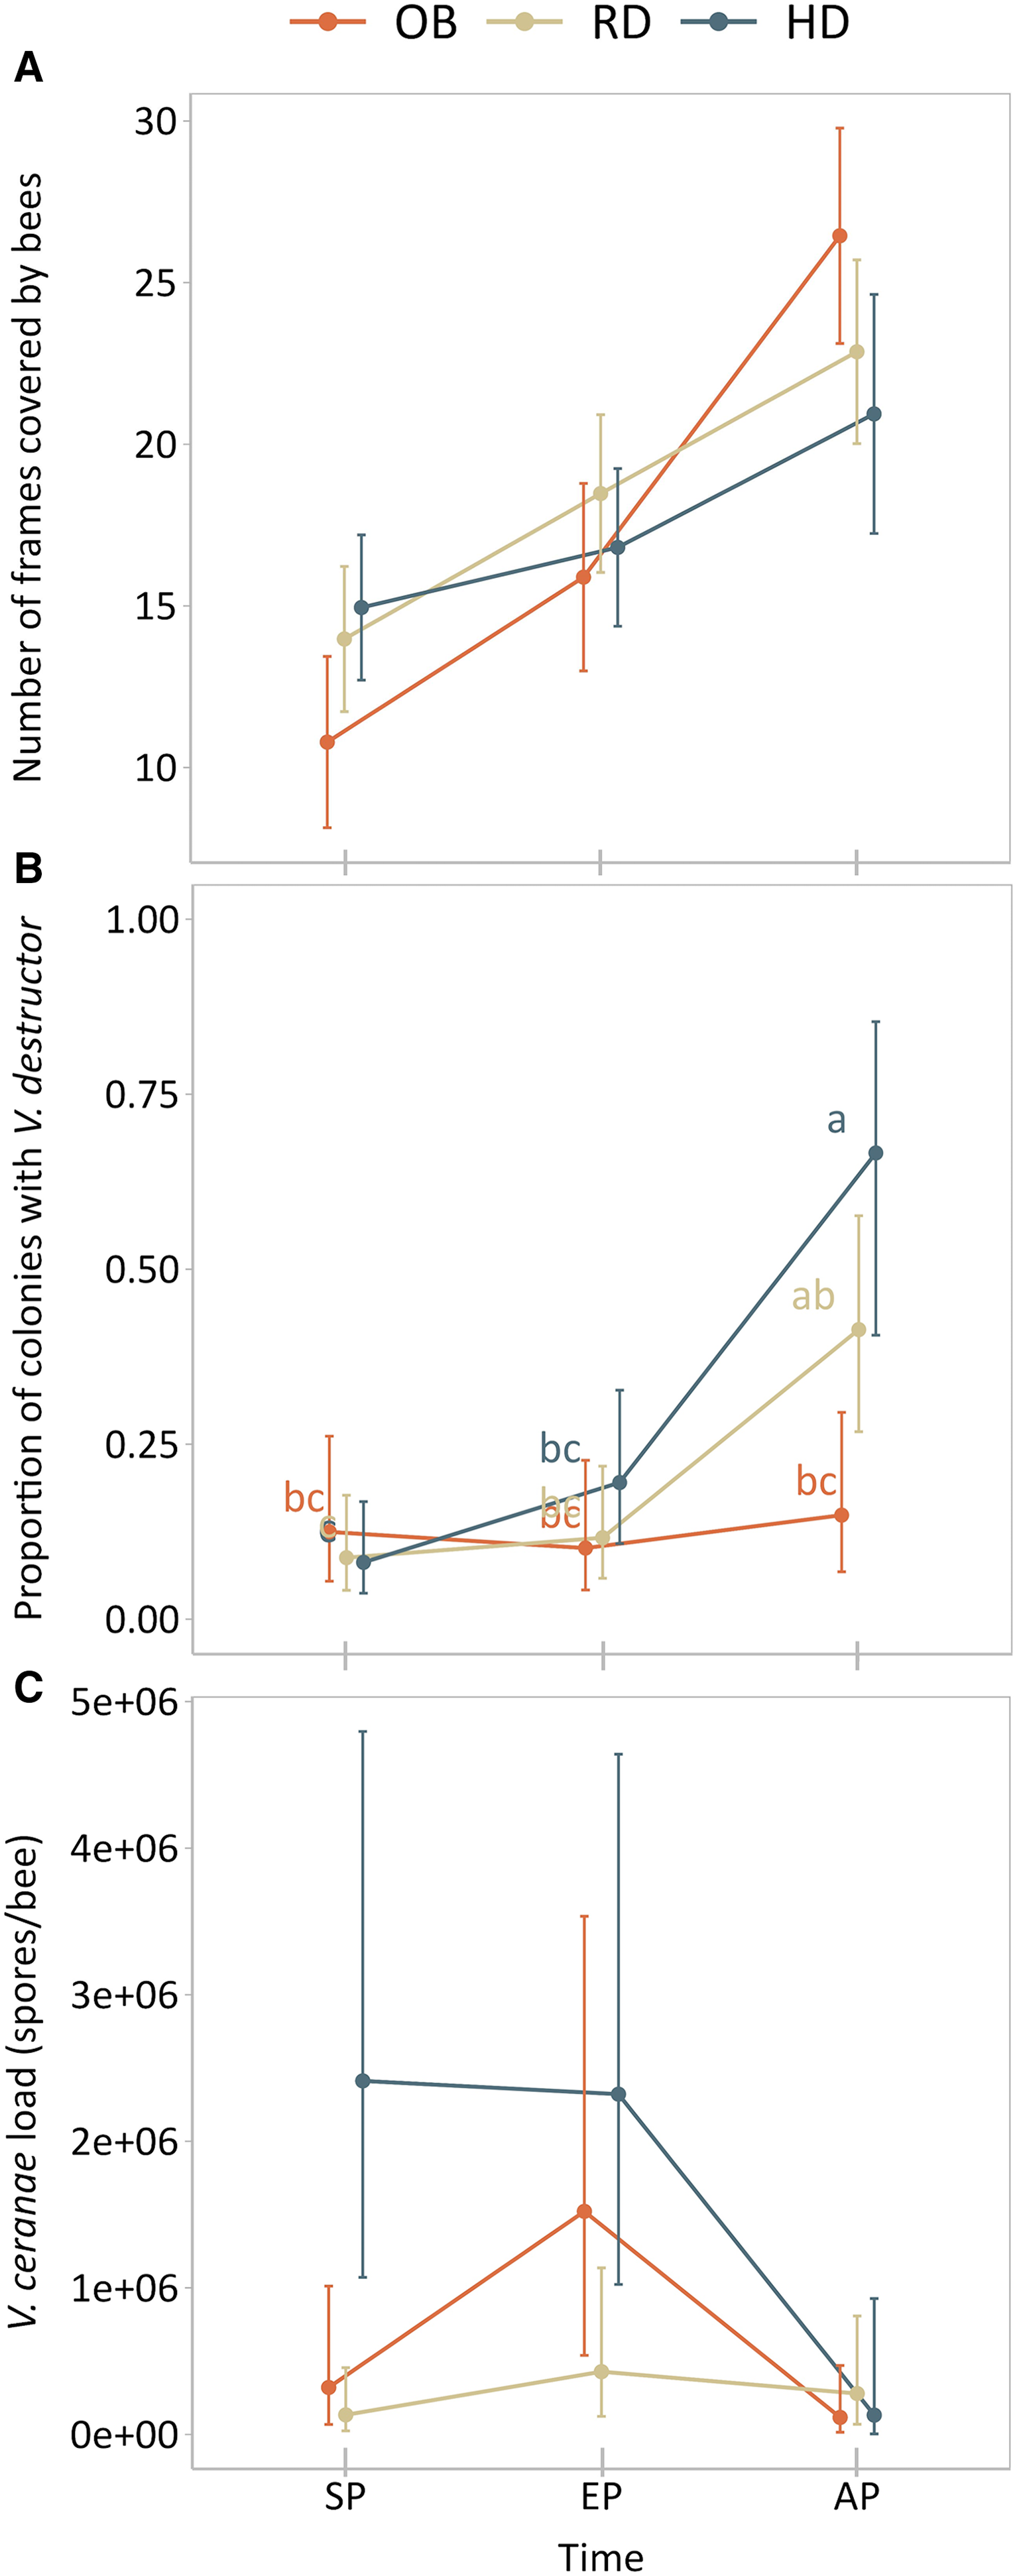
Figure 2. Long description
The line graph presents data on honey bee health parameters across different pollination treatments over time. The x-axis represents time points: start of pollination (SP), end of pollination (EP), and after pollination (AP). The y-axis varies for each subplot. Subplot A shows the number of frames covered by bees, with three data lines representing colonies outside blueberry fields (OB), recommended density (RD), and high density (HD). Subplot B displays the proportion of colonies infected with Varroa destructor, with statistical differences indicated by different letters. Subplot C illustrates Vairimorpha ceranae loads, with data back-transformed to retain the original scale. All values are approximated.
Although contrasts did not show a significant difference in strength growth when increasing colony density (HD – RD) in the carryover assessment (AP – SP; t = –1.56, P = 0.1206), a significantly lower strength growth was observed in HD colonies during pollination (EP – SP) when density was doubled, with 2.6 fewer frames per colony than in RD colonies (t = –3.04, P = 0.0026; Table 2).
Contrasts used to evaluate variation in honey bee colony strength in colonies placed outside blueberry fields and in those placed in lowbush blueberry fields (combined data from 2022 and 2023). Negative values in estimates indicate a lower strength growth. The model estimated strength variation and standard error. OB, colonies outside blueberry fields (controls); RD, recommended-density treatment (2.5 colonies/ha); HD, high-density treatment (5 colonies/ha); SP, start of pollination; EP, end of pollination; AP, after pollination.
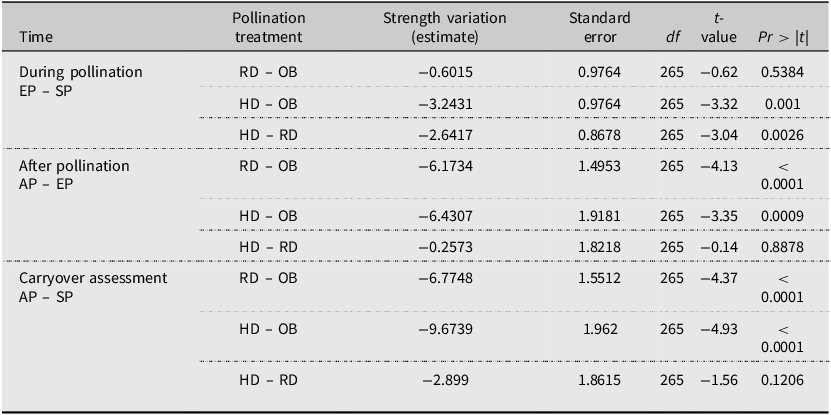
Table 2. Long description
The table presents data on the variation in honey bee colony strength, measured as the number of frames covered by bees, across different pollination treatments and times. It includes data from colonies placed outside blueberry fields and those placed in lowbush blueberry fields, combined from 2022 and 2023. The table has five columns: Time, Pollination treatment, Strength variation (estimate), Standard error, degrees of freedom, t-value, and Pr > |t|. The Time column lists three periods: During pollination, After pollination, and Carryover assessment. The Pollination treatment column lists various treatment combinations such as RD – OB, HD – OB, HD – RD, etc. The Strength variation (estimate) column shows the estimated variation in colony strength for each treatment and time period. The Standard error column provides the standard error for each estimate. The degrees of freedom column lists the degrees of freedom for each statistical test. The t-value column shows the t-values for each contrast, and the Pr > |t| column shows the P-values indicating the significance of each contrast. Notable trends include significant variations in colony strength during and after pollination, with some treatments showing highly significant differences.
Pathogen and parasite infestation
Varroa destructor – Average infestation rates were between 0.1% and 0.2% for all treatments at the SP and EP time points. However, an increase in infestation rate was observed in AP for RD colonies (0.6%) and HD colonies (2.0%).
The proportion of colonies infested with Varroa showed significant differences based on the pollination treatment and the time point (F = 3.95, P = 0.0039). The proportion of infested colonies increased significantly in AP for HD colonies compared to the controls, rising from 0.2% in OB colonies to 0.7% in HD colonies (Fig. 2B). No differences were found between RD and control colonies nor between RD and HD colonies.
Vairimorpha ceranae – In 2022, no significant differences between various groups were found in V. ceranae load (F = 1.64, P = 0.2210) or in the proportion of infected colonies (F = 1.61, P = 0.2080).
In 2023, V. ceranae loads varied with time point and pollination treatment (F = 4.34, P = 0.0027). Loads for control colonies varied across time points, peaking in EP and declining in AP. The RD treatment colony loads remained stable over time. The HD treatment colony loads had an overall reduction, especially during AP (Fig. 2C).
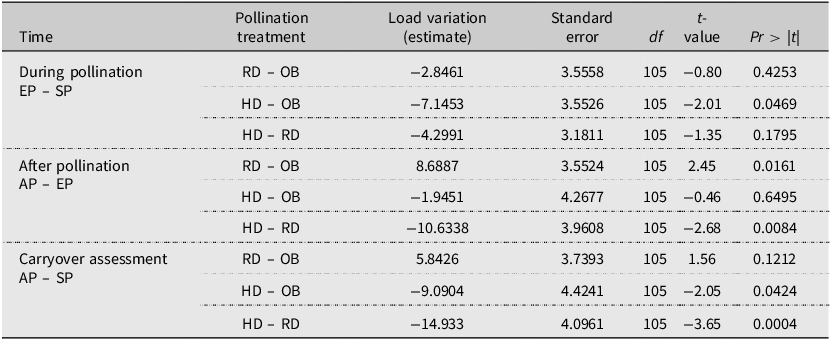
Carryover assessment (AP – SP) showed a significant load reduction in HD compared to control colonies (t = –2.05, P = 0.0424), which we attributed to the significant load increase in OB colonies during pollination (EP – SP; t = –2.01, P = 0.0469). Carryover assessment between the HD – RD treatments also revealed significant differences in V. ceranae loads (t = –3.65, P = 0.0004). This difference was evident after pollination (AP – EP), where HD colonies exhibited a significant decrease in pathogen load (t = –2.68, P = 0.0084; Table 3). We found values of 4.28 × 10⁵ spores per bee in RD and 2.32 × 10⁶ spores per bee in HD at EP, which decreased to 2.79 × 10⁵ spores per bee in RD and 1.32 × 10⁵ spores per bee in HD after pollination (AP; Fig. 2C).
Contrasts used to evaluate Vairimorpha ceranae load variation in honey bee colonies placed outside blueberry fields and in those place in lowbush blueberry fields, 2023. The model estimated load variation and standard error after a Box–Cox + 1 transformation. OB, colonies outside blueberry fields (controls); RD, recommended-density treatment (2.5 colonies/ha); HD, high-density treatment (5 colonies/ha); SP, start of pollination; EP, end of pollination; AP, after pollination.
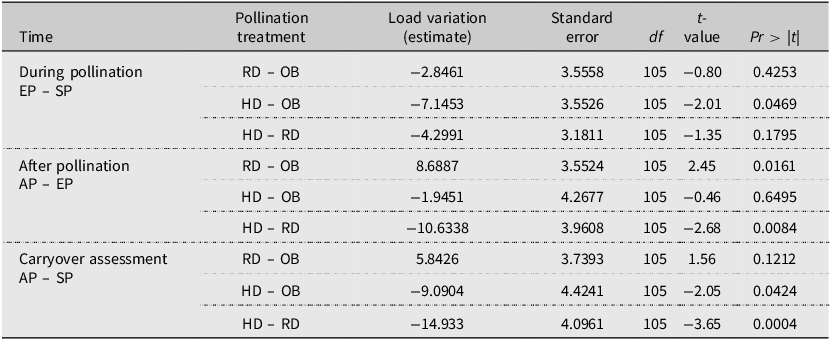
Table 3. Long description
The table presents data on honey bee health parameters across different pollination treatments over time. It includes measurements of colony strength, the proportion of colonies infected with Varroa destructor, and variations in Vairimorpha ceranae loads. The data is pooled from 2022 and 2023. The table has three main sections: during pollination, after pollination, and carryover assessment. Each section lists different pollination treatments and their effects on honey bee health. The columns include time, pollination treatment, load variation estimate, standard error, degrees of freedom, t-value, and the probability of the t-value. Notable trends include significant variations in load estimates for different treatments and times, with some treatments showing higher or lower impacts on honey bee health.
No significant differences between various groups were found in the proportion of infected colonies (F = 0, P = 1).
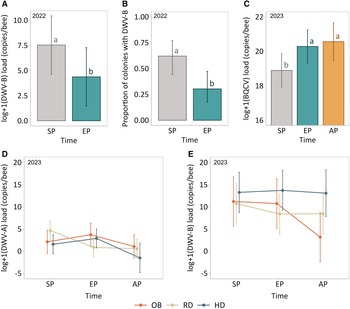
Virology 2022 – Deformed wing viruses A and B were the most prevalent viruses (Supplementary material, Table S2). Our tests detected a higher proportion of colonies infected with deformed wing virus B at SP than at EP. Deformed wing virus B was the only virus for which statistical differences could be established, with significant differences observed between the two time points in both the viral loads (F = 4.71, P = 0.0346; Fig. 3A) and the proportions of infected colonies (F = 7.53, P = 0.0083; Fig. 3B). No significant effect of pollination treatment was detected for either variable. Overall, both load and proportion of infected colonies declined by the end of the pollination period, with a decrease of 32% in the infected colonies.
Variation in honey bee virus load and the proportion of colonies infected over time: A, deformed wing virus B (DWV-B) loads in 2022; B, proportion of colonies infested with DWV-B in 2022; C, black queen cell virus (BQCV) loads in 2023; D, variation in deformed wing virus A (DWV-A) loads in 2023 across pollination treatments; E, variation of DWV-B loads in 2023 across pollination treatments. The model estimated the mean and 95% confidence interval. OB, colonies outside blueberry fields (controls); RD, recommended-density treatment (2.5 colonies/ha); HD, highdensity treatment (5 colonies/ha); SP, start of pollination; EP, end of pollination; AP, after pollination. Statistical differences were assessed by contrasts for D and E (Table 4) and by pairwise comparisons for A, B, and C, where different letters indicate significant differences (P ≤ 0.05).
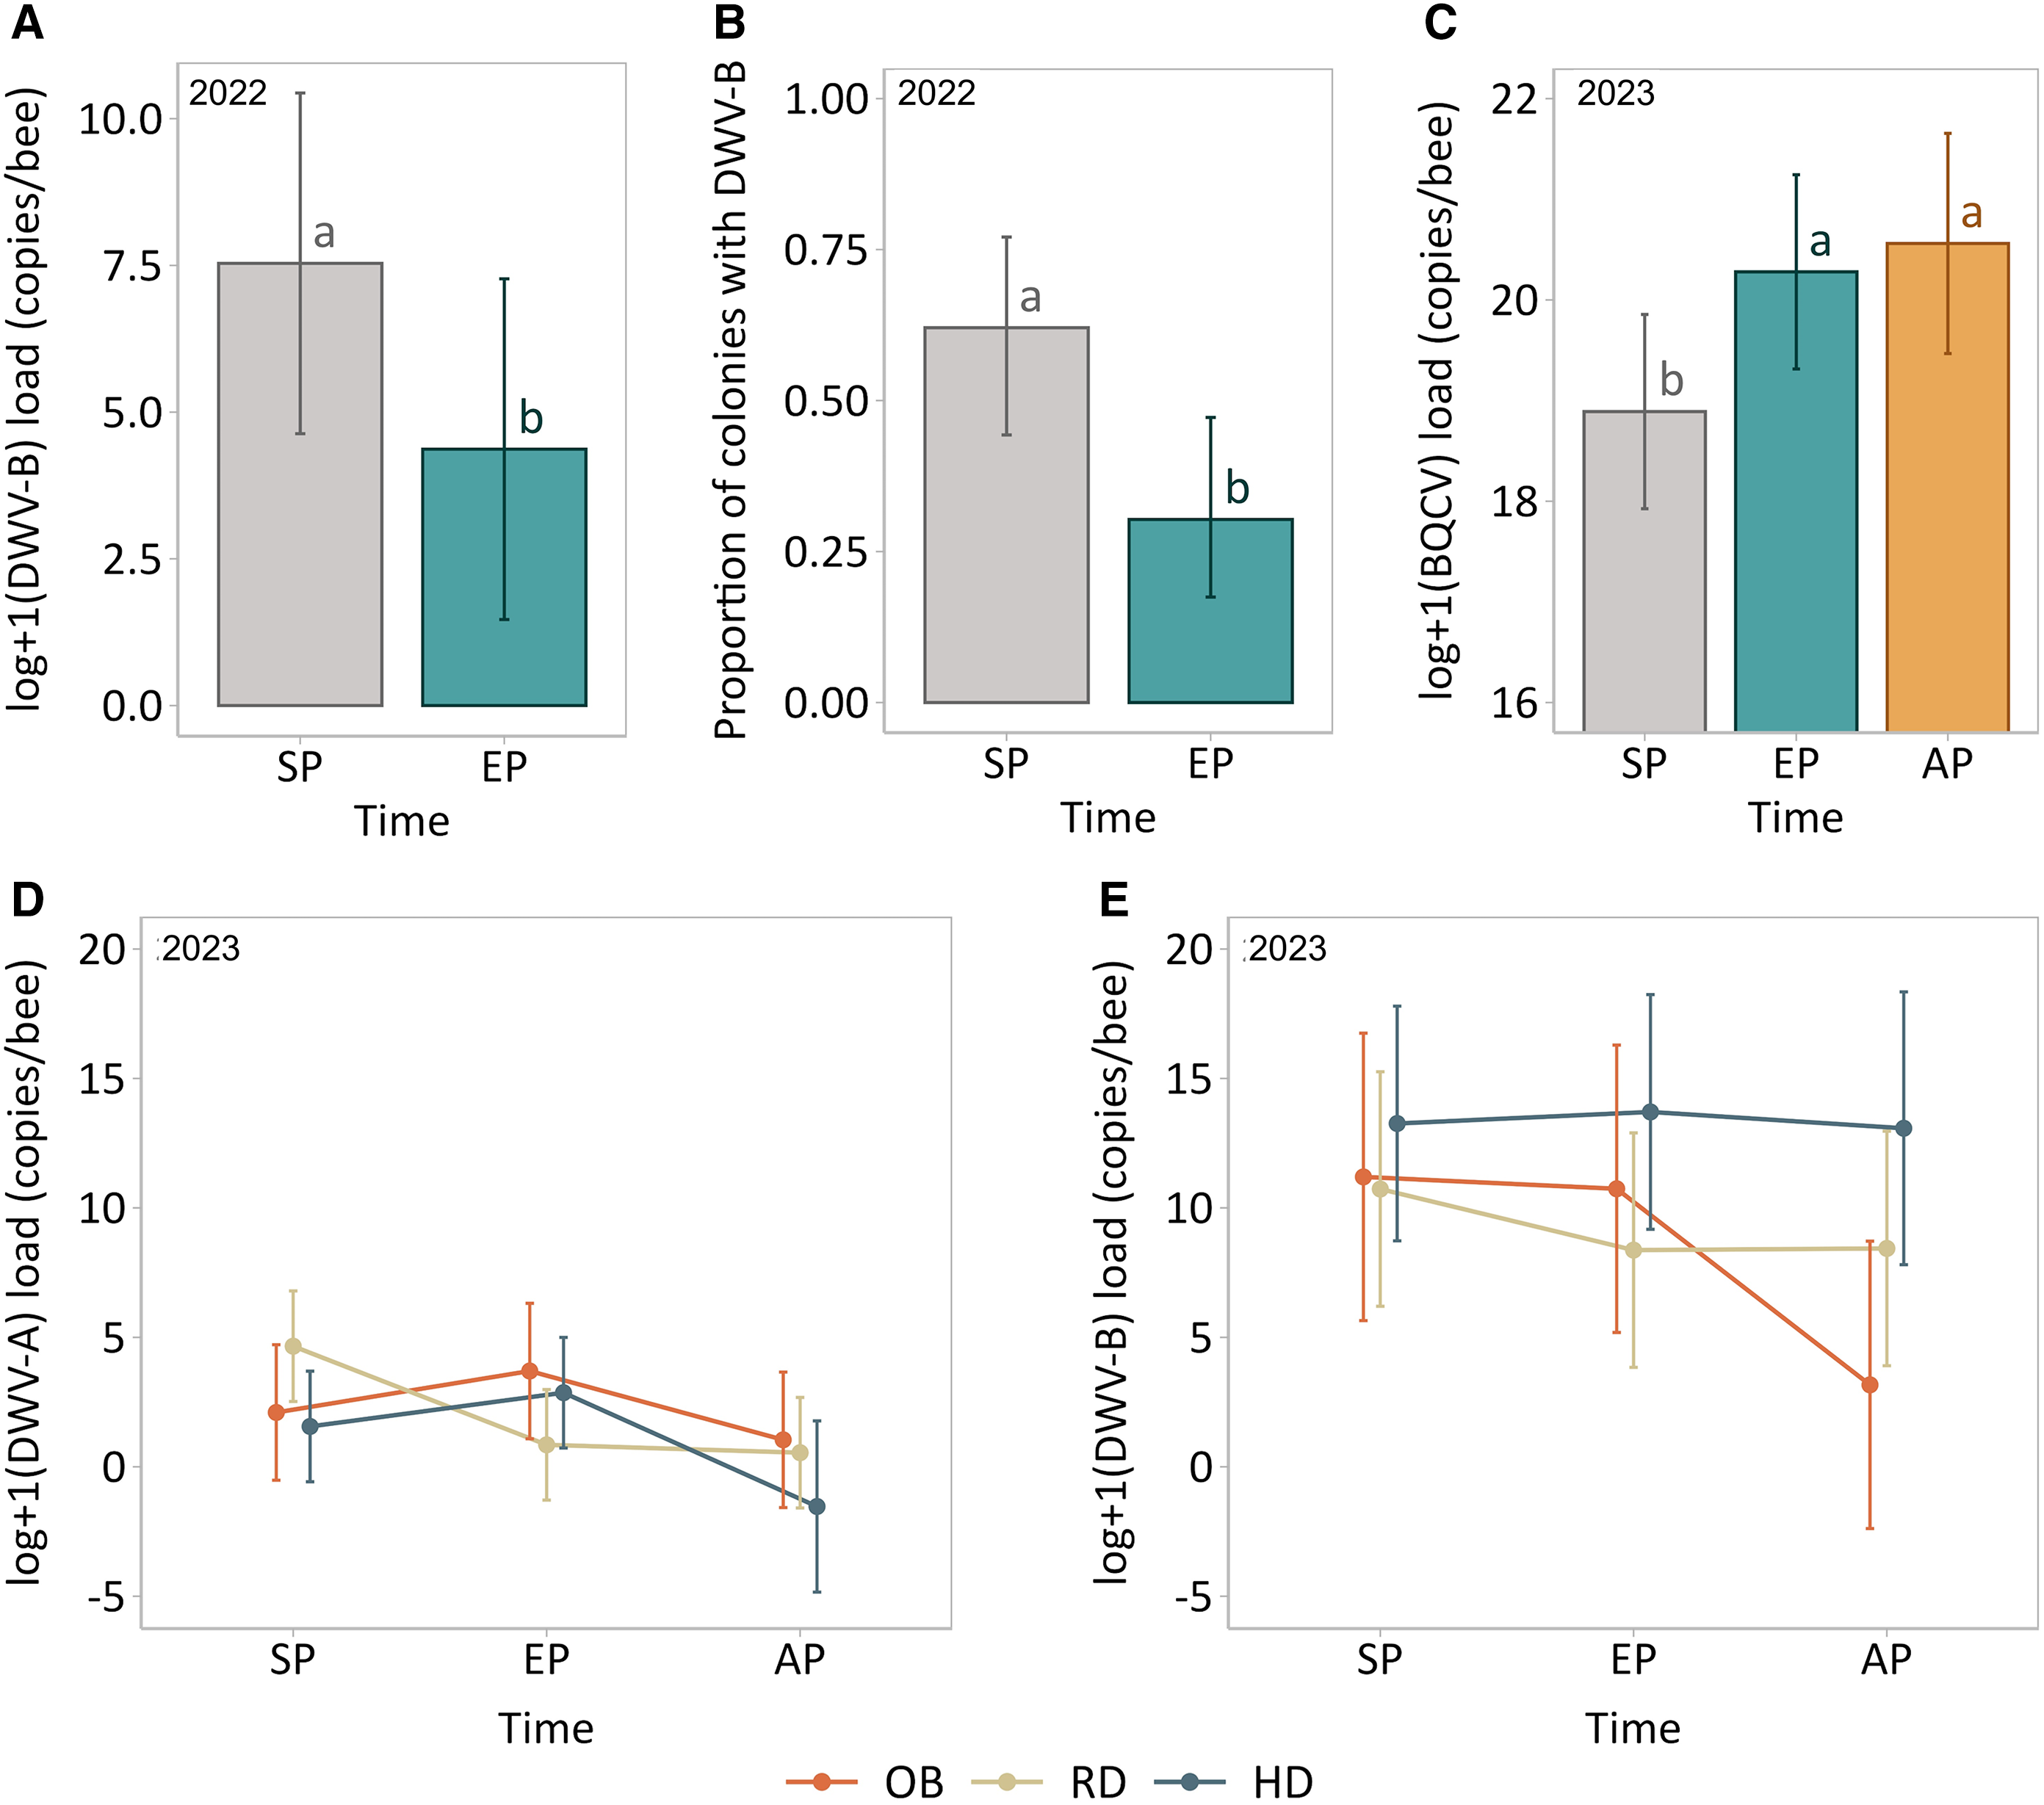
Figure 3. Long description
The image contains five graphs showing virus loads and colony infection proportions in honey bees over time. Graph A shows the deformed wing virus B (DWV-B) loads in 2022, with higher loads at the start of pollination (SP) compared to the end of pollination (EP). Graph B shows the proportion of colonies infected with DWV-B in 2022, with a higher proportion at SP than at EP. Graph C shows the black queen cell virus (BQCV) loads in 2023, with higher loads at the end of pollination (EP) and after pollination (AP) compared to the start of pollination (SP). Graph D shows the variation in deformed wing virus A (DWV-A) loads in 2023 across different pollination treatments, with fluctuations observed over time. Graph E shows the variation in DWV-B loads in 2023 across different pollination treatments, with trends varying by treatment. The model estimated the mean and 95% confidence interval for all graphs. Statistical differences were assessed by contrasts for graphs D and E and by pairwise comparisons for graphs A, B, and C, where different letters indicate significant differences (P ≤ 0.05).
Kashmir bee virus was not detected at any treatment or time point. Acute bee paralysis virus was detected only at SP in only HD colonies. Chronic bee paralysis virus and Israeli acute paralysis virus were absent in control colonies but were detected in 4.2% of RD and HD colonies at SP. The highest proportion of infected colonies with these viruses occurred in RD colonies at EP, where 20.8% tested positive for chronic bee paralysis virus and 8.3% tested positive for Israeli acute paralysis virus (Supplementary material, Table S2).
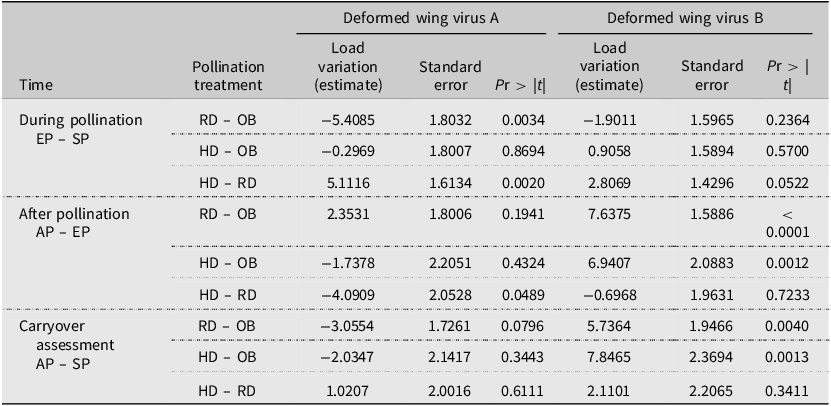
Virology 2023 – A significant interaction between time and pollination treatment was observed for both deformed wing virus A (F = 3.52, P = 0.0097; Fig. 3D) and deformed wing virus B (F = 7.03, P < 0.0001; Fig. 3E) loads (log + 1 transformed). However, the proportion of colonies infected with deformed wing virus A and deformed wing virus B could not be analysed due to model convergence issues, likely caused by the unbalanced distribution of virus presence among replicates within each group (Supplementary material, Table S2). Control colonies and HD colonies showed similar trends, with an increase in viral load at EP followed by a decrease at AP. In contrast, RD colonies showed a general decrease in viral load. Deformed wing virus A did not present significant variations in viral load in carryover assessment (AP – SP) for any treatment. During pollination (EP – SP), significant differences were found when comparing RD to the control colonies (t = –3, P < 0.0034) and RD to HD (t = 3.17, P < 0.002). Doubling colony densities also had an effect after pollination (AP – EP), where deformed wing virus A load in HD colonies decreased more than it did in RD colonies (t = –1.99, P < 0.0489; Table 4).
Contrast used to evaluate deformed wing virus A and B loads in honey bee colonies placed outside blueberry fields and in those placed in lowbush blueberry fields, 2023. The model estimated load variations and standard errors after a log + 1 transformation. OB, colonies outside blueberry fields (controls); RD, recommended-density treatment (2.5 colonies/ha); HD, high-density treatment (5 colonies/ha); SP, start of pollination; EP, end of pollination; AP, after pollination.
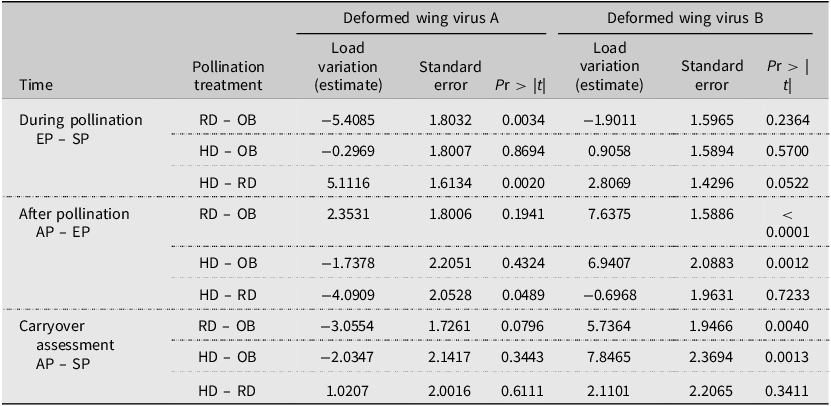
Table 4. Long description
The table presents data on the variation in honey bee virus loads across different pollination treatments and times. It includes columns for time, pollination treatment, deformed wing virus A load variation with estimates, standard error, and Pr > |t|, as well as deformed wing virus B load variation with estimates, standard error, and Pr > |t|. The table has 12 rows and 8 columns. Key trends include significant variations in virus loads during and after pollination, with notable differences in load variations for different treatments. For instance, during pollination, the RD-OB treatment shows a significant decrease in deformed wing virus A load, while the HD-RD treatment shows an increase. After pollination, the AP-EP treatment shows a significant increase in deformed wing virus A load. The carryover assessment indicates variations in virus loads for different treatments, with the AP-SP treatment showing a significant decrease in deformed wing virus A load.
Deformed wing virus B load decreased in the carryover assessment (AP – SP) in control colonies (outside blueberry fields) compared to those in RD and HD colonies (t = 2.95, P = 0.0040 and t = 3.31, P = 0.0013, respectively). This trend is mainly due to the reduction in viral load after the pollination period (AP – EP; t = 4.81, P < 0.0001 for RD – OB, and t = 3.32, P = 0.0012 for HD – RD; Table 4). Doubling colony densities had no effect on the deformed wing virus B load.
Significant differences in black queen cell virus load were observed across time points (F = 8.11, P = 0.0005), with no effect of pollination treatment (Fig. 3C). An increase in black queen cell virus load was detected at both the end (EP) and after pollination (AP) across all treatment groups (RD, HD, and OB controls). The proportion of colonies infected with black queen cell virus was not analysed because this variable showed no variability: black queen cell virus was detected in 100% of colonies across all time points and treatments evaluated (Supplementary material, Table S2).
Other diseases – American foulbrood was not detected. Infections by European foulbrood or chalkbrood were low, with no discernable trends. No infections were recorded at AP in any pollination treatment. Due to a high proportion of 0 values in the dataset, American foulbrood, European foulbrood, and chalkbrood could not be analysed statistically. Instead, the mean proportion of infected colonies for each disease was calculated (Supplementary material, Table S3). Data from both 2022 and 2023 were combined for this analysis, comprising a total of 433 colonies evaluated.
Pesticides analyses in bee bread and nectar
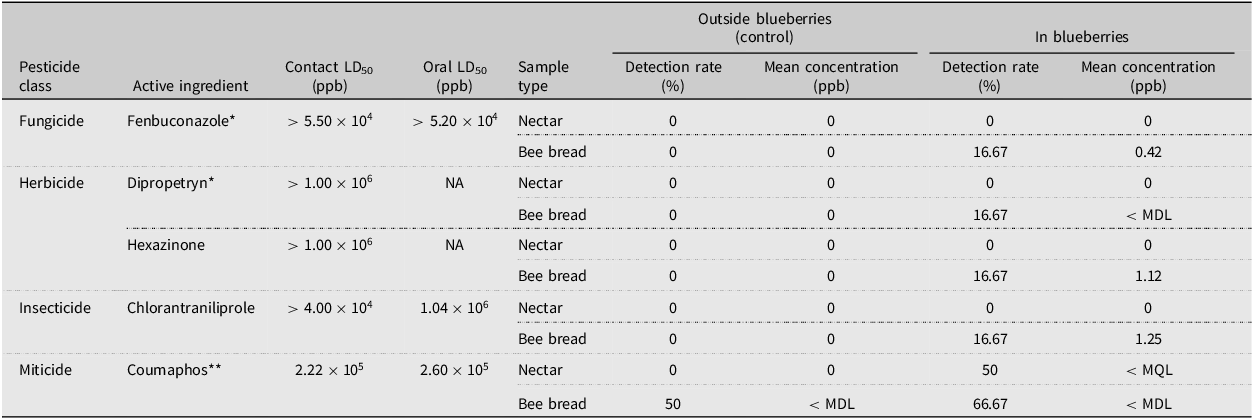
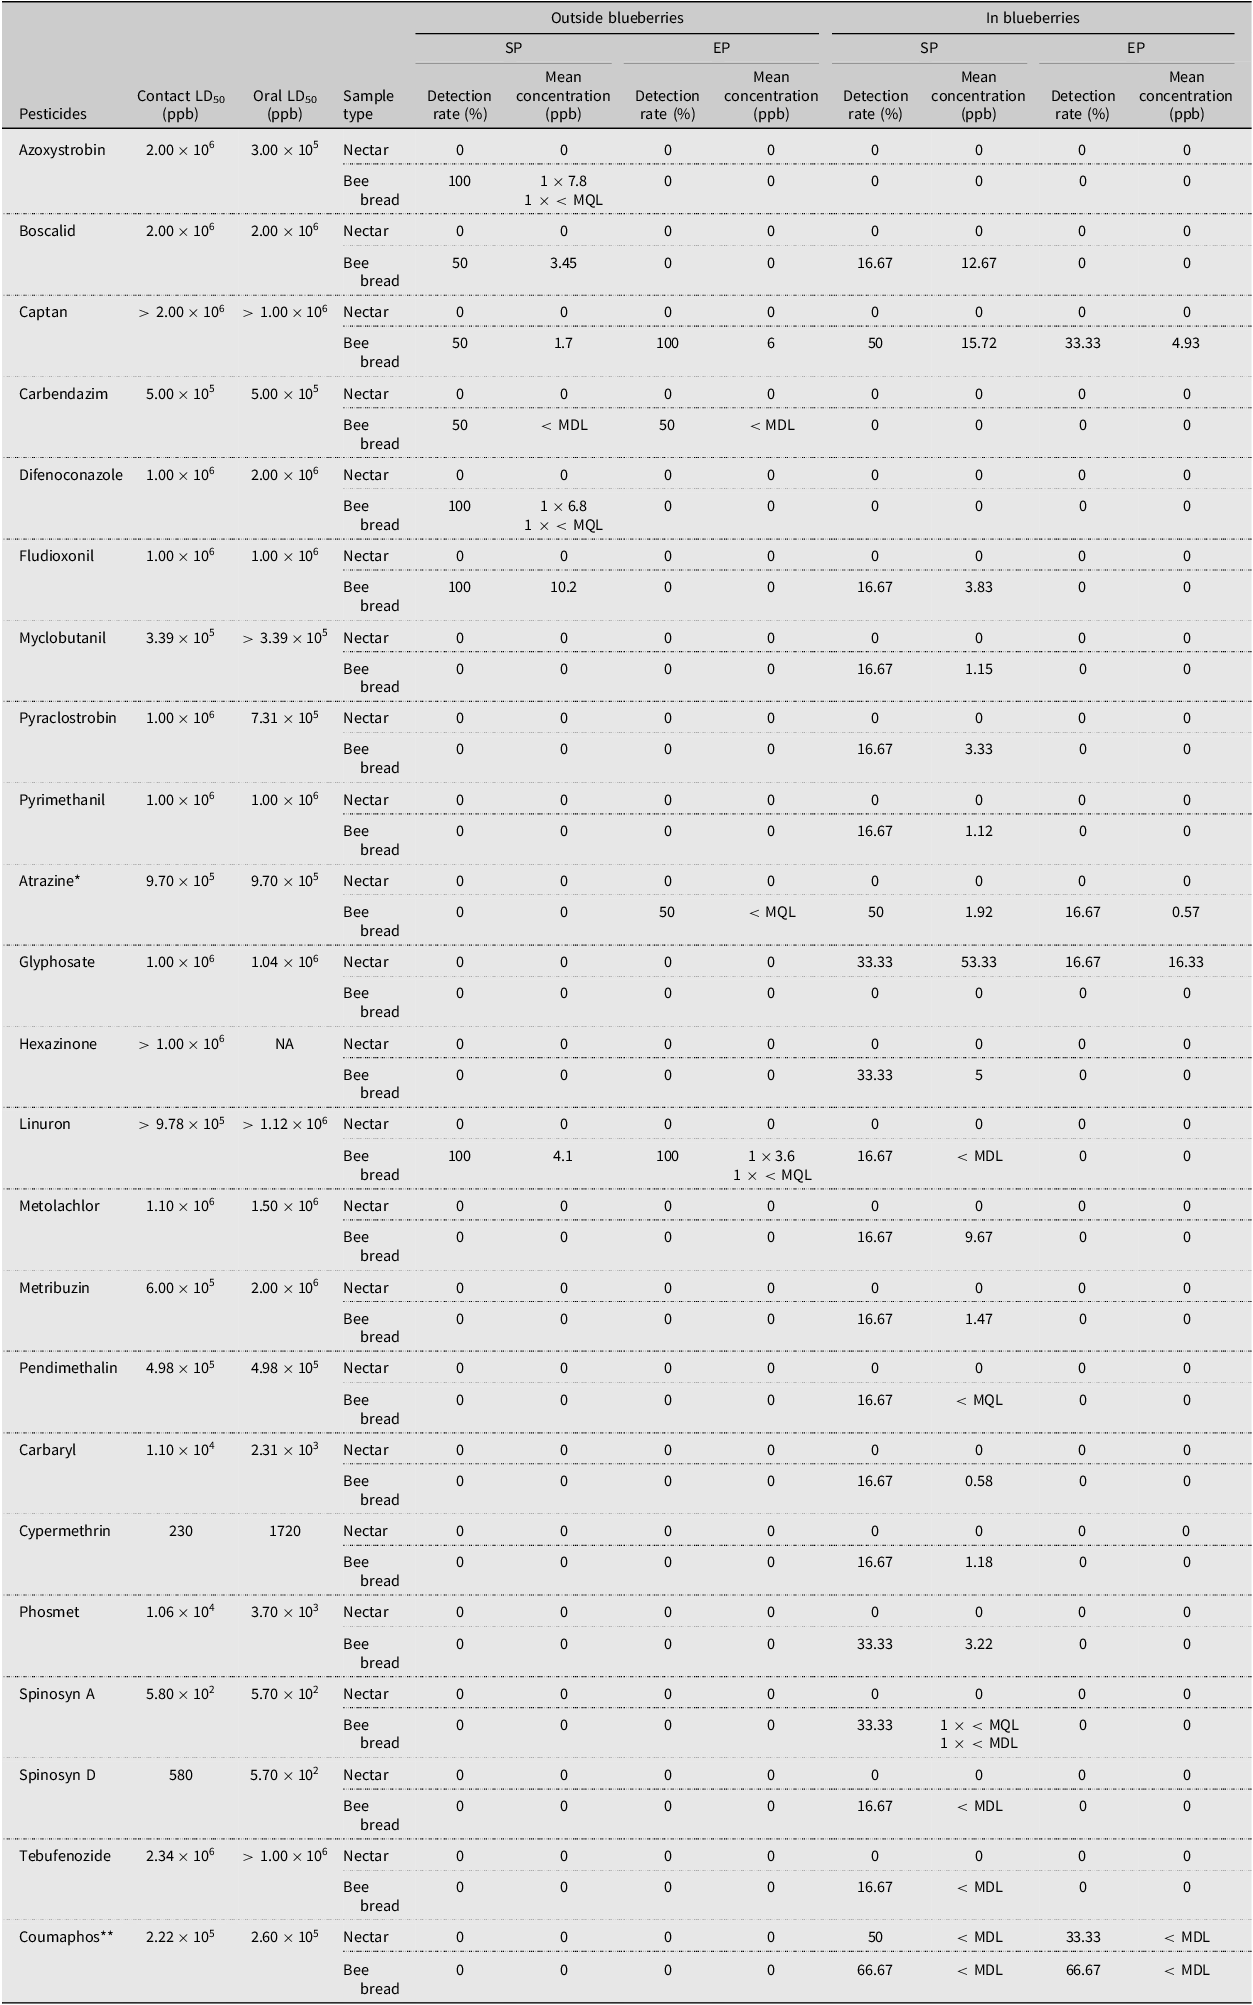
In 2022, coumaphos was the most frequently detected active ingredient in both nectar and bee bread in control colonies and in those placed in blueberry fields (Table 5). In 2023, pesticide profiles varied by pollination treatment. In control colonies, residues were dominated by fungicides such as azoxystrobin, captan, difenoconazole, and fludioxonil, along with herbicides linuron and atrazine (Table 6). Fludoxinil and linuron exhibited the highest average concentrations in control colonies.
Pesticide detected in nectar and bee bread at end of pollination (EP) in 2022 in honey bee colonies placed outside blueberry fields (n = 1; control) and in those placed in blueberry fields (n = 6). DR, detection rate; LD50, lethal dose 50%; MC, mean concentration (ppb/location); NA, unknown honey bee LD50; < MQL, less than the minimum quantification limit; < MDL, less than the minimum detection limit; ppb, parts per billion. References for honey bee LD50 values: Chmiel et al. (Reference Chmiel, Daisley, Pitek, Thompson and Reid2020), University of Hertfordshire (2024).
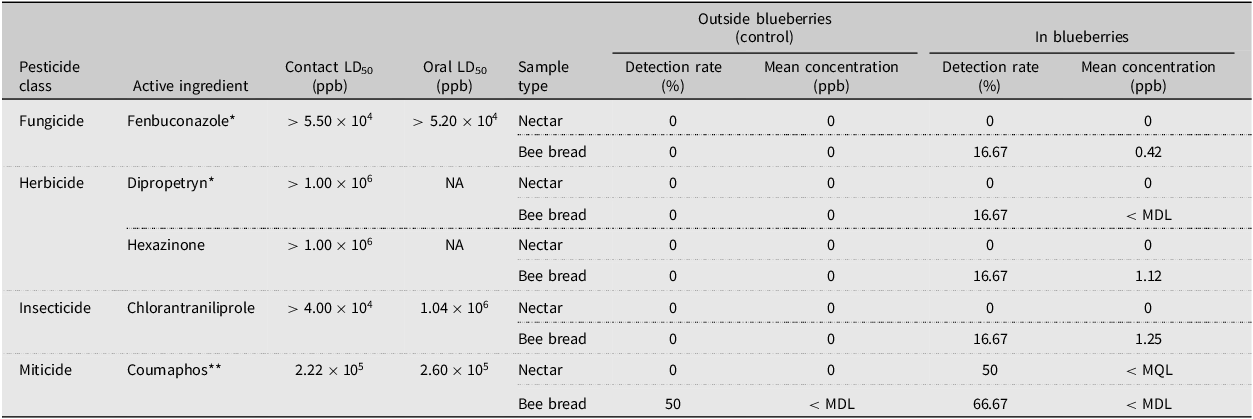
Table 5. Long description
The table presents data on pesticide detection in nectar and bee bread from honey bee colonies placed outside and inside blueberry fields in 2022. It includes columns for pesticide class, active ingredient, contact and oral LD50 values, sample type, and detection rates and mean concentrations outside and inside blueberry fields. The table has seven rows and nine columns. Notable pesticides include fenbuconazole, dipropetryn, hexazinone, chlorantraniliprole, and coumaphos. Detection rates and concentrations vary by pesticide and sample type, with coumaphos being the most frequently detected.
*Active ingredient not approved for blueberry management in Canada; **active ingredient used for Varroa destructor control.
Pesticide detected in nectar and bee bread at start of pollination and end of pollination in 2023 in honey bee colonies placed outside blueberry fields (n = 2; controls) and in those placed in blueberry fields (n = 6). RD, recommended-density treatment (2.5 colonies/ha); HD, high-density treatment (5 colonies/ha); SP, start of pollination; EP, end of pollination; AP, after pollination; mean concentration (parts per billion (ppb)/location); LD50, lethal dose 50%; NA, unknown honey bee LD50; < MQL, less than the minimum quantification limit; < MDL, less than the minimum detection limit. References for honey bee LD50 values: Chmiel et al. (Reference Chmiel, Daisley, Pitek, Thompson and Reid2020), University of Hertfordshire (2024), Agence national de sécurité sanitaire de l’alimentation, de l’environnement et du travail (2025), United States Environmental Protection Agency (2012).
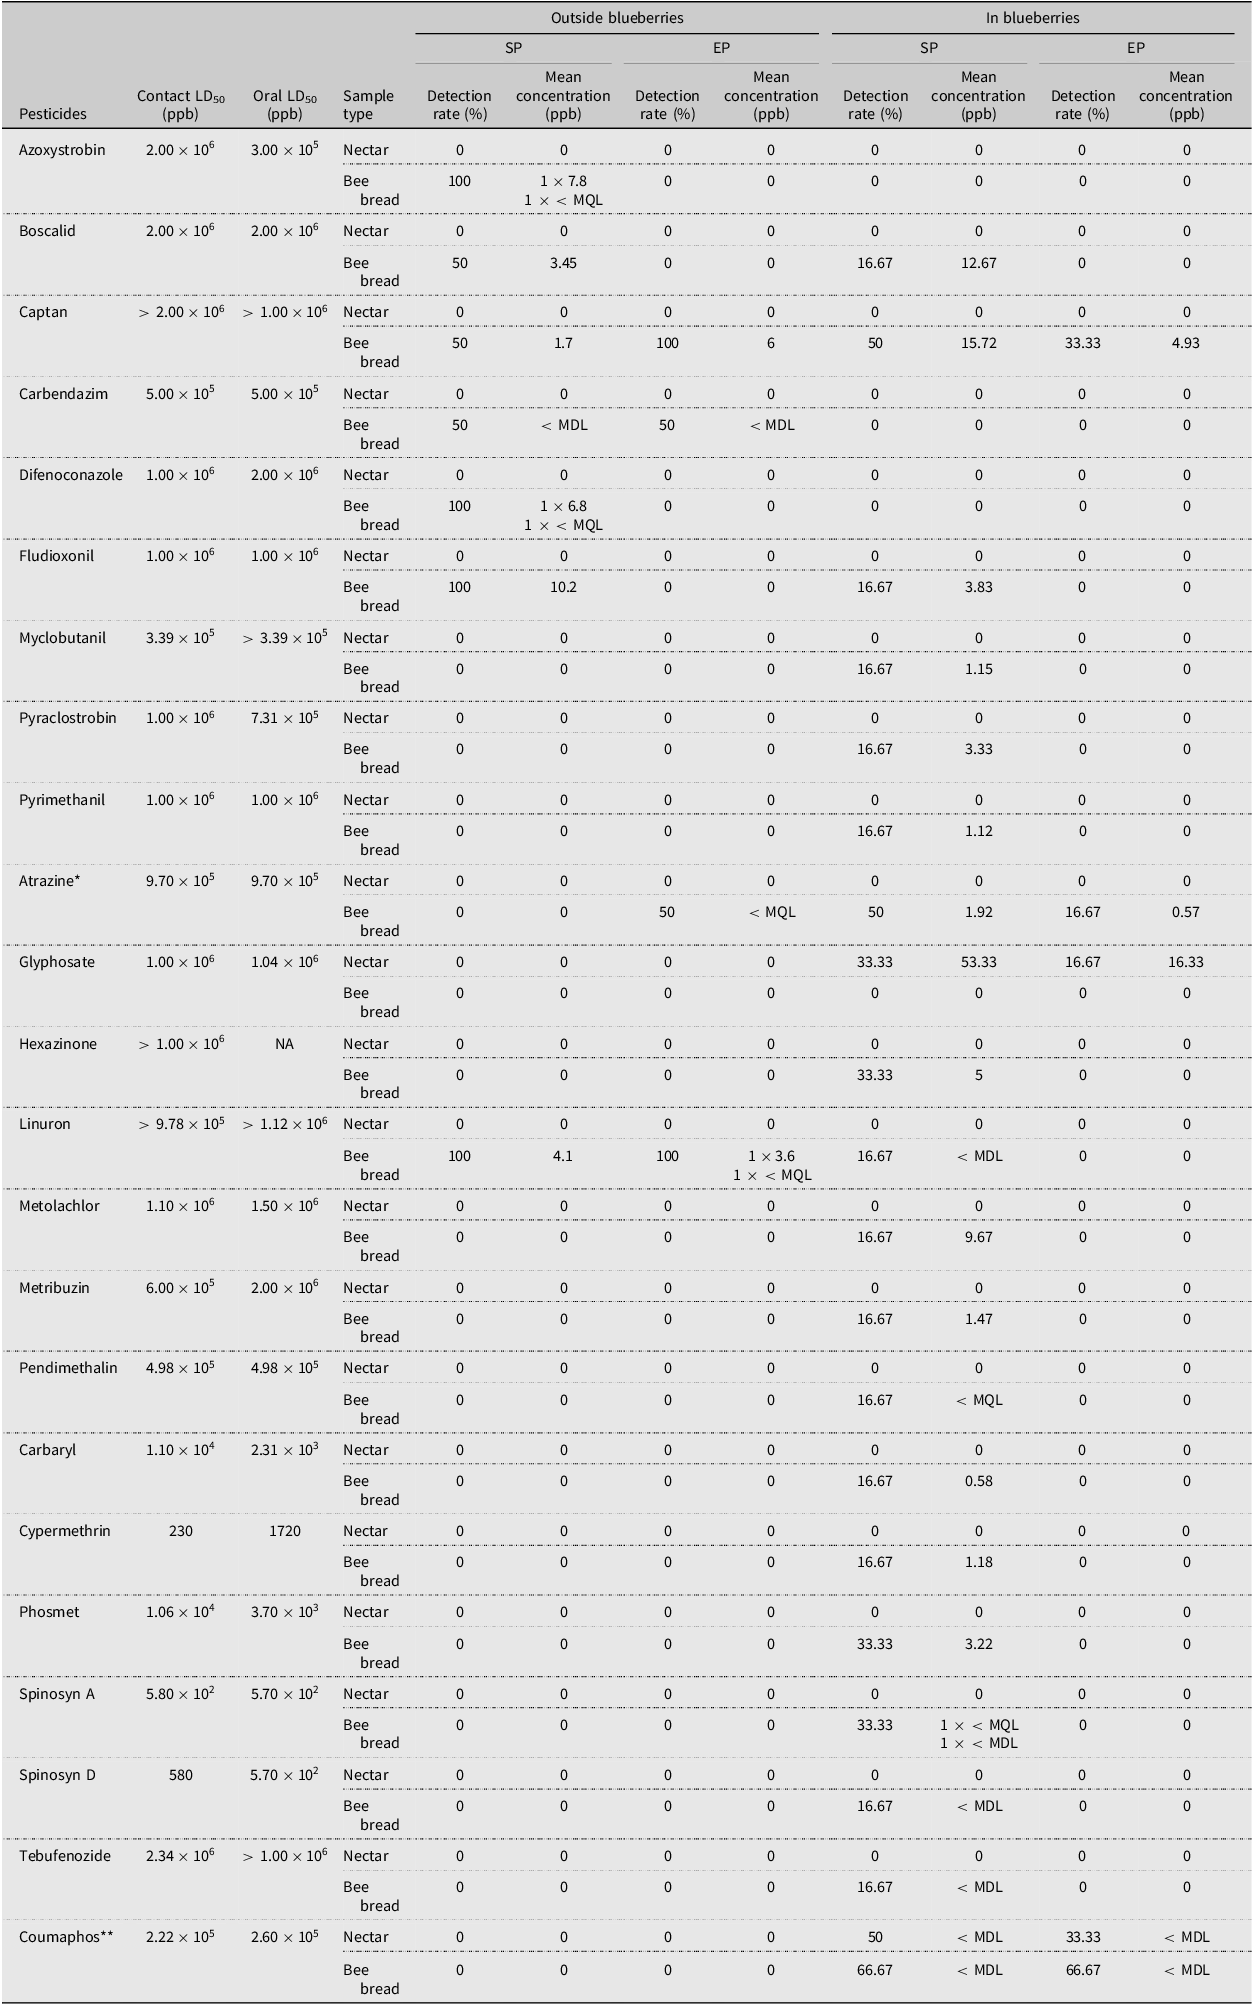
Table 6. Long description
The table presents data on pesticide detection in nectar and bee bread at sampling points SP and EP in 2023. It compares honey bee colonies placed outside blueberry fields (controls) and those placed in blueberry fields. The table includes contact and oral LD50 values, sample types, detection rates, and mean concentrations for various pesticides. Notable pesticides include azoxystrobin, boscalid, captan, carbendazim, difenoconazole, fludioxonil, myclobutanil, pyraclostrobin, pyrimethanil, atrazine, glyphosate, hexazinone, linuron, metolachlor, metribuzin, pendimethalin, carbarryl, cypermethrin, phosmet, spinosyn A, spinosyn D, tebufenozide, and coumaphos. The data highlights the frequency and concentration of these pesticides in different sample types and locations.
*Active ingredient not approved for blueberry management in Canada; **active ingredient used for Varroa destructor control.
In colonies used for blueberry pollination, coumaphos was the most frequently detected active ingredient. Herbicides such as atrazine, glyphosate, and hexazinone were common, captan was the most prevalent fungicide, and phosmet and spinosad A were the most frequently detected insecticides. Among all detected compounds, glyphosate and captan had the highest average concentrations in colonies located in blueberry fields. In both years of the study, no active ingredient was detected at a mean concentration exceeding its contact or oral lethal dose for bees, either in control colonies or in those placed in blueberry fields.
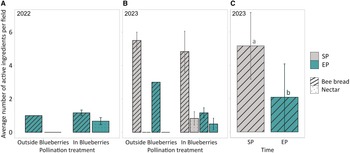
In 2022, the average number of active ingredients detected in bee bread per apiary was similar between colonies located outside blueberry fields and those located in blueberry fields, with means of 1.0 and 1.2, respectively (Fig. 4A). Pesticide diversity was greater in colonies placed in blueberry fields. Specifically, these colonies were exposed to five different active ingredients detected in bee bread and nectar, compared to one active ingredient in colonies outside the blueberry fields (Table 5).
Average number of active ingredients detected in nectar and bee bread from honey bee colonies placed outside blueberries and in lowbush blueberry fields: A, in 2022; B, 2023; C, statistical analysis was performed only in 2023 and showed significant differences over time in bee bread samples, regardless of pollination treatment. The model estimated means ± standard errors. Different letters indicate statistical differences (P ≤ 0.05). Samples were collected from each colony and pooled from colonies located outside blueberry fields (2022: n = 1; 2023: n = 2) and colonies located in blueberries (n = 6; controls). Sampling occurred at the end of pollination (EP) in 2022 and at both the start (SP) and end (EP) of pollination in 2023.
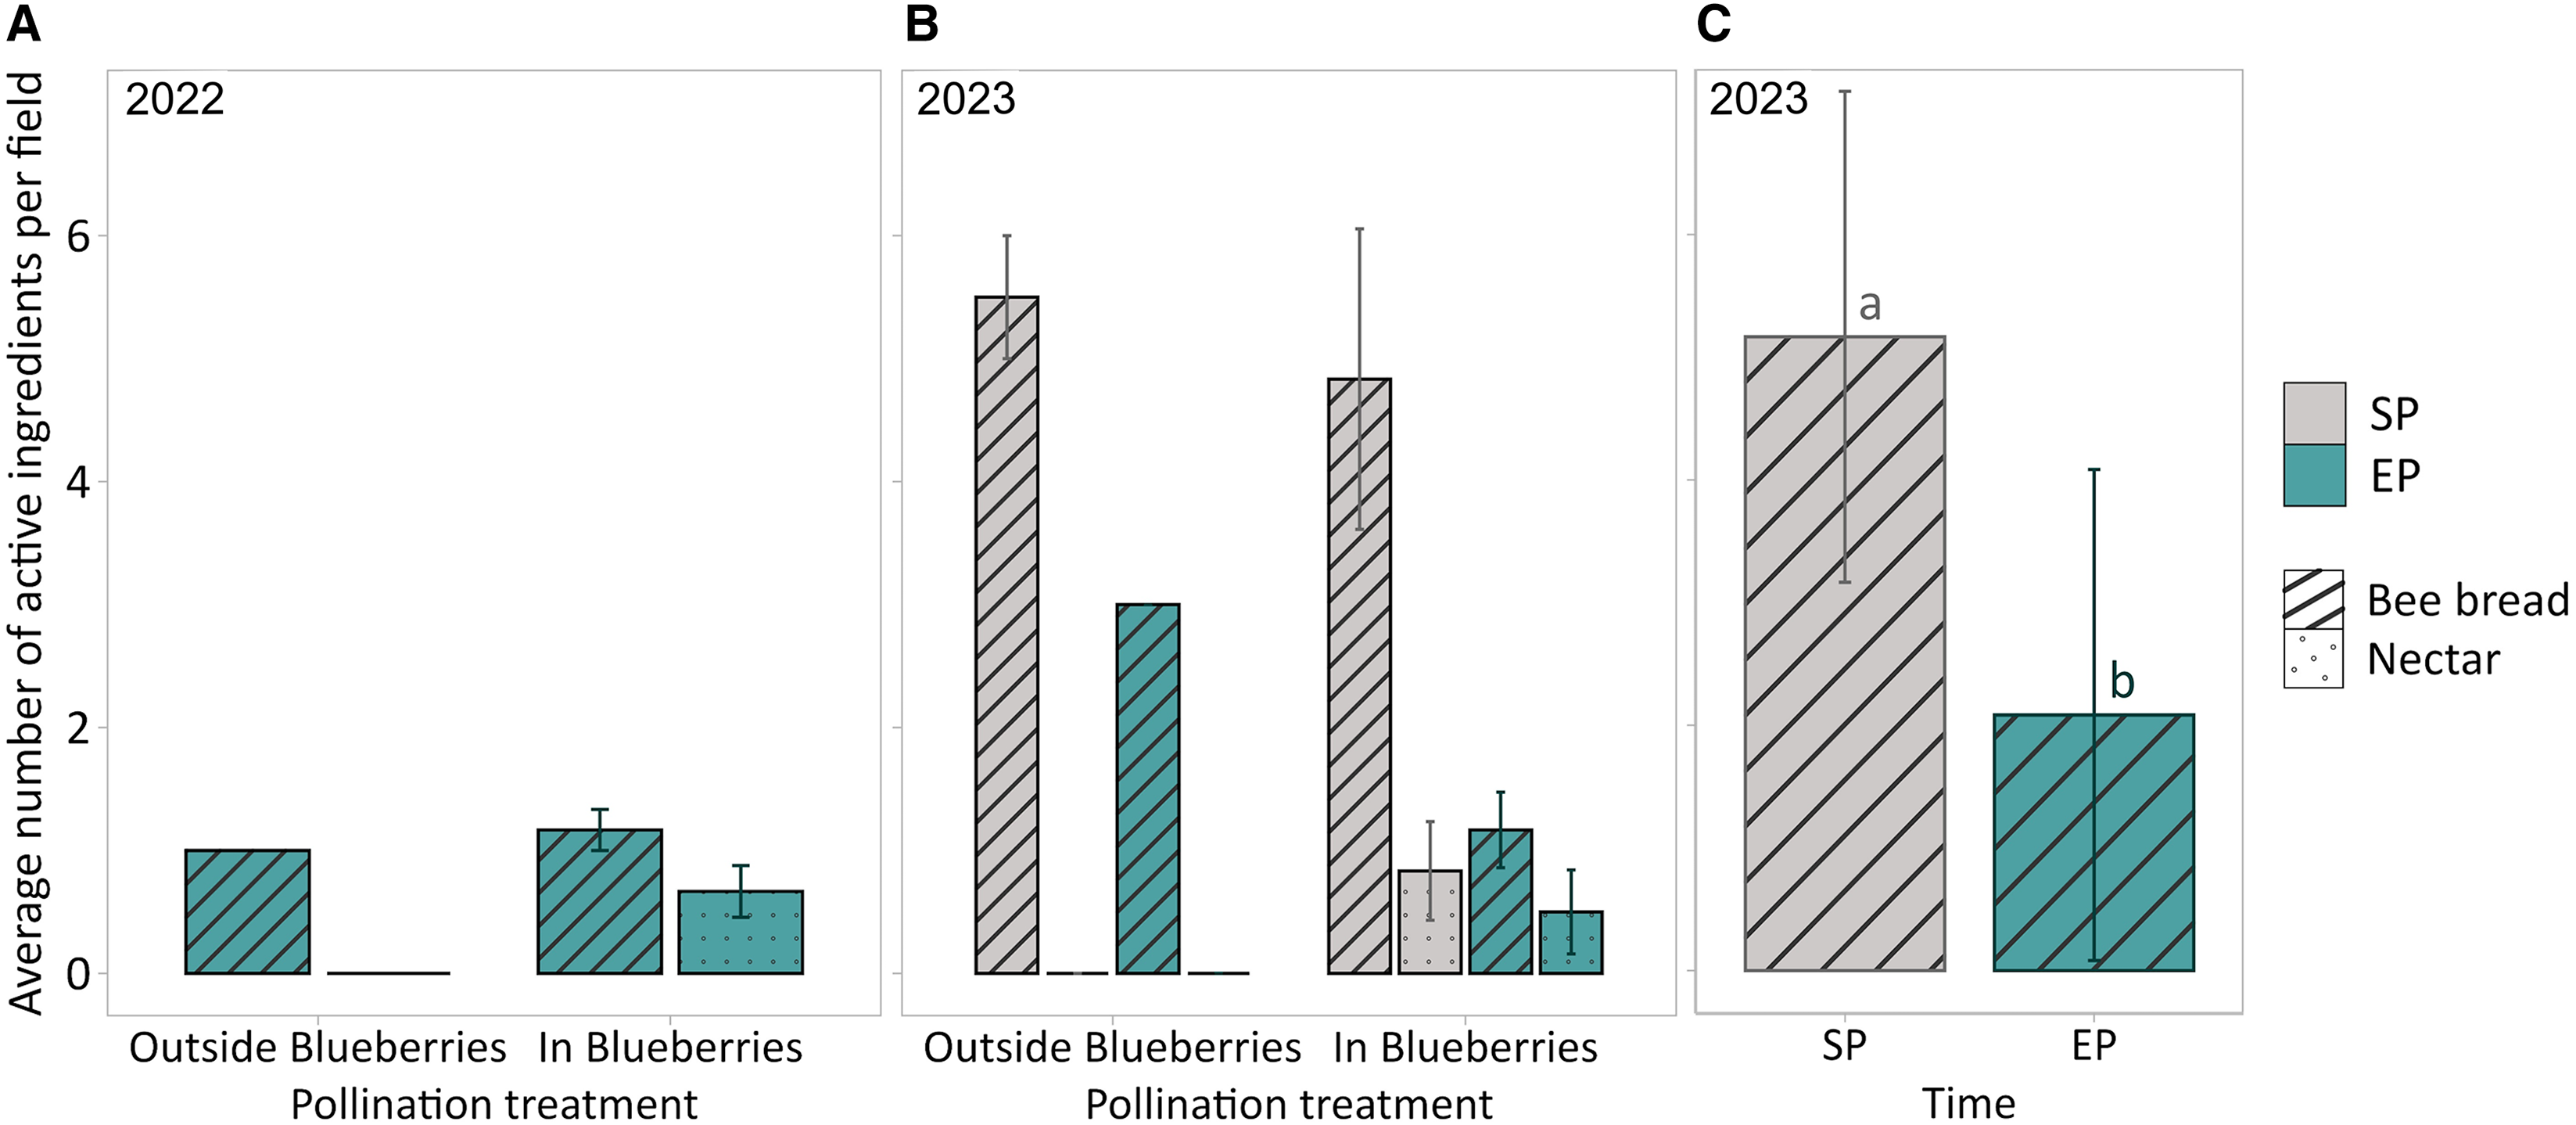
Figure 4. Long description
The bar graph compares the average number of active ingredients detected in nectar and bee bread from honey bee colonies placed outside blueberries and in lowbush blueberry fields. The x-axis represents the pollination treatment and time periods, while the y-axis represents the average number of active ingredients per field. The graph includes data for 2022 and 2023, with separate bars for nectar and bee bread. In 2022, the data shows low values for both outside and in blueberries. In 2023, the values are higher, with significant differences observed over time in bee bread samples, regardless of pollination treatment. The graph uses a color scheme to differentiate between start of pollination (SP) and end of pollination (EP), with bee bread and nectar represented by different patterns. Statistical analysis indicates significant differences over time in bee bread samples, with different letters marking statistical differences. All values are approximated.
In 2023, the average number of active ingredients detected per apiary in bee bread remained similar between colonies outside blueberry fields and those in blueberry fields (5.5 and 4.8, respectively, at SP and 3.0 and 1.2, respectively, at EP; Fig. 4B). However, the total diversity of pesticides differed across all apiaries. At SP, control colonies contained seven different active ingredients, whereas those in the blueberry fields contained 19 active ingredients (Table 6). By EP, four active ingredients were found in control colonies and three were found in blueberry field colonies.
In 2023, the average number of active ingredients per apiary in nectar did not differ significantly by time point or pollination treatment (F = 0.75, P < 0.4198). However, the average number of active ingredients was reduced considerably in bee bread samples at EP (F = 6.60, P = 0.0424), with no significant effect of pollination treatment (Fig. 4C).
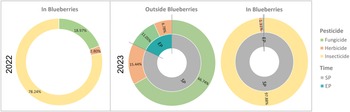
In both years, total contact hazard quotient values remained below 1 at all time points, indicating low immediate risk. In 2022, contact hazard quotient in control colonies was 0, whereas colonies in blueberry fields had a minimal contact hazard quotient of 2.00 × 10⁻⁸. Within the blueberry fields, 78.2% of the risk was attributed to insecticides, with fungicides contributing 19.0% of the risk (Fig. 5).
Percentage contribution of fungicides, herbicides, and insecticides to the average contact hazard quotients (HQ) associated with the pollination of lowbush blueberry fields compared to colonies outside blueberry fields at the start of pollination (SP) and at the end of pollination (EP). In 2022, the risk was only assessed at SP for colonies placed in blueberry fields. In 2023, assessment included both SP and EP for colonies located outside and in blueberry fields.
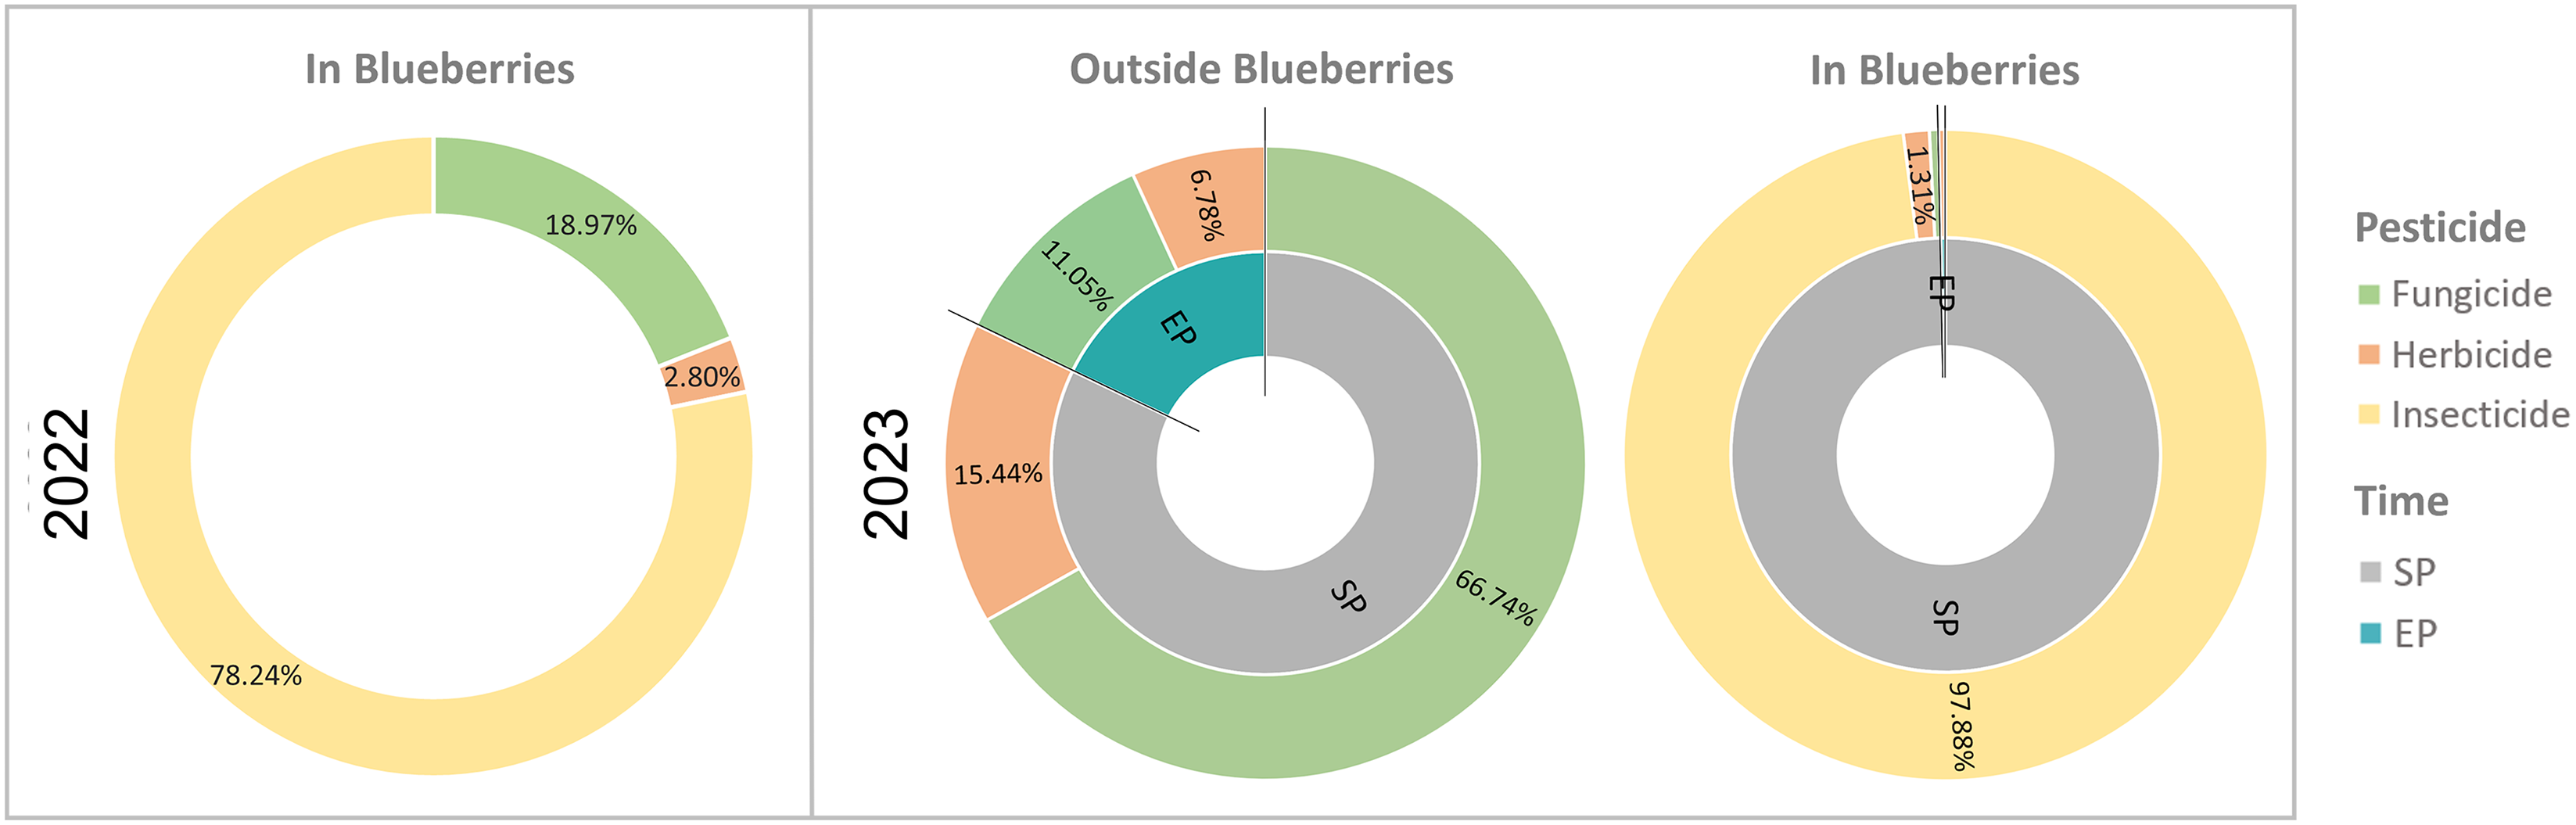
Figure 5. Long description
The donut chart consists of three segments for the year 2022 and six segments for the year 2023. In 2022, the chart shows the percentage contribution of fungicides, herbicides, and insecticides to the average contact hazard quotients for colonies placed in blueberry fields at the start of pollination. Fungicides contribute 18.97 percent, herbicides contribute 2.80 percent, and insecticides contribute 78.24 percent. In 2023, the chart shows the percentage contribution for colonies both inside and outside blueberry fields at the start of pollination and the end of pollination. For colonies outside blueberries, fungicides contribute 11.05 percent, herbicides contribute 15.44 percent, and insecticides contribute 66.74 percent at the start of pollination. At the end of pollination, fungicides contribute 6.78 percent, herbicides contribute 11.05 percent, and insecticides contribute 66.74 percent. For colonies inside blueberries, fungicides contribute 1.31 percent, herbicides contribute 0 percent, and insecticides contribute 97.88 percent at the end of pollination. The chart uses different colors to represent fungicides, herbicides, and insecticides, with a legend indicating these colors.
In 2023, contact hazard quotient values increased significantly in both production systems. The contact hazard quotient rose to 0.0028 per field for colonies pollinating blueberry fields. Most (99.6%) of this risk occurred during the SP period, when insecticides accounted for 97.9% and herbicides for 1.3% of contact hazard risk. The EP period contributed only 0.4% of the total risk, predominantly from herbicides (0.3%; Fig. 5). For control colonies, the contact hazard quotient was 1.36 × 10⁻⁵ per field. Of this, 82.2% was associated with the SP period, and 17.8% was associated with the EP period. Risk during both SP and EP periods was primarily driven by fungicides and herbicides, contributing 66.7% and 15.4% at SP and 11.1% and 6.8% at EP, respectively (Fig. 5). The results from the Tier 1 risk quotient assessment revealed that all risk quotient values remained below the established threshold of 0.4 (Supplementary material, Table S4).
Discussion
This study addressed two main research questions: (1) which colony health parameters are affected by lowbush blueberry pollination? and (2) does increasing colony density per hectare influence these parameters? Overall, our results show that the most significantly affected colony health parameters during lowbush pollination included colony strength, the proportion of colonies infested with Varroa mites, and the viral loads of black queen cell virus and deformed wing virus B. These impacts were more pronounced as carryover effects measured after pollination. Pathogen levels of Vairimorpha, deformed wing virus A, and chalkbrood decreased after pollination, showing no evidence of carryover effects regardless of the year or pollination treatment.
Colony strength
Colony strength is widely recognised as a key indicator of honey bee health in pollination systems, including in blueberry cultivation (Miranda et al. Reference Miranda, Bicout, Botner, Butterworth, Calistri and Depner2016). In the present study, colonies involved in blueberry pollination showed a lower gain in strength than those used for honey production. These results are consistent with previous studies that reported reductions in brood production during lowbush blueberry pollination (Girard et al. Reference Girard, Chagnon and Fournier2012; Dufour et al. Reference Dufour, Fournier and Giovenazzo2020a), a trend also observed in highbush blueberries (Grant et al. Reference Grant, DeVetter and Melathopoulos2021). Girard et al. (Reference Girard, Chagnon and Fournier2012) found reduced brood development in colonies pollinating lowbush blueberries, and Dufour et al. (Reference Dufour, Fournier and Giovenazzo2020a) reported a decreased capped brood number as a carryover effect one month after pollination. Drummond et al. (Reference Drummond, Lund and Eitzer2021) noted year- and location-specific variations in brood development during lowbush blueberry pollination, influenced by Varroa infestation levels, with a 32% brood reduction. Although the present study did not directly assess brood population, these findings of those previous studies support our observation of the reduced strength gain in colonies pollinating lowbush blueberries compared to the control colonies outside of blueberries.
Nutritional deficiency can impair colony development during the pollination period (Dufour et al. Reference Dufour, Fournier and Giovenazzo2020a) and has been proposed to explain brood reductions during lowbush blueberries pollination. Nutrient-poor conditions, especially in large, intensively managed fields with rigorous weed control, can reduce queen egg-laying rates (Girard et al. Reference Girard, Chagnon and Fournier2012; Dufour et al. Reference Dufour, Fournier and Giovenazzo2020b). The protein content in blueberry pollen (9.8–13%) is less than the optimal requirement for bee colonies (~20%; Huber Reference Huber2016; Colwell et al. Reference Colwell, Williams, Evans and Shutler2017; Dufour et al. Reference Dufour, Fournier and Giovenazzo2020b). This deficiency can lead to reduced brood production and delayed colony development following pollination (Dufour et al. Reference Dufour, Fournier and Giovenazzo2020a).
Varroa destructor – Although Varroa infestation rates in the present study never exceeded the established treatment threshold of two mites per 100 honey bees (Ministère de l’Agriculture, des Pêcheries et de l’Alimentation du Québec 2024), we observed a notable carryover increase in mite populations and a higher proportion of colonies infested among those used for blueberry pollination. Infestation rates approached the treatment threshold, particularly in HD fields, where values reached 2.0 mites per 100 bees, compared to 0.6 in RD fields. This increase coincided with the period of lowest colony strength gain and a marked rise in the proportion of infested colonies, especially under HD conditions. Our findings differ from those of Dufour et al. (Reference Dufour, Fournier and Giovenazzo2020a), who reported no carryover increase in Varroa infestation among colonies pollinating lowbush blueberries. However, Drummond et al. (Reference Drummond, Lund and Eitzer2021) identified Varroa as a key predictor of colony performance, finding that 57.8% of the variance in colony growth rate was explained by Varroa infestation rates and pesticide risk (as measured by hazard quotient for pollen). Drummond et al. (Reference Drummond, Lund and Eitzer2021) emphasised the role of Varroa not only as a stand-alone threat but also as a vector that exacerbates the impact of other pathogens. Parasitised bees are known to emerge with reduced body weight (Yang and Cox-Foster Reference Yang and Cox-Foster2007) and show lower survivorship and lifespan (Yang and Cox-Foster Reference Yang and Cox-Foster2007; Reyes-Quintana et al. Reference Reyes-Quintana, Espinosa-Montaño, Prieto-Merlos, Koleoglu, Petukhova, Correa-Benítez and Guzman-Novoa2019). In addition, Varroa infestation impairs immune function and protein synthesis, which compromises growth and overall colony development (Aronstein et al. Reference Aronstein, Saldivar, Vega, Westmiller and Douglas2012; Reyes-Quintana et al. Reference Reyes-Quintana, Espinosa-Montaño, Prieto-Merlos, Koleoglu, Petukhova, Correa-Benítez and Guzman-Novoa2019). These same physiological effects likely contributed to the reduced strength gain and health parameters observed in colonies exposed to blueberry pollination in the present study.
Vairimorpha ceranae – In the present study, the predominant Vairimorpha species detected was V. ceranae, consistent with findings from previous research conducted in Quebec and across Canada (Copley et al. Reference Copley, Chen, Giovenazzo, Houle and Jabaji2012; Emsen et al. Reference Emsen, Guzman-Novoa, Hamiduzzaman, Eccles, Lacey, Ruiz-Pérez and Nasr2016; Shaw et al. Reference Shaw, Cutler, Manning, McCallum and Astatkie2022). Contrary to earlier studies that reported increases in V. ceranae levels during lowbush blueberry pollination (Dufour et al. Reference Dufour, Fournier and Giovenazzo2020a; Drummond et al. Reference Drummond, Lund and Eitzer2021), our results indicated a general decline over time, particularly in colonies placed in HD blueberry fields. Dufour et al. (Reference Dufour, Fournier and Giovenazzo2020a) reported peak spore loads reaching 4.5 × 10⁶ spores/bee during pollination and 6 × 10⁶ spores/bee in post-pollination assessments. In contrast, although HD colonies in the present study exceeded the commonly cited treatment threshold of 1 × 10⁶ spores/bee (Emsen et al. Reference Emsen, de la Mora, Lacey, Eccles, Kelly and Medina-Flores2020) at the start (SP) and end (EP) of pollination, spore loads fell below this threshold after the pollination period (AP). Colonies in RD fields maintained relatively stable spore levels throughout the study and did not surpass the threshold at any time point. Similarly, control colonies exhibited a notable initial increase, followed by a sharp decline in V. ceranae spore loads, with infection becoming nearly undetectable after the pollination period. Our findings align with those of Shaw et al. (Reference Shaw, Cutler, Manning, McCallum and Astatkie2022), who found no evidence of carryover effects of blueberry pollination on V. ceranae infection. It is important to consider the complex dynamics of V. ceranae infections, which may have impaired our ability to draw conclusions. Several studies have reported different seasonal trends for this pathogen. For instance, in Quebec, Copley et al. (Reference Copley, Chen, Giovenazzo, Houle and Jabaji2012) documented peak spore loads in spring and fall, whereas studies from the United States of America found higher loads in spring and early summer (April–June), followed by declines in fall and winter (Traver et al. Reference Traver, Williams and Fell2012; Emsen et al. Reference Emsen, de la Mora, Lacey, Eccles, Kelly and Medina-Flores2020). Conversely, research in Europe has reported relatively stable infection levels throughout the year (Martín-Hernández et al. Reference Martín-Hernández, Meana, Prieto, Salvador, Garrido-Bailón and Higes2007). These seasonal variations, along with environmental and management factors, may partly explain the discrepancies between our results and those of earlier studies.
Virology – In the present study, the proportion of infected colonies and viral loads of acute bee paralysis virus, chronic bee paralysis virus, Israeli acute paralysis virus, and Kashmir bee virus were low or undetectable across all treatments and time points. These results are consistent with previous findings during lowbush blueberry pollination (Dufour et al. Reference Dufour, Fournier and Giovenazzo2020a; Drummond et al. Reference Drummond, Lund and Eitzer2021), suggesting that these viruses are not significantly affected by this specific agricultural context.
Black queen cell virus emerged as the most prevalent virus in 2023, with 100% of colonies infected across all treatments and evaluation periods. This mirrors the findings of Dufour et al. (Reference Dufour, Fournier and Giovenazzo2020a) and aligns with global patterns in honey bees, where black queen cell virus is among the most widespread viruses of bees (Gisder and Genersch Reference Gisder and Genersch2017). However, black queen cell virus loads in our study were notably higher than those reported by Drummond et al. (Reference Drummond, Lund and Eitzer2021), who observed log-transformed values ranging from 1.2 to 4.4 depending on location. In contrast, we recorded log + 1(black queen cell virus) values of 18.9 at the SP, which increased significantly at the end of pollination (EP) and after pollination (AP) to 20.3 and 20.6, respectively. Despite these increases over time, no significant differences were found between pollination treatments, indicating that blueberry pollination did not significantly influence black queen cell virus load.
Deformed wing virus A loads ranged from log + 1 values of –1.53 to 3.69 in 2023, which are broadly comparable to those found by Drummond et al. (Reference Drummond, Lund and Eitzer2021; log-transformed values between 1.8 and 5). No consistent patterns in deformed wing virus A levels were observed across time points or treatments in the present study, preventing any clear conclusion about its association with lowbush blueberry pollination services.
Deformed wing virus B, however, demonstrated significant variation across both years and treatments. Loads observed in 2023 far exceeded those reported by Drummond et al. (Reference Drummond, Lund and Eitzer2021), who recorded values between 0.3 and 1.4 during bloom. Although our findings regarding the prevalence of deformed wing virus B and deformed wing virus A align with those of Drummond et al. (Reference Drummond, Lund and Eitzer2021), they contrast with those of Dufour et al. (Reference Dufour, Fournier and Giovenazzo2020a), who reported fewer than 20% of colonies infected by deformed wing viruses, without distinguishing between viral variants. In the present study, the elevated deformed wing virus B loads in HD and RD colonies, compared to the declining levels in control colonies, during the 2023 carryover assessment may be explained by two interacting factors: (1) nutritional stress resulting from a monofloral diet, which can weaken immune function and increase susceptibility to pathogens (Dufour et al. Reference Dufour, Fournier and Giovenazzo2020a); and (2) Varroa infestation, the primary vector of deformed wing viruses (Gisder and Genersch Reference Gisder and Genersch2017), which likely contributed to viral amplification, especially in HD colonies. Previous research has established that Varroa not only transmits deformed wing virus but also increases viral replication and severity (DeGrandi-Hoffman and Chen Reference DeGrandi-Hoffman and Chen2015; Drummond et al. Reference Drummond, Lund and Eitzer2021). In the present study, although Varroa levels were generally low, we observed a carryover increase in HD colonies that coincided with rising deformed wing virus B loads. This temporal alignment supports the hypothesis that reductions in colony strength may be associated with synergistic effects of Varroa infestation and viral proliferation.
Our findings emphasise the importance of carryover assessments, because significant colony health deterioration related to deformed wing virus B emerged after the pollination period, unlike deformed wing virus A, which appears less influenced by pollination or Varroa levels. Future studies should include more records of beekeeping practices, such as acaricide timing, supplemental feeding, and colony movements, to better understand how agricultural exposure and management factors affect virological outcomes in pollination contexts.
Previous research has established that increased colony density can enhance pathogen transmission through mechanisms such as drifting, robbing, and close proximity of colonies, particularly in dense apiary configurations (Fries and Camazine Reference Fries and Camazine2001; Seeley and Smith Reference Seeley and Smith2015; Nolan and Delaplane Reference Nolan and Delaplane2017; Dynes et al. Reference Dynes, Berry, Delaplane, Brosi and De Roode2019). Our findings align with those of Forfert et al. (Reference Forfert, Natsopoulou, Paxton and Moritz2016), who found that increased regional colony abundance was associated with elevated deformed wing virus infections and multiple-virus prevalence due to enhanced pathogen transmission between apiaries. Forfert et al. (Reference Forfert, Natsopoulou, Paxton and Moritz2016) did not observe a significant effect on the prevalence of black queen cell virus, chronic bee paralysis virus, or the acute bee paralysis virus–family viruses, similar to our results, which showed no relationship between colony density and non–deformed wing viruses. The likely horizontal and vertical transmission routes involved in these dynamics include forager and drone drifting, robbing, direct contact, sexual transmission between infected drones and queens, and contaminated environmental resources (Fries and Camazine Reference Fries and Camazine2001; Forfert et al. Reference Forfert, Natsopoulou, Paxton and Moritz2016). We hypothesise that such intercolony-crowding effects contributed to the elevated deformed wing virus B loads in HD colonies during pollination in the present study, although the full extent of this impact requires further investigation.
Pesticides analyses in bee bread and nectar
In the present study, the average number of active ingredients detected was not significantly influenced by blueberry pollination. On average, we detected fewer active ingredients than Drummond et al. (Reference Drummond, Lund and Eitzer2021) and Averill et al. (Reference Averill, Eitzer and Drummond2024) did, who identified an average of 3.3 active ingredients per field in bee bread and 3.7 in trapped pollen during blueberry pollination. Although colonies used for blueberry pollination in our study experienced a higher hazard quotient risk compared to those located outside blueberry fields, the total risk at EP was extremely low, particularly when compared to the risk observed at SP and compared to values reported by Drummond et al. (Reference Drummond, Lund and Eitzer2021).
The increase in hazard quotient from 2022 to 2023 is explained by our methodology, which included pesticide detections in both the SP and EP periods in the total hazard quotient risk calculation in 2023. Importantly, 99.6% of the total hazard quotient in 2023 was attributed to pesticide exposure at SP, compared to just 0.4% at EP. This strongly suggests that colonies were already exposed to pesticides before entering the blueberry fields and that the pollination environment itself contributed minimally to additional contamination.
In 2022, insecticides were the main contributors to the total hazard quotient risk in colonies involved in blueberry pollination. A similar trend was observed at SP in 2023. However, at EP in 2023, herbicides became more prevalent, although their contribution to total hazard quotient remained negligible (0.3%). These findings partially align with those of Drummond et al. (Reference Drummond, Lund and Eitzer2021), who found that miticides were the primary source of risk in wax comb and trapped pollen, whereas insecticides dominated in bee bread. Although miticides, such as coumaphos, were frequently detected in the present study at both SP and EP, their concentrations were typically below minimum detection limits or minimum quantification limits. In our hazard quotient calculations, we treated values below the minimum detection limits and the minimum quantification limits as 0, which likely contributed to the very low hazard quotient values observed. This conservative assumption, although standard in some risk assessment protocols, may underestimate the cumulative or sublethal effects of low-level exposures.
On the other hand, the results of the Tier 1 risk quotient assessment showed that all values were well below the acute risk threshold (risk quotient < 0.4). In fact, most active ingredients and sampling time points recorded risk quotient values of 0 across both years, both in colonies located outside and in those located in blueberry fields. The highest risk quotient value was associated with glyphosate in 2023 at SP in colonies placed in blueberry fields. However, this value remained far below the level of concern. These findings suggest that the immediate toxic risk of pesticide exposure through oral routes (nectar or bee bread consumption) was negligible under the field conditions of the present study. This outcome aligns with our hazard quotient–based assessment, which also revealed minimal risk associated with contact exposure.
To our knowledge, this is the first study to evaluate the pesticide risk associated with lowbush blueberry pollination in Quebec and to compare it with colonies maintained solely for honey production. Notably, the expanded pesticide analysis in 2023, conducted specifically at SP, revealed that most pesticide-related risk hazard quotients were linked to pre-pollination management rather than to exposure during pollination itself. This supports the idea that management practices employed before field deployment play a critical role in colony contamination. Moreover, the overall hazard quotient and risk quotient pesticide risk levels in colonies used for pollination were comparable to those in honey-producing colonies, further suggesting that lowbush blueberry fields in Quebec pose minimal additional pesticide risk under current conditions. Nevertheless, our study did not assess the sublethal and chronic effects of pesticide exposure, which may still have biologically significant consequences for colony health and productivity (Traynor et al. Reference Traynor, Tosi, Rennich, Steinhauer, Forsgren and Rose2021). Future research should thoroughly explore such effects, incorporating detailed data on pesticide applications and field size, as Averill et al. (Reference Averill, Eitzer and Drummond2024) did in Maine, United States of America. This could clarify whether pesticide residues in colonies come from on-farm applications or from off-farm sources such as environmental drift or beekeeping practices.
Conclusion
Our findings suggest that colony density during blueberry pollination influences certain health parameters, although the effects appear to be selective and context-dependent. Notably, the colony strength gain was negatively impacted by lowbush blueberry pollination and by the increase in colony density. We believe this strength reduction may be related to the increase in deformed wing virus B loads and to the proportion of colonies infested with Varroa mites. These findings highlight how managing colony density can affect pollination effectiveness and long-term bee health.
Supplementary material
The supplementary material for this article can be found at https://doi.org/10.4039/tce.2026.10061.
Acknowledgements
The authors thank the beekeepers and blueberry farmers who actively participated in the project and generously allowed us to use their honey bee colonies and blueberry fields. They thank Club Conseil Bleuet, Pierre-Olivier Martel, and Charles-Augustin Déry Bouchard for their technical support. They also thank Mireille Levesque, Marie-Lou Morin, Sandrine Gagnon, Gabriel Servant, Sylvie Laroche, and Paul André Ouellette for their assistance during sampling.
Funding statement
This work was supported by the Natural Sciences and Engineering Research Council of Canada (NSERC) under the Alliance Grant programme (grant number ALLRP 561308–20), Project Apis m and Costco Wholesale Canada Ltd. (grant agreement number 321), the Ministère de l’Agriculture, des Pêcheries et de l’Alimentation du Québec; the Syndicat des producteurs de bleuets du Québec (SPBQ), the Apiculteurs et Apicultrices du Québec, the Canadian Honey Council, the Club Conseil Bleuet; Biobest, and the Centre de recherche en sciences animales de Deschambault (CRSAD).
Disclosure of generative artificial intelligence (AI) tools
Grammarly, version 14.1216.0, was used for language improvement. ChatGPT, version 4.0, was used for language improvement and bibliography formatting.
Competing interests
The authors report they have no competing interests to declare.


 Open access

