

Introduction
The relevance of context for political trust has been widely assessed in recent decades (see, e.g., Dalton Reference Dalton1994; Catterberg & Moreno Reference Catterberg and Moreno2005). Recently, more attention has been paid to how context‐ and individual‐level factors interact when it comes to explaining political trust. Studies adopting this micro–macro interactive approach have predominantly centred on theorising about how citizens evaluate the quality of political representation (see, e.g., Anderson & Singer Reference Anderson and Singer2008; Hakhverdian & Mayne Reference Hakhverdian and Mayne2012; Van der Meer Reference Van der Meer2010; Van der Meer & Hakhverdian Reference Van der Meer and Hakhverdian2017). According to this perspective, political trust follows the evaluation of procedural and policy performance of politics (Hakhverdian & Mayne Reference Hakhverdian and Mayne2012). To test this thesis, scholars have focused on how the level of corruption interacts with an individual's level of education: as more‐educated citizens are considered to be both better able to evaluate the functioning of politics and more strongly attached to democratic norms, the basic expectation is that the extent to which they trust politics depends on how free the political domain is from corruption (Hakhverdian & Mayne Reference Hakhverdian and Mayne2012; Van der Meer Reference Van der Meer2010; Van der Meer & Hakhverdian Reference Van der Meer and Hakhverdian2017).
We argue that the micro–macro interactive approach to political trust can be enriched by including another strand of evaluation, namely evaluation based on substantive representation, in addition to the more commonly assessed evaluation based on the quality of representation. Studies on ideological (in)congruence have found that citizens tend to display more political satisfaction when they feel substantively represented in the political domain (see, e.g., McLaren Reference McLaren2017; Stecker & Tausendpfund Reference Stecker and Tausendpfund2016). We build on this insight by examining the interactions between the micro‐level economic and cultural preferences of individual citizens and macro‐level measures of the ideological stances of the governing cabinet (i.e., the extent of the government's economic egalitarianism and cultural liberalism). This novel approach enables us to assess how the political trust of subpopulations is related to relevant context conditions, while answering our research question: how do evaluations based on the quality of representation and substantive representation shape political trust?
We answer this question by performing multi‐level regression analyses on a dataset that includes waves 3 (2006), 5 (2010) and 7 (2014) of the European Social Survey (ESS). This is enriched with country‐level data derived from various sources, including the Chapel Hill Expert Survey (CHES) (Bakker et al. Reference Bakker, De Vries, Edwards, Hooghe, Jolly, Marks, Polk, Rovny, Steenbergen and Vaschudova2015; Polk et al. Reference Polk, Rovny, Bakker, Edwards, Hooghe, Jolly, Koedam, Kostelka, Marks, Schumacher, Steenbergen, Vachudova and Zilovic2017). Our final dataset covers 24 European countries and includes 62 country‐year combinations and 68,294 valid observations. There are three ways in which our multi‐level study adds to the literature on the micro–macro interactive approach to political trust. First, we assess whether micro–macro interactive relationships not only pertain to evaluation based on the quality of representation but also to evaluation based on substantive representation. Second, in doing so, we are sensitive to different types of context characteristics: we model measures of both the economic and the cultural stances of the governing cabinet, in addition to the commonly used measure of national‐level corruption. We examine how the former two interact with individual‐level ideological preferences (for assessing evaluation based on substantive representation), and how the latter interacts with individual‐level education (for assessing evaluation based on the quality of representation). Third, our analyses enable us to investigate whether and how context matters for different subgroups.
In what follows, we first formulate our expectations for both forms of evaluation. Then, after discussing the operationalisation of our data, we test our hypotheses empirically. Our findings on the quality of representation approach reflect those reported in the extant literature: the effect of education on political trust depends on the level of corruption in a country. In addition, we find support for the substantive representation approach: the effect of individual‐level ideological preferences on political trust depends on the stances of the governing cabinet in relation to cultural (but not economic) issues. More specifically, we find that the culturally liberal are sensitive to their government's cultural stances: they show more political trust in countries with a more culturally liberal governing cabinet. After establishing the robustness of our findings, we discuss their implications and present avenues for future research.
Evaluation based on the quality of representation and substantive representation
Evaluation based on the quality of representation plays a central role in the extant literature on the micro–macro interactive approach to political trust. It is argued that political trust results from examining the functioning of the political domain. Hakhverdian and Mayne (Reference Hakhverdian and Mayne2012: 741) propose two sets of criteria based on which this evaluation takes place: ‘“input” or procedural performance and (…) “output” or policy performance’. The former refers to the fairness of rules and structures by which institutions and actors abide. For the latter, it is essential to what extent governments ‘produce policies and services that are responsive to the general public’: ‘citizens will assess and react to the general performance of their respective country's political institutions’ (idem). Public sector corruption is a standard indicator used for measuring such non‐politicized quality of representation, as it is regarded ‘a major challenge to the performance of political institutions’ in the interest of the general public (Hakhverdian & Mayne Reference Hakhverdian and Mayne2012: 742). Given their greater belief in democratic norms and principles and their greater knowledge of politics, more‐educated citizens allegedly have a greater stake in clean political domains and are assumed to be more accurate when evaluating the performance thereof (Hakhverdian & Mayne Reference Hakhverdian and Mayne2012; see also Dalton Reference Dalton1994; Galston Reference Galston2001). Indeed, it has been frequently demonstrated that especially in countries with low levels of corruption, more‐educated citizens report higher levels of trust in politics than their less‐educated counterparts (Hakhverdian & Mayne Reference Hakhverdian and Mayne2012; Van der Meer Reference Van der Meer2010; Van der Meer & Hakhverdian Reference Van der Meer and Hakhverdian2017). Accordingly, we expect there to be a negative micro–macro interaction effect on political trust between education and corruption (hypothesis 1a).
Research on evaluation based on the quality of representation has paid specific attention to how corruption is related to political trust of less‐ and more‐educated citizens. These studies have found that the political trust of the latter group in particular is negatively associated with corruption, and that more‐educated citizens are, therefore, the prime drivers of variation in the education gap in political trust across countries with different levels of corruption (Hakhverdian & Mayne Reference Hakhverdian and Mayne2012; Van der Meer Reference Van der Meer2010; Van der Meer & Hakhverdian Reference Van der Meer and Hakhverdian2017). As a consequence, we expect more‐educated citizens to display more (less) political trust when the political domain is characterised by lower (higher) levels of corruption (hypothesis 1b).
In addition to examinations of evaluation based on the quality of representation, there is an extensive body of literature on ideological (in)congruence. Instead of focusing on the quality of representation, these studies highlight the relevance of substantive representation for political trust: if citizens evaluate the extent to which their ideological preferences are in line with those of the people who represent them in national politics, they often experience them to be incongruent (cf. Mayne & Hakhverdian Reference Mayne and Hakhverdian2017; Rosset et al. Reference Rosset, Giger and Bernauer2013; Schakel & Hakhverdian Reference Schakel and Hakhverdian2018). It has also been found that feeling represented nurtures political satisfaction and trust (Kim Reference Kim2009; Mayne & Hakhverdian Reference Mayne and Hakhverdian2017; McLaren Reference McLaren2017; Stecker & Tausendpfund Reference Stecker and Tausendpfund2016). McLaren (Reference McLaren2017), for instance, showed that people are less trusting of politics if their own stances regarding immigration do not accord with those incorporated in the policy decisions of the government.
In this study, we enrich the micro–macro debate on political trust by incorporating insights from studies on ideological (in)congruence and argue that, in addition to evaluation based on the quality of representation, evaluation based on substantive representation should be addressed in the micro–macro interactive approach of political trust. We do this by including contextual indicators of the ideological stances of the governing cabinet in our analyses and examining their interactions with corresponding individual‐level ideological preferences. This interactive approach enables us to deviate from the common practice in previous studies on ideological (in)congruence, in which representation is commonly modelled as an individual‐level characteristic (see, e.g., Mayne & Hakhverdian Reference Mayne and Hakhverdian2017; Rosset et al. Reference Rosset, Giger and Bernauer2013; Stecker & Tausendpfund Reference Stecker and Tausendpfund2016). By distinguishing between economic and cultural aspects of both the ideological stances of the governing cabinet and individual‐level ideological preferences, we explicitly extend our focus past the congruence of the traditional left‐right axis (see, e.g., Huber & Powell Reference Huber and Powell1994; Kim Reference Kim2009; Mayne & Hakhverdian Reference Mayne and Hakhverdian2017; Rosset et al. Reference Rosset, Giger and Bernauer2013), which has been shown to increase political satisfaction, but also paints an oversimplified picture of the ideological stances of the governing cabinet (cf. Hooghe et al. Reference Hooghe, Marks and Wilson2002; Stecker & Tausendpfund Reference Stecker and Tausendpfund2016; Van der Brug & Van Spanje Reference Van der Brug and Van Spanje2009).
First, citizens and political parties differ in the extent to which they favour economic redistribution: they may be more economically conservative or economically egalitarian (Stecker & Tausendpfund Reference Stecker and Tausendpfund2016; Van der Brug & Van Spanje Reference Van der Brug and Van Spanje2009). Following evaluation based on substantive representation, we expect a positive interaction effect on political trust between individual‐level economic egalitarianism and the level of economic egalitarianism of the governing cabinet (hypothesis 2a). Our approach enables us to formulate and test expectations for different subgroups. On the one hand, the expectation may be that economically egalitarian citizens will report the highest (lowest) levels of political trust in countries where, and at times when, the governing cabinet is most (least) economically egalitarian. A study by Anderson and Singer (Reference Anderson and Singer2008) hints at this by demonstrating that self‐reported leftists in particular are least satisfied with politics in contexts of high levels of income inequality (cf. Catterberg & Moreno Reference Catterberg and Moreno2005). Yet, the question remains as to whether citizens had their preferences regarding economic redistribution (instead of, e.g., cultural issues) in mind when reporting their position on a left‐right scale. Consequently, the following hypothesis in our micro–macro interactive approach to politics requires further scrutiny: economic egalitarians in particular have more (less) trust when the governing cabinet is characterised by an overall higher (lower) level of economic egalitarianism (hypothesis 2b).
On the other hand, it may be expected that economically conservative citizens will be particularly affected by the governing cabinet's economic stances. Tellingly, the affluent – generally the most economically conservative subpopulation (Van der Waal & De Koster Reference Van der Waal and De Koster2015) – have more political trust in countries with greater levels of income inequality (Catterberg & Moreno Reference Catterberg and Moreno2005; see, also, Rosset et al. Reference Rosset, Giger and Bernauer2013). Moreover, these countries are probably also those in which the governing cabinet has more economically conservative stances. Accordingly, we hypothesise that economically conservative citizens in particular have less (more) trust when the governing cabinet is characterised by an overall higher (lower) level of economic egalitarianism (hypothesis 2c).
Second, in addition to the extent of their economic egalitarianism, citizens and political parties differ in terms of how culturally liberal they are. A review of the literature leads to the identification of a diverse set of cultural preferences that are increasingly salient in both the political domain (see, e.g., Hooghe et al. Reference Hooghe, Marks and Wilson2002; Raines et al. Reference Raines, Goodwin and Cutts2017) and society‐at‐large (see, e.g., Van der Brug & Van Spanje Reference Van der Brug and Van Spanje2009; Van der Waal et al. Reference Van der Waal, Achterberg and Houtman2007). Following Hooghe et al. (Reference Hooghe, Marks and Wilson2002), we distinguish green, alternative or libertarian (GAL) preferences pertaining to cultural diversity and the environment on the one hand, and traditional, authoritarian or nationalist (TAN) preferences on such issues on the other. Informed by evaluation based on substantive representation, we expect a positive interaction effect on political trust between individual‐level cultural liberalism and cultural liberalism of the governing cabinet (hypothesis 3a).
In formulating hypotheses for specific subgroups, it is relevant that cultural liberalism is not simply an ideological preference, but has become an identity marker of the higher strata in many Western societies (cf. Currid‐Halkett Reference Currid‐Halkett2017; DellaPosta et al. Reference DellaPosta, Shi and Macy2015; Noordzij et al. Reference Noordzij, Van der Waal and De Koster2019). This might mean that the degree of cultural liberalism of the governing cabinet is particularly relevant in driving the level of trust in politics among culturally liberal citizens. As a result, we hypothesise that culturally liberal citizens in particular have more (less) trust when the governing cabinet is characterised by an overall higher (lower) level of cultural liberalism (hypothesis 3b). We are also able to formulate a contrasting expectation for the cultural conservatives. As cultural liberalism has been adopted by the upper strata as an identity marker, cultural conservatives experience stigmatisation when confronted with the lifestyles and attitudes of cultural liberals or, more generally, in culturally liberal contexts (cf. Jarness & Flemmen Reference Jarness and Flemmen2019; Noordzij et al. Reference Noordzij, Van der Waal and De Koster2019; Reference Noordzij, De Koster and Van der Waal2020). This is likely to make such environments even more frustrating for cultural conservatives than might be expected from disagreements over specific policies. We hypothesise that culturally conservative citizens in particular have less (more) trust when the governing cabinet is characterised by an overall higher (lower) level of cultural liberalism (hypothesis 3c).
Method, data and operationalisation
Method and data
Our data have a cross‐classified structure (with individuals nested in both countries and years). We therefore used linear multi‐level regression models, with individuals nested in country‐years, nested in countries (Schmidt‐Catran & Fairbrother Reference Schmidt‐Catran and Fairbrother2016; Steenbergen & Jones Reference Steenbergen and Jones2002). As the models that included year‐level random effects did not converge, we incorporated fixed effects for these years using dummy variables, as suggested by Schmidt‐Catran and Fairbrother (Reference Schmidt‐Catran and Fairbrother2016).
On the contextual level, we measured corruption using the Corruption Perceptions Index (Transparency International 2020), which includes expert opinions on the level of corruption of a country's public sector. We employed the CHES (Bakker et al. Reference Bakker, De Vries, Edwards, Hooghe, Jolly, Marks, Polk, Rovny, Steenbergen and Vaschudova2015; Polk et al. Reference Polk, Rovny, Bakker, Edwards, Hooghe, Jolly, Koedam, Kostelka, Marks, Schumacher, Steenbergen, Vachudova and Zilovic2017) to measure the level of economic egalitarianism and cultural liberalism of a country's governing cabinet. The CHES is a well‐known expert survey on parties’ positions on various issues in numerous European countries. It is not clear whether experts had parties’ discursive positions in mind when determining their scores, and/or parties’ actions. Both, however, are indicative of parties’ ideological stances. The Manifesto Project Database, meanwhile, which is also frequently used in studies on political representation, estimates ideological positions based on party manifestos instead of expert evaluations (Volkens et al. Reference Volkens, Krause, Lehmann, Matthieß, Merz, Regel and Weßels2019). However, Adams et al. (Reference Adams, Ezrow and Somer‐Topcu2011: 375) found ‘no evidence that voters systematically update their perceptions of parties’ Left‐Right positions in response to the actual ideological statements that parties present in their manifestos’, but they did identify that perceived positions, instead of rhetoric in manifestos, shift voters’ positions (cf. Backlund & Jungar Reference Backlund and Jungar2019; Stecker & Tausendfund Reference Stecker and Tausendpfund2016). As a result, the goal of our research is a better fit with data available from the CHES.
The variables we used to measure economic egalitarianism and cultural liberalism of governing cabinets were included in the CHES from 2006 onwards in four‐yearly intervals. We therefore appended these macro‐level to individual‐level data from three waves (2006, 2010, 2014) of the ESS (cf. Stecker & Tausendpfund Reference Stecker and Tausendpfund2016, who followed a similar procedure for their two‐wave study). The ESS is a cross‐national survey conducted every two years using face‐to‐face interviews. We weighted our analyses using a post‐stratification weight, which corrects for faults in inclusion probabilities and sampling and for non‐response errors.
The macro‐level control variables discussed below were derived from various sources. The World Bank Group (2020a, 2020b, 2020c) supplies data on economic growth, GDP per capita and unemployment rates. The Gallagher Index measures the disproportionality between the distribution of votes and the allocation of seats for each election (Gallagher Reference Gallagher1991). Taken together, our dataset therefore covers 24 European countriesFootnote 1 and includes 62 country‐year combinations and 68,294 valid observations.Footnote 2
Operationalisation of the main variables
Our individual‐level dependent variable is political trust. This is a reliable three‐item scale (Cronbach's α = 0.90 (2006); 0.92 (2010); 0.91 (2014); item homogeneity index H = 0.76 (2006); 0.81 (2010); 0.78 (2014)) and consists of trust in parliament, politicians and political parties, with higher scores on a range from (0) to (10) indicating more trust (see Figure A1 in the Online Appendix for the mean political trust values for each country‐year combination included in our study).
The main individual‐level variable of interest for scrutinising the approach of evaluation based on the quality of representation is education, which we coded using the International Standard Classification of Education (ISCED). The ISCED categories were collapsed to range from (0) less than lower secondary education, to (4) tertiary education completed. We excluded respondents from our main analyses who had not yet completed their education trajectory.Footnote 3 On the country level, we measured corruption using the Corruption Perceptions Index (Transparency International 2020; cf. Van der Meer Reference Van der Meer2010). This measures public sector corruption, with lower values down to (0) indicating very untainted public sectors, while higher values up to (10) indicate that they are highly corrupt (see Figure A2 in the Online Appendix for the mean corruption values for each country for the three years included in our study).
The main individual‐level variables for testing for evaluation of substantive representation are economic egalitarianism (cf. Svallfors Reference Svallfors2013) and ethnic tolerance (cf. Hooghe & De Vroome Reference Hooghe and De Vroome2015; Stecker & Tausendpfund Reference Stecker and Tausendpfund2016). We measured the first of these using a question seeking people's views on whether their government should reduce differences in income levels. Higher scores on the scale ranging from (0) to (4) indicate that a respondent is more economically egalitarian. Second, we used the ethnic tolerance of the respondents as a proxy for their culturally liberal values. This is the aspect of cultural liberalism that can be measured best in our dataset and is commonly considered to be indicative of a generalised level thereof (cf. Houtman Reference Houtman, Clark and Lipset2001; Inglehart et al. Reference Inglehart, Foa, Peterson and Welzel2008; see, also, Ojala Reference Ojala2015 and Vainio & Paloniemi Reference Vainio and Paloniemi2011 on the relationship between environmentalist attitudes on the one hand and ethnic tolerance and other postmaterialist values on the other). We included ethnic tolerance by constructing a reliable five‐item scale (Cronbach's α = 0.86 (2006); 0.88 (2010); 0.87 (2014); item homogeneity index H = 0.61 (2006); 0.64 (2010); 0.62 (2014)). This consists of questions measuring opposition to immigration and attitudes towards ethnic diversity. Higher scores on the scale ranging from (0) to (3) indicate that a respondent is more ethnically tolerant.
At the macro‐level, we measured economic egalitarianism of the governing cabinet using information on the extent to which political parties (0) oppose or (10) favour economic redistribution. GAL‐TAN was employed as an indicator of cultural liberalism of the governing cabinet (Bakker et al. Reference Bakker, De Vries, Edwards, Hooghe, Jolly, Marks, Polk, Rovny, Steenbergen and Vaschudova2015; Hooghe et al. Reference Hooghe, Marks and Wilson2002; Polk et al. Reference Polk, Rovny, Bakker, Edwards, Hooghe, Jolly, Koedam, Kostelka, Marks, Schumacher, Steenbergen, Vachudova and Zilovic2017). Also on a 0–10 range, this distinguishes between the more authoritarian and traditional parties that prioritise stability and a strict socio‐cultural order (TAN) and the more libertarian and postmaterialist parties, which are those that give precedence to personal freedom, democratic participation and progressive stances on issues such as euthanasia and same‐sex marriage (GAL). We constructed separate measures of the levels of economic egalitarianism and cultural liberalism of the governing cabinet. We did this using weighted means of the governing parties’ levels of support for, respectively, economic egalitarianism and cultural liberalism, because these, arguably, reflect the governing cabinet's ideological stances (cf. Huber & Powell Reference Huber and Powell1994; Mayne & Hakhverdian Reference Mayne and Hakhverdian2017; Stecker & Tausendpfund Reference Stecker and Tausendpfund2016). We calculated the relative weight of each governing party within a cabinet in a given country‐year combination using their share of seats in parliament (see, e.g., Mayne & Hakhverdian Reference Mayne and Hakhverdian2017; Stecker & Tausendpfund Reference Stecker and Tausendpfund2016), with the combined total amounting to 100 per cent. Figures A3 and A4 in the Online Appendix present the values of economic egalitarianism and cultural liberalism of the governing cabinet, respectively, for each country‐year combination.
In order to capture evaluation of substantive representation, our analyses interacted individual‐level preferences with context indicators of the stances of the governing cabinet. This approach differs from the common strategy employed in studies of ideological (in)congruence. The latter strategy typically uses a single variable that indicates the distance between the ideological preferences of individual respondents or the median citizen and those of governing parties, parliament or the median party (see, e.g., Mayne & Hakhverdian Reference Mayne and Hakhverdian2017; Rosset et al. Reference Rosset, Giger and Bernauer2013; Stecker & Tausendpfund Reference Stecker and Tausendpfund2016; see, however, McLaren Reference McLaren2017). Our micro–macro interactive approach enabled us to analyse whether, and how, context matters for the levels of political trust of different subgroups, which has thus far largely been overlooked because of the conventional modelling strategy.
When it came to the economic egalitarianism and cultural liberalism of the governing cabinet, we took into account the fact that cross‐sectional and longitudinal variations may have different relevance. As a consequence, for both these context characteristics, we included both the between and the group‐mean centred within effects (i.e., the mean value for each country over its included years for the former and, for the latter, the mean differenced components of these variables, subtracting the above‐mentioned mean from the value of each country‐year combination; cf. Bell & Jones Reference Bell and Jones2015; Fairbrother Reference Fairbrother2014; Schmidt‐Catran & Fairbrother Reference Schmidt‐Catran and Fairbrother2016). Corruption hardly varies within the countries in the assessed time period, and we therefore only specified its between effect.
Operationalisation of the control variables
We controlled for various individual and country‐year level variables used in studies of political trust and ideological (in)congruence. On the individual level, this included the respondents’ economic circumstances as a way to account for the association between economic position and political trust. Income was operationalised as a respondent's total household income (cf. Van der Meer Reference Van der Meer2010), standardised within each country‐year combination for reasons of comparability.Footnote 4Satisfaction with the present state of the economy (cf. Armingeon & Guthmann Reference Armingeon and Guthmann2014; Hakhverdian & Mayne Reference Hakhverdian and Mayne2012; McLaren Reference McLaren2017; Stecker & Tausendpfund Reference Stecker and Tausendpfund2016) ranges from (0) to (10), with higher values indicating that a respondent is more satisfied. Unemployment (cf. Anderson & Singer Reference Anderson and Singer2008; Van der Meer & Hakhverdian Reference Van der Meer and Hakhverdian2017), meanwhile, measures whether someone (0) is or (1) is not in work.
We also controlled for multiple socio‐demographic factors, including age and age2 divided by 1000 (cf. Hakhverdian & Mayne Reference Hakhverdian and Mayne2012; Van der Meer Reference Van der Meer2010) and whether a respondent (1) is or (0) is not female (cf. McLaren Reference McLaren2017; Schakel & Hakhverdian Reference Schakel and Hakhverdian2018; Van der Meer Reference Van der Meer2010; Stecker & Tausendpfund Reference Stecker and Tausendpfund2016). We also controlled for religious adherence (cf. Van der Meer Reference Van der Meer2010; Van der Meer & Hakhverdian Reference Van der Meer and Hakhverdian2017) by asking whether a respondent (1) does or (0) does not belong to a religious denomination and included attendance at religious services to control for religious participation (cf. Anderson & Singer Reference Anderson and Singer2008; Van der Meer Reference Van der Meer2010; Van der Meer & Hakhverdian Reference Van der Meer and Hakhverdian2017). The scores for the latter variable range from (1) never to (7) daily. We similarly controlled for household composition by asking about household size and whether a respondent (1) does or (0) does not have any children living at home (cf. Van der Meer Reference Van der Meer2010). We further controlled for being non‐native by asking whether a respondent (1) does or (0) does not have at least one parent who was born abroad (cf. Van der Meer & Hakhverdian Reference Van der Meer and Hakhverdian2017). We included information about the respondents’ living area by coding whether they live: (1) on a farm or in a home in the countryside; (2) in a country village; (3) in a town or small city; (4) in the suburbs or outskirts of a big city; or (5) in a big city (entered as dummies, as is common for studies using the ESS; cf. Acik Reference Acik2013; Pichler Reference Pichler2010).
We controlled for political interest (cf. Stecker & Tausendpfund Reference Stecker and Tausendpfund2016) using scores ranging from (1) to (4), with higher values indicating more interest. We also controlled for election winner–loser status (cf. Anderson & Guillory Reference Anderson and Guillory1997; Hakhverdian & Mayne Reference Hakhverdian and Mayne2012; Kim Reference Kim2009; Martini & Quaranta Reference Martini and Quaranta2019; Mayne & Hakhverdian Reference Mayne and Hakhverdian2017), with dummies for whether the party voted for by a respondent (1) did or (2) did not become part of the government, or for cases where a respondent (3) did not vote at all. Lastly, we controlled for satisfaction with life overall (cf. McLaren Reference McLaren2017) and social trust (cf. Hakhverdian & Mayne Reference Hakhverdian and Mayne2012; Stecker & Tausendpfund Reference Stecker and Tausendpfund2016; Zmerli & Newton Reference Zmerli and Newton2008), both of which relate positively to political satisfaction. The scores for satisfaction with life as a whole range from (0) to (10), with higher values indicating more satisfaction. Social trust, meanwhile, was measured with a reliable three‐item scale that ranges from (0) to (10) (Cronbach's α = 0.76 (2006), 0.79 (2010), 0.76 (2014); item homogeneity index H = 0.53 (2006); 0.57 (2010); 0.53 (2014)), with higher values indicating that a respondent believes that others are generally to be trusted, fair and helpful.
At the country‐year level, we used data from the World Bank Group (2020a) to control for economic growth as an annual percentage of GDP per capita growth (cf. Anderson & Singer Reference Anderson and Singer2008; Van der Meer Reference Van der Meer2010). Higher scores indicate that a country's economy strengthened in a given year. GDP per capita was included to represent purchasing‐power parity in current international dollars divided by 1000 (cf. Anderson & Singer Reference Anderson and Singer2008; Van der Meer Reference Van der Meer2010). These data were also obtained from the World Bank Group (2020b). We also controlled for unemployment as the total percentage of the labour force (cf. Anderson & Singer Reference Anderson and Singer2008), again using World Bank Group (2020c) information.Footnote 5 We included the Gallagher Index score for the disproportionality of the electoral system (cf. Van der Meer Reference Van der Meer2010), with higher values indicating a greater disproportionality between the distribution of votes and the allocation of seats (Gallagher Reference Gallagher1991). Finally, we included a variable for whether a country is (1) Western or (0) Eastern European (cf. Anderson & Singer Reference Anderson and Singer2008). We did not make a distinction between the between‐ and within‐effects for the country‐level control variables.
Results
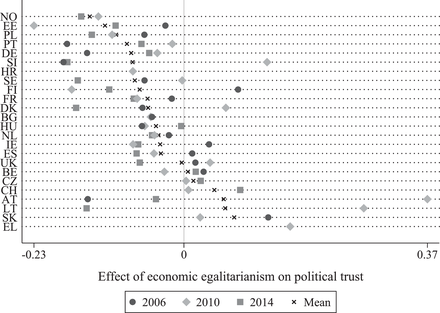
Before turning to the multi‐level models that we used to test our hypotheses, we will first provide insights into the contextual differences in the individual‐level determinants of political trust for both types of evaluation. First, and relevant for evaluation based on the quality of representation, Figure 1 shows the regression coefficients of the association of education with political trust for each country‐year combination (assessed in separate regression analyses that included all the individual‐level variables). Generally, the largest positive educational gradients in political trust are found in North‐west European countries like Sweden and Denmark, while the largest negative ones are found in Eastern European countries like Slovakia and Slovenia. This is in line with the quality of representation approach: the more educated report higher levels of political trust than the less educated in countries with low levels of corruption, while the reverse holds for countries with high corruption scores (these scores are set out in Figure A2 in the Online Appendix).
The effect of education on political trust per country and year (regression coefficients derived from analyses that include all the individual‐level variables).

Figure 1 reveals that Switzerland is the odd one out: it scores rather low on corruption, while the less educated report higher levels of trust in politics than their more‐educated counterparts. This may be attributable to the country's semi‐direct democratic political system, as various forms of direct democracy are reported to be most favoured by less‐educated citizens (see, e.g., Coffé & Michels Reference Coffé and Michels2014). Figure 1 also identifies Slovakia as an outlier. Although the effect of education there is in line with the quality of representation approach, that effect is remarkably large when compared to other countries with relatively high corruption scores. We therefore performed a robustness check by running additional analyses that omitted Slovakia from the data (see below).
In a similar way to Figure 1, Figure 2 shows the regression coefficients of the effect of citizens’ economic egalitarianism on political trust for each country‐year combination (including all the individual‐level variables). The general pattern it reveals is that it is only in a limited number of countries where the coefficients are in line with the substantive representation approach. This is, for instance, the case in Greece, which was governed by the centre‐left party PASOK during the data collection and has a high score for economic egalitarianism of the governing cabinet (see Figure A3 in the Online Appendix for the scores on economic egalitarianism of the governing cabinet). However, for countries where high levels of economic egalitarianism of the governing cabinet are roughly similar, such as Portugal and Poland, the negative coefficients of economic egalitarianism on political trust are not in line with evaluation based on substantive representation.
The effect of economic egalitarianism on political trust per country and year (regression coefficients derived from analyses that include all the individual‐level variables).

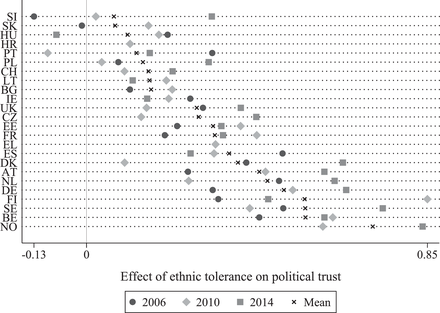
In contrast, the regression coefficients of the effect of ethnic tolerance on political trust, which are set out in Figure 3 (again from models including all the individual‐level variables), do reflect our theorising on evaluation based on substantive representation: the strongest positive effect of ethnic tolerance on political trust is identified in countries that are traditionally among those with the highest levels of cultural liberalism of the governing cabinet, such as Norway, Belgium and Finland. Less strong, and even reversed, effects of ethnic tolerance on political trust are found for countries like Slovakia, Hungary and Poland. It should be noted that Hungary's relatively modest mean score on cultural liberalism of the governing cabinet reflects the net result of: a rather high score of 6.17 in 2006 (in which the social‐democratic party MSZP and the liberal party SzDsZ led the government); and low scores of 2.62 and 1.36 in 2010 and 2014, respectively, which was when Viktor Orbán's right‐wing populist party, Fidesz, formed the government.
The effect of ethnic tolerance on political trust per country and year (regression coefficients derived from analyses that include all the individual‐level variables).

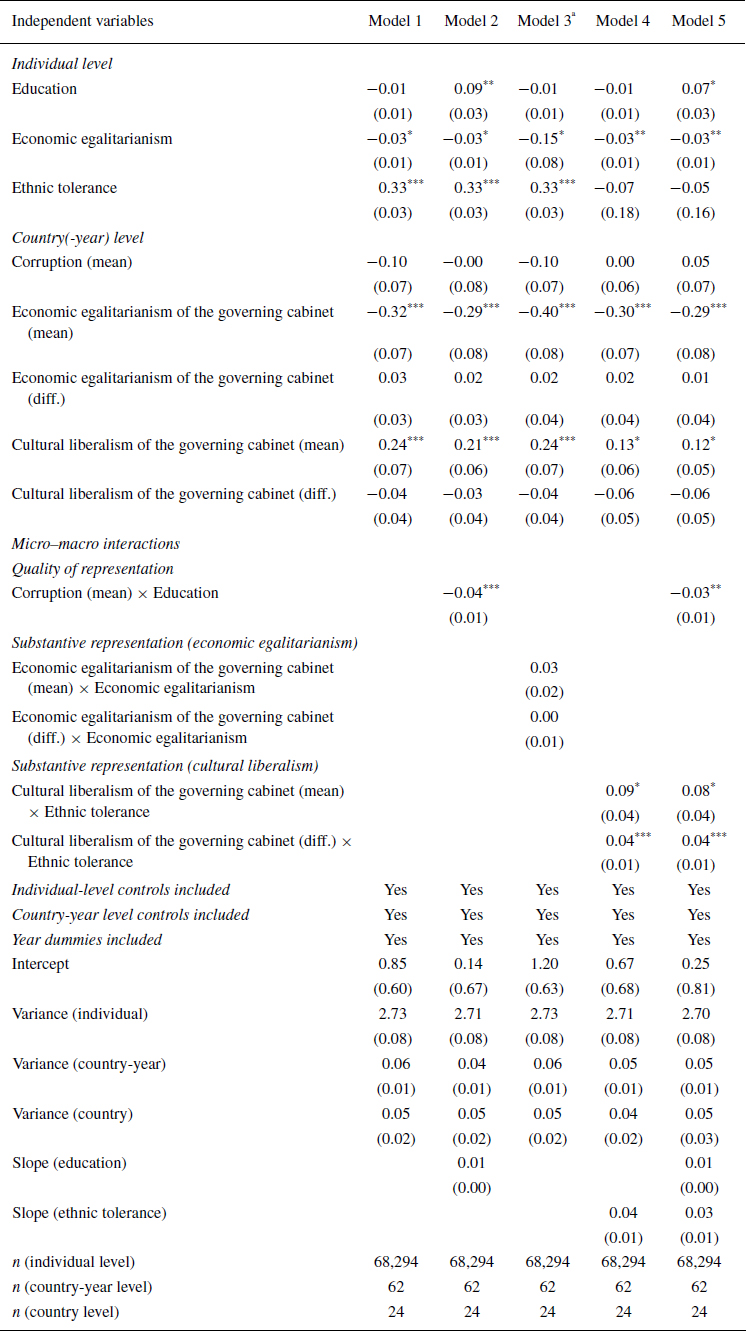
Table 1 sets out the results of the linear multi‐level regression models we used to test our hypotheses. Model 1 includes all the individual and country‐level variables and the year dummies. Models 2 to 4 each separately model our micro–macro interaction terms of interest: Model 2 – the interaction of education with corruption; Model 3 – the interactions between economic egalitarianism on the individual level and the between‐ and within‐effects of economic egalitarianism of the governing cabinet; and Model 4 – the interactions between ethnic tolerance on the individual level and the between‐ and within‐effects of cultural liberalism of the governing cabinet. Lastly, Model 5 combines all the interaction terms that reached significance in Models 2 to 4.
Linear multi‐level regression models for political trust

Sources: ESS, waves 3 (2006), 5 (2010) and 7 (2014); CHES (Bakker et al. Reference Bakker, De Vries, Edwards, Hooghe, Jolly, Marks, Polk, Rovny, Steenbergen and Vaschudova2015; Polk et al. Reference Polk, Rovny, Bakker, Edwards, Hooghe, Jolly, Koedam, Kostelka, Marks, Schumacher, Steenbergen, Vachudova and Zilovic2017); World Bank Group (2020a; 2020b; 2020c); Corruption Perceptions Index (Transparency International 2020); and Gallagher Index (Gallagher Reference Gallagher1991).
Note: *p < 0.05, **p < 0.01, ***p < 0.001. Unstandardised coefficients; standard errors in parentheses. Full model available upon request.
a The model did not converge when specifying a random slope for economic egalitarianism on the individual level. The variance of the random slope for economic egalitarianism (in a non‐converged model) is very close to 0. Although Heisig and Scheffer (Reference Heisig and Schaeffer2019) state that individual‐level random slopes must be included for cross‐level interactions in multi‐level models, they nevertheless illustrate that, in this specific circumstance, they can be omitted. As a result, we did not specify a random slope for economic egalitarianism.
In terms of evaluation based on the quality of representation, our first expectation is that the positive educational gradient in political trust would be larger in less corrupt countries. This is corroborated by the substantially negative cross‐level interaction between corruption and education portrayed in Model 2 (confirming hypothesis 1a). Brambor et al. (Reference Brambor, Clark and Golder2006) demonstrated that an appropriate interpretation of an interaction effect calls for a visual representation instead of only a reliance on indications of statistical significance. We therefore plotted this interaction in Figure 4, which also enabled us to assess the subgroups to which corruption matters the most and in what way. In so doing, we did not maintain the covariates at fixed (mean) values, but instead calculated the average marginal effects (we did the same in the other post‐estimations reported below). Subsequently, we used the mlincom command in Long and Freese's (Reference Long and Freese2014) Stata package SPost13 to separately assess the marginal differences between contexts for the less and more educated. In line with hypothesis 1b pertaining to the quality of representation approach, we find that it is the most educated who drive the varying size of the education gap in political trust across countries that differ in relation to their level of corruption: their political trust is lowest (highest) in the most (least) corrupt countries (−0.93; p = 0.039). In contrast, the least educated's levels of political trust is unrelated to the extent of corruption in their country.
Predicted level of political trust for the most and least educated across different levels of corruption, along with the 95 per cent confidence intervals (Table 1, Model 2). The difference in political trust between the countries with the lowest and highest levels of corruption is significant for the most educated (−0.93; p = 0.039).

Following evaluation based on substantive representation, it is our expectation that citizens would have more trust in politics if the ideological stances of the governing cabinet more closely match their ideological preferences. To test this, we modelled both the between‐ and within‐ interaction effects between economic egalitarianism of the governing cabinet and economic egalitarianism on the individual level (Model 3); and cultural liberalism of the governing cabinet and cultural liberalism on the individual level (Model 4).
Model 3 does not provide support for our expectation regarding the interaction between individual‐level economic egalitarianism and the macro‐level cross‐sectional and longitudinal differences in economic egalitarianism of the governing cabinet (rejecting hypothesis 2a). Our results reveal a negative and unconditional between‐effect of economic egalitarianism of the governing cabinet: economically conservative and egalitarian citizens were both generally less trusting of politics when the governing cabinet was characterised by higher levels of economic egalitarianism. Such a general, instead of a subgroup‐specific, pattern is contrary to what the substantive representation approach predicts (rejecting hypotheses 2b and 2c). While such a pattern seems counterintuitive, it reflects previous findings by Van der Meer and Hakhverdian (Reference Van der Meer and Hakhverdian2017), who found that people are more satisfied with the way democracy functions in countries that are more unequal in economic terms.
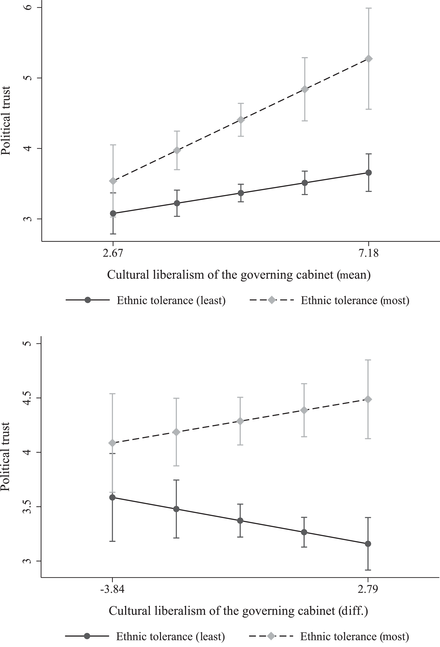
Model 4 supports the evaluation based on substantive representation approach for both the cross‐sectional and longitudinal differences in cultural liberalism of the governing cabinet. There are substantial and positive micro–macro interactions between the cultural liberalism of the governing cabinet and our individual‐level measure thereof, namely ethnic tolerance (supporting hypothesis 3a). We visualised these interaction terms in Figure 5. First, the panel for cross‐sectional differences in cultural liberalism of the governing cabinet reveals that the least ethnically tolerant report slightly, but significantly, higher levels of political trust in culturally liberal countries than in those that are culturally conservative (0.58; p = 0.023; rejecting hypothesis 3c). Second, it is the most ethnically tolerant in particular who report higher levels of political trust in culturally liberal countries than in those that are culturally conservative (1.73; p = 0.003; supporting hypothesis 3b). While the levels of political trust of both the ethnically tolerant and intolerant also differ across periods characterized by different levels of cultural liberalism of the governing cabinet, these longitudinal patterns are not statistically significant.
Predicted level of political trust for the most and least ethnically tolerant across different levels of cultural liberalism of the governing cabinet, along with the 95 per cent confidence intervals (Table 1, Model 4). In cases of cross‐sectional differences (upper panel), the level of political trust of the most ethnically tolerant is higher in the most culturally liberal countries than in the least (1.73; p = 0.003). The same applies to the least ethnically tolerant, but less so (0.58; p = 0.023). In cases of longitudinal differences (lower panel), the level of political trust of both the most and least ethnically tolerant does not differ significantly between the most and least culturally liberal contexts.

For the sake of completeness, Model 5 portrays our simultaneous inclusion of the interaction terms for evaluation based on the quality of representation and substantive representation concerning cultural issues, for which significant micro–macro interactions were identified in Models 2 and 4. These effects are maintained when modelled simultaneously (supporting hypotheses 1a and 3a). Most striking, however, and at odds with hypothesis 1b, is the fact that if the tests for the quality of representation approach control for the substantive representation approach, we no longer find that the most educated report significantly lower levels of political trust in countries with high levels of corruption than in those where the levels of corruption are low (−0.44; p = 0.292). In contrast, and supporting hypothesis 3b, the most ethnically tolerant report higher levels of political trust in countries where the governing cabinet is characterised by high levels of cultural liberalism than in those where it is characterised by low levels (1.64; p = 0.002). Model 5 thus indicates that, when modelled simultaneously, the relationship between the cultural stances of the governing cabinet and individual‐level ethnic tolerance (i.e., the substantive representation approach) is at least equally relevant for understanding political trust as the relationship between corruption and education (i.e., the conventional quality of representation approach). However, caution is, of course, required when interpreting this finding, given the complexity of this model, which includes three cross‐level interaction terms.
Robustness checks
We performed three additional analyses to test the robustness of our findings. First, we used a two‐step approach as an alternative to our multi‐level models, because assuming invariant coefficients for all our individual‐level control variables across country‐year combinations may affect the reliability of the effects of the contextual variables (cf. Heisig et al. Reference Heisig, Schaeffer and Giesecke2017). In a first step, we conducted regression analyses for each country‐year combination separately (including all the individual‐level variables) and saved the coefficient estimates for each country‐year combination of (1) education; (2) economic egalitarianism; and (3) ethnic tolerance. In a second step, we assessed how the strength of these coefficients is related to contextual differences in (1) corruption; (2) economic egalitarianism of the governing cabinet; and (3) cultural liberalism of the governing cabinet, respectively. Figures A5 to A7 in the Online Appendix plot the results and include regression lines for each ESS wave. In line with our main analyses, we find stronger positive effects of education in the least corrupt countries, as well as overall stronger positive effects of ethnic tolerance in countries where the governing cabinet is characterised by greater cultural liberalism.
Second, as the effect of education on political trust is remarkably strongly negative in Slovakia (see Figure 1), we ran additional analyses excluding this outlier (the results can be found in Table A5 in the Online Appendix). There are, however, no substantial differences to our main analyses. Nevertheless, future research could shed light on this remarkably strong negative effect of education on political trust in Slovakia.
Lastly, the ESS data were generally collected in the final months of 2006, 2010 and 2014 and in the first few months of the year that followed (i.e., 2007; 2011; 2015). It is possible that acting cabinets – and thus our cultural liberalism scores – changed in the data collection period, which for reasons of consistency were coded as in office at the end of 2006, 2010 and 2014. Table A6 in the Online Appendix contains the results of additional analyses that only included the 49 country‐year combinations for which we were able to confirm that the data from the ESS and CHES were congruent (cf. Stecker & Tausendpfund Reference Stecker and Tausendpfund2016). The only difference with our main analyses is that although Model 2 reports a significant interaction term between level of corruption and education, a closer look at the group‐specific findings indicates that the most educated no longer report a significantly lower level of political trust in countries with high levels of corruption than in countries with low levels (−0.81; p = 0.065).
Conclusion and discussion
Many studies have shown great interest in the relevance of context for understanding political trust in recent decades, with more attention paid lately to the interactions between micro‐ and macro‐level factors. In this study, we went beyond the dominant focus on the quality of representation, in which political trust follows from the evaluation of the quality of procedural and policy performance for the general public. This approach states that more‐educated citizens have a greater capacity to accurately evaluate the level of corruption of public institutions and attach more value to democratic norms. By borrowing insights from the literature on ideological (in)congruence, we developed an additional micro–macro interactive approach to political trust: evaluation based on substantive representation. Studies on ideological (in)congruence have found that citizens are more satisfied with politics when their ideological preferences are better represented. We built on these insights by interacting individual‐level ideological preferences with corresponding macro‐level measures of the economic and cultural stances of the governing cabinet (i.e., respectively, the level of economic egalitarianism and the level of cultural liberalism of the governing cabinet). This was in addition to the micro–macro interactions informed by the conventionally applied quality of representation approach. This allowed us to answer the question: how do evaluations based on the quality of representation and substantive representation shape political trust?
Our analyses first demonstrate that more‐educated citizens report higher levels of political trust in countries with lower levels of corruption than in those with higher levels. This is in line with the evaluation based on the quality of representation approach. Second, we found that culturally liberal citizens in particular report higher levels of political trust in countries where the governing cabinet is culturally liberal than in those where it is culturally conservative. This was predicted by our evaluation based on substantive representation approach. In case the quality of representation and substantive representation concerning cultural issues were modelled simultaneously, the latter even seems to outperform the former. Caution is required when interpreting this finding, as we simultaneously modelled multiple cross‐level interaction terms. Nevertheless, substantive representation on cultural issues seems at least equally relevant for understanding political trust as the quality of representation.
In terms of the broader implications of our findings, our study demonstrates that it is the culturally liberal in particular who grant or withhold trust in politics based on the level of cultural liberalism of the governing cabinet. This is in contrast to dominant ideas on the drivers of political discontent (e.g., political distrust), which have predominantly focused on nationalism and authoritarianism among the ‘losers of globalisation’ (see, e.g., Kriesi et al. Reference Kriesi, Grande, Lachat, Dolezal, Bornschier and Frey2008). Future research could employ a micro–macro interactive approach to uncover whether, contrary to dominant ideas, the ‘cosmopolitan winners of globalisation’ also drive contextual differences in political attitudes and behaviour related to political trust.
Our findings may also have implications beyond the political domain. In addition to the well‐established educational gradient in trust in politics, studies have, for instance, demonstrated education gaps in trust in judges and the judiciary (Bolton & Gardner Reference Bolton and Gardner2014; Van Elsas Reference Van Elsas2015) and scientists (Achterberg et al. Reference Achterberg, De Koster and Van der Waal2015; Gauchat Reference Gauchat2012; Noordzij et al. Reference Noordzij, Van der Waal and De Koster2019). Given the punitive views of the less educated (De Keijser et al. Reference De Keijser, Van Koppen and Elffers2007) and their low levels of environmental concern (Kvaløy et al. Reference Kvaløy, Finseraas and Listhaug2012; McCright et al. Reference McCright, Dunlap and Marquart‐Pyatt2015), our evaluation based on substantive representation approach might provide an explanation: the education gap in trust in judges and scientists may reflect the high (low) trust of those who (do not) feel culturally represented by them.
Lastly, Anderson and Guillory (Reference Anderson and Guillory1997) found that electoral losers are relatively more satisfied with democracy in consensual democracies than in majoritarian democracies, arguably because they are better represented therein (cf. Martini & Quaranta Reference Martini and Quaranta2019). A fruitful venture for studies building on both our findings and those of Anderson and Guillory (Reference Anderson and Guillory1997) would be to identify whether the political trust of electoral losers varies by the extent to which they experience ideological (in)congruence. Just as this group is more satisfied in consensual systems, we expect this to also be the case when they have a similar ideology to the government, even if they did not vote it into office.
Our study provides multiple directions for future research. One is a closer scrutiny of the relationship between shifts in stances of governing cabinets over time and political trust. Whereas culturally liberal citizens living in countries with a more culturally liberal governing cabinet report higher levels of political trust, their level of political trust does not associate with longitudinal changes in the cultural liberalism of governing cabinets in the period we studied (2006–2014). Future research could shed light on this null finding through inductive in‐depth case studies, for which countries with the most marked shifts in the cultural stances of the governing cabinet – for example, Hungary, Poland and Spain – could provide strategic cases. These studies could provide empirically grounded insights into the dynamics brought about by substantial shifts in government stances and their relevance for the political trust of different subgroups.
Future studies could, in addition, build on our study with particular regard to two limitations. First, our study leaves unanswered whether measuring ideological stances of government parties using the CHES captures discursive positions of these parties, their actions, or both. Future research could strive towards including separate measures for both aspects in order to assess the extent to which each of these matters for the impact of governments’ stances on political trust among different subgroups. Second, future studies could build on our research by assessing whether there is a causal link between substantive representation and political trust. As the pooled cross‐sectional data used for this study do not allow such causal inferences, follow‐up research using panel data or (survey) experiments would be worthwhile.
Nevertheless, for now, we feel safe in concluding that, in addition to the commonly assessed evaluation based on the quality of representation, evaluation based on substantive representation has merits when it comes to the micro–macro debate on political trust. Moreover, our findings suggest that a stronger focus on the culturally liberal seems to be warranted when it comes to understanding context differences in political trust. Such a focus might also make a valuable contribution to dominant ideas on country and period differences in all kinds of political distrust‐related discontent, as these often rely heavily on the cultural discontent attributed to the ‘losers of globalisation’.
Online Appendix
Additional supporting information may be found in the Online Appendix section at the end of the article:
Supplementary Material


 Open access